 Fushing Hsieh
 Jingyi Zheng
- Department of Statistics, University of California, Davis, Davis, CA, United States
Data-driven computational methodologies are developed to encode a system's spatiotemporal recording video into a global system-state trajectory, and extract a patterned signature that mechanistically defines recurrent events exhibited by a large complex system. Our developments begin by selecting informative units from various spatial regions, among which we compute mutual conditional entropy to map out an organization of communities. Each community is taken as a potential mechanism operating across several different regions. Unsupervised machine learning algorithms are employed on each community to identify a functional collection of local system-states, and then its corresponding local system-state trajectory is used as a mechanistic representation of the community. We further synthesize all local system-states trajectories to identify global dependency and global system-states. Such a spatiotemporal structural dependency points out which communities are main driving forces underlying the recurrent dynamics, and at the same time offers a patterned signature that prescribes a mechanics driving all recurrent events along the global system-state trajectory. We illustrate our data-driven computing through a brain-wide calcium imaging video of a PTZ-induced epileptic Zebrafish, and explicitly show the system-wise patterned signature as a mechanics that characteristically defines epileptic seizures.
1. Introduction
It is well-known that understanding a complex system, such as a brain, is among the most challenging problems attracting neuroscientists, physicists and computing-scientists alike. The challenges can be attributed to many factors. One fundamental factor is that a system unit, such as a neuron in brain, has plenty of non-linearities (see [1, 2]). Another fundamental factor is that interactions among system units are convoluted and indirect. Despite the knowledge of these two known factors in physics literature, “correlation-based dependency and synchrony” concepts, which assume linearity and direct interaction, still play instrumental roles (see [3–5]), in many neuroscience literature.
Beyond the two aforementioned factors, the most profound factor attributing toward the challenges is that system units aggregated within a physical system is eventually expected to show self-organized categorical behaviors and discrete structural patterns (see [6–8]). Under the self-organized criticality (SOC) theory, the sandpile model and scale-free distributional patterns are proposed to support or to check such extremely stimulating phenomenon (see [1]). Though such self-organized behaviors and structures might be seen as results of system units' emergent collective computational abilities, see [9], the controversies around SOC theory are still going on, far from being settled up to today (see [10]).
From data analysis perspective, it might be worthwhile not to conform to SOC concept or theory in any priori manner when exploring within a complex system. Within such explorations, a definite big issue is to be able to coherently and realistically explain and graphically display how and why do emergent self-organized patterns come about in a data-driven fashion. This big issue is closely tied to the following elementary computing problems: What are informative pattern formations leading to recurrent crucial behaviors in a complex system? Where a pattern signature that is a defining mechanics for such behaviors? Nowadays these elementary, but critical computing problems are still yet to be resolved when scientists face a huge ensemble of time series or video data.
Further a complex system typically consists of an anatomical organization of physically distinct regions, and each region is consisting of huge number of units, such as neurons, that are indistinguishable beyond their basic functional types and spatial coordinates. How these regions work in concert as a defining mechanics underlying the recurrent behavior of interest? Which networks linking which regions are the driving forces for such a mechanics? These critical computing problems by and large are also far from being settled.
In this paper, we develop computational methodologies to attempt all aforementioned computing problems. We believe that the solutions to these problems will pave an effective way for discovering the defining mechanics of self-organized recurrent behaviors in a complex system. Our developments here are fully illustrated and worked out through a real example system. This system gives rise to a data video, in which each unit gives rise to one time series of measurements.
Within such a video data, these unit-based time series are apparently related spatially as well as temporally. The spatial relatedness is to be represented by network of unit-nodes on local scale and network of network-nodes on global scale. Correspondingly temporal relatedness has two scales: local and global system-states pertaining to each local network and the global one. These spatiotemporal relatedness certainly will complicate computational issues facing any complex system scientist. The theme of our data-driven computing developments can be described as follows: first, discover all relevant local-networks and their specific system-states; secondly, synthesize local networks into a global one, and extract a collection of global system-states; thirdly, infer a patterned-dependency structure among global system-stated; and finally, upon the global system-state trajectory, we discover an universal pattern signature across all inter-event periods of all recurrent behaviors.
2. Materials and Methods
2.1. About an Illustrative Example
Recently a new technique is added to these brain researchers' repertoire. Calcium imaging is a newly revolutionized brain-wide imaging technique. This new technique is designed to reveal whole brain's 2D or even 3D spatial patterns along the temporal axis. Its key feature is its high sampling rate. This feature seems to make the possibility of bringing out authentic dynamics of brain activities across different brain regions more realistic than ever before. That is, such a feature of calcium imaging indeed separates it from functional Magnetic Resonance Imaging (fMRI) and other brain imaging technologies.
In a brain-wide calcium imaging data video, a pixel is the system unit under study, not neuron. Since a pixel within a 256 × 256 image likely includes several neurons. With such a large ensemble of pixel specific time series, our major goal here is to attempt data-driven algorithmic computing to directly and explicitly reveal the emergent pattern formations leading to epileptic seizure events based on brain-wide calcium imaging videos derived from epileptic drug, PTZ, stimulated Zebrafishes. Such discoveries of emergent dynamics are especially aiming for more and better understanding on mechanisms underlying seizure and epilepsy. Epilepsy is known as a disorder with various crucially altered neuronal interactions (see [11, 12] and a review paper by [13]).
We reemphasize that our data-driven computing doesn't incorporate such concepts of correlation-based dependency and synchrony. First reason is the aforementioned non-linearity in relationships among pixels. The second reason is that the waveform of calcium intensity is acyclic. Its troughs tend to be short and scattering, while its peaks tend to be high and aggregating. The third reason is to retain the capability of making graphic displays for all computed pattern formations.
2.2. Zebrafish's Brain-Wide Calcium Imaging Video
In Penfield and Jasper [11]: “Seizures are an extreme form of synchronous brain activity, characterized by decreased inhibition and enhanced excitation, leading to a transition condition of intense, hyper-synchronous neuronal activity.” This characterization on the global scale of seizure involves with three types of dynamic functional mechanisms: inhibition, excitation and the induced-collective behavior of decreased inhibition and enhanced excitation.
To be precise the last mechanism leading to the unbalanced-fixation of seizure or epileptic event is what we try to understand via computational pattern-formations. It is an evolving process, not simply just a phenomenon of “hyper-synchrony” at one point in time. Further exact markers of inhibitory or excitatory mechanisms are not included in calcium imaging video data used in this paper because of the resolution is not fine enough to mark individual neurons. Therefore a pixel identified within imaging video is better seen as a small group of neurons. So it can bear with neither inhibitory, nor excitatory identities. Nonetheless we pursue the crucial task of identifying informative pixels that collectively have the capability of revealing patterns being relevant to mechanistic processing of “decreased inhibition and enhanced excitation.”
What kinds of pixels are potentially relevant to such mechanistic characteristics of seizure? An illustrative Zebrafish's brain-wide calcium imaging video used exclusively throughout this paper is consisting of 2,000 films with 256 × 256 resolutions. So there are 2562 = 216(> 64K) pixels involving. To address this question of informative pixel, it is reasonable to intuitively postulate that the characteristic mechanisms of seizure should be manifested through large up-and-down fluctuations of calcium intensity time series, particularly during all inter-ictal periods, that are, between two consecutive epileptic events.
It is evident that all pixels inside a fish body, but outside of fish's brain have rather small fluctuations in their calcium intensity time series in all inter-ictal periods. So they are not relevant to the characteristic mechanism of seizure. Thus relevant informative pixels are located within the two-halves of five brain regions: forebrain, neuropil, SPV, cerebrum, and medulla, as marked in the Figure 1. Pixels belonging to the five brain regions indeed have heterogeneous calcium intensity waveforms are within inter-ictal periods, while they all coherently peak at the epileptic event-periods like pixels located outside of brain regions. Such a property of having concurrent pikes right on epileptic events provides a simple and reliable segmentation of inter-ictal against ictal periods. Five inter-ictal periods are identified on this illustrative fish's video data.
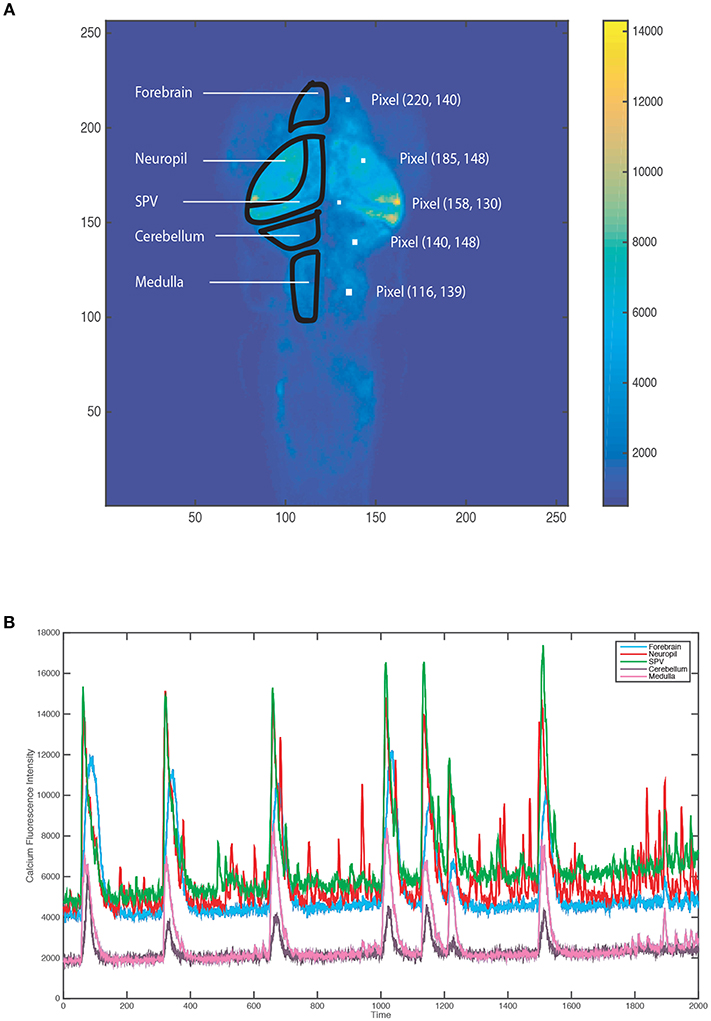
Figure 1. Zebrafish marked with five brain regions and color-coded observed pixel values (as being indicated in the color-bar) (A) and five examples of regional calcium intensity time series (B).
Upon each identified inter-ictal period, each pixel-specific calcium intensity time series gives rise to a variance value. Based on such an inter-ictal variance value, two pixel-selection schemes are implemented as follows.
We organize all computational steps for informative pixels and pixels-communities identifications into an algorithm:
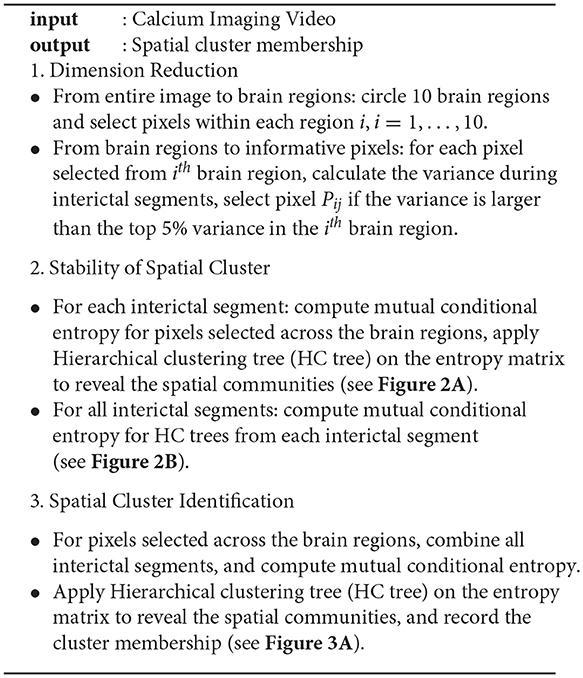
Algorithm 1: Spatial Cluster Identification.
2.3. Computing Protocol
Our computing protocol is proposed as follows. Our computations begin with performing two separate digital coding schemes: one fine-scale and one coarse-scale, on each unit-based time series. The fine-scale digital coding scheme, which is based on their own possibly-gapped histograms developed in Fushing and Roy [14]. This categorization on continuous variable enables the evaluations of mutual conditional entropy, which is a basic concept in combinatorial information theory, among all selected informative units. The resultant entropy matrix is taken as a distance matrix in an unsupervised machine learning algorithm to bring out locally non-linear dependency structures, or so-called synergism. Each cluster of units, also called a synergistic unit-group, spatially becomes a local-network, which would have its member units belonging to several distinct regions.
The coarse-scale coding scheme applied on each unit-specific time series is designed to preserve only time series' signature features, such as its peaks and troughs, which are used as surrogates for categorical functions exhibited by the unit. Therefore each time series is transformed into a digital sequence along the temporal axis. So all digital sequences belonging to a synergistic unit-group is then represented by a digital matrix. Upon such a digital matrix, a computational paradigm developed in Fushing and Chen [15] and Fushing et al. [16], called Data Mechanics, is applied to layout and reveal visible emergent temporal clusters to be taken as local system-states.
Therefore each local network will give rise to a trajectory of local system-states. As each local system-state reflects its own functional type, so it is assigned with a proper digital code. Under this coding scheme, a local system-state trajectory becomes a digital code sequence along the temporal axis. By stacking all local networks' digital code sequences, we have a matrix of local system-states, which is the platform for synthesizing all these relevant local-network into a global one.
The computing for such a global network is performed through Data Mechanics, which primarily builds and superimposes two clustering trees onto a digital matrix. The two trees frame the matrix lattice into multi-scale block patterns, which are collectively represented as a heatmap. The clustering tree on the axis of local-network gives rise to a global network, while the clustering tree on the temporal-axis particularly marks and defines the global system-states. Beyond the two clustering trees, the block patterns contained in the heatmap indeed reveal the critical global dependency among all local networks. This patterned dependency will shed lights on which local networks are indeed driving forces as being responsible for the critical recurrent behaviors in the complex system.
Then, by recovering the temporal coordinates, we explicitly see the patterned dynamic process of global system-states leading to each recurrent event. By color-encoding these global system-states according to their functions, emergent patterned system-wise signatures are likely and naturally to emerge and to be seen throughout all inter-event segments. This is the theme for a patterned system-wise signature to become a defining mechanics that is capable of prescribing a complex system's self-organized recurrent behaviors.
2.4. Where Are Informative Pixels?
2.4.1. Scheme#1: Regional Screening
A MatLab program is used to draw the boundaries of the five brain regions, and each marked region is separated into two halves as well. Pixels within each of the 10 half-regions are selected if their average inter-ictal variances are larger than their region-specific top 5%-percentile. There are total 685 pixels selected.
2.4.2. Scheme#2: Global Filtering
A variance threshold, say Vo, is established by taking the average of inter-ictal variances belonging to a small group of unselected pixels within the medulla region. Pixels are progressively selected if its averaged inter-ictal variance is larger than k × Vo with k = 1, 2, .., 10. When k = 1, selected pixels are found in all 10 regions, but when 2 < k < 5, selected pixels are only seen in SPV and neuropil, that is, in so called optical tectum. When k ≥ 5, all selected pixels are all in neuropil. There are 696 pixels selected with k = 10. This selection is seemingly to counter the known fact that SPV, which is primarily consisting of optical neurons, is originally thought of as the most important region linking to epileptic events.
2.5. What Are Information Contents?
Any aforementioned pixel-selection scheme is a pre-processing step for denoising before applying any Machine Learning algorithm. One more pre-processing step is needed after selecting an ensemble of pixels because that there might be various local-networks involving in such an ensemble. That is, such an ensemble of selected pixels surely is consisting of distinct groups of pixels. Within each local-network, pixels are more associated than pixel-pairs belonging to two distinct local-networks. So pixels sharing the same local-network are called being synergistic to each other. It is essential to note that a pair of synergistic pixels could be highly associated in a non-linear fashion, but not necessary being in synchrony.
To bring out these synergistic groups of pixels, we apply mutual conditional entropy from Combinatorial Information Theory (see [17]) to measure the degree of synergistic association between two pixels' calcium intensity time series. Basically in order to compute mutual conditional entropy, one possibly-gapped histogram (see [14]) is derived for each of the two time series, excluding their ictal periods. Such a histogram provides a fine-scale digital coding on all time points within all inter-ictal periods. That is, each time point within inter-ictal periods is coded with a bivariate code. A contingency table containing all counts of distinct bivariate codes is the most natural way of revealing the dependency of the bivariate code-variable. It is also a visualization of dependency of between the two original time series. To numerically evaluate the dependency upon a contingency table, the mutual conditional entropy in combinatorial information theory is one natural measure. This measure is a sum of rescaled Shannon entropies from row- and column-aspects. It is asymmetric.
By calculating mutual conditional entropies among all pairs of pixels' digitalized time series, a mutual conditional entropy matrix is resulted. This matrix is then taken as a distance matrix for Hierarchical clustering (HC) algorithm. The resultant HC tree becomes a platform for mapping out all mechanism-distinct synergistic pixel-groups, within which all mutual conditional entropies are relatively uniformly small. A synergistic pixel-group would be a spatial network community. This is how distinct local-networks are identified. It is evident that each local-network might be crossing several boundaries of distinct brain regions.
To compute pattern information from a local-network of synergistic pixels, we apply a triplet coding scheme based on each involving pixel's histogram derived from inter-ictal periods: (1) code-1 for intensity values below the low-5% percentile; (2) code-3 for intensity values beyond the upper-5% percentile; (3) code-2 for intensity values falling between the two percentiles. The code-1 and code-3 of this triplet coding are designed to capture primary troughs and peaks of the calcium intensity time series during the inter-ictal periods. From functional perspective, they are surrogates for inhibition and excitation. Then a code-10 is assigned to all time points within the ictal event periods. Hence a pixel's calcium intensity time series is transformed into a 4-digit code series.
By stacking all pixel's 4-digit code vectors along a row-axis, we construct a 4-digit code-matrix. This code-matrix makes possible to capture the collective up-and-down patterns. The pattern information contained in such a code-matrix would be sought by applying a newly developed unsupervised learning paradigm, called Data Mechanics developed in Fushing and Chen [15] and Fushing et al. [16], to iteratively build a HC-tree and superimpose it onto row-axis and another HC-tree onto column(temporal)-axis.
The resultant HC-tree on row axis gives rise to clusters of pixels, which are somehow sharing similar up-and-down patterns of original calcium intensity time series. On the other hand, a tree level of the resultant HC-tree on column-axis would give rise to a clustering composition on the temporal-axis. Each cluster will define a local system-state. Hence a local system-state trajectory is obtained by recovering each local system-state's original temporal order.
Together these two coupled HC-trees in fact frame a multi-scale block patterns on the code-matrix lattice. This is one version of systemic dependency among clusters within a local-network of synergistic pixels and a series of system states. So, when such local-systemic dependency is displayed in a fashion of a local-system-state trajectory, it might be expected to reveal pattern-formations leading to each every epileptic events. Such information contents also allow us to address whether all local-network of synergistic pixel offer very distinct or similar “stories” about the complex system under study.
We organize all aforementioned computational steps for extracting and identifying local and global system-state trajectories into an algorithm:
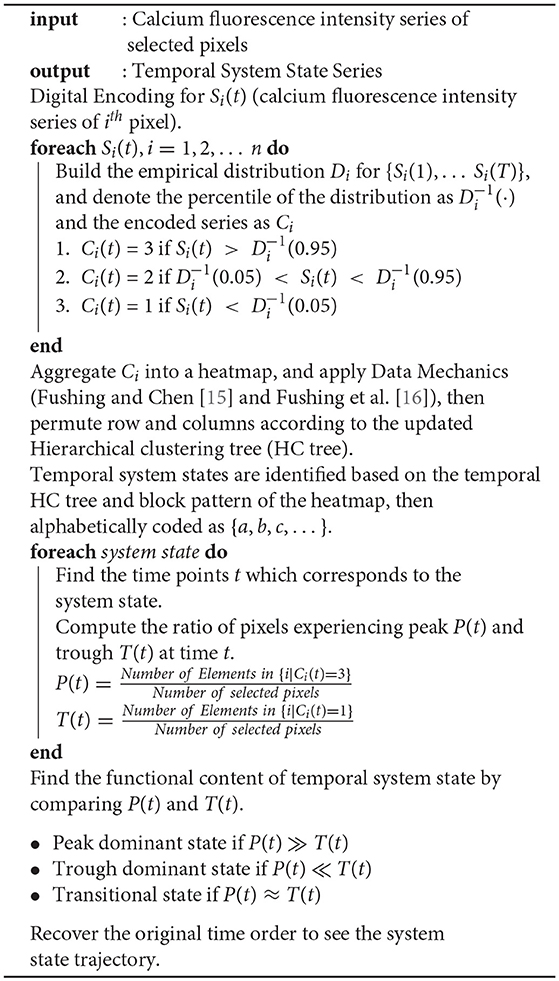
Algorithm 2: Temporal System State Trajectory.
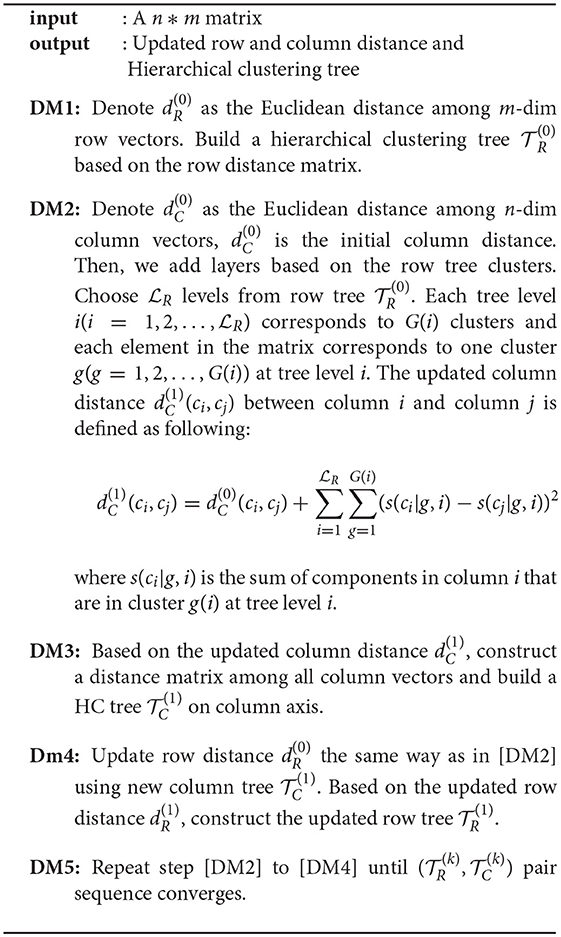
Algorithm 3: Data Mechanics Algorithm.
3. Results
In this section we report our computational results from explorations on computed pattern formations in local and global scales.
3.1. Stability of Spatial-Communities Across Inter-ictal Periods
Each inter-ictal period gives rise to one symmetric 685 × 685 mutual conditional entropy matrix. This entropy matrix is taken as a distance matrix in the hierarchical clustering computations for a HC-tree. By superimposing this HC-tree on the row- and column-axes of this symmetric matrix, a series of blocks are evidently seen and displayed along the diagonal, as shown in Figure 2A for first inter-ictal period. Each block corresponds to pixels-clusters found on the HC-Tree. That is, pixels sharing the same cluster have relative low entropy-values, so are highly synergistic. They together form a spatial community as a local-network.
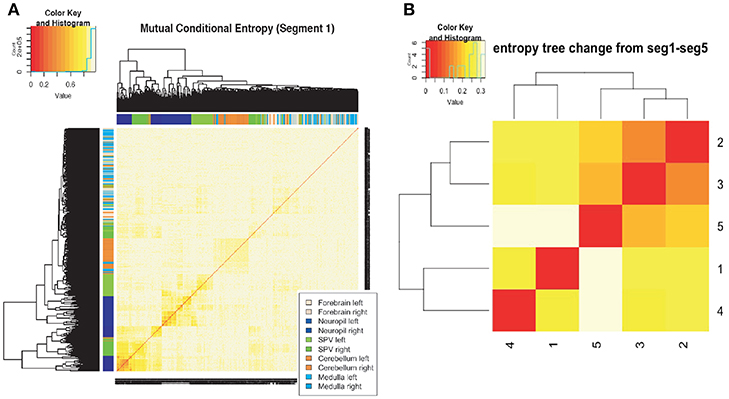
Figure 2. Stability of spatial communities: (A) spatial communities identifies via blocks of mutual conditional entropy matrix on 685 pixels in the first inter-ictal period; (B) Low mutual conditional entropies among community memberships across all five inter-ictal periods.
Such a pattern formation of a series of communities is also seen throughout the rest of four inter-ictal periods. Are memberships of these communities or local-networks stable across the five inter-ictal periods? To address this issue, we calculate the mutual conditional-entropy among five clustering compositions, each of which respectively corresponds to one 7-cluster tree-level of one computed HC-tree, pertaining to five inter-ictal periods. That is, each HC-tree renders one categorical variable with 7 categories in each inter-ictal period (see [17]).
The resultant 5 × 5 matrix superimposed with a HC-tree, as shown in Figure 2B, indicates two important and interesting phenomena. First, all values of mutual conditional-entropies are rather low. This result says that memberships of all local-networks are rather stable across all inter-ictal periods. This is one important spatial-dynamic signature. So, from functional perspective, majority of pixels behave in a stable and collective manner. Secondly, the HC-tree upon the 5 × 5 matrix indicates the presence of two clusters of inter-ictal periods: {1, 4} and {2, 3, 5}. Such a clustering composition indicates that, if a pair of synergistic pixels relationship breaks in one inter-ictal period, then it likely regains their high associative relations back in the next inter-ictal period.
With the confirmed stability of spatial communities across the serial inter-ictal periods in Figure 2, it becomes reasonable to pool data from all five inter-ictal periods together in order to map out these involving local-networks. Based on the pooled data, we carry out likewise evaluations of all pairs' mutual conditional entropies among the 685 pixels. The resultant 685 × 685 mutual conditional-entropy matrix is constructed and superimposed with a HC-tree, as shown in Figure 3A. There are 7 evident blocks along the diagonal of the matrix uniformly having relative low mutual conditional-entropies. With respect to the color-coding of brain regions attached to each cluster, we see that some clusters consist of pixels exclusively belonging to neuropil, some belonging to neuropil and SPV, and some belonging to all five brain regions. We denote the 696 pixels exclusively in neuropil selected via Scheme #2 to be the 8th local-network. These 8 local-networks are expected to reveal various degrees of functional differences.
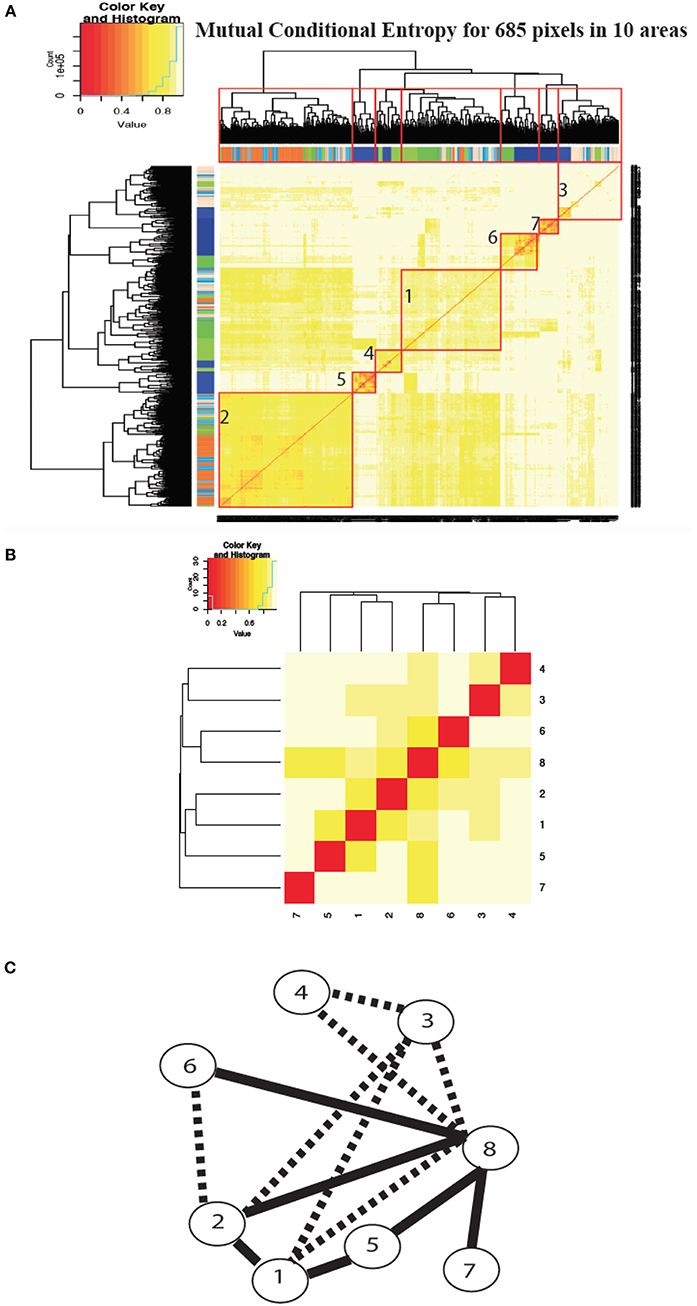
Figure 3. Spatial communities among 685 pixels selected from five brain regions: (A) identification of 7 communities; (B) mutual conditional entropies matrix of 7 collections of community-specific system states; (C) network representation of temporal-connectivity among the 7 communities (the solid linkages have mutual entropies being < 0.7 for indicating high associations, while dotted linkages have mutual entropies more than 0.7 for indicating low associations).
3.2. The Temporal Pattern-Mechanics Toward Epileptic Seizure
Such heterogeneous compositions of brain regions within some local-network very naturally induces an important question: Do some or all these 8 local-networks conserve certain tempo-patterned signatures that are relevant to recurrence of epileptic seizure? We first explore the tempo-patterned signatures toward epileptic seizure on the 8th local-network in details. Other local-network can be likewise explored.
The potential tempo-patterned signatures toward epileptic seizure are explored and illustrated based on the 4-digital coded 696 × 2, 000 matrix. Data Mechanics' iterative computations are performed and resulted into two HC-trees: on column (temporal) axis and on row (spatial) axis, as shown in Figure 4A. For pictorial clarity, the cluster marking epileptic event periods being excluded from the panel. Upon the tree , 16 clusters of time-points on the temporal axis are identified and alphabetically coded with code-words {a, b, c, d, e, f, g, h, i, , ….p, q}. Here code word a is used for the cluster of epileptic event periods. So there are 17 local-system states found in the 8th local network. It is reiterated that a local system state stands for a common feature shared by of all time points within a cluster via having similar 696 dimensional vectors. These within-in-cluster features are distinct among different local system states with various degrees of differences.
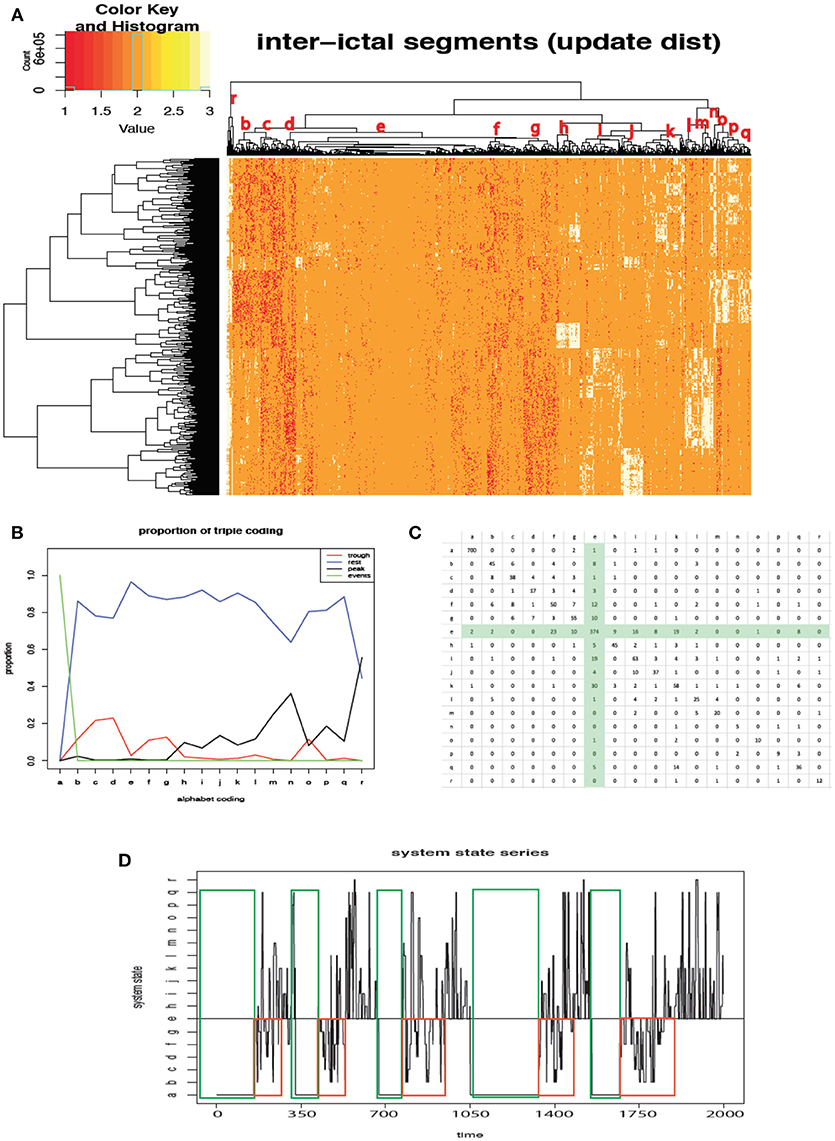
Figure 4. System state identification and trajectory: (A) identification of system states resulted from Data Mechanics computations; (B) functional markers of system states; (C) transition probability matrix; (D) seizure-bearing patterns of system state trajectory across all five inter-ictal periods.
From functional aspect, as shown in Figure 4B, the local-system states encoded with alphabet codes {b, c, d, f, g} are seen to have trough-count being larger than peak-count, while the local-system states encoded with alphabets coded {h, i, , ….p, q} are seen to have trough-count being smaller than the peak-count are. One distinct cluster having low values on both trough- and peak-counts is coded e. This e state is likely the so called “transition state”, which is like a “bridge” connecting two functional distinct states.
It is critical to note that, when memberships of each cluster are recovered according to their original temporal coordinates, then an evolution of local-system states are revealed. Consequently the transition counts are represented in a matrix, as shown in Figure 4C. It is evident that the e-cluster play a critical role of transition, that is, trough-dominant states rarely go directly to peak-dominant states, but they likely go through the transition-state e, and then into trough-dominant states. Likewise peak-dominant states rarely go directly to trough-dominant states, but they go to transition-state e and back to peak-dominant states.
Most importantly, the entire local-system state trajectory, as shown in Figure 4D, reveal one critical coding pattern-switch from trough-dominant local-system states going through transition-stated e to peak-dominant local-system states within each of the five successive inter-ictal periods. Thus, the evolution of local-system states together with such a patterned-switch constitute and define the local-system's temporal pattern-mechanics toward epileptic seizure. It is worth mentioning that this temporal pattern-mechanics pertaining to the 8th local network is potentially and functionally a reliable EWS.
3.3. Network Linkages Among the 8 Local-Networks
Next we investigate whether the temporal pattern-mechanics discovered within the 8th local-network is also seen in any of the 7 communities or not? We repeat the whole set of DM computations on each of the 7 local-networks: No. 1 through No.7. A HC-tree is likewise superimposed onto the column (temporal)-axis of the heatmap and their system states are similarly defined.
Upon these 8 tempo-HC-trees and corresponding 8 clustering compositions, which are respectively used in identifying their local-system states, we compute the 8 × 8 mutual conditional entropy matrix, as shown in Figure 3B. Correspondingly a network upon 8 nodes of local-networks is built by thresholding the entropy values is derived and shown Figure 3C. Here such a linkage between two nodes within the network is explained as that two time-points sharing one local system-state of one local-network is likely to have high probability of sharing one local system-state via the other local-network. These two system-states might not necessary being coherent in terms of trough- or peak-prevalent. As would be seen below, the coherent linkages are that between local-networks {No. 5, No. 6, No. 7} and No. 8. This is naturally expected because they consist of pixels exclusively from neuropil. The relatively incoherent linkages are seen between {No. 1, No. 2} and No. 8. This network indicates that the 8th local-network's pattern-mechanics might not share with local-networks {No. 1, No. 2}.
3.4. Global Pattern-Mechanics Toward Recurrent Epileptic Events
The final phase of analysis is to synthesize the above 8 local system-state trajectories into one brain-wide global system-state trajectory. Such a global system-state trajectory is expected to give rise to an evident structured pattern-formation leading toward an epileptic event within an inter-ictal period. The synthesis is proposed and proceeded as follows. Each local system-state trajectory is converted into 4-digit time series: (1) code-10 (color-coded Bright-Red) for epileptic event; (2) code-1 (color-coded Red) for Trough dominant system state; (3) code-2 (color-coded Yellow) for transitional state ; and (4) code-3 (color-coded White) for Peak dominant state. We apply the Data Mechanics on this 8 × 2, 000 4-digit code matrix and result into a heatmap with two HC trees superimposed upon its row and column axes, as shown in Figure 5A. This heatmap brings out the patterned system-wise dependency among the 8 local system-state trajectories.
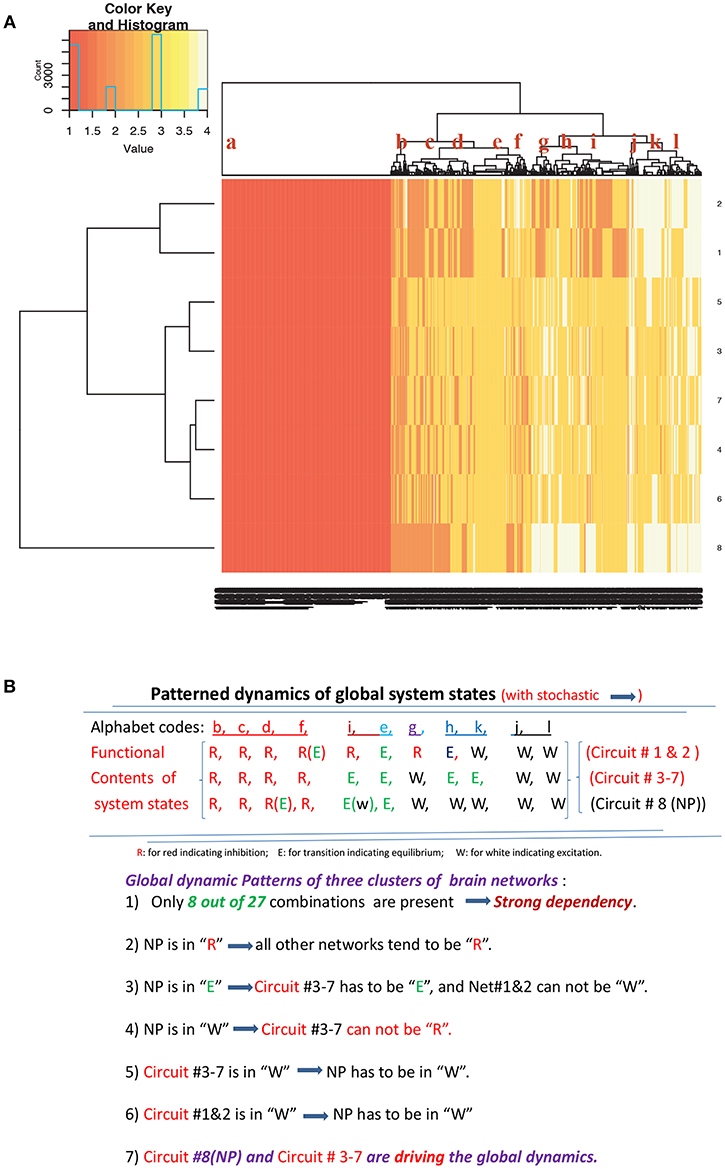
Figure 5. Global patterned-dependency: (A) identification of global system-states upon the 8 communities (the 8th one the 696 pixels from neuropil); (B) summary of functional dependency among 8 communities and its driving force of the 8th community.
Such a patterned system-wise dependency with large scale structures is discovered, summarized and reported in Figure 5B. Based on such large scale structures, we conclude that the No. 8 local-network of 696 pixels from neuropil indeed to a great extent drives the whole global dynamics leading to recurrent epileptic events across all the five inter-ictal periods.
For extracting the fine scale structures constituting such patterned system-wise dependency among these 8 local-networks, we select a tree-level with 12 temporal clusters as 12 global-system-state upon the tree superimposed on the column (temporal) axis of heatmap in Figure 5A. These 12 clusters are encoded with alphabetic-codes: {a, b, …., l}, from the left to the right. The Red-underlined code-words {b, c, d} are to functionally indicate these global-system-states having trough-dominance. So they are taken as having inhibitory-functional tendency.
To further reveal our discovery on system-wise pattern-mechanics toward epileptic event, we recover each global state's temporal coordinate. The five segments of global system-state trajectory pertaining to the five inter-ictal period are given Figure 6. The most evident system-wise signature we found is that red-underlined consecutive codes with length four or more disappear after the middle point of inter-ictal period. Even triplet, pair or single red-underline code become very sparse in the 2nd half of the inter-ictal period. Such a system-wise pattern-mechanics is robustly observed throughout all five inter-ictal periods. Therefore, we conclude such a discovered signature as an early warning signal to an incoming epileptic event. This system-wise pattern-mechanics is coherent to the pattern-formation found exclusively based on the No. 8 local-network as reported in Figure 4D. Such fine scale structures once again confirm that neuropil in this illustrative fish' optical tectum indeed play a significant role in leading to each epileptic event. This finding on neuropil is rather relatively new and potentially significant in neuroscience related to epileptic dynamics.
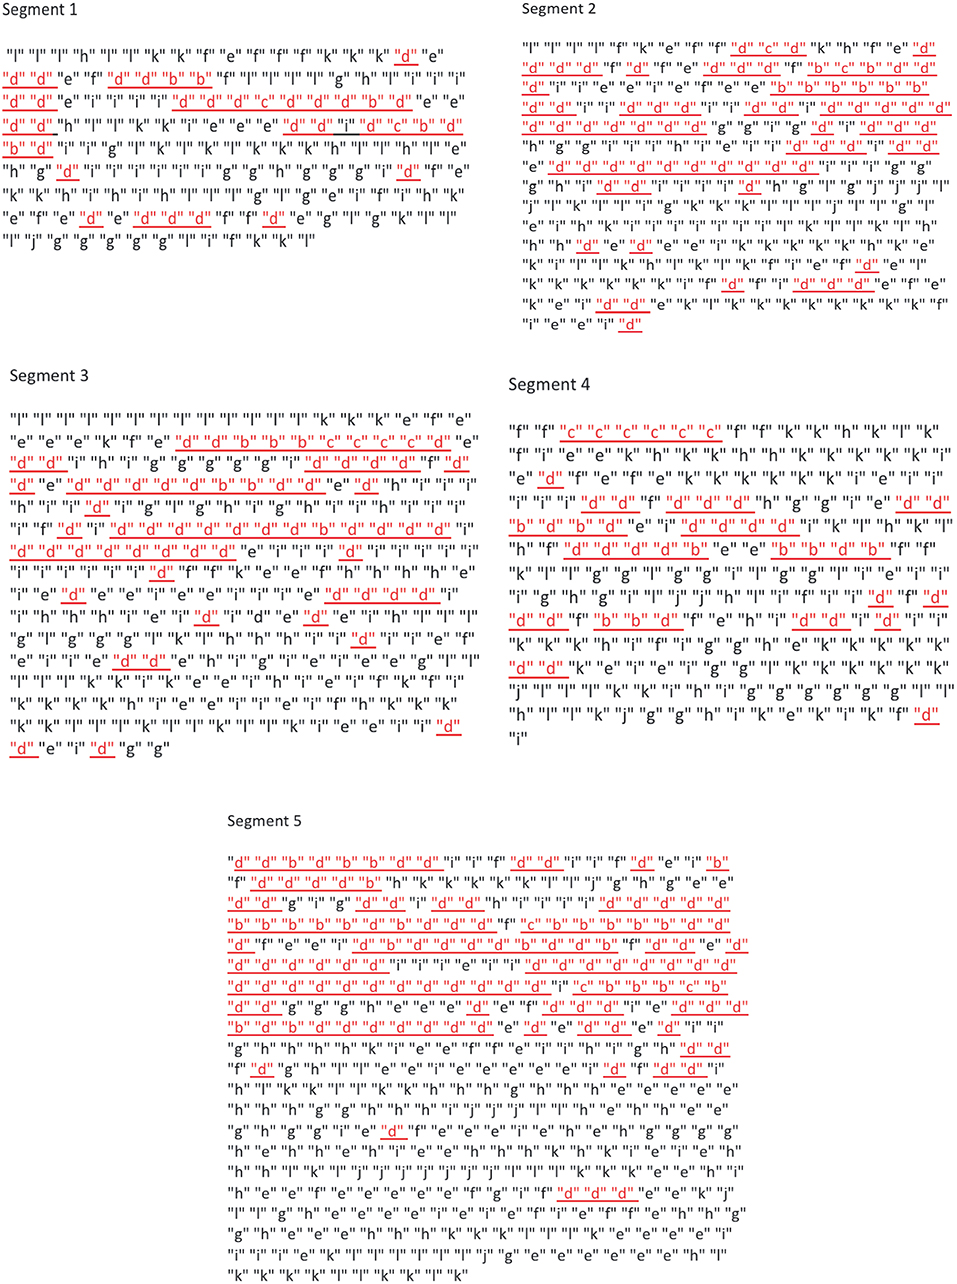
Figure 6. Pattern-mechanics: seizure-bearing patterns through global system state trajectory within each five inter-ictal periods. Red color-coded and underlined global system states for inhibition and black color-coded global system states for excitations.
4. Discussion
As shown in Figure 6, our computed system-wise signature that is universally seen in all five inter-ictal periods clearly provides a precise description of global interacting dynamics between inhibition and excitation functions leading to an epileptic event. This brand new description in fact is not only informative, but also realistic and reliable. Thus, we personally believe that our data-driven computing for wax and wane patterns of trough-dominance and peak-dominance in the brain-wide calcium imaging video data from the illustrative PTZ-treated Zebrafish is indeed applicable in many complex system studies beyond neuroscience. Since our computational methodologies achieve one generic goal: compressing the whole ensemble of time series by digital coding to discover dynamic patterns of system-wise dependency among many involving mechanisms without being compromised by unrealistic modeling assumptions or structures.
Among our computational methodologies, the combinatorial information theory based computations, including various digital coding schemes and mutual conditional-entropy for potentially non-linear synergistic associations, involve rather elementary counting operations. While our Data mechanics algorithms builds unsupervised hierarchical clustering (HC)-trees for identifying system states on digital-coded data and pixel-communities on mutual conditional-entropy matrices involving only simply permutations operations. Our digital coding schemes and Data mechanics algorithms employed here are rather simple. They seemingly cut off many detailed pieces of information. However, it is worth emphasizing that the key underlying this digital coding is to make the major information contents like children's Lego blocks, so that they can possibly and likely aggregate in a collective fashion. This is how global dependency could possibly be discovered.
Through the brain-wide calcium imaging video data, our computations successfully reveal the realistic and visible information contents of all involving mechanisms via pixel-communities and their idiosyncratic system state trajectories. We then synthesize all mechanism-specific information contents into system-wise spatial × temporal dependency dynamics, which is represented by explainable displays of recurrent global system state trajectories leading to each epileptic event.
At the end we particularly remark that our mutual conditional-entropy is shown as a more reliable non-linear measurement of association of a pair of time series than the linearity based correlation. It is also asymmetric. Directed associations between two time series or even two variables are needs. Further it works universally for all data types: continuous, discrete and categorical. Commonly used correlation is a symmetric measurement and only works for continuous data. The most restrict aspect correlation is its meaning. It is recalled that a correlation is meaningful when the bivariate normality assumption holds. In reality, such assumption is not likely true because two pixels' calcium intensity time series could have rather distinct waveforms, which affect each other in a non-linear manner. Thus, a broader form of dependency is required here in order to accommodate diverse mechanisms involved within brains.
Author Contributions
FH designed the study. JZ preprocessing video data for analysis. FH and JZ analyzed the data. FH and JZ interpreted the results and wrote the manuscript. Both authors gave final approval for publication.
Conflict of Interest Statement
The authors declare that the research was conducted in the absence of any commercial or financial relationships that could be construed as a potential conflict of interest.
Acknowledgments
We thank Prof. Scott Baraban in UCSF for the Zebrafish's brain-wide calcium imaging video data.
References
1. Bak P, Paczuski M. Complexity, contingency, and criticality. Proc Natl Acad Sci USA. (1995) 92:6689–96.
3. Salinas E, Sejnowski TJ. Correlated neuronal activity and the flow of neural information. Nat Rev Neurosci. (2001) 2:539–50. doi: 10.1038/35086012
4. Schiff SJ, So P, Chang T, Burke RE, Sauer T. Detecting dynamical interdependence and generalized synchrony through mutual prediction in a neural ensemble. Phys Rev E. (1996) 54:6708–24.
5. Li X, Cui D, Jiruska P, Fox JE, Yao X, Jefferys JG. Synchronization measurement of multiple neuronal populations. J Neurophysiol. (2007) 98:3341–8. doi: 10.1152/jn.00977.2007
7. Bak P, Tang C, Wiesenfeld K. Self-organized criticality: an explanation of the 1/f noise. Phys Rev Lett. (1987) 59:381.
8. Bak P. How Nature Works. Oxford, UK: Oxford University Press (1997). doi: 10.1007/978-1-4757-5426-1
9. Hopfield JJ. Neural networks and physical systems with emergent collective computational capabilities. Proc Natl Acad Sci USA. (1982) 79:2554–8.
10. Watkins NW, Pruessner G, Chapman SC, Crosby NB, Jensen HJ. 25 years of self-organized criticality: concepts and controversies. Space Sci Rev. (2016) 198:3–44. doi: 10.1007/s11214-015-0155-x
11. Penfield W, Jasper H. Epilepsy and the Functional Anatomy of the Human Brain. Boston, MA: Little Brown (1954).
12. Westbrook GL. Seizures and epilepsy. In: Kandel ER, Jessel TM, Schwartz JH, editors. Principles of Neural Science. New York, NY: McGraw-Hill (1991). p. 1116–39.
13. Jiruska P, de Curtis M, Jefferys JR, Schevon CA, Schiff SJ, Schindler K. Synchronization and desynchronization in epilepsy: controversies and hypotheses. J Physiol. (2013) 591:787–97. doi: 10.1113/jphysiol.2012.239590
14. Fushing H, Roy T. Complexity of possibly-gapped histogram and analysis of histogram (ANOHT). J R Soc Open Sci. (2018) 5:171026. doi: 10.1098/rsos.171026
15. Fushing H, Chen C. Data mechanics and coupling geometry on binary bipartite network. PLoS ONE. (2014) 9:e106154. doi: 10.1371/journal.pone.0106154
16. Fushing H, Hsueh CH, Heitkamp C, Matthews M, Koehl P. Unravelling the geometry of data matrices: effects of water stress regimes on winemaking. J R Soc Interface. (2015) 12:20150753. doi: 10.1098/rsif.2015.0753
Keywords: data-driven computing, spatiotemporal recording, unsupervised machine learning algorithms, global system-state, spatiotemporal structural dependency
Citation: Hsieh F and Zheng J (2019) Unraveling Pattern-Based Mechanics Defining Self-Organized Recurrent Behaviors in a Complex System: A Zebrafish's Calcium Brain-Wide Imaging Example Front. Appl. Math. Stat. 5:13. doi: 10.3389/fams.2019.00013
Received: 02 October 2018; Accepted: 08 February 2019;
Published: 04 March 2019.
Edited by:
Sergei Pereverzyev, Johann Radon Institute for Computational and Applied Mathematics (RICAM), AustriaReviewed by:
Qi Ye, South China Normal University, ChinaSivananthan Sampath, Indian Institutes of Technology (IIT), India
Abhishake Rastogi, Universität Potsdam, Germany
Copyright © 2019 Hsieh and Zheng. This is an open-access article distributed under the terms of the Creative Commons Attribution License (CC BY). The use, distribution or reproduction in other forums is permitted, provided the original author(s) and the copyright owner(s) are credited and that the original publication in this journal is cited, in accordance with accepted academic practice. No use, distribution or reproduction is permitted which does not comply with these terms.
*Correspondence: Fushing Hsieh, ZmhzaWVoQHVjZGF2aXMuZWR1