 Weihao Ge
 Zeeshan Fazal
 Eric Jakobsson
- 1Beckman Institute for Advanced Science and Technology, University of Illinois at Urbana-Champaign, Urbana, IL, United States
- 2Center for Biophysics and Computational Biology, University of Illinois at Urbana-Champaign, Urbana, IL, United States
- 3Department of Biosciences, COMSATS Institute of Information Technology, Islamabad, Pakistan
- 4Department of Animal Sciences, University of Illinois at Urbana-Champaign, Urbana, IL, United States
- 5Carl R. Woese Institute for Genomic Biology, University of Illinois at Urbana-Champaign, Urbana, IL, United States
- 6Neuroscience Program, Universityof Illinois at Urbana-Champaign, Urbana, IL, United States
- 7National Center for Supercomputing Applications, University of Illinois at Urbana-Champaign, Urbana, IL, United States
- 8Department of Molecular and Integrative Physiology, University of Illinois at Urbana-Champaign, Urbana, IL, United States
Background: A central question in bioinformatics is how to minimize arbitrariness and bias in analysis of patterns of enrichment in data. A prime example of such a question is enrichment of gene ontology (GO) classes in lists of genes. Our paper deals with two issues within this larger question. One is how to calculate the false discovery rate (FDR) within a set of apparently enriched ontologies, and the second how to set that FDR within the context of assessing significance for addressing biological questions, to answer these questions we compare a random resampling method with a commonly used method for assessing FDR, the Benjamini-Hochberg (BH) method. We further develop a heuristic method for evaluating Type II (false negative) errors to enable utilization of F-Measure binary classification theory for distinguishing “significant” from “non-significant” degrees of enrichment.
Results: The results show the preferability and feasibility of random resampling assessment of FDR over the analytical methods with which we compare it. They also show that the reasonableness of any arbitrary threshold depends strongly on the structure of the dataset being tested, suggesting that the less arbitrary method of F-measure optimization to determine significance threshold is preferable.
Conclusion: Therefore, we suggest using F-measure optimization instead of placing an arbitrary threshold to evaluate the significance of Gene Ontology Enrichment results, and using resampling to replace analytical methods
Background
Gene Ontology (GO) enrichment analysis is a powerful tool to interpret the biological implications of selected groups of genes. The gene lists from experiments such as microarrays, are gathered into clusters associated with biological attributes, and defined as GO terms [1]. The GO terms are arranged in an acyclic tree structure from more specific to more general descriptions, including biological process (BP), cellular component (CC), and molecular function (MF). GO aspires to create a formal naming system to define the biologically significant attributes of genes across all organisms. Each enriched GO term derived from a list of genes is evaluated by its significance level, i.e., the probability that the measured enrichment would be matched or exceeded by pure chance.
Enrichment tools have been developed to process large gene lists with the goal of inferring significantly enriched ontologies. Huang et.al summarizes the tools widely used for GO enrichment [2], describing the different tools emphasized by different tools. Gorilla [3], David [4], and g:profiler [5] are web interfaces that integrate functional annotations including GO annotations, disease and pathway databases etc. Blast2GO [6] extends annotation of gene list to non-model organisms by sequence similarity. GO-Miner [7], Babelomics [8], FatiGO [9], GSEA [10, 11], and ErmineJ [12] apply resampling or permutation algorithms on random sets to evaluate the number of false positives in computed gene ontologies associated with test sets. David [4] and Babelomics [8] introduced level-specific enrichment analysis; that is, not including both parents and children terms. TopGO contains options, “eliminate” and “parent-child,” which eliminate or reduce the weight of genes in the enriched children terms when calculating parent term enrichment [13]. TopGO [14] and GOstats [15] provide R-scripted tools for ease of further implementation. Cytoscape plugin in BinGO [16] is associated with output tree graphs.
Assessment of enrichment is inextricably connected to the concept of p-value [17]. In the case of mutual enrichment of gene lists independently derived from the genome of an organism, p-value may be defined as the probability that the mutual enrichment of those lists would be equal to or more than the value observed.
To calculate uncorrected p-values for GO enrichment without multiple hypothesis correction, published methods use include exact or asymptotic (i.e., based on the hypergeometric distribution or on Pearson's distribution), one- or two-sided tests. Rivals et al. discussed the relative merits of these methods [18].
Generally, inference of the statistical significance of observed enrichment of categories in gene ontology databases can't be assumed to be parametric, because there is no a priori reason to postulate normal distributions within gene ontology terms. Randomization methods are powerful tools for testing nonparametric hypotheses [19]. However, heuristic methods for testing nonparametric hypotheses have long been widely used due to lack of adequate computational resources for randomization tests. In gene ontology enrichment, a widely-used heuristic method is that of Benjamini and Hochberg [20]. In their original paper, Benjamini and Hochberg tested their method against a more computationally intensive resampling procedure for selected input data and found no significant difference, Thus the more computationally efficient Benjamini-Hochberg method was justified.
Benjamini-Hochberg has been widely applied in enrichment tools such as BinGO [16], David [4], GOEAST [21], Gorilla [3], and Babelomics [8], to name a few. The similar Benjamini-Yekutieli method is included in the GOEAST package which enables one to control the FDR even with negatively correlated statistics [22]. A recent approach published by Bogomolov et al. deals with multiple hypothesis correction and error control for enrichment of mutually dependent categories in a tree structure using a hierarchical Benjamini-Hochberg-like correction [23]. GOSSIP provides another heuristic estimation of false positives that compares well with resampling in the situations tested [24].
A randomized permutation method for assessing false positives is embedded in the protocol of Gene Set Enrichment Analysis (GSEA) [10]. Kim and Volsky [25] compared a parametric method (PAGE) to GSEA and found that PAGE produced significantly lower p-values (and therefore higher putative significance) for the same hypotheses. They suggest that PAGE might be more sensitive because GSEA uses ranks of expression values rather than measured values themselves. However, they do not demonstrate that the hypothesis of normal distributions in gene ontology databases that underlies PAGE is generally true.
Noreen [26] considered the potential of using more widely available computer power to do exact testing for the validity of hypotheses, in order to be free of any assumptions about the sampling distributions of the test statistics, for example the assumption of normality. The essence of the more exact methods is the generation of a null hypothesis by the creation and analysis of sets of randomly selected entities (null sets) that are of the same type as the test set. Then the extent to which the null hypothesis is rejected emerges from comparing the results of conducting the same analysis on the null sets and the test set. As exemplified by the over one thousand citations of this work by Noreen, these methods have been widely adopted in many areas in which complex datasets must be mined for significant patterns, as for example in financial markets.
In the present paper we follow Noreen to utilize a straightforward random resampling method for creation of null sets and compare resultant assessments for estimating false positives with commonly used analytical methods as applied to gene ontology enrichment analysis. We also evaluate the computational cost of this method relative to analytical methods.
In applying all the cited methods and tools, it is common to apply a threshold boundary between “significant enrichment” and “insignificance.” Such assignment to one of two classes is an example of a binary classification problem. Often such classifications are made utilizing an optimum F-measure. Rhee et al. have suggested application of F-measure optimization to the issue of gene ontology enrichment analysis [27]. In the present work, we present an approach to gene enrichment analysis based on F-measure optimization, and provide a pipeline for implementing the approach. We also compare a resampling method to the Benjamini-Hochberg method for estimation of FDR and use with F-measure optimization.
There is as yet no closed-form theory nor universal algorithm for optimizing F-measure, as discussed for example by Waegeman et al. [28]. In this paper we will emphasize the simple maximization of F1, which is a good default option, since as the harmonic mean of precision and recall, it balances these two measures equally. However, we will also introduce the option of maximizing an F-measure that is weighted toward precision (F0.5) and one that is weighted toward recall (F2).
We also consider the argument made by Powers [29] that the F-measure is subject to positive bias, because it neglects the measure of true negatives, and that instead of precision and recall (the constituents of the F-measure) the constructs of markedness and informedness should be considered. Whereas, precision and recall are entirely based on the ability to identify positive results, informedness, and markedness give equal weight to identification of negative results. We note that the Matthews Correlation Coefficient (MCC), another well-vetted measure of significance [30], is the geometric mean of the markedness and informedness.
Our results in this paper will suggest that resampling is preferable to analytical methods to estimate FDR, since the compute costs are modest by today's standards and that even well-accepted and widely used analytical methods may have significant error. Our results also suggest that F-measure or MCC optimization is preferable to an arbitrary threshold when classifying results as “significant” or “insignificant.” The overall thrust of our work is well-aligned with the American Statistical Association's statement on p-values, “Scientific conclusions and business or policy decisions should not be based only on whether a p-value passes a specific threshold [17].” For the particular analyses in this paper, we found no significant difference in utilizing F-measure vs. MCC. In assessing significance of results in computing enrichment in gene ontology analysis.
Methods
Enrichment Tool
For results reported in this study (described below), the TopGO [14] package is implemented to perform GO enrichment analysis, using the “classic” option. In this option, the hypergeometric test is applied to the input gene list to calculate an uncorrected p-value.
FDR Calculation
The empirical resampling and Benjamini-Hochberg (BH) methods are used to estimate the FDR. The p-value adjustment using Benjamini-Hochberg is carried out by a function implemented in the R library. http://stat.ethz.ch/R-manual/R-devel/library/stats/html/p.adjust.html
The resampling method is based on the definition of p-value as the probability that an observed level of enrichment might arise purely by chance. To evaluate this probability, we generate several null sets, which are the same size as the test set. The genes in the null sets are randomly sampled from the background/reference list. GO enrichment analysis was carried out on both test set and null set. The average number of enriched results in the null sets would be the false positives. In all the results shown in this paper, 100 null sets were used to compute the average, unless otherwise indicated. In the pipeline, available for download in Supplementary Material, the number of null sets is an adjustable parameter. The ratio of false positives to predicted positives is the FDR.
F-Measure Optimization and the Matthews Correlation Coefficient
To evaluate F-measure and MCC, we started with evaluating true/false positive/negatives and the metrics derived from the true/false positive/negatives. The number of “predicted positive” is the number of GO terms found at a threshold. For an analytical method such as BH, the “false positive” would be (predicted positive) multiply by FDR, which is estimated by the corrected p-value. For resampling, the “false positive” would be the average number of GO terms found by null sets. The “true positive” is calculated by:
Then, we calculate the precision:
Recall is defined as
“Relevant Elements” is defined by
In the absence of the ability to calculate “False Negatives” directly, we estimate the number of relevant elements as the maximum true positive achieved across the range of possible p-values. This procedure is shown graphically in Figure 1 for the BH method of computing false positives, using as an example a gene list to be described in detail later in the paper. In this figure we plot predicted positives, false positives (False Discovery Rate × predicted positives), and true positives (predicted positives—false positives) vs. uncorrected p-value for the entire range of p-values from 0 to 1. At very lenient p-values the FDR approaches 1, resulting in the true positives approaching 0. It is difficult to evaluate false negatives and thus assign a number for “relevant elements,” since a false negative is an object that escaped observation, and thus can't be counted directly. Yet such estimation is essential to applying F-measure. In our case, if we follow the trajectory of the true positives in Figure 1 as the threshold is relaxed, we see that at very stringent p-values all positives are true positives. As the threshold is relaxed further, more false positives are generated, so the predicted positive and true positive curves start to diverge. At p = 0.13 (a far higher value than would ordinarily be used as a cutoff) the true positives reach a maximum, and the number of true positives starts to decline as p is further relaxed. We utilize this maximum value as the maximum number of GO categories that can be possibly regarded as enriched in the data set; i.e., the number of relevant elements.
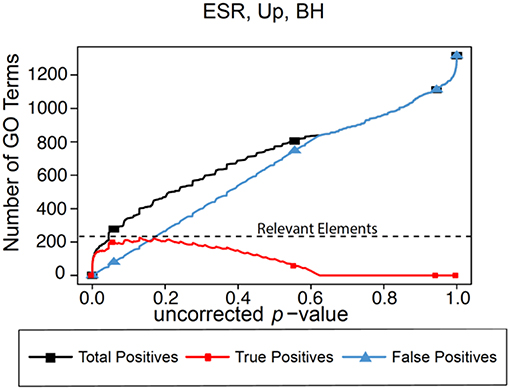
Figure 1. Number of positives for the yeast environmental stress response (ESR) set over the full range of uncorrected p-values from 0 to 1. Vertical axis is the number of Biological Process GO categories returned as a function of the p-value threshold for significance. “False Positives” is the number of predicted positives multiplied by the False Discovery Rate as calculated by the Benjamini-Hochberg formulation. “True Positives” is “Predicted Positives” minus “False Positives.” “Relevant Elements,” necessary to estimate number of false negatives, is estimated as the largest number of true positives computed at any uncorrected p-value.
Based on precision and recall at each uncorrected p-value cut-off, we can obtain a table and curve of F-measure vs. uncorrected p-value. The F1-measure is an equally weighted value of precision and recall. A generalized F-measure introducing the parameter β can be chosen based on the research question, whether minimization of type I (false positive) or type II (false negative) error, or balance between the two, is preferred, according to the equation:
The larger the magnitude of β the more the value of Fβ is weighted toward recall; the smaller the value of β the more the value of Fβ is weighted toward precision. Optimizing F-measure provides us a threshold which emphasize precision (β < 1) or recall (β > 1), or balance of both (β = 1). Note that precision and recall are extreme values of F-measure; that is, Precision = F0 and Recall = F∞.
To compare the different thresholds, we also calculated for each of them the Matthews correlation coefficient (MCC) [28]. Originally developed to score different methods of predicting secondary structure prediction in proteins, the MCC has become widely used for assessing a wide variety of approaches to binary classification, as exemplified by the 2704 citations (at this writing) of the original paper. Perhaps even more telling, the citation rate for the seminal MCC paper has been increasing as the method is being applied in a greater variety of contexts, reaching 280 citations in 2017 alone.
In the expression below for the MCC, the True Negative (TN) is estimated using total number of GO categories in the database minus predicted positive and false negative.
The MCC can be expressed in an equivalent expression using definition of informedness and markedness, which includes precision and recall, as well as the inversed precision and recall evaluating the proportion of true negatives:
Combining Equations (2–6) and some algebra we find:
In an analogous fashion to the manner in which the F-measure may be generalized to weight either precision or recall more strongly by a variable β, so also the MCC can be generalized to more strongly weight either markedness or informedness by the expression
Data Sets
The Canonical Yeast Environmental Stress Response as a Standard Data Set
In testing statistical methods, it is common to utilize as a standard a synthetic data set where the answers are known, for example in searching for epistatic relationships among genetic variations in genome wide association studies [31]. If the method being tested is valid, the known relationships should be recaptured by the method.
A second approach is to utilize a real data set which was used to create the correlations in the database being interrogated, for example a gene ontology database. A major step toward creation of the Gene Ontology was a cluster analysis of expression patterns in yeast using a complete genome chip [32]. The results of the cluster analysis were incorporated into a functionally organized database of yeast genes, the Saccharomyces Genome Database [33]. The Gene Ontology Consortium was formed by combining and standardizing these types of data and analyses from three model organism databases, the Saccharomyces Genome Database, Flybase, and Mouse Genome Informatics [1]. In conjunction with the Saccharomyces Genome Database and Gene Ontology Consortium projects, the canonical yeast “environmental stress response” (ESR) dataset was created [34]. Because of the intimate connection between the creation of this set and the creation of the yeast gene ontology, it can be used as a reference or standard set against which to test any method for gene ontology determination, such as we propose here. It is to be expected that this data set will simultaneously provide both high precision and high recall.
Standard Data Set Made Noisy
In order to understand effects of error in data sets we degraded the standard yeast ESR data set by diluting it with random genes. Specifically, we added random genes to the ESR set so the sets were increased in size by factors of 1.2, 1.4, 1.6, 1.8, 2, 3, 4, and 5. The point to be tested is the extent to which our methods could successfully extract the signal in the core ESR set even when obscured by pure noise in the form of randomly selected genes added to the set. Prior to actually doing the calculations, it does not seem possible to anticipate the extent to which the dilution will compromise the results.
Alarm Pheromone (AP)
One data set is comprised of human orthologs to the honey bee Alarm Pheromone set [35]. The Alarm Pheromone set is a list of genes differentially expressed in honey bee brain in response to the chemical alarm pheromone, which is a component of the language by which honey bees communicate with each other. Previous studies have shown that the Alarm Pheromone set is enriched in placental mammal orthologs, compared to other metazoans including non-social insect orthologs [36]. The Alarm Pheromone set is much smaller than the ESR set, with 91 up-regulated genes and 81 down-regulated genes. This data set is chosen because it presents essentially the opposite situation from the yeast ESR set. Because the relationship between the honeybee genes and the human gene orthology is attenuated by the 600 million years since the last common ancestor of the honeybee and the human, it is reasonable to anticipate that it may not be possible to simultaneously achieve high levels of precision and recall.
Random Test Sets
To generate a baseline of the analysis for each data set using different FDR calculation methods, we have applied the pipeline to analyze randomly-generated sets as “test” set inputs, where FDR should equal to 1 for all uncorrected p-values.
The BH FDR curves are calculated in the following way: The R program p.adjust is applied to generate a list of analytically calculated FDR (BH) corresponding to uncorrected p-values for each “test” set. Then the lists of FDRs are merged and sorted by uncorrected p-values. The FDRs are smoothed by a “sliding window” method: at each uncorrected p-value point, the new FDR is the average value of 11 FDRs centered by the uncorrected p-value point.
The Resampling FDR curves are calculated in the following way: The output uncorrected p-values are binned in steps of 1E-4. The counts below the upper bound of each p-value bin for the “test” set enrichment categories are the “Total positives,” and average counts for the null set enrichment categories are the “False Positives.” The process is repeated for the multiple “test” sets, and corresponding to each test set, 100 null sets were generated for “False Positive” calculation. Then the number of total and false positives are averaged, respectively. The FDR would be the quotient of the averaged total and false positives. Then, all the FDRs are plotted against the uncorrected p-values.
Results
In this section, we present the results of applying our methods to the two sets of data introduced in the Methods section, the ESR set, the “noisy ESR sets, and the human orthologs of the Alarm Pheromone set. For both above data sets, we show the results from analyzing the genes using the biological process (BP) category of the gene ontology. These results will show (1) areas of agreement and difference between Benjamini-Hochberg and random resampling in evaluation of FDR, (2) how the assessment of significance of enrichment varies according to the particular database and gene set that is being probed, and (3) how the assessment of significance of enrichment varies according to the weight assigned to precision vs. recall.
We note that, in those plots below where Benjamini-Hochberg correction is applied and where uncorrected p-value is the independent variable, it is in fact derived as described above, from the hypergeometric test applied to particular pairs of gene lists. Thus, it is not a continuous function.
To make the curves for the Benjamini-Hochberg results, the x-value of each point are the un-corrected p-value calculated by TopGO. The cumulative count below each un-corrected p-value is the y-value of each point. The points are connected by line segments.
To make the curves for the resampling results, the p-values are binned in intervals of 1E-4. The cumulative count below the upper limit of each bin is represented by a point. Again, the points are connected by line segments.
The line type on the graph (dash and solid), color, as well as point types are only intended to label what each line is.
ESR Set (Environmental Stress Response, Yeast)
Benjamini-Hochberg (BH)
Figure 2 shows the results of F-measure optimization on the ESR data based on FDR calculated by Benjamini-Hochberg (BH) method. As expected by their definitions, precision (F0) decreases with increasing p-value while recall increases with increasing p-value. F0.5 (precision-emphasized), F1 (precision and recall equally weighted), and F2 (recall-emphasized) all show relative maxima, providing a rational basis for assigning a threshold for significance. The horizontal scale is extended far enough to visualize the determination of the number of relevant elements. In the case of the up-regulated gene set, maximum F1 occurs at an uncorrected p-value close to 0.05. In the case of the down-regulated gene set however, it appears that a much more stringent cutoff would be appropriate.
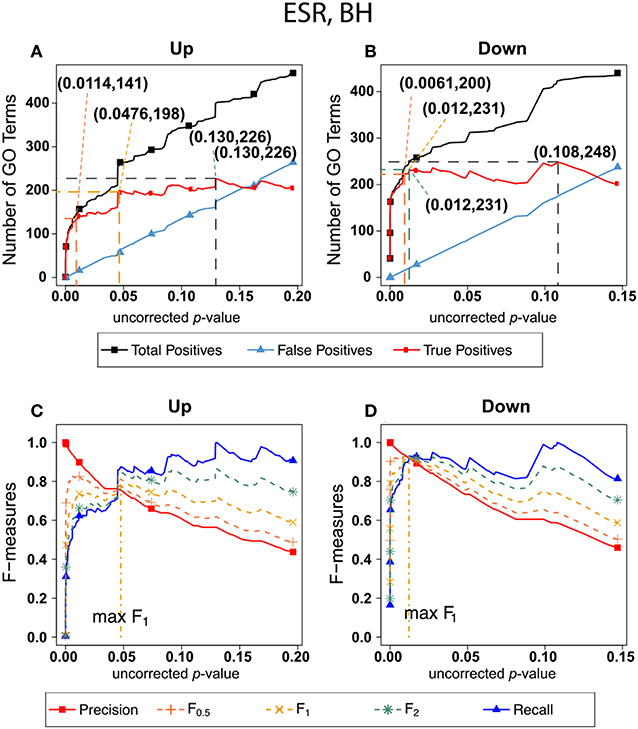
Figure 2. Number of positives and F-measure values for ESR set, BH-estimated FDR. (A) Shows the number of enriched biological process Gene Ontology categories as a function of uncorrected p-value, the Benjamini-Hochberg number of false discoveries, and the projected true positives, namely the difference between the predicted positives and the false positives, for the upregulated ESR gene set. This panel is from the same data set at Figure 1. The number pairs in parenthesis are respectively (uncorrected p-value maximizing F0.5, number of true positives at that p-value), (uncorrected p-value maximizing F1, number of true positives at that p-value), (uncorrected p-value maximizing F2, number of true positives at that p-value), (uncorrected p-value maximizing true positives, number of true positives at that p-value) (B) is the same as (A) for the downregulated gene set. (C) Shows the F-measures computed from (A,D) the F-measures computed from (B). Number of relevant elements, necessary to calculate recall [and therefore (F-measure)], is approximated by (predicted positives—false positives) max. The p-value at which the computed true positives are a maximum is 0.13 for upregulated gene list (A) and at 0.099 for downregulated gene list. (B) The pairs of numbers in parenthesis in (A,B) indicate the p-value and number of returned GO terms at significant markers, specifically at maximum F0.5 (emphasizing precision), F1 (balanced emphasis between precision and recall), F2 (emphasizing recall), and Recall where we obtain an estimation of relevant elements by maximizing true positive).
Resampling
Figure 3 shows the results of F-measure optimization on the ESR data using resampling to calculate FDR. The false positives are calculated by average number of GO categories enriched in random sets. For the up-regulated set, all the F-measures optimize at much lower uncorrected p-values than do the F-measures calculated by the BH method. For the down-regulated set, resampling-calculated F0.5 is optimized at a lower uncorrected p-value than by the BH method while F1 and F2 are optimized at slightly higher uncorrected p-value.
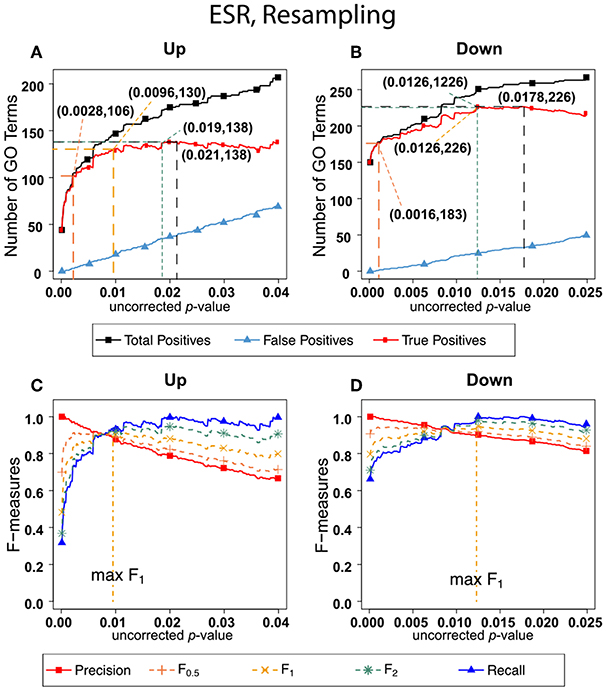
Figure 3. Number of positives and F-measure values for ESR set, Resampling-estimated FDR. (A) Shows the number of enriched biological process Gene Ontology categories as a function of uncorrected p-value, the average number of enriched Gene ontology categories from the random set as the false positives, and the projected true positives, namely the difference between the predicted positives and the false positives, for the up-regulated ESR gene set. The number pairs in parenthesis are respectively (uncorrected p-value maximizing F0.5, number of true positives at that p-value), (uncorrected p-value maximizing F1, number of true positives at that p-value), (uncorrected p-value maximizing F2, number of true positives at that p-value), (uncorrected p-value maximizing true positives, number of true positives at that p-value) (B) is the same as (A) for the down-regulated gene set. (C) shows the F-measures computed from (A,D) the F-measures computed from (B). Number of relevant elements, necessary to calculate recall [and therefore (F-measure)], is approximated by (predicted positives—false positives) max. The p-value at which the computed true positives are a maximum is 0.021 for upregulated gene list (A) and 0.0179 for downregulated gene list. (B) The pairs of numbers in parenthesis in (A,B) indicate the p-value and number of returned GO terms at significant markers, specifically at maximum F0.5 (emphasizing precision), F1 (balanced emphasis between precision and recall), F2 (emphasizing recall), and Recall (where we obtain an estimation of relevant elements by maximizing true positive).
Comparing the results in Figures 2, 3 show that the optimum cutoff (as measured by maximum F1) varies widely, depending on the gene set to be tested and the method for assessing FDR. Using BH the optimum (F1-maximized) cutoff is.0476 for upregulated ESR and.012 for downregulated ESR. Using resampling, the optimum (F1-maximized) cutoff is 0.0096 for upregulated ESR and 0.0126 for downregulated ESR. Also, as expected, the optimum cutoff is relaxed when recall is emphasized (F2 instead of F1) and made more stringent when precision is emphasized (F0.5 instead of F1).
ESR Set Made Noisy
Figure 4A shows False Discovery Rate as a function of the uncorrected p-value cutoff for the upregulated and downreglated subsets at various dilutions with random genes, as interrogated by the random resampling method. It is seen that at large uncorrected p-values the FDR is increased significantly when the ESR set is diluted with random genes. However, Figure 4B shows that at the uncorrected p-value corresponding to optimum F1 the precision and recall as defined by our protocol are essentially unchanged by addition of random genes, even up to a 4-fold dilution of the ESR with randomly selected genes. Figure 4C shows numerically the number of significantly enriched GO categories from the undiluted set and from the 2-fold and 4-fold dilution. In the case of 2-fold dilution the great majority of the categories of the undiluted set are recovered, and even with 4-fold dilution a majority are recovered.
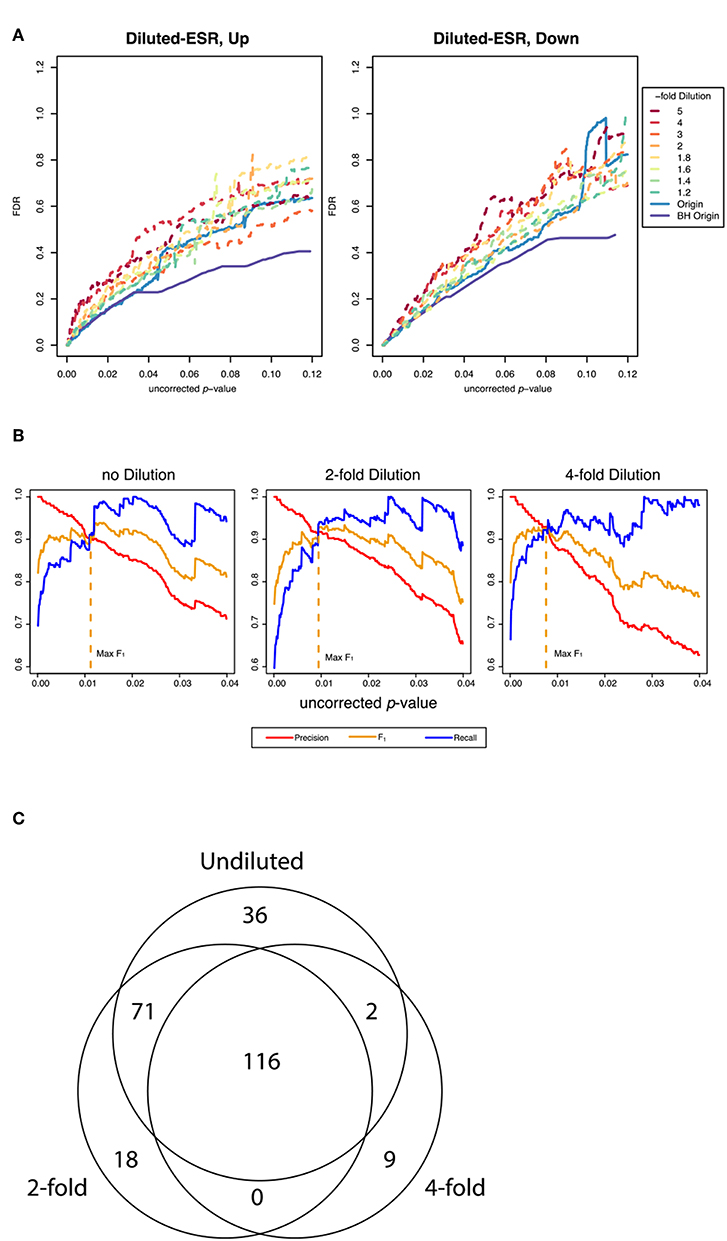
Figure 4. Performance of the resampling protocol when the ESR set is degraded by dilution with randomly selected genes. (A) shows the false discovery rate as a function of uncorrected p-value over a wide range of uncorrected p-values up to p-value equals 0.12, for dilutions of a factor of 1.2, 1.4, 1.6, 1.8, 2, 3, 4, and 5. As expected, dilutions increase the false discovery rate. (B) shows the behavior in the region of p-values where F1 is optimized. In this range the performance is only moderately affected by dilution. In particular, the uncorrected p-value at which F1 is optimized is essentially the same at 2-fold and 4-fold dilution of the upregulated gene set as are the precision and recall at that cutoff, as our method computes those quantities (C) shows numerically the extent to which the recovery of statistically significant enriched GO categories is affected by dilution. The undiluted set returns 225 categories. The 2-fold dilution returns 205 categories, of which 187 are common with the undiluted and 18 of which are different. The 4-fold diluted set returns only 127 categories, 118 of which are common with the undiluted set and only 2 of which are different. Dilution degrades the performance, but most of the categories found in the undiluted set are still recovered in even in the most diluted sets.
Alarm Pheromone Set (Human Orthologs)
Benjamini-Hochberg (BH)
Figure 5 shows exactly the corresponding results as Figure 2, this time on the human orthologs to the honey bee alarm pheromone set. F-measures are maximized at much higher thresholds than for the ESR set. The difference in optimal F-measure is largely due to the different shapes of the recall curves. For the ESR set, precision drops significantly more rapidly with increasing uncorrected p-value than it does for the AP set. Therefore, a higher uncorrected p-value should be used for the AP set.
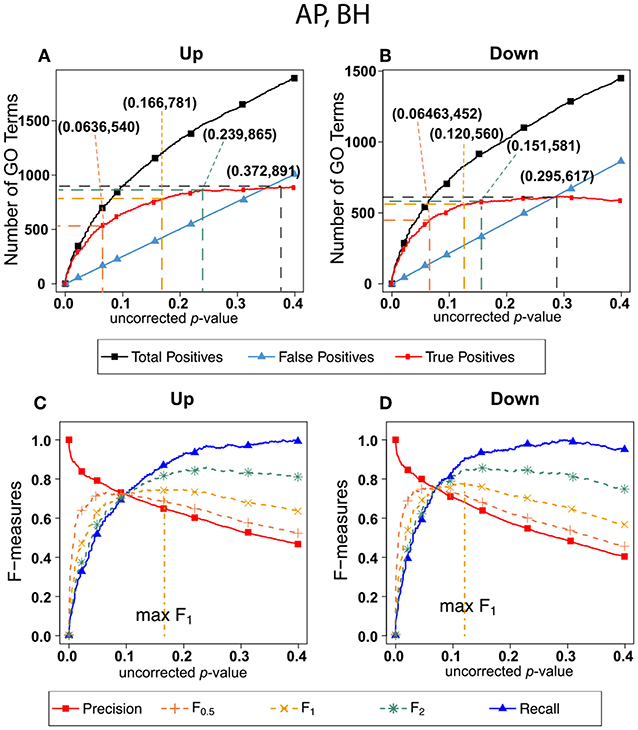
Figure 5. Number of positives and F-measure values for Alarm Pheromone set, BH-estimated FDR (A) shows the number of enriched biological process Gene Ontology categories as a function of uncorrected p-value, the Benjamini-Hochberg number of false discoveries, and the projected true positives, namely the difference between the predicted positives and the false positives, for the upregulated alarm pheromone human orthologs gene set. The number pairs in parenthesis are respectively (uncorrected p-value maximizing F0.5, number of true positives at that p-value), (uncorrected p-value maximizing F1, number of true positives at that p-value), (uncorrected p-value maximizing F2, number of true positives at that p-value), (uncorrected p-value maximizing true positives, number of true positives at that p-value) (B) is the same as (A) for the downregulated gene set. (C) Shows the F-measures computed from (A). (D) The F-measures computed from (B). Number of relevant elements, necessary to calculate recall [and therefore (F-measure)], is approximated by (predicted positives—false positives) max. The p-value at which the computed true positives are a maximum is 0.372 for upregulated gene list (A) and at 0.295 for downregulated gene list. (B) The pairs of numbers in parenthesis in (A,B) indicate the p-value and number of returned GO terms at significant markers, specifically at maximum F0.5 (emphasizing precision), F1 (balanced emphasis between precision and recall), F2 (emphasizing recall) and Recall (where we obtain an estimation of relevant elements by maximizing true positive).
Resampling
Figure 6 shows the number of GO categories and F-measures for the alarm pheromone set human orthologs using resampling method. The resampling method have found more false positives than BH, and therefore the precision is much lower than the precision calculated from BH, and the F-measures are optimized at lower uncorrected p-values than the F-measures calculated from BH.
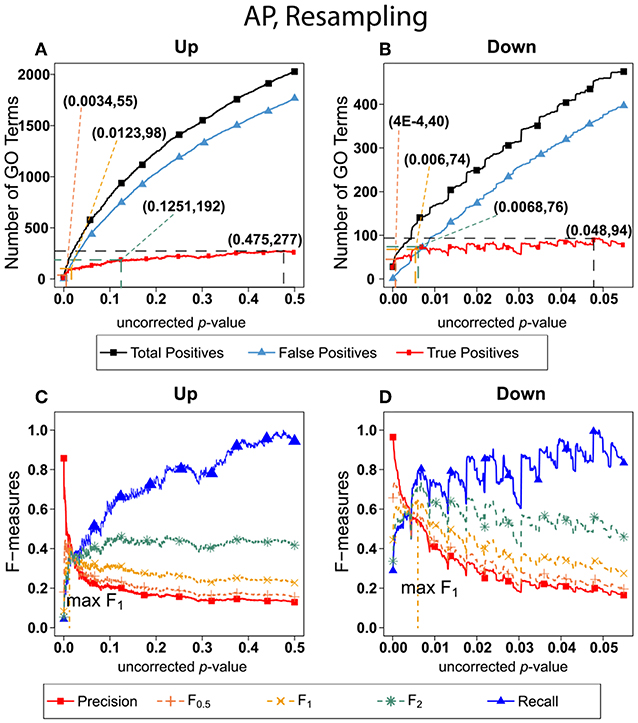
Figure 6. Number of Positives and F-measure values for AP set, Resampling-estimated FDR. The figure shows the number of enriched biological process Gene Ontology categories as a function of uncorrected p-value, the average number of enriched Gene ontology categories from the random set as the false positives, and the projected true positives, namely the difference between the predicted positives and the false positives, for the up-regulated alarm pheromone human orthologs gene set. (B) is the same as (A) for the down-regulated gene set. (C) Shows the F-measures computed from (A).(D) The F-measures computed from (B). Number of relevant elements, necessary to calculate recall [and therefore (F-measure)], is approximated by (predicted positives—false positives) max. The p-value at which the computed true positives are a maximum is 0.475 for upregulated gene list (A) and at 0.048 for downregulated gene list. (B) The pairs of numbers in parenthesis in (A,B) indicate the p-value and number of returned GO terms at significant markers, specifically at maximum F0,5 (emphasizing precision), F1 (balanced emphasis between precision and recall), F2 (emphasizing recall), and Recall (where we obtain an estimation of relevant elements by maximizing true positive).
From the above Figures 2 through 6, we can note the stepped structure in the number of enriched GO categories. The stepped structure lies in the fact that the number of genes associated with any GO category, in the test set or reference set, must be an integer with limited number of choices. Therefore, the uncorrected p-values calculated would be in a discrete set instead of a continuum. Consequently, the number of positives as a function of p-values increases in a stepped way. As a result, the F-measures derived from the number of GO categories have spikes. But as our graphs have demonstrated, the optimal F-measures reflect the different weights on precision and recall despite the spikes.
Comparing the results in Figures 5, 6 shows that, for the AP gene sets as for the ESR gene sets, the optimum cutoff threshold (defined by uncorrected p-value) is different for the upregulated and downregulated gene sets and also is different when BH is used to determine the FDR as compared to resampling.
Comparison of F-Measure With MCC for Optimization of Threshold Choice
As indicated in the section on methods, a widely used alternative to the F-measure for optimization is the Matthews Correlation Coefficient (MCC) which, unlike the F-measure, gives equal weight to negative as well as positive identifications. Figure 7 shows MCC optimization for exactly the same data set (ESR) and False Discovery Rate determination (Resampling) as in Figure 6. An important lesson from this Figure is that the uncorrected p-value that maximizes MCC1 is almost exactly the same as the uncorrected p-value that maximizes F1, and that these maxima occur when Precision and Recall are approximately equal. The related theory is shown in Additional File 4. The theory shows that in the limit where True Negatives are much more numerous than the other categories (True Positive, False Positive, False Negative), and under the condition that precision = recall, MCC1 and F1 converge to the same value. Since there are tens of thousands of terms in the gene ontology database the number of True Negatives is indeed much larger than the other quantities, so optimization of the F-measure in this case is an adequate strategy. However, we agree with Powers [28] that optimization of the MCC is the more universally correct strategy for binary classification in general.
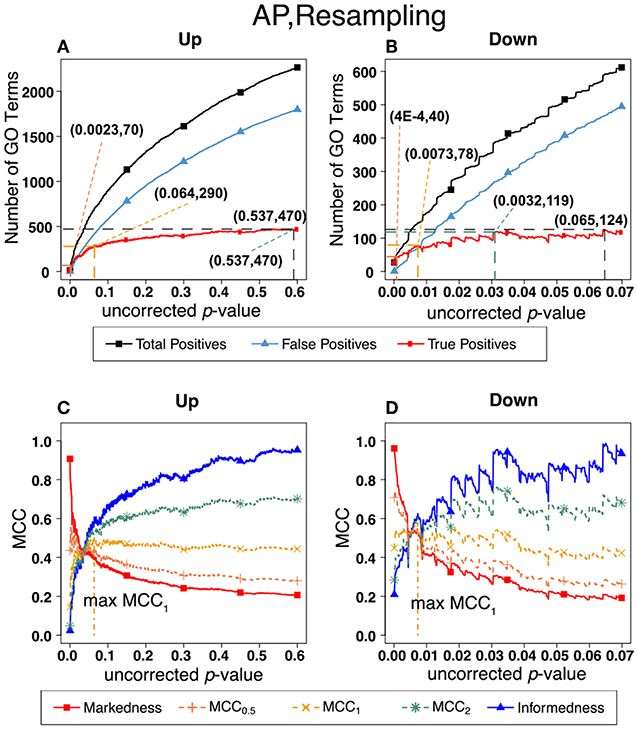
Figure 7. Number of positives and Matthew's Correlations Coefficients (MCC) for AP set, Resampling-estimated FDR. The figures shows the number of enriched biological process Gene Ontology categories as a function of uncorrected p-value, the average number of enriched Gene Ontology categories from the random set as the false positives, and the projected true positives, namely the difference between the predicted positives and the false positives, for the up-regulated alarm pheromone human orthologs gene set. Panel (B) is the same as (A) for the down-regulated gene set. Panel (C) shows the MCC computed from (A). (D) the MCC computed from (B).
Comparison of FDR (False Positive) Calculation by Benjamini-Hochberg (BH) and Resampling
In the previous section, we have demonstrated how to use F-measure optimization to obtain a flexible threshold based on whether precision or recall is more heavily weighted by the researcher. In that section the FDR is calculated but not shown explicitly. The present section explicitly compares the FDR as calculated by the BH method and by random resampling. In each case the random resampling FDR is computed based on the average of 50 randomly sampled null sets of the same size as the test set. Figure 8 shows that for the ESR set, the BH method and resampling estimate similar FDR at low p-value. As the threshold increases, the BH method estimates lower false discovery rate, and therefore higher precision, than the resampling method at the same uncorrected p-value. By contrast, for the Alarm Pheromone set, the BH method estimates lower FDR than resampling.
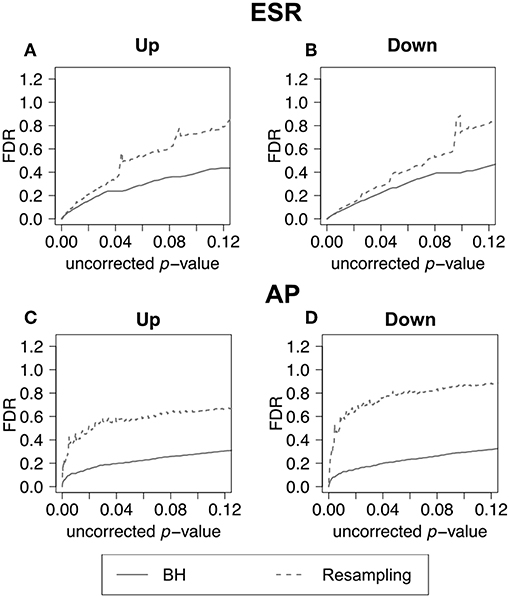
Figure 8. False discovery rate comparison. False discovery rate estimated by Benjamini-Hochberg (solid curve) and Resampling (dashed curve) for the ESR set and Alarm Pheromone set. Figure 7 compares the number of false discovery rate calculated by Benjamini-Hochberg (solid) and Resampling (dashed) in each set: (A) up-regulated ESR, (B) down-regulated ESR, (C) up-regulated Alarm Pheromone set, and (D) down-regulated Alarm Pheromone set. Generally, resampling has found higher false discovery rate than Benjamini-Hochberg. At low p-values, the BH and resampling methods get similar estimation of false discovery rate for the ESR set.
To further evaluate the methods, we carried out multiple runs using random (null) sets as test sets. In this case, the FDR should in principle be 1, for any uncorrected p-value. The results of this test are shown in Figure 9A, where for each segment of p-values (bin size = 0.0001) we show the mean plus/minus the standard deviation. The resampling method passes the test on the average, but the results are noisy. The BH method systematically underestimates FDR. Figure 9B shows that the noise in the resampling method results in Figure 9A are largely due to the variation in the random null sets, and that the noise level in using random resampling for real data is acceptably low.
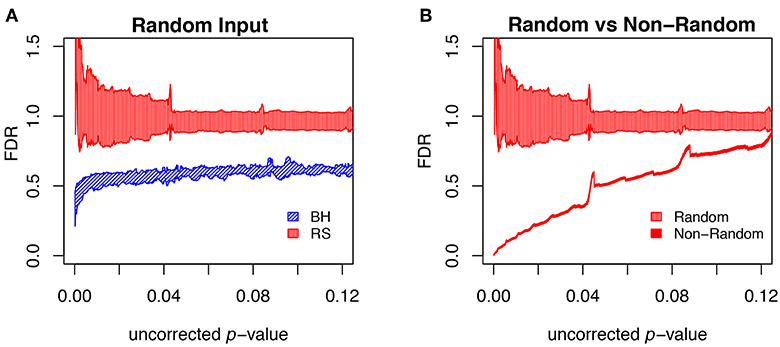
Figure 9. Comparison of different FDR calculation method on accuracy and convergence. (A) Comparison of BH and Resampling on random “test” sets. At each p-value (p-values binned at intervals of 0.0001), the mean and standard deviation are calculated and plotted as shown. The random test sets consist of 281 yeast genes, against the background of the entire yeast genome. For each of the methods 50 test sets were used and the mean plus/minus standard deviation plotted as shown. Resampling hits the mark on the average but with substantial noise, while BH systematically underestimates FDR. (B) Evaluation of resampling convergence on a real data set, ESR upregulated considered in this paper. This set is run against five different ensembles of null sets, each ensemble containing 100 null sets. The mean and standard deviation are plotted and compared to the results from the random test sets. It is seen that the noise of the resampling method on a real data set is acceptable.
Inferences Drawn From Results Using Different Threshold Criteria
Table 1 shows the statistical summary of using different criteria [maxF.5, maxF1, BH (FDR-corrected p-value < 0.05, and max MCC] for the distinction between significant and non-significant enrichment. Important inferences to be drawn this table include: (1)We note that the threshold criterion of BH (F < 0.05) seems to strongly favor precision over recall, both for the ESR set where both are high and for the AP set where they are relatively low. It appears that the use of this criterion implicitly and unwittingly favors precision over recall. In some contexts this may be justifiable, but we recommend that the researcher make such a choice consciously, by use of a precision-weighted F-measure such as F0.5, rather than unwittingly. (2) For the particular case of gene ontologies, where the number of true negatives at reasonable thresholds is far larger than the numbers of true positives, false positives, and false negatives, there is no advantage to deploying the more complex MCC as compared to the simpler F-measure (Figures 7C, D).
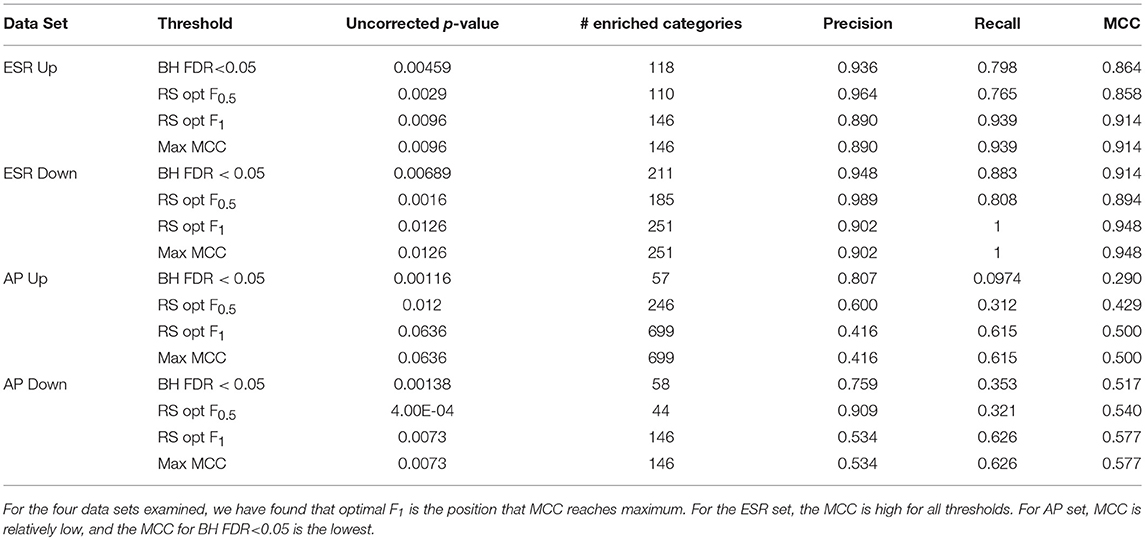
Table 1. Precision, recall, and Matthews Correlation Coefficients (MCC) at thresholds BH FDR < 0.05, resampling optimal F0.5, and resampling optimal F1.
Identity of Enriched Terms Using Different Threshold Criteria
Higher Order Relatively General Terms
The enriched GO terms are categorized by their parent terms, 1st order parent being direct children of the root term “Biological Process” (GO:0008150), 2nd order parent being direct children of the 1st order parent terms. Each enriched GO term is traced back to the root by the shortest route. Tables 2 through 5 below provide an outline of the complete gene ontology results by showing the high order terms that are either themselves enriched according to the described criteria or have child terms enriched, or both. In each case the results from three different thresholds are shown, BH FDR < 0.05, optimum F.5, and optimum F1. The most striking pattern is that for the ESR sets (Tables 2, 3), modifying the threshold within the parameters of this paper did not change the identity of the putatively enriched higher order terms very much. However, for the AP sets (Tables 4, 5), relaxing the threshold caused a substantial increase in the number of high order terms judged to be putatively significant. However, from Table 1 is it seen that the precision (confidence) of the additional terms for the AP sets is substantially lower than for the terms returned using the most stringent threshold. Thus, for the AP set we clearly see that we can't simultaneously have high precision and high recall. We must trade one for the other.
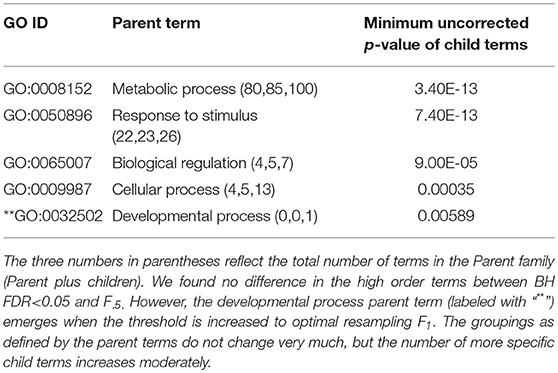
Table 2. ESR, Up-regulated set each row corresponds to a 1st order parent terms of enriched GO categories of ESR set, up regulated genes.
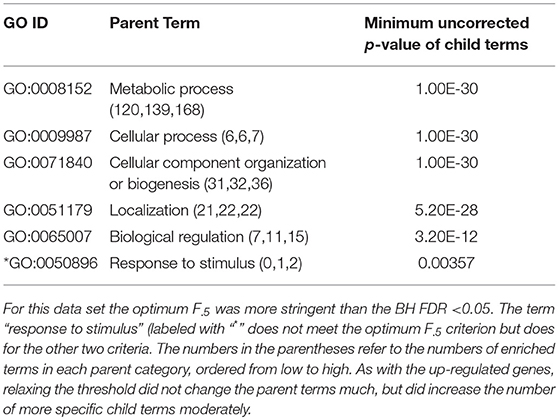
Table 3. ESR, Down-regulated Set 1st order parent terms of enriched GO categories of ESR set, down regulated genes.
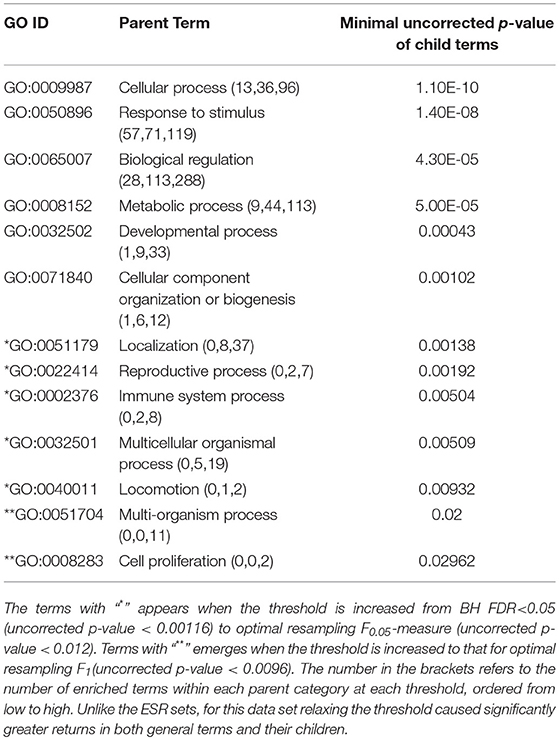
Table 4. First order parent terms of enriched GO categories of AP set, Up regulated genes.
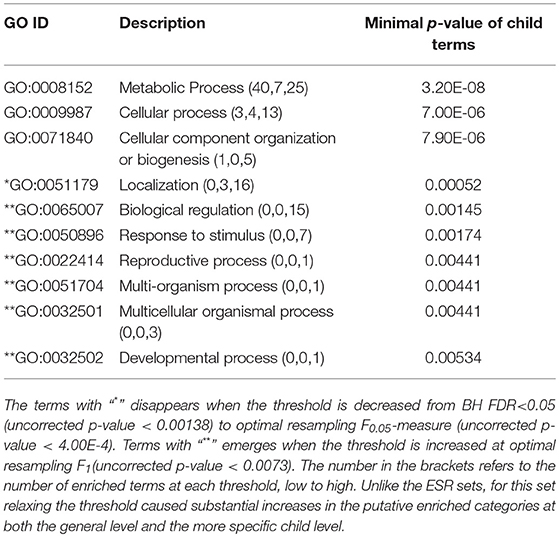
Table 5. First order parent terms of enriched GO categories of AP set, down regulated genes.
Relatively Specific Terms
Specific, or “child” terms returned in these calculations are too numerous to delineate completely in the body of the paper. They are instead provided in the spreadsheet “AllGOTermsInTree_Final (Supplementary Material 1)” Separate tabs delineate the returns from ESR upregulated, ESR downregulated, AP upregulated, and AP downregulated. Each entry in the spread sheet is color coded with the code given in the tab labeled “color coding.” Entries that are shaded are either primary or secondary (more general) classes, which will also be shown in Table 1. Entries colored in black appear at “standard” threshold: BH FDR < 0.05. Entries colored in blue emerge at the threshold determined by optimal F0.5. For AP Up, the standard threshold is the most stringent while for all other sets, the optimal F0.5 is the most stringent. Entries colored in red first emerge at the least-stringent threshold for that data set, which corresponding to optimal F1. The format of the spreadsheet for each of the data sets is as follows: Column A is the identifying number of the GO class that is returned as significant, column B is the name of that class, and column C is the uncorrected enrichment p-value for that class. Column D is non-zero only for the rows belonging to primary or secondary GO classes (which are shown explicitly in Tables 2–5 for the four data sets). The numerical value in column D represent the smallest uncorrected p-value of all the classes under the primary or secondary class shown in that row. The spread sheet is organized to be sectioned off according to primary or secondary classes. To illustrate the sectioning, under the “AP up” is the primary class “cellular process” and immediately under that the secondary class “protein folding.” This is followed by more specific classes under “protein folding” such as “chaperone-mediated protein folding” and others. The columns E and farther to the right are GO numbers representing the lineage of the particular term in that row starting with the primary class and continuing to the particular term in that row.
Because the trade-offs with varying threshold are most clear with the AP sets, we select those now for discussion. One biologically interesting feature emerging from varying the threshold consists of the more specific GO classes emerging from general classes already identified with a more stringent threshold. For example, in the “AP up” set “protein folding” was identified as a secondary class of interest by virtue of a very strong enrichment score. On relaxing the threshold more specific “child” classes emerged, such as “chaperone cofactor-dependent protein folding,” “endoplasmic protein folding,” and others. While these more specific classes are identified with less confidence than the overall “protein folding” class they are subsumed into, they do provide the most likely subclasses within protein folding to be biologically meaningful. Similarly, under the secondary class of “signal transduction” more specific subclasses such as “ER-nucleus signaling pathway,” “stress-activated MAPK cascade” and others emerge with modest threshold relaxation. This pattern is seen throughout the spreadsheet. Relaxing the threshold provides not only improved recall, but improved specificity, which will help in biological interpretation of GO enrichment results.
Summary
In general, when thresholds are varied, a tradeoff can plainly be seen between precision and recall. When looking at the specific GO classes that are returned at different choices of threshold a second tradeoff emerges, between generality and specificity. As threshold is relaxed some more general terms are revealed, but the greater effect is that more specific terms are revealed within general terms that were suggested at more stringent thresholds. These specific terms can help to provide a more focused interpretation of the biological results.
Conclusions
In this work, we have addressed two issues with the commonly used methods in the GO enrichment analysis: the relationship between resampling vs. Benjamini-Hochberg theory for estimating false discovery rate, and the arbitrariness of the p-value threshold for significance.
To consider resampling vs. Benjamini-Hochberg we made multiple independent comparisons. Four consisted of upregulated and downregulated genes separately for two different animal experiments. The fifth was an array of random gene lists (null sets). For the yeast ESR sets, which we use as our “standard” or canonical dataset, the two methods gave almost the same results for uncorrected p-value < 0.04 but diverged substantially for more relaxed p-values, with the BH underestimating the FDR. For the honeybee AP set the BH method underestimated the FDR significantly at all uncorrected p-values. For the random or null sets, we know that the correct FDR is 1, because there is no significance to the results. Yet for the null sets the BH method produced FDR < 1 by a large margin for the full range of uncorrected p-values. By contrast the resampling method, although noisy, does not systematically deviate from 1 in its prediction of FDR for the null sets.
We also considered the performance of the random resampling method on datasets created by corrupting the yeast ESR set by the addition of randomly selected genes, up to a level at which the dataset was 5/6 random genes and only 1/6 the original canonical dataset. The random resampling method combined with F-measure optimization selected the essentially the same uncorrected p-value for optimum threshold and recovered essentially the same enriched GO categories from the corrupted sets as from the original set, suggesting the method is able to extract signal from noise effectively.
It is of interest to consider why the BH method, while very useful and successful in some cases, sometimes fails. It is understood that the method will always work when the true inferences are independent. Strictly speaking, this will not be true of Gene Ontology data since many genes belong in multiple Gene Ontology categories. However, Benjamini and Yekutieli [22] showed that the method was still valid for dependent hypotheses provided that the related hypotheses that failed the null test showed positive regression of likelihoods. Consideration of the tree-like structure of Gene Ontology data [37] shows that this is true to a great extent. The branches of the tree-like structure clearly show positive regression within each branch; if a child category is enriched a parent is more likely to be enriched, and vice versa. Thus, as long as the enriched classes fall along a few well-delineated branches of the Gene Ontology tree structure, BH will work well. This appears to be largely the case for the yeast ESR set at relatively stringent p-values, in which the experimental intervention activated well-defined and annotated pathways. Thus, for relatively stringent cutoffs the BH FDR works well for this data set. However, some genes are members of categories in multiple branches, compromising the positive regression criterion. In the ESR set at relatively relaxed thresholds, and for the AP set at all thresholds, many Gene Ontology categories in different branches but with overlapping gene membership are represented in the returned categories, so that both independence and the positive regression criterion are violated. These considerations tell us why BH fails dramatically for the completely null sets. Neither independence nor positive regression are satisfied, except sometimes completely accidentally.
To deal with the issue of the arbitrariness of the threshold, we introduced optimization of F-measures so that both type I and II errors are considered. Unlike arbitrarily applied threshold of BH FDR < 0.05 or uncorrected p-value < 0.01 for any data set, the F-measure optimization approach provides a flexible threshold appropriate to the nature of the data set and the research question. If the data set is high in noise-to-signal ratio and the penalty for letting in false positive is high, we can choose to optimize F-measures weighing more on precision. If the data set fails to show much enrichment by commonly-applied methods, we can relax the threshold and extract the best information indicated by F-measure optimization.
A concern is that, because of the nature of the problem, we were forced to use a heuristic (albeit reasonable) method to estimate the false negatives, essential for calculating recall. We judge that this concern is more than offset by the advantage of enabling the replacement of an arbitrary threshold with F-measure optimization.
We found that for the particular class of problems dealt with in this paper the F-measure is as appropriate an optimization criterion as the Matthews Correlation Coefficient. A balanced weighting of precision and recall is an appropriate starting point for exploration. By examination of the specific GO categories that are returned by our analysis, we find that more stringent thresholds reveal preferentially the more general GO categories, while relaxing the threshold uncovers more specific classes contained within the general categories, Thus, varying the threshold not only reflects the tradeoff between precision and recall, but also between generality and specificity.
In the Supplementary Material we present the spreadsheet “AllGOTermsInTree_Final,” which shows all the specific GO terms returned in the work described in this paper. Also, in the Supplementary Material, we present our automatic pipeline integrating TopGO with resampling and analyzing functions to carry out the whole process of resampling, enrichment analysis, F-measure calculation, and representing results in tables and figures. The pipeline also includes a GOstats [15] module for easy analysis of under-represented terms and a STRINGdb [38] module for KEGG pathway terms. As demonstrated, the pipeline can also calculate analytical FDR including, but not limited to, the BH method.
In summary, we suggest replacing a fixed p-value for assigning a threshold in enrichment calculations with an optimal F-measure, which incorporates the well-established and well-defined concepts of precision and recall.
Author Contributions
WG and ZF both did parts of the calculation and worked together to initially develop the automated pipeline. WG did final enhancement and debugging. EJ suggested the overall direction of the work. WG wrote the first draft of the manuscript. All three authors worked on refining the manuscript.
Conflict of Interest Statement
The authors declare that the research was conducted in the absence of any commercial or financial relationships that could be construed as a potential conflict of interest.
Funding
We gratefully acknowledge support from R01GM098736 from National Institute of General Medical Science to EJ.
Acknowledgments
We gratefully acknowledge useful discussions with especially Dr. Enes Kotil and Santiago Nunez-Corrales and also other members of our research group in the Beckman Institute. Professor Saurabh Sinha of our Computer Science Department provided useful discussions and wise advice. An earlier version of the paper was posted on the preprint server BioRxiv [39]. We thank those who commented on the preprint and thereby contributed to the final paper, and reviewers whose suggestions have resulted in improvements in the pape4.
Supplementary Material
The Supplementary Material for this article can be found online at: https://www.frontiersin.org/articles/10.3389/fams.2019.00020/full#supplementary-material
Additional File 1. AllGOTermsInTree_Final.xlsx This is the spreadsheet showing all enriched terms at thresholds: BH FDR < 0.05, optimal F0.5, and optimal F1. The terms are arranged by the primary and second-order parent terms.
Additional File 2. pipelinemanual.docx “A TopGO- and GOstats-based automated pipeline for GO enrichment analysis using F-measure optimization based on resampling and traditional calculation.” This is a word document giving detailed description of how to run the pipeline for resampling or analytical FDR calculation and obtain thresholds maximizing F-measures.
Additional File 3. pipeline.gz This file contains source codes of the pipeline and the ESR and AP data sets for demo runs.
Additional File 4. mccf.docx This file shows the mathematical proof that MCC1 = F1 when precision equals recall.
References
1. Ashburner M, Ball CA, Blake JA, Botstein D, Butler H, Cherry JM, et al. Gene Ontology: tool for the unification of biology. Nat Genet. (2000) 25:25–9. doi: 10.1038/75556
2. Huang da W, Sherman BT, Lempicki RA. Bioinformatics enrichment tools: paths toward the comprehensive functional analysis of large gene lists. Nucleic Acids Res. (2009) 37:1–13. doi: 10.1093/nar/gkn923
3. Eden E, Navon R, Steinfeld I, Lipson D, Yakhini Z. GOrilla: a tool for discovery and visualization of enriched GO terms in ranked gene lists. BMC Bioinform. (2009) 10:48. doi: 10.1186/1471-2105-10-48
4. Huang da W, Sherman BT, Lempicki RA. Systematic and integrative analysis of large gene lists using DAVID bioinformatics resources. Nat Protoc. (2009) 4:44–57. doi: 10.1038/nprot.2008.211
5. Reimand J, Arak T, Adler P, Kolberg L, Reisberg S, Peterson H, et al. g:Profiler—a web server for functional interpretation of gene lists (2016 update). Nucleic Acids Res. (2016) 44:W83–9. doi: 10.1093/nar/gkw199
6. Götz S, García-Gómez JM, Terol J, Williams TD, Nagaraj SH, Nueda MJ, et al. High-throughput functional annotation and data mining with the Blast2GO suite. Nucleic Acids Res. (2008). 36:3420–35. doi: 10.1093/nar/gkn176
7. Zeeberg BR, Qin H, Narasimhan S, Sunshine M, Cao H, Kane DW, et al. High-throughput GoMiner, an ‘industrial-strength' integrative gene ontology tool for interpretation of multiple-microarray experiments, with application to studies of common variable immune deficiency (CVID). BMC Bioinform. (2005) 6:168. doi: 10.1186/1471-2105-6-168
8. Al-Shahrour F, Minguez P, Tárraga J, Montaner D, Alloza E, Vaquerizas JM, et al. BABELOMICS: a systems biology perspective in the functional annotation of genome-scale experiments. Nucleic Acids Res. (2006) 34:W472–6. doi: 10.1093/nar/gkl172
9. Al-Shahrour F, Díaz-Uriarte R, Dopazo J. FatiGO: a web tool for finding significant associations of Gene Ontology terms with groups of genes. Bioinformatics. (2004) 20:578–80. doi: 10.1093/bioinformatics/btg455
10. Subramanian A, Tamayo P, Mootha VK, Mukherjee S, Ebert BL, Gillette MA, et al. Gene set enrichment analysis: a knowledge-based approach for interpreting genome-wide expression profiles. Proc Natl Acad Sci USA. (2005): 102:15545–50. doi: 10.1073/pnas.0506580102
11. Subramanian A, Kuehn H, Gould J, Tamayo P, Mesirov JP. GSEA-P: A desktop application for gene set enrichment analysis. Bioinformatics. (2007) 23:3251–3. doi: 10.1093/bioinformatics/btm369
12. Ballouz S, Pavlidis P, Gillis J. Using predictive specificity to determine when gene set analysis is biologically meaningful. Nucleic Acids Res. (2016) 45:gkw957 doi: 10.1093/nar/gkw957
13. Alexa A, Rahnenführer J, Lengauer T. Improved scoring of functional groups from gene expression data by decorrelating GO graph structure. Bioinformatics. (2006) 22:1600–07. doi: 10.1093/bioinformatics/btl140
14. Alexa A, Rahnenfuhrer J. topGO: topGO: Enrichment Analysis for Gene Ontology. R package version 2.18.0. (2010).
15. Falcon S, Gentleman R. Using GOstats to test gene lists for GO term association. Bioinformatics. (2007) 23:257–8. doi: 10.1093/bioinformatics/btl567
16. Maere S, Heymans K, Kuiper M. BiNGO: a Cytoscape plugin to assess overrepresentation of gene ontology categories in biological networks. Bioinformatics. (2005) 21:3448–9. doi: 10.1093/bioinformatics/bti551
17. Wasserstein RL, Nicole AL. The ASA's statement on p-values: context, process, and purpose. Am Statistic. (2016) 70:129–33. doi: 10.1080/00031305.2016.1154108
18. Rivals I, Personnaz L, Taing L, Potier MC. Enrichment or depletion of a GO category within a class of genes: which test? Bioinformatics. (2007) 23:401–7. doi: 10.1093/bioinformatics/btl633
19. Meyer D. Modified randomization tests for nonparametric hypotheses. Ann Mathemat Stat. (1957) 28:181–7.
20. Benjamini Y, Hochberg Y. Controlling the false discovery rate: a practical and powerful approach to multiple testing. J R Stat Soc B. (1995) 57:289–300. doi: 10.1111/j.2517-6161.1995.tb02031.x
21. Zheng Q, Wang XJ. GOEAST: a web-based software toolkit for Gene Ontology enrichment analysis. Nucleic Acids Res. (2008) 36:W358–63. doi: 10.1093/nar/gkn276
22. Benjamini Y, Yekutieli D. The control of the false discovery rate in multiple testing under depencency. Ann Stat. (2001) 29:1165–88. doi: 10.1214/aos/1013699998
23. Bogomolov M, Peterson CB, Benjamini Y, Sabatti C. Testing hypotheses on a tree: new error rates and controlling strategies. arXiv:1705.07529 (2017).
24. Blüthgen N, Brand K, Cajavec B, Swat M, Herzel H, Beule D. Biological profiling of gene groups utilizing gene ontology. Genome Informatics. (2005) 16:106–115.
25. Kim SY, Volsky DJ. Volsky. PAGE: parametric analysis of gene set enrichment. BMC Bioinform. (2005) 6:144. doi: 10.1186/1471-2105-6-144
27. Rhee SY, Wood V, Dolinski K, Draghici S. Use and misuse of the gene ontology annotations. Nat Rev Genet. (2008) 9:509–15. doi: 10.1038/nrg2363
28. Waegeman W, Krzysztof D, Arkadiusz J, Weiwei C, Eyke H. On the bayes-optimality of f-measure maximizers. J Mach Learn Res. (2014) 15:3333–88.
29. Powers DMW. Evaluation: from precision, recall and F-Measure To Roc, informedness, markedness and correlation. J Mach Learn Technol. (2011) 2:37–63.
30. Matthews BW. Comparison of the predicted and observed secondary structure of T4 phage lysozyme. Biochim Biophys Acta. (1975) 405:442–51.
31. Chen AH, Ge W, Metcalf W, Jakobsson E, Mainzer LS, Lipka AE. An assessment of true and false positive detection rates of stepwise epistatic model selection as a function of sample size and number of markers. Heredity. (2018) 122:660–671. doi: 10.1038/s41437-018-0162-2
32. Eisen MB, Spellman PT, Brown PO, Botstein D. Cluster analysis and display of genome-wide expression patterns. Proc Natl Acad Sci USA. (1998) 95:14863–8.
33. Ball CA, Dolinski K, Dwight SS, Harris MA, Issel-Tarver L, Kasarskis A, et al. Integrating functional genomic information into the Saccharomyces genome database. Nucleic Acids Res. (2000) 28:77–80. doi: 10.1093/nar/28.1.77
34. Gasch AP, Spellman PT, Kao CM, Carmel-Harel O, Eisen MB, Storz G. Genomic expression programs in the response of yeast cells to environmental changes. Mol Biol Cell. (2000) 11:4241–57. doi: 10.1091/mbc.11.12.4241
35. Alaux C, Sinha S, Hasadsri L, Hunt GJ, Guzmán-Novoa E, DeGrandi-Hoffman G, et al. Honey bee aggression supports a link between gene regulation and behavioral evolution. Proc Natl Acad Sci USA. (2009) 106:15400–5. doi: 10.1073/pnas.0907043106
36. Liu H, Robinson GE, Jakobsson E. Conservation in mammals of genes associated with aggression-related behavioral phenotypes in honey bees. PLoS Comput Biol. (2016) 12:e1004921. doi: 10.1371/journal.pcbi.1004921
37. Zhang B, Schmoyer D, Kirov S, Snoddy J. GOTree Machine (GOTM): a web-based platform for interpreting sets of interesting genes using Gene Ontology hierarchies. BMC Bioinform. (2004) 5:16. doi: 10.1186/1471-2105-5-16
38. Franceschini A, Szklarczyk D, Frankild S, Kuhn M, Simonovic M, Roth A, et al. STRING v9. 1: protein-protein interaction networks, with increased coverage and integration. Nucleic Acids Res. (2012) 41:D808–15. doi: 10.1093/nar/gks1094
Keywords: gene ontology, MCC, resampling, F-measure, false discovery rate, microarray data analysis
Citation: Ge W, Fazal Z and Jakobsson E (2019) Using Optimal F-Measure and Random Resampling in Gene Ontology Enrichment Calculations. Front. Appl. Math. Stat. 5:20. doi: 10.3389/fams.2019.00020
Received: 27 June 2018; Accepted: 02 April 2019;
Published: 24 April 2019.
Edited by:
Vittorio Romano, Università Degli Studi di Catania, ItalyReviewed by:
Vincenzo Bonnici, University of Verona, ItalyMarzio Pennisi, Università Degli Studi di Catania, Italy
Copyright © 2019 Ge, Fazal and Jakobsson. This is an open-access article distributed under the terms of the Creative Commons Attribution License (CC BY). The use, distribution or reproduction in other forums is permitted, provided the original author(s) and the copyright owner(s) are credited and that the original publication in this journal is cited, in accordance with accepted academic practice. No use, distribution or reproduction is permitted which does not comply with these terms.
*Correspondence: Eric Jakobsson, amFrZUBpbGxpbm9pcy5lZHU=