 Ender Baykut
 Veysel Kula
- 1Department of Management in English, Afyon Kocatepe University, Afyonkarahisar, Turkey
- 2Department of International Trade and Finance, Afyon Kocatepe University, Afyonkarahisar, Turkey
This study aims at empirically investigating the volatility and shock transmission patterns between the BIST 100 Index and the relatively new BIST Sustainability Index, which is a platform for companies with high performance on the international sustainability criteria. Utilizing 678 daily data from 05/11/2014, the day the XSURD Index was launched, to 31/08/2017, the analysis employed a bivariate BEKK-GARCH (1,1) model. The findings indicate the existence of bidirectional volatility spillovers between two indices. Additionally, current volatility is affected by its past volatility for each index. As for the shock transmission, the BIST Sustainability Index is responsive to both its shocks and shocks arriving from the BIST 100 Index. However, the BIST 100 Index responds only to its shocks without any significant shock transmission from the BIST Sustainability Index.
Introduction
The volatility of financial time series is a subject that is extensively investigated in studies on finance. Time series data usually exhibit autocorrelated heteroscedasticity, which is autocorrelated unequal variance over different periods. Since the development of the “Autoregressive Conditional Heteroskedasticity” (ARCH) model in 1982 by Engle, which was modified by Bollerslev [1] as generalized ARCH (GARCH), the volatility clustering has constituted the substantial part of the related studies. Initially appeared as univariate in approach, the line of studies then is extended to multivariate GARCH (MGARCH) models, enabling the analysis of co-movement of financial returns resulting from the interaction of variables. This study aims at investigating the volatility transmission between the long-existing BIST 100 Index and relatively new BIST Sustainability Index in Istanbul Stock Exchange, Turkey. The BIST 100 Index, which has been in use since January 1986, is the fundamental index representing the Istanbul Stock Exchange. On the other hand, the BIST Sustainability Index, launched in November 2014, is a promising platform for companies with high performance on the international sustainability criteria.
Stock exchanges with corporate governance and sustainability practices are likely to attract more investment. Corporate sustainability could increase the reputation of companies, help them gain the public's trust, and ultimately enhance the brand image of companies. The concept of Sustainability Index, which was first launched in the world in 1990, is one of the indices gaining importance in both developed and developing countries. The increasing number of traded companies listed in the sustainability indices reflects the interest of investors and companies in these indices. Long after the official announcement of the Dow Jones Sustainability Index in 1999, Turkey established BIST Sustainability Index (XSURD) in 2014. The XSURD Index was started to be calculated in November 2014 with a total of 15 companies, and the closing value of the first day was determined as 98.020. The number of companies traded in the index increased year by year, reaching 44 by the end of 2017.
The XSURD Index aims to provide a benchmark for Borsa Istanbul companies with high performance on corporate sustainability as well as increasing the awareness, knowledge, and practice on sustainability in Turkey. XSURD Index provides a competitive measure to Turkish companies managing their corporate risks and opportunities effectively [2]. Companies listing on the XSURD Index may have the ability to fight more effectively and efficiently with the risks and manage their opportunities, subsequently converting them to maximized benefits. As opportunities or risks may come from both national and international sources, companies can evaluate their performance not only locally but also globally. Companies can easily find investors and funds from international markets by affecting global investors. Hence, the Sustainability Index companies could increase their visibility and prestige.
Based on the literature review, there seems to be no study on the univariate volatility structure or the volatility transmission of the XSURD Index. This study fills a gap in the literature by investigating the volatility transmission between the XSURD and BIST 100 indices. As the BIST 100 Index is regarded as the representative of Istanbul Stock Exchange, the results of the study would appear to be interesting in displaying the volatility interaction between the long-existing traditional index and a new, promising one.
The rest of the paper is organized as follows. The following section provides the literature review. The third section focuses on the methodology and data description, while the fourth section shows the results and findings of econometric models applied. The final section presents the discussion and advice for further studies.
Literature Review
The volatility spillover between indices and commodities is one of the most common studies in the finance literature. Some of these studies [3–9] focus on volatility spillover among developed countries, while others [10–18] assess volatility spillover interaction between developed countries and developing countries. The results obtained from these studies, which mainly use MGARCH models, show that there is generally unilateral volatility spread from the developed countries to developing countries. As one of the developing countries, Turkey naturally has been the subject of volatility spillover studies, too (for example, [19–27]). The studies examining the volatility spillover between the indices of the Borsa Istanbul and the stock exchanges of developed countries generally point out a unilateral volatility spread.
Gok and Kalayci [26], as one of these studies, analyzed volatility spillover between Turkey and the US stock markets by using Johansen Cointegration and VAR-EGARCH BEKK models. Using daily closing data set of S&P 500 and BIST-30 indices from 2010 to 2012, the findings obtained from the study indicate that there is unilateral volatility spread from the S&P 500 Index to BIST-30 Index. This result exhibits consistency with the findings of Korkmaz and Çevik [25] who used the GRJ-GARCH model to measure the impact of US financial markets on emerging markets including Turkey. According to the findings, there is unilateral volatility spillover from stock exchanges of US to the stock exchange of Turkey. Bayramoglu and Abasiz [27] examined the volatility spillover among the stock markets in the MSCI Index of emerging markets. The results obtained from the study using daily data set between 2013 and 2016 showed volatility spillover between Turkey and Brazil. Ozer [28] examined the volatility spillover between stock returns and oil prices over a sample of developed and developing countries. As a result of the study, volatility spillover is observed from oil prices to stock returns especially in developing countries including Turkey.
The comparison of financial performance and volatility spillover of Sustainability Index with traditional indices is also an issue inquired by several studies (such as [29–38]) in recent years. Sariannidis et al. [33] investigated the effects of macroeconomic variables on Dow Jones Sustainability and Dow Jones Wilshire 5000 indices by employing the GARCH model that used monthly data between 2000 and 2008. The findings indicated that the Sustainability Index is less affected by macroeconomic variables than the Wilshire index. Another study addressing the volatility structure of the Dow Jones Sustainability Index is done by Hoti et al. [32]. Based on the results of the ARMA-GARCH model, bidirectional volatility spillover between Dow Jones Sustainability Index and Dow Jones finance indices was observed. Ortas et al. [34] analyzed, with the BEKK-GARCH model, volatility spillover effects between the IBEX Index and the Sustainability Index, which are traded on the Spanish Stock Exchange. As the findings show, the Sustainability Index performance is better than the IBEX Index. Besides, both volatility and risk level of the Sustainability Index was found to be lower than the other stock indices. Herrera [37] obtained a similar result for the Mexican stock exchange by comparing the risk and volatility level of traditional and sustainability indices. Using monthly data for the period between 1995 and 2012, it was seen that the risk and volatility of the Sustainability Index were lower than the other indices. Adams et al. [35] compared the volatility structure of the S&P 500 and Dow Jones Sustainability Indices and found similar results with Herrera [37]. Another study conducted by Sudha [36] focused on the risk-return and volatility analysis of the Indian Stock Exchange Sustainability Index (ESG). According to the findings, the annual average return of ESG is higher than the other traditional indices of India such as Nifty and CNX-500. In addition, the volatility of the ESG index is lower than the other indices. The fact that the volatility of the Sustainability Index is lower than traditional indices is consistent with the studies [29, 30, 34, 38] conducted on various indices in several countries.
On the XSURD of Turkey, there are a number of studies [39–53]. Tükenmez and Gençyürek [39] compared the share prices of companies that are listed in the Sustainability Index (XSURD) before and after entering the index. Based on the findings, it was seen that the market value of the companies fell after entering the index. Additionally, there is no significant difference between the Sustainability Index and other indices in terms of expected returns. However, Erdur and Kara [40] reported just the opposite findings. They compared share prices of index companies before and after entering the XSURD Index and found out that share prices increased after being traded in the Sustainability Index. Citak and Ersoy [41] examined the financial performance of companies listed in the Sustainability Index and non-listed companies. The results did not show any difference in the rate of return between indices while the market to book value ratio of listed companies was higher than non-listed companies. Gok and Özdemir [47] aimed at comparing the performance of XSURD and BIST 100 indices based on Sharpe Ratio and Jenson Alpha Coefficient as well as determining the volatility structures of both indices by using daily closing values between 2014 and 2016. It was found that the Sharpe Ratio of XSURD Index was higher than the BIST 100 Index. Furthermore, Jenson Alpha Coefficient was positive for both indices, but there was no statistically significant difference between these two indices. The EGARCH (1,1) model was determined as a fitting model for both indices representing the volatility structure. Moreover, volatility persistence of both indices was high and the XUSURD Index did not have an encouraging feature for investors.
In addition to these studies, there are studies focusing on several aspects of the XSURD Index. For example, Gençoglu and Aytac [43] analyzed the environmental and social activities of XSURD Index companies. Kocamiş and Yildirim [42] worked on the benefits of the Corporate Sustainability Report for the companies. The efficiency level of the companies listed in the XSURD Index is ranked by Gurbuz and Dumlu [53]. Donmez and Erol [44] discussed the intellectual capital of XSURD listed companies. While Ozdemir and Pamukçu [45] analyzed corporate sustainability reports of companies before and after entering to the XSURD Index, Araci and Yüksel [46] focused on the sustainable value-added of the companies in the XSURD Index. Moreover, the financial performance of the companies listed in the XUSURD Index is investigated by studies such as Onder [48], Altinay et al. [49], Aydin [50], Akyuz and Yeşil [51], and Unal and Yüksel [52].
As the literature review indicates, there seems to be no study on the way the BIST volatility interacts with the volatility of another index or commodity. Analyzing the volatility spillover between the XSURD Index and the BIST 100 Index, the main index representing the Istanbul Stock Exchange constitutes the originality of this study.
Methodology and Data Description
The BEKK MGARCH specification of the conditional covariance matrix is employed in this study to analyze volatility spillover effects between the BIST 100 and XSURD indices. MGARCH models, in essence, are very similar to univariate models. The only significant difference between them is that the equations of multivariate models show how covariances behave over time. The GARCH-BEKK model is one of the MGARCH models proposed by Engle and Kroner [54]. The BEKK model demonstrates the interaction between the return series in variance equation and provides a positive definition constraint by functioning in a quadratic form. Besides, the model allows for volatility spillover across markets or indices and complies with constant correlation. Also, the GARCH-BEKK model allows for dynamic dependence between the volatility series. The methodology reduces the number of parameters estimated by restricting the parameter matrices to be diagonal and ensuring that the conditional covariance matrix is always positive definite [54–58].
The BEKK parameterization is shown as;
In this equation, Aki, i = 1,… q, k = 1,… k, and Bkjj = 1,… q, k = 1,.. k are N×N matrices. ARCH effect (Shock Spillover) is represented by the A′ term while B′ indicates GARCH effect (Volatility Spillover). As long as the constant term CC′ is positive, Ht is guaranteed to be non-negative; in other words, BEKK guarantees positive definiteness, so the only remaining issue is the number of parameters (), which grows significantly faster in the number of securities.
The bivariate BEKK GARCH (1,1) can be shown as follows:
In this study, the empirical analysis was performed on the XSURD and BIST 100 indices to investigate the volatility spillover effect between the indices. The data set covers 678 daily closing values of both indices between 5 November 2014 and 28 July 2017. Data set is procured from the Marketing Department of BIST. The return series of both indices is created by taking the natural logarithm of the daily return which is defined as (Pn/Pn − 1).
Findings
As the first step of the analysis, the return series of both XSURD and BIST 100 indices were generated. The examination of the log return series shows that indices follow a fluctuating structure and they exhibit volatility clustering. As can be seen from the Graphs 1,2, the return series of both indices are extremely volatile throughout 2014–2017. The appearing volatility clustering in both series is a feature of volatility. This refers to the probability of heteroscedasticity in the indices, hence justifying the performance of ARCH-LM to statistically test it.
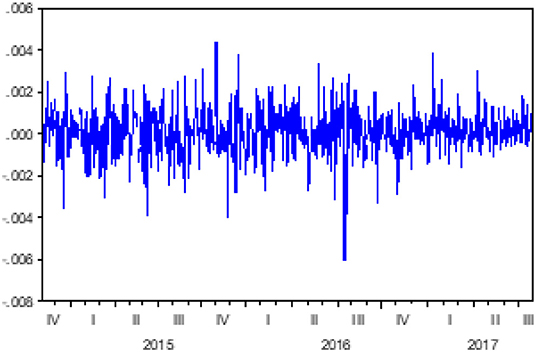
Graph 1. Return series of XSURD index.
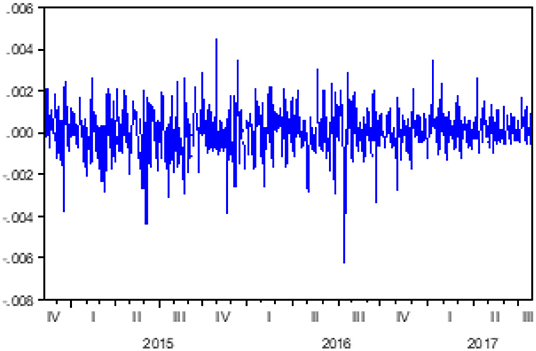
Graph 2. Return series of the BIST 100 index.
In the next phase of the analysis, the descriptive statistics of the series were calculated. As stated in Table 1, the total number of observations of the XSURD and BIST 100 series is 678. Over the period (2014–2016) under the analysis, both indices have positive daily mean returns.
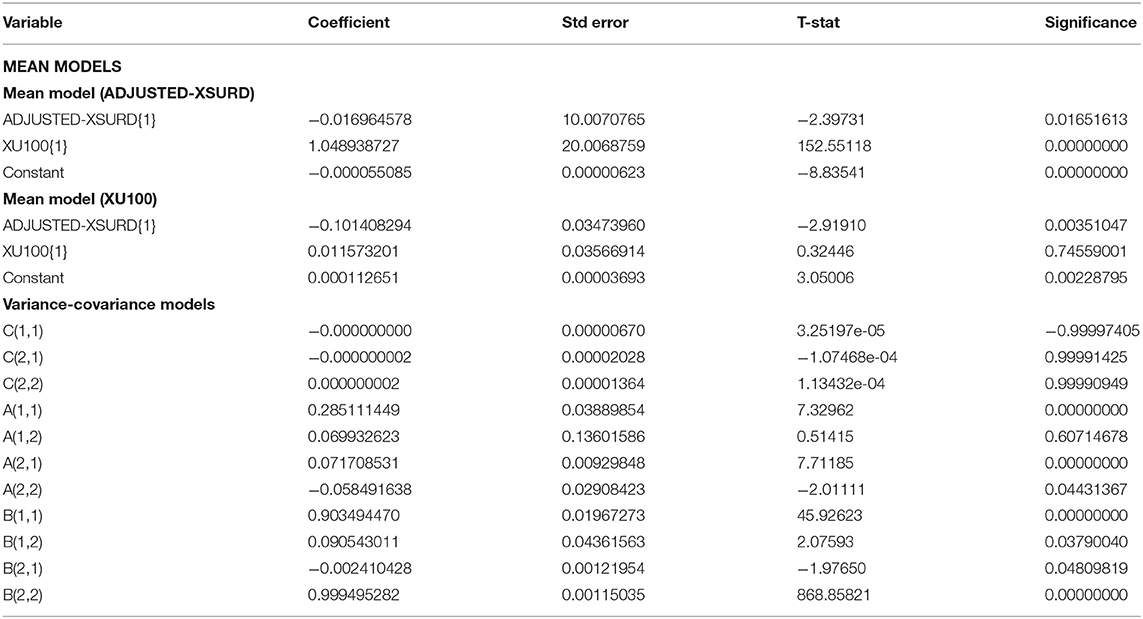
Table 1. Descriptive statistics of XSURD and BIST 100 return series.
Over the period, the average daily log return is 0.000573 for the XSURD Index, while mean daily log-return of the BIST 100 Index was calculated as 0.0000485. The maximum log return is 0.4381 and 0.4498% for the XSURD Index and BIST 100 Index, respectively. The minimum log returns were calculated as 0.6073% for the XSURD Index and 0.6254% for the BIST 100 Index. The large differences between the minimum and maximum returns of the indices appear to indicate that there might be heteroscedasticity in both return series. In addition, the standard deviations of the indices for the relevant period were calculated as 0.1153 and 0.1096% for the XSURD Index and BIST 100 Index, respectively. The skewness coefficient (−0.233157) shows that the log return series of the XSURD Index is skewed to the left and its right tail is longer. A similar result (−0.417941) is obtained for the BIST 100 Index. The Kurtosis coefficients are 5.027539 for the XSURD Index, and 5.821940 for the BIST 100 Index, which is higher than the critical value of three. These higher results show that the series is steeper than the normal distribution. In the analysis, the Jarque–Bera test was conducted to see whether the series show normal distribution or not. The Jarque–Bera values for the indices (XSURD: 122.2762; BIST 100: 244.7027) are higher than the critical value of χ2 statistic, which is 5.99, which indicates that the return series of the study were not normally distributed.
In the next stage of the analysis, the unit root tests were performed, the results of which are shown in Table 2.
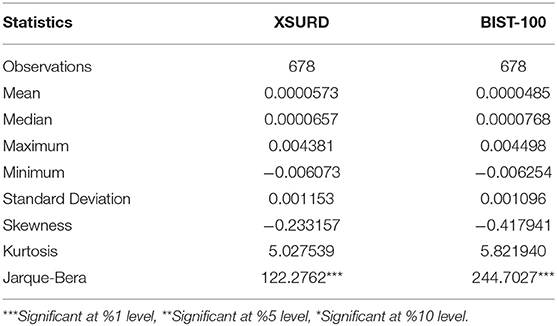
Table 2. Unit root and diagnostic tests results.
The ADF and PP unit root tests of the XSURD (test statistic of ADF and PP respectively: −25,44354 and −25,59469, p < 0.01) and BIST 100 (test statistic of ADF and PP respectively: −25,54746 and −25,61098, p <0.01) indices with fixed and trend effect reveals that series have no unit roots. In order to see whether there is heteroscedasticity in the returns of the series, the ARCH-LM model applied up to the fifth lag of the returns. According to Engle [59] if the observed R2 is less than the critical χ2 value, then it is possible to claim that there is no heteroscedasticity in returns. As seen in Table 2, the results turned out to be the opposite. This means that the return series is assumed heteroscedastic, allowing the use of GARCH family models to assess the volatility of returns.
As of July 2017, 39 of the firms in the Sustainability Index are also listed in the BIST 100 Index. It is plausible to assert that the return performance of those Sustainability Index firms might reflect the performance of the BIST 100 Index. In order to eliminate the effect of BIST 100 Index returns on the Sustainability Index returns, the following regression equation is used:
The error series (ε) obtained from the above regression model represents the adjusted Sustainability Index income series cleared off the effects of market returns. The set of adjusted Sustainability Index returns produced by this method is used in the following stage of the analysis to obtain the volatility models. The MGARCH analysis is performed employing WinRATS 9.2 version.
In the mean model for the Sustainability Index, as reported in the upper part of Table 3, the mean value of the index is significantly affected by both its own previous lagged mean value and the lagged mean value of the BIST 100 Index. As for the BIST 100 Index mean model, the mean value is significantly affected only by the lagged mean value of the Sustainability Index. However, the mean value of the index is not influenced by its own lagged value.
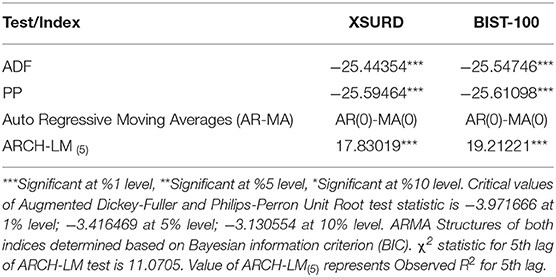
Table 3. Mean and variance equation estimation of the bivariate VAR (1)-GARCH (1,1)-BEKK model.
In the output, C(i,j) is the variance constant, while the elements of A(i,j) and B(i,j) are used to represent the lagged squared residual (ARCH) coefficient and the lagged variance (GARCH) coefficient, respectively.
The off-diagonal elements in the model show the effect of one variable on the other, which is called spillover effects. In other words, spillover effects mean that shocks or volatility in one component affect the variance of another. Regarding co-variance, there are two spillover effects in the model: ARCH-spillover effect and GARCH-spillover effect. ARCH-spillover effect, represented by A(i,j), is also called as shock spillover effect (information or news spillovers). The other name for the GARCH-spillover effect, reported in the output as B(i,j), is volatility spillover effect.
A(1,2) is the ARCH effect that measures the effect of the residual of the first variable on the second variable. The off-diagonal element of A(2,1) in the model is statistically significant (t-value: 7.71185, p < 0.01). This is the indication of the shock spillover effect from the BIST 100 Index to the Sustainability Index. However, there is no shock spillover effect from the Sustainability Index to the BIST 100, as reflected by the insignificant A(1,2) coefficient.
Diagonal A's [A(1,1) and A(2,2)] in the BEKK model represent the own ARCH effect. In the model, both A(1,1) and A(2,2) are significant, indicating that the own past shocks of the Sustainability Index and the BIST 100 Index have significant impacts on the current behavior of the indices.
As for the volatility effects, the diagonal and off-diagonal elements of B matrices are all significant. The significant B(1,1) and B(2,2) coefficients point out the existence of own GARCH effects for both indices. The cross-index volatility spillover effects are validated by significant B(1,2) and B(2,1) terms. In other words, there is a bidirectional volatility spillover effect from the Sustainability Index to the BIST 100 Index and vice versa.
Conclusion
As there seems to be no prior study on the volatility structure and volatility transmission of the BIST Sustainability Index, this study is the first attempt in this regard. The study aims to investigate the volatility spillover between a new, promising BIST Sustainability Index (XSURD) and the traditional BIST 100 (XU100) Index by utilizing the daily closing values of the indices from the day the XSURD Index was launched to the end of July 2017.
The findings of the study suggest important patterns for both ARCH and GARCH effects. The ARCH effects measured by the coefficients of “A” elements provide a measure of the response of an index to both its lagged shocks and the lagged shocks in the other index. The Sustainability Index is significantly influenced by its shocks and the shocks from the BIST 100 Index. However, the BIST 100 Index is responsive only to its shocks, with no effect from the Sustainability Index. This indicates that while information originating in the BIST 100 Index has a significant effect on the Sustainability Index, information coming from the Sustainability Index has no significant effect on the BIST 100 Index. The unidirectional shock spillover from the BIST 100 Index to the Sustainability Index might stem from the fact that the BIST 100 Index is a relatively well-rooted index covering more companies.
The GARCH effect displays a long-term measure of the volatility without the shock effect. The coefficients of “B” elements show that each index is responsive to its past volatility. Additionally, there is bidirectional volatility spillover between the two indices. This might be the result of a probable long-term linkage between the markets.
The volatility of the BIST Sustainability Index is an important research subject for future studies. The transmission mechanisms of this index with other subindices such as the BIST Corporate Governance Index might reveal interesting results. Similarly, future studies might focus on the linkages between the volatility of this index and major commodities or main stock exchange indices over the world.
Data Availability Statement
The data sets generated for this study are available on request to the corresponding author.
Author Contributions
EB organized and summarized previous studies', related subjects, and collected the data set. VK applied the volatility models in order to get results. Introduction, findings, and the conclusion part of the study were prepared by both authors.
Conflict of Interest
The authors declare that the research was conducted in the absence of any commercial or financial relationships that could be construed as a potential conflict of interest.
Acknowledgments
This paper is an extended and full version of a paper presented at III. IASOS International Applied Social Sciences Congress. The abstract proceedings of III. IASOS can be found at: https://iasoscongress.org/2018/tr/index.php. The paper was presented as an abstract version, and it is the first time we submitted our full paper for any journal for processing.
References
1. Bollerslev T. Generalised autoregressive conditional heteroscedasticity. J Econ. (1986) 31:307–27. doi: 10.1016/0304-4076(86)90063-1
2. BIST (2018). Available online at: http://www.borsaistanbul.com/endeksler/bist-pay-endeksleri/surdurulebilirlik-endeksi (accessed October 1, 2018).
3. Eun CS, Shim S. International transmission of stock market movements. J Financ Quant Anal. (1989) 24:241–56. doi: 10.2307/2330774
4. Hamao Y, Masulis RW, Ng V. Correlations in price changes and volatility across international stock markets. Rev Financ Stud. (1990) 3:281–307. doi: 10.1093/rfs/3.2.281
5. Koch PD, Koch TW. Evolution in dynamic linkages across daily national stock indexes. J Int Money Financ. (1991) 10:231–51. doi: 10.1016/0261-5606(91)90037-K
6. Lin WL, Engle RF, Ito T. Do bulls and bears move across borders? Int Transm Stock Returns Volatil Rev Financ Stud. (1994) 7:507–38. doi: 10.1093/rfs/7.3.507
7. Koutmos G, Booth GG. Asymmetric volatility transmission in international stock markets. J Int Money Financ. (1995) 14:747–62. doi: 10.1016/0261-5606(95)00031-3
8. Bekiros SD. Contagion, decoupling and the spillover effects of the US financial crisis: evidence from the BRIC markets. Int Rev Financ Anal. (2014) 33:58–69. doi: 10.1016/j.irfa.2013.07.007
9. Savva CS, Osborn DR, Gill L. Spillovers and correlations between major European stock markets and US: the role of the Euro. Appl Financ Econ. (2009) 19:1595–604. doi: 10.1080/09603100802599563
10. Booth GG, Martikainen T, Tse Y. Price and volatility spillovers in Scandinavian stock markets. J Bank Financ. (1997) 21:811–23. doi: 10.1016/S0378-4266(97)00006-X
11. Ln F, Kim S, Yoon JH, Viney C. Dynamic interdependence and volatility transmission of Asian stock markets: evidence from the Asian crisis. Int Rev Finan Analy. (2001) 10:87–96. doi: 10.1016/S1057-5219(00)00045-4
12. Baur D, Jung RC. Return and volatility linkages between the US and the German Stock Market. J Int Money Financ. (2006) 25:598–613. doi: 10.1016/j.jimonfin.2005.11.010
13. Savva C. International stock markets interactions and conditional correlations. J Int Financ Market Inst Money. (2009) 19:645–61. doi: 10.1016/j.intfin.2008.11.001
14. Shih FM, Wang MC. Dynamic volatility spillover effects. J Hum Res Adult Learn. (2009) 5:45–57.Available online at: http://www.hraljournal.com/Page/6%20Feng-Ming%20Shih.pdf
15. Beirne J, Caporale GM, Schulze-Ghattas M, Spagnolo N. Global and regional spillovers in emerging stock markets: a multivariate GARCH-in-mean analysis. Emerg Market Rev. (2010) 11:250–60. doi: 10.1016/j.ememar.2010.05.002
16. Li Y, Giles DE. Modelling volatility spillover effects between developed stock markets and Asian emerging stock markets. Int J Financ Econ. (2015) 20:155–77. doi: 10.1002/ijfe.1506
17. Ozen E, Ozdemir L, Grima S, Bezzina F. Investigating causality effects in return volatility among five major futures markets in European countries with a Mediterranean connection. J Financ Manag Market Inst. (2014) 2:79–92. doi: 10.12831/78759
18. Peng CL, Chung CF, Tsai CC, Wang CT. Exploring the returns and volatility spillover effect in Taiwan and Japan stock markets. Asian Econ Financ Rev. (2017) 7:175–87. doi: 10.18488/journal.aefr/2017.7.2/102.2.175.187
19. Ozçam M. International Market Risk at Developed and Developing Countries (in Turkish). (2004). Available online at: http://www.spk.gov.tr/yayingoster.aspx?yid=941&ct=f&action=displayfile (accessed October 5, 2018).
20. Tastan H. Dynamic Interdependence and Volatility Transmission in Turkish and European Equity Markets. Working Papers 2005/10, Turkish Economic Association (2005). Available online at: https://ideas.repec.org/p/tek/wpaper/2005-10.html
21. Akar C. Volatility in financial markets: IMKB case (in Turkish) (Ph.D. dissertation). Uludag University, Bursa, Turkey (2006).
22. Balaban E, Bayar A, Faff R. Forecasting stock market volatility: further international evidence. Eur J Financ. (2006) 12:171–88. doi: 10.1080/13518470500146082
23. Mutan OC. Collective Movements in International Stock Markets (in Turkish). (2008). Available online at: http://www.spk.gov.tr/yayin. aspx?type = yay03 (accessed October 5, 2018).
24. Yalama A. The volatility structure of ISE 100, world stock markets and volatility spill over (in Turkish) (Ph.D. dissertation). Anadolu University, Eskişehir, Turkey (2008).
25. Korkmaz T, Çevik EI. Volatility spillover effect from volatility implied index to emerging markets (in Turkish). J BRSA Bank Financ Market. (2009) 3:87–105. Available online at: https://www.bddk.org.tr/ContentBddk/BddkDergiEng/dergi_0006_06.pdf
26. Gok I, Kalayci S. International interactions between index futures markets: testing meteor shower and heat wave hypotheses on Turkey and US markets (in Turkish). Bus Econ Res J. (2013) 6:39–53. Available online at: http://www.berjournal.com/wp-content/plugins/downloads-manager/upload/BERJ%206(4)15%20Article%203%20pp.39-53.pdf
27. Bayramoglu MF, Abasiz T. The analysis of volatility spillover effect between emerging market indices (in Turkish). J Account Financ. (2017) 2017:83–199. Available online at: http://www.journal.mufad.org.tr/attachments/article/887/10.pdf
28. Ozer A. Volatility spillovers between oil prices and stock returns: developed and developing countries case. Int J Manag Econ Bus. (2017) 1:654–62. doi: 10.17130/ijmeb.2017ICMEB1735476
29. Hoti S, McAleer M, Pauwels LL. Modelling environmental risk. Environ Model Softw. (2005) 20:1289–98. doi: 10.1016/j.envsoft.2004.08.010
30. Arjun BS, Kallarakal TK. Risk-return and volatility analysis of sustainability indices of S&P BSE. Int J Res Financ Market. (2016) 6:65–72. Available online at: http://euroasiapub.org/wp-content/uploads/2016/11/6FMOct-4145-1.pdf
31. Bogea F, Campos ASL, Blasco DC. Did the Creation of ISE Create Value for Companies? (2008). Available online at: file:///C:/Users/kullanici/Downloads/SSRNid1274270% 20(1).pdf (accessed September 25, 2018).
32. Hoti S, McAleer M, Pauwels PP. Multivariate volatility in environmental finance. Math Comput Simul. (2008) 78:189–99. doi: 10.1016/j.matcom.2008.01.038
33. Sariannidis N, Giannarakis G, Litinas N, Konteos G. GARCH examination of macroeconomic effects on U.S. stock market: a distinction between the total market index and the sustainability index. Eur Res Stud. (2010) 13:129–42. doi: 10.2139/ssrn.1340574
34. Ortas E, Moneva JM, Salvador M. Conditional volatility in sustainable and traditional stock exchange indexes: analysis of the Spanish market. GCG George Town Univ Univ. (2010) 4:104–29. doi: 10.3232/GCG.2010.V4.N2.07
35. Adams M, Thornton B, Sepehri M. The impact of the pursuit of sustainability on the financial performance of the firm. J Sustain Green Bus. (2010) 1–14. Available online at: http://www.ww.aabri.com/manuscripts/10706.pdf
36. Sudha S. Risk-return and volatility analysis of Sustainability Index in India. Environ Dev Sustain. (2014) 17:1329–42. doi: 10.1007/s10668-014-9608-8
37. Herrera HV. Decomposition of the stocks returns in the sustainable index of the Mexican Stock Exchange. Rev Mex Econ Finanz. (2015) 10:85–99. doi: 10.21919/remef.v10i1.68
38. Linardi G. A Study on the Combination of Low-Volatility and Sustainability Investing Strategies. Evidence from the U.S. Erasmus University Rotterdam Erasmus School of Economics MSc Economics & Business (2016). Available online at: https://pdfs.semanticscholar.org/d373/4b7c36038e03b76bf9b4cd322af1cdc94d75.pdf
39. Tükenmez NM, Gençyürek AG. Sustainability indices in developing markets: a study about Borsa Istanbul Sustainability Index. J Account Financ Audit Stud. (2016) 2:39–69. Available online at: http://jafas.org/Full-Issues/2016-Vol-2-Issue-2.pdf
40. Erdur DA, Kara E. Investor responses to corporate sustainability in a developing country: the case of Turkey. Suleyman Demirel Univ J Fac Econ Admin Sci. (2016) 21:1487–502. Available online at: https://iibfdergi.sdu.edu.tr/assets/uploads/sites/352/files/yil-2016-cilt-21-sayi-4-yazi20-27102016.pdf
41. Citak L, Ersoy E. Investors' reactions to the inclusion of firms in the BIST Sustainability Index: an analysis by event study and mean–median tests (in Turkish). Int J Alanya Fac Bus. (2016) 8:43–57. Available online at: https://papers.ssrn.com/sol3/papers.cfm?abstract_id=2775005
42. Kocamis TU, Yildirim G. Sustainability reporting in Turkey: analysis of companies in the BIST sustainability index. Eur J Econ Bus Stud. (2016) 6:1. doi: 10.26417/ejes.v6i1.p41-51
43. Gençoglu UG, Aytac A. The importance of integrated reporting from the view of corporate sustainability and BIST Applications (in Turkish). J Account Financ. (2016) 2016:51–66. doi: 10.25095/mufad.396719
44. Donmez A, Erol I. Measuring intellectual capital: an application on the firms located on BIST sustainability index. Financ Anal. (2016) 2016:27–56. Available online at: http://eds.a.ebscohost.com/eds/pdfviewer/pdfviewer?vid=0&sid=ded9fcd5-987a-4989-9c48-66d9d779150b%40sessionmgr4006
45. Ozdemir Z, Pamukçu F. Analysis of corporate sustainability reporting system in the entities within the context of Borsa Istanbul (in Turkish). Financ Anal. (2016) 134:13–35.
46. Araci H, Yüksel F. Measurement of sustainability performance: calculation of sustainable added value of business in BIST Sustainability Index (in Turkish). Int J Manag Econ Bus. (2016) 16:786–801.
47. Gok IY, Özdemir O. The performance characteristic of Borsa Istanbul Sustainability Index. Sosyoekonomi. (2017) 25:87–105. doi: 10.17233/sosyoekonomi.290838
48. Onder S. Corporate sustainability effect on firm profitability: an application in BIST (in Turkish). World Account Sci. (2017) 19:937–56. Available online at: http://eds.a.ebscohost.com/eds/pdfviewer/pdfviewer?vid=0&sid=4b451f9e-4953-4c5f-9ce4-98f07f00e053%40sdc-v-sessmgr02
49. Altinay A, Kaki B, Kestane A, Soba M, Dinçer Ö, Sik E. The effects of sustainability index on banking sector share center values, an investigation on the BIST Sustainability Index (in Turkish). J Soc Econ Res. (2017) 17:264–84. Available online at: https://dergipark.org.tr/tr/download/article-file/357325
50. Aydin O. Investigating index effect to financial performance of manufacturing companies which included Istanbul Stock Exchange Sustainability Index in 2015 (in Turkish). Ulakbilge. (2017) 5:2307–19. doi: 10.7816/ulakbilge-05-19-05
51. Akyuz F, Yeşil T. Analysing the financial performance of the companies operating by registered in production sector of BIST Sustainability Index (in Turkish). J Acad Res Stud. (2017) 9:16. doi: 10.20990/kilisiibfakademik.270635
52. Unal S, Yüksel R. The relationship between financial performance and stock returns: an investigation on banks in BIST Sustainability Index (in Turkish). Int J Manag Econ Bus. (2017) 13, 264–270.
53. Gurbuz E, Dumlu H. Measuring the efficiency of companies in BIST Sustainability Index: an application with data envelopment analysis (in Turkish). J Bus Res Turk. (2018) 10:223–44. doi: 10.20491/isarder.2018.427
54. Engle RF, Kroner KF. Multivariate simultaneous generalized ARCH. Econ Theory. (1995) 11:122–50. doi: 10.1017/S0266466600009063
55. Akay AB. Turkish foreign exchange market microstructure and the volatility spillover (in Turkish) (Ph.D. dissertation). Akdeniz University, Antalya, Turkey (2010).
56. Bollerslev T, Engle RF, Wooldridge JM. A capital asset pricing model with time varying covariances. J Polit Econ. (1988) 96:116–31. doi: 10.1086/261527
57. Onbirler OU. Three essays on volatility, correlation and hedging in financial markets (Ph.D. thesis). Yeditepe University, Istanbul, Turkey (2017).
Keywords: volatility spillover effect, MGARCH models, BEKK GARCH, sustainability index, stock market
Citation: Baykut E and Kula V (2019) The Volatility and Shock Transmission Patterns Between the BIST Sustainability and BIST 100 Indices. Front. Appl. Math. Stat. 5:50. doi: 10.3389/fams.2019.00050
Received: 21 August 2019; Accepted: 23 September 2019;
Published: 18 October 2019.
Edited by:
Simon Grima, University of Malta, MaltaReviewed by:
Ercan Ozen, Uşak University, TurkeyErkan Bayraktar, American University of the Middle East, Kuwait
Marie-Louise Mangion, University of Malta, Malta
Copyright © 2019 Baykut and Kula. This is an open-access article distributed under the terms of the Creative Commons Attribution License (CC BY). The use, distribution or reproduction in other forums is permitted, provided the original author(s) and the copyright owner(s) are credited and that the original publication in this journal is cited, in accordance with accepted academic practice. No use, distribution or reproduction is permitted which does not comply with these terms.
*Correspondence: Ender Baykut, ZWJheWt1dEBha3UuZWR1LnRy