 Eser Yeşildağ
- School of Applied Sciences, University of Uşak, Uşak, Turkey
Companies are exposed to many risks in their life. Derivatives are one of the tools that companies commonly use in order to mitigate these risks. The fluctuations in the markets in recent years have increased companies' need to use derivatives. For this reason, the importance of derivatives is increasing every day. The purpose of this study is to ascertain the financial risks which arise from the activities of non-financial companies in BIST 100 index operating in Turkey and the derivatives used in the management of these risks. In addition, this study aims to determine the differences between companies using derivatives and those not using derivative products. Therefore, the year-end financial reports of 58 companies, which were continuously in the BIST100 index between 2013 and 2018 were analyzed. The study results showed that the risks that the companies were exposed to included credit risk, liquidity risk, interest risk, currency risk and other risks and only half of the companies, on average, used derivatives in the management of these risks. In addition, it was observed that companies rather hedged themselves against currency risks through futures contracts and used more derivatives in the transportation and energy sectors. Besides, it is seen that the companies using derivative products are big and low liquid companies.
Introduction and the Rationale of the Study
The risks that companies are exposed to increase in today's market conditions due to the fact that competition also increases. Although these risks arise from national and international markets, they may also arise from within the company itself. Among these risks, financial risks such as currency, interest and price risks are the leading ones that influence companies the most. Companies try to eliminate or minimize their risks by managing the fluctuation of these variables.
The way that companies eliminate or reduce their risks is by hedging their financial risks. In this way, companies will be able to survive and become stronger in the sector. One of the most important tools that companies use for managing their risks is derivatives trading in derivative markets. Derivatives contribute to the reduction of future price fluctuations and the healthy functioning of the market while protecting companies ([1], p. 663). Highly comprehensive derivative markets also have great benefits in bringing new investment tools to those markets.
In order to reduce and control the price ambiguity in the future, companies use derivative contracts such as forward, futures, options, and swaps. Although derivatives have hedging characteristics, it is also possible for market participants to speculate and create arbitrage with derivatives ([2], p. 2).
The global contract value of futures and derivatives was above 639 trillion US Dollars by 2018. Considering that the domestic income of the USA is 21 trillion US Dollars, it is important to understand how high the trading volume of derivatives was ([3], p. 2). While the companies in developed countries use derivatives to manage risks, developing countries have recently increased their derivative use; however, this did not reach the desired levels. Despite such high derivatives volume in the world, we can see that the volume of derivative use in Turkey is low [4]. Low derivative use in Turkey negatively affects both markets and companies. The importance of this effect can be presented better through statistical data. However, there is scarcely any statistical data about the use of derivatives in Turkey. For this reason, it is highly important to study these issues to ascertain the derivatives and the companies using the derivatives in Turkey.
Yilmaz and Aslan's [1] article is one of the few studies which provides statistical data on the usage rates of the derivative in Turkey. Yilmaz and Aslan [1] analyzed the companies listed on the BIST100 index in 2013–2014. In this study, they have tried to identify the proportion of firms which use derivatives and companies which use more derivative products in non-financial sectors in Turkey. This study considers Yilmaz and Aslan's [1] paper as a basic article. Thus, this study has maintained statistical data on the use of derivative products and will be kept up to date in Turkey. In addition, it has tried to reveal the significant differences between the companies using derivative products and countries not using derivative products.
In this study, firstly the literature is examined. Later, the postscripts of BIST100 non-financial companies operating in Turkey between 2013 and 2018 were analyzed in this study and the financial risks of these companies and the derivatives they used against these risks were detected. Also, the differences between firms using and non-using derivative products were examined in terms of liquidity, leverage, size and the ratio of market to book value.
Literature Review
In this section, the use of derivative products in many different countries and the differences between companies using or not derivative products are presented. It is observed that the studies in the literature are generally divided into two. Some studies focused mostly on the levels of derivative product use, while others focused on the purposes of derivative product use and the differences between companies using or not derivative products. This study tried to address both issues.
According to these explanations, the literature is examined in two sections. The first section mainly focuses on studies on derivative product use levels. Some studies that have been made so far outside of Turkey for the use of derivative instruments and financial risk are reviewed below.
Alkebäck and Hagelin [5] investigated derivative use of non-financial companies in Sweden and compared their results with Bodnar et al. [6, 7] and Berkman et al. [8] in the USA and New Zealand, respectively. According to this study, while 52% of the companies in Sweden use derivatives, this rate is 53% in New Zealand and 39% in USA. Derivatives are more commonly used by big companies and they are essentially used for hedging. Finally, the lack of information about derivatives is the most worrying for financial managers. Kapitsinas [9] investigated the derivative use of 110 non-financial companies in risk management processes in Greece. It was found that 33.9% of these companies used derivatives against the interest rate risk that they were exposed to. The companies that did not use derivatives reported that they did not use them because they were not exposed to many risks. Martin et al. [10] investigated why rapid derivative market development in the world in recent years could not be achieved in developing countries by studying 1,000 companies in Peru that were in the non-financial sector. The results of the survey indicated that the use of derivatives in Peru was low and low education level and market regulations were the reasons for it.
Some studies that have been made so far in Turkey for the use of derivative instruments and financial risk are as follows:
Çonkar and Ata [4] compared the use of derivatives in Turkey and in developed countries by using banking data. According to this study, in spite of the significant increases in trading volumes of derivatives in recent years, Turkey fell behind in the use of derivative ratio of the developed countries. Yücel et al. [11] investigated the risks that 67 companies trading in Istanbul Stock Exchange in 2005 were exposed to and the derivatives they used in order to manage these risks. The study showed that the risks that companies were exposed to were credit, liquidity, currency, and interest risks. In addition, it is emphasized that the use of derivative products is very low. Çil Koçyigit et al. [12] stated that businesses are exposed to many risks such as interest rate, currency and market risks and derivatives were used in order to manage these risks. For that reason, 2006 end of year statement postscripts of real sector companies trading on the Istanbul Stock Exchange were reviewed in this study and the risks that companies encountered as well as the derivative use levels of these companies for managing these risks were investigated. As a result, it was determined that companies were in fact exposed to various risks; however, a few derivatives were used to manage these risks. Yilmaz and Aslan [1] investigated 67 companies from 8 sectors, except for financial sectors, in BIST 100 index between 2013 and 2014 and the derivative use levels of these companies against risks. According to this study, 36% of the companies in 2013, and 45% of the companies in 2014 used derivatives against risks. In addition, it was stated that for interest risk, swaps were used, for currency risk, futures were used and for other risks, option contracts were mostly used.
The second part of the literature mainly focuses on the purposes of derivative product use and the differences between companies using or not derivative products. Some studies that have been made so far outside of Turkey about the purposes for derivative product use and the differences in the use of derivative instruments are as follows:
Nguyen and Faff [13] analyzed the derivative use of the biggest 469 companies in Australia between 1999 and 2000. According to the study, it was reported that leverage, size and liquidity are important factors in derivative use and that big companies used derivatives especially for hedging. Saito and Schiozer [14] investigated the derivative use of 74 companies out of the financial sector in Brazil and the results were compared with other previously investigated countries. It was stated that as in other countries, managers used derivatives for hedging and especially managing the currency risk. El-Masry [15] discussed the risk management and the use of derivatives in the UK. For that purpose, 401 big non-financial companies in the UK were investigated. According to the study, big companies are more likely to use derivatives than small and medium-scaled companies and public enterprises are more likely to use derivatives than private companies. Derivatives are used mostly among international companies. The companies that did not use derivatives noted that the risks they were exposed to were not important and the biggest reason why they did not use derivatives was the costs and their worry about explaining the derivatives data. Other results showed that currency risk is the most commonly managed risk using derivatives and that derivatives were especially used in order to manage the volatility in cash flows.
Bodnar et al. [16] discussed the risk management and the use of derivatives in non-financial companies in Italy. It was determined that the derivative use of these companies was seriously influenced by various factors such as currency, size of the company, geographical position, rating point, access to industrial and capital markets and the educational level of the management. Small-scaled companies used derivatives less when compared to big companies. The study also revealed that companies encountered currency risks and 83% of the companies used derivatives against currency risk. In addition, it was reported that the companies in the manufacturing sector used derivatives and the most commonly used derivative type was the forward. Zhou and Wang [17] focused on big non-financial companies in the UK and evaluated the effect that derivatives had on their currency management activities. The study results showed that non-financial companies in the UK used derivatives to hedge against negative currency movements and they were effective in reducing the companies' exposure to risks at various levels.
Some studies that have been made so far in Turkey about the purposes of derivative product use and differences in the use of derivative instruments are as follows:
Yilmaz and Kurun [18] investigated the risk perceptions and risk management policies of non-financial companies in Turkey's capital markets and the effects of derivatives on financial stability. The study results showed that most of the companies prioritized the currency risk but did not put any emphases on the interest rate risk. Also, the big companies were the ones that used derivatives the most. It was also stated that companies were aware of derivatives; however, they were not eager to use them due to high transaction costs, lack of education and experience. Çömlekçi and Güngör [19] focused on hedging methods and hedging tools used by companies. For that purpose, a survey was conducted in five-star hotels in Turkey. The results of this study showed that hotel managements made use of derivatives (forwards, futures, swap, and option contracts) and they rather used forward contracts for hedging.
Bayrakdaroglu et al. [20] discussed the risk perception, risk management and derivative use of companies in the Denizli province. For that purpose, a survey was applied to 58 manufacturing companies. The study showed that companies were aware of derivatives; however, the number of companies using derivatives was a few because they were not willing to use derivatives. It was also determined that most of the companies were affected from currency risk and derivatives were especially used by big companies for speculation. Ersoy and Ünlü [21] analyzed the development of over the counter markets in Turkey and in the world between 2000 and 2011. Comparing results with over the counter markets in the world, it was stated that although the transaction volume of over the counter markets in Turkey increased continuously, this remained at low levels. It was reported in this study that the majority (87.5%) of the transactions in Turkey was for the purchase and selling of swap transactions. In addition, the crises and major losses of companies caused legal regulations in over the counter markets and risk follow-ups and audits.
When we generally look at the literature, we can see that studies rather focused on the companies out of the financial sector [1, 5, 9, 10, 14–18].
The analyzed studies emphasized that most of the companies using derivatives were the big ones and derivatives were rather used for hedging. In addition, the fact that there is a lack of information about derivatives and that they are not used in sufficient amounts, some factors, such as leverage, size and liquidity, still have an effect on the use of derivatives and the fact that derivatives are primarily used in the management of currency risk are issues that need to be determined.
The Method
The purpose of this study is to ascertain the financial risks which arise from the activities of non-financial companies operating in Turkey, and which are included in the BIST 100 index. And the Study wants to determine the derivatives used in the management of these risks. In addition, in this study, an attempt has been made to determine the differences between companies using or not derivative products.
Forty-two companies were not included in the study due to the fact that the companies were not included in the BIST100 index continuously and were financial sector companies. Consequently, the financial risks of 58 companies in BIST100 index were exposed to and the derivatives they used for managing these risks were analyzed. The main reason for handling the companies trading in BIST100 is that their financial statements and postscripts are easily accessible. The idea that the companies in BIST100 index can use derivatives intensively is the reason why they are preferred. Finally, the reason why the financial sector companies were excluded is that, their purpose for the use of derivatives may be different from those of other companies. This is because these companies can be both purchasers and sellers at the same time in the derivative financial markets.
Firstly, postscripts of the companies were analyzed using a quantitative method. The postscripts of the companies were obtained from the website of Public Disclosure Platform. These audited financial reports are available from the website of Public Disclosure Platform1.
Whether the firms use derivative products was determined from the review of financial reports. If there is any information that the firm uses derivative products, it is recorded. In addition, the type of derivatives used could be found in the notes of the financial reports. Following this procedure, information was obtained from 58 firms for each year from 2013 to 2018 resulting in a final 348 firm/year observations.
Analysis and Findings
In this part of the study, postscripts of the companies were analyzed and the sectoral distributions of the companies were reviewed. In addition, the risks that companies were exposed to and the derivatives that they used in order to hedge against these risks were presented together with their percentiles. Use of derivatives according to sectors was indicated on a sectoral basis. The sectors in which the analyzed 58 countries within the study were included, their ratio by aggregate and the abbreviations to be used for the sector in future are indicated in Table 1.
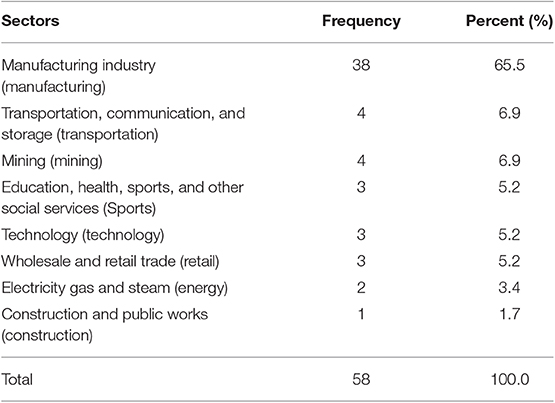
Table 1. Sectoral distribution and weights of companies.
As one can see in Table 1, a total of 58 companies from 8 sectors were discussed. The majority of these companies (65.5%) consisted of companies in the manufacturing industry. 6.9% is in Transportation, Communication, and Storage sector, 6.9% is in Mining sector, 5.2% is in Education, Health, Sports, and Other Social Services sector, 5.2% is in Technology sector, 5.2% is in Wholesale and Retail, 3.4% is in the Electric, Gas and Steam sector, and 1.7% is in the construction and public works sector. Although there is only one company in the construction and public works sector, this has not been excluded.
In the light of the information collected from the financial postscripts of companies, the risks that the 58 companies in this study were exposed to were identified. These risks are credit, liquidity, interest, currency and other risks. All 58 companies were exposed to credit risk, liquidity risk, interest risk and currency risk between 2013 and 2018. Companies have identified other risks such as price, capital, and funding risks.
One of the main issues for the study is whether companies used derivatives to hedge their risks or not. It is a known fact that while some companies in Turkey use derivatives to hedge for credit, liquidity, interest and other risks, some of them do not. The ratio of derivative use of the 58 companies in this study against the risks they were exposed to is presented in Table 2.
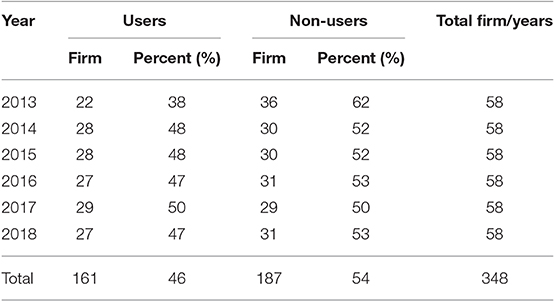
Table 2. Use of derivatives against financial risks.
According to Table 2, except for the companies in the financial sectors in BIST100 index, in 2013, 38% of the 58 companies used at least one derivative type for hedging financial risks, in 2014 and 2015 48% of them did the same, in 2016, 47%, in 2017, 50% and 2018, 47% of them used at least one derivative type for hedging financial risks. Accordingly, except for 2013, it is understood that approximately only half of the companies used derivatives for hedging and the ratios did not change as the years progressed. The fact that numbers did not change across the years and percentages were very close to each other shows that the companies that used derivatives might be almost the same companies.
In this study, 58 companies were analyzed for 6 years. Some of these companies have used derivatives every year, while others have never used derivatives. Some companies have used derivatives for only a few years. Therefore, it was assumed that 58 companies could have a total of 348 uses for 6 years. As a result, it has been determined that 58 companies have used derivative products for a total of 161 times and there were 187 times where companies have not used derivative products.
The levels of derivatives used in Table 2 are analyzed on a sectoral basis. As a result of the analyses, Table 3 indicates the number of companies from the different sectors which used derivatives.
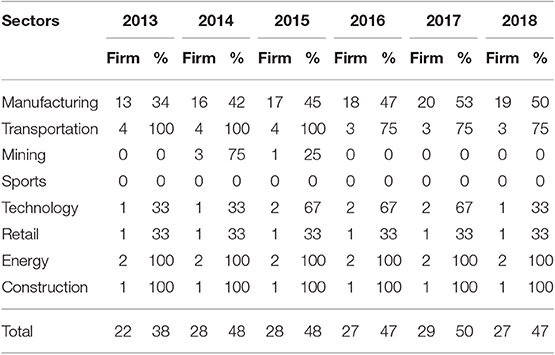
Table 3. Derivative product usage levels by sectors.
According to Table 3, we can understand that the use of derivatives in Turkey is nearly 50% considering the aggregates, i.e., approximately half of all of the companies used derivatives. In 2013, 13 (34%) companies, in 2014, 16 (42%) companies, in 2015, 17 (45%) companies, in 2016, 18 (47%) companies, in 2017, 20 (53%) companies and finally in 2018, 19 (50%) companies used derivatives against risks in the manufacturing sector (Manufacturing). Accordingly, it can be said that approximately half of the companies in the manufacturing sector used derivative products against risks and the number of these companies increased regularly every year.
When it comes to Transportation, communication and storage sector (Transportation), we can see that while all of the 4 companies (100%) used derivatives against financial risks in 2013, 2014 and 2015, 3 out of the 4 companies (75%) used derivatives against financial risks in 2016, 2017 and 2018. Besides, it can be noted that the use of derivatives in the transportation sector was high, and this was concluded from the analyses that 3 companies used the derivatives regularly throughout the last 6 years.
One can note that no derivative tools were used against risks in the mining sector (Mining) in 2013, 2016, 2017, and 2018. In 2014, 3 out of 4 companies (75%) and in 2015 only one out of 4 companies (25%) used derivatives. Therefore, it can be said that derivative use in the mining sector is very low. According to Table 3, none of the three companies (0%) in Education, Health, Sports and Other Social Services Sector (Sport) used derivatives throughout the 6 years. It can be concluded from the table that the only sector in which no derivatives were used in any period is the sports sector. It can be said that the sports sector is vulnerable to financial risks.
When looking at the technology sector one notes that, in 2013 and 2014, only one out of three companies (33%), in 2015, 2016, and 2017, two out of three companies (67%), and finally in 2018 again only one out of three companies (33%) used derivatives. Accordingly, it can be said that the ratio of the companies using derivatives against financial risks was higher than average in 2015, 2016, and 2017; however, it was below average in other years and in last year.
With reference to the Wholesale and Retail Sector (Retail), only one out of three companies (33%) used derivatives regularly between 2013 and 2018. Accordingly, it can be said that the use of derivatives against risks in this sector is below average. Alone can note that both of the companies (100%) in electric, gas and steam sector (Energy) used derivatives against risks between 2013 and 2018. It can be understood that the energy sector is among the sectors with the highest ratios in the use of derivatives and the derivatives are used regularly. Finally, it is seen that only one company in the Construction and Public Works Sector (Construction) used derivatives every year regularly. One can conclude that the other sector with the highest ratio in the use of derivatives is the Construction sector. However, it should be emphasized that the fact that there is only one company in this sector can lead to a misleading interpretation.
The data about who of the 58 companies considered in this study used derivatives to hedge against credit, liquidity, interest, currency and other risks is shown in Table 4.
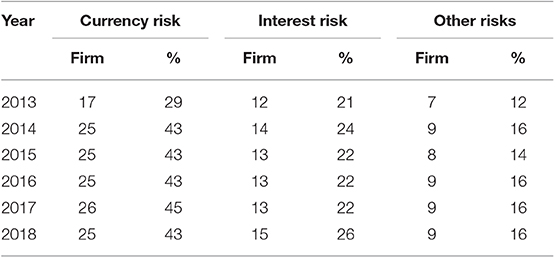
Table 4. Companies using derivatives by financial risk type.
According to Table 4, companies used derivatives mostly against the currency risk. Accordingly, the number of companies using derivatives against currency risk is 17 (29%) in 2013, 25 (43%) in 2014, 2015 and 2016, 26 (45%) in 2017 and lastly 25 (43%) in 2018. It can be said that the number of derivatives used against currency risk has not changed in the last 5 years and the ratio has not reached half of the companies. When we look at the number of companies using derivatives against interest risk, one can see 12 (21%) in 2013, 14 (24%) in 2014, 13 (22%) in 2015, 2016 and 2017 and finally 15 (26%) in 2018. One can see that the number of derivatives used against interest risk remain almost stable and at very low levels over the years. Finally, the number companies using derivatives against other risks was 7 (12%) in 2013, 9 (16%) in 2014, 8 (14%) in 2015, 9 (16%) in 2016, 2017, and 2018. It can be said that the number of companies using derivative products against other risks, which are expressed usually as price, commodity, capital and so on, remains lower than average.
In this part of the study, derivatives used by the 58 companies are shown by sectors. The ratio of the use of futures contracts, which is one of the most common derivative tools used by companies, is shown in Table 5.
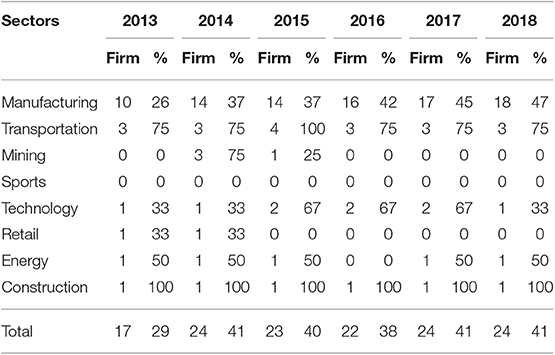
Table 5. Distribution of futures contracts by sectors.
Table 5 shows the companies that took out futures contracts against their financial risks. One notes that in 2013, 17 (29%) companies used futures, in 2015, 23 (41%) companies used futures, in 2016, 22 (38%) companies used futures contracts and finally in 2014, 2017, and 2018 24 (41%) companies used future contracts. Accordingly, less than half of the 58 companies used futures contracts and the number of these companies did not remarkably change over the years. It can be noted that the sector with the highest futures contract use is the construction sector, whilst the sector with the lowest futures contract use is the sports sector. It is noted that the use of futures contracts in the manufacturing sector has constantly increased in the last 6 years and considering all of the manufacturing companies, approximately half of the companies used these contracts and this ratio is a bit over average in the last 3 years. The Transportation sector is one of the sectors with the highest ratio of futures contract use. In 2015, four out of four companies (100%) used futures contracts in this sector. The Mining sector is one of the sectors with the lowest ratio of futures contract use. It is observed that none of the four (0%) companies used futures contracts. In addition, only in 2014 and 2015 futures contracts were used. According to Table 5, it is seen that none of the three companies (0%) in the sports sector used futures contracts throughout the 6 years. While only one out of three (33%) companies used futures contracts in 2013, 2014, and 2018, two out of three (67%) companies used them in 2015, 2016, and 2017 in the technology sector. It is understood that this sector was below the general average in 2018. One out of three companies used futures contracts in the retail sector in 2013 and 2014; however, no futures contract was used until 2018. Accordingly, the retail sector has been one of the sectors using futures contracts with the lowest ratio as compared to the general average. According to Table 5, it is noted that one out of each two companies (50%) in the Energy sector made futures contracts except for 2016. The Energy sector is above the average in terms of usage ratio. Finally, it can be observed that one company regularly used futures contracts every year in the construction sector. It can be said that the sector with the highest futures use ratio is the construction sector. However, it should be emphasized that the fact that there is only one company in this sector can lead to a misleading interpretation.
The ratio of the use of SWAP contracts, which are one of derivative tools used by companies, is shown in Table 6, divided by sectors.
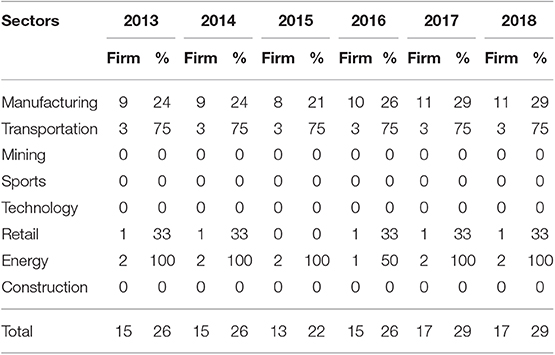
Table 6. Distribution of SWAP contracts by sectors.
When Table 6 is analyzed in general, in 2013 and 2104 a total of 15 (26%) companies, in 2015, a total of 13 (22%) companies, in 2016, a total of 15 (26%) companies and finally in 2017 and 2018, a total of 17 (29%) companies made swap contracts against financial risks. Accordingly, only one fourth of the 58 companies made swap contracts and the number of these companies slightly increased across the years except for 2015. It can be said that the highest ratio of Swap contract use is in the energy sector and the lowest ratio is in Mining, Sports, Technology and Construction sectors. It is noted that the use of swap contracts in the manufacturing sector has constantly increased in the last 6 years except for 2015, considering all manufacturing companies, one fourth of the companies used these contracts and this ratio almost remained the same in the last three years. Transportation sector is one of the sectors with the highest swap contract use. In the last 6 years, three out of four (75%) companies used swap contracts and this ratio is far above the average. Mining, Sports, Technology and Construction sectors did not make any swap contracts in the last 6 years. One out of three (33%) companies made swap contracts in the retail sector throughout 5 years except for 2015. This ratio is above the average. Finally, the energy sector is the sector with the highest swap contract use. It is observed that both (100%) companies in the energy sector made swap contracts every year except for 2016.
The ratio of the use of Option contracts, which are another derivative tool used by companies, is shown in Table 7, by sectors.
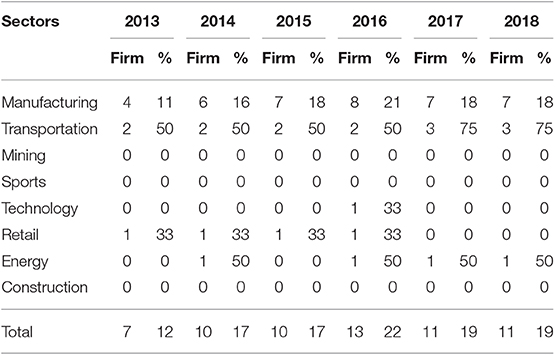
Table 7. Distribution of option contracts by sectors.
According to Table 7, the companies that made option contracts against financial risks are as follows: in 2013 a total of 7 (12%), in 2014 and 2015, a total of 10 (17%), in 2016 a total of 13 (22%) and finally in 2017 and 2018, a total of 11 (19%) companies. Accordingly, approximately one fifth of 58 companies made option contracts and the number of these companies slightly increased over the years. It can be said that transportation sector is the sector with the highest ratio of option contract use; Mining, Sports, Technology and Construction sectors are the sectors with the lowest ratio. It can be said that the use of option contracts in the manufacturing sector is very close to the average and we got the highest ratios in 2016. The Transportation sector is the sector with the highest option contract use ratio. Three out of four companies (75%) used option contracts in the last 2 years and this is far above the average. Mining, Sports and Construction sectors did not make any option contracts in the last 6 years. Although there is one company in technology sector with a transaction in 2015, it can be said that hardly any contracts were made in this sector. Although one can note that one out of three companies in the retail sector made regular transactions in the first 4 years, no option contracts were made in the last 2 years. Finally, the energy sector is the sector with the highest option contract use. It is seen that one out of two (50%) companies in the energy sector made option contracts except for 2013 and 2015.
In this part of the study, the derivative products used by 58 companies are shown in terms of the risks they face. The foreign currency, interest and other risks of the companies in 2013–2018 and derivative products used against these risks are shown in Table 8.
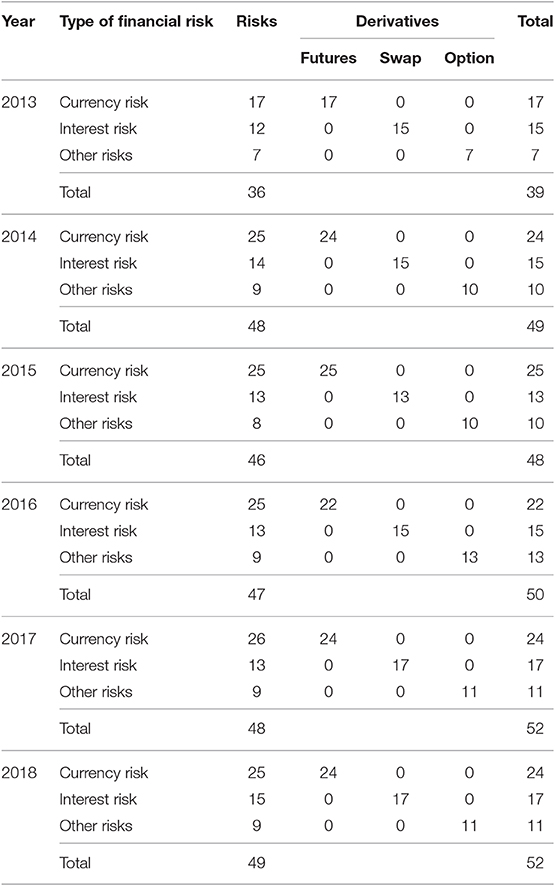
Table 8. Risks of companies between 2013 and 2018 and derivatives used for these risks.
According to Table 8, there are total of 36 financial risks that the companies were exposed to in 2013, such as 17 currency risks, 12 interest risks and 7 other risks. A total of 39 derivatives were used for hedging, such as 17 futures contracts, 15 swap contracts and 7 option contracts. For any risk, sometimes two different derivatives are used at the same time. There are a total of 48 financial risks that companies were exposed to in 2014, including 25 currency risks, 14 interest risks and 9 other risks. A total of 49 derivatives were used for hedging, including, 24 Futures Contracts, 15 Swap Contracts and 10 Option Contracts. Two different derivatives were sometimes used at the same time for any risks. There were a total of 46 financial risks that companies were exposed to in 2015. These were 25 currency risk, 13 interest risk and 8 other risks. A total of 48 derivatives were used for hedging, which included 25 Futures Contracts, 13 swap contracts and 10 Option Contracts. There were a total of 47 financial risks that companies were exposed to in 2016, such as 25 currency risks, 13 interest risks and 9 other risks. A total of 50 derivatives were used for hedging, these being 22 futures contracts, 15 Swap Contracts and 13 Option Contracts. Two different derivatives were sometimes used at the same time for any risks. There were a total of 48 financial risks that companies were exposed to in 2017. These were 26 currency risks, 13 interest risks and 9 other risks. A total of 52 derivatives were used for hedging, such as 24 futures contracts, 17 Swap Contracts and 11 Option Contracts. There were a total of 49 financial risks that companies were exposed to in 2018, which were 25 currency risks, 15 interest risks and 9 other risks. A total of 52 derivatives were used for hedging, which included 24 futures contracts, 17 Swap Contracts and 11 Option Contracts.
When Table 8 is analyzed in general, one notes that for companies, the highest risk is currency risk. This was followed by interest and other risks. Throughout 2013 and 2018, futures contracts were used in the management of foreign currency risks, swap contracts were used, in the management of interest risks and options were used in the management of other risks.
This part of the study investigated the determinants of the derivative used in Turkey. Therefore, some factors are assumed to affect the use of derivative products. The factors that are thought to affect the use of derivative products were determined by using the previous studies. As stated in the literature section, factors such as leverage, firm size, liquidity and the like may affect the use of derivative products. In this study, it is assumed that factors such as liquidity, leverage, firm size and market to book value (MTBV) may be effective in the use of derivative products and these factors are considered as independent variables of the study. Therefore, 6-year liquidity ratios, leverage ratios, firm sizes and MTBV ratios of 58 firms discussed in this study were calculated. The independent variables of the study can be described briefly below.
In this study, current ratio is considered as a measure of liquidity. Current ratio measures the firm's ability to meet its short-term liabilities ([22], p. 260). A negative relationship is predicted between derivative use and the current ratio. Leverage had been calculated as the ratio of the total of short-term and long-term debts to total assets. A high leverage ratio increases the probability a firm will encounter financial distress. As a result, highly levered firms should be more eager to use derivatives to reduce the financial distress. Firm size is equal to the market value. To calculate market value, multiply the current market price of a company's stock by the total number of shares outstanding. A positive relationship is predicted between size and the decision to use derivatives. The ratio of market to book value (MTBV) is used to find a company's value by comparing its book value to its market value. A positive relationship is predicted between derivative use and MTBV.
Is the study tried to determine whether the companies using derivative products differ in terms of liquidity ratio, leverage ratio, company size, and MTBV ratio from companies not using derivatives. The difference between the two sample groups in terms of means can be calculated with the help of T-test. A T-test tries to determine whether the average in one group is significantly different from the average in the other group ([23], p. 74). In this study, Independent Samples T Test, which is the most commonly used test, was used. The results of the t-test analysis of the companies using and not using derivative products are shown in Table 9.
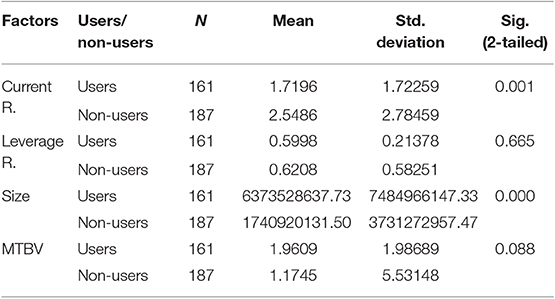
Table 9. The results of the T-test analysis of the companies.
It was assumed that 58 companies could have a total of 348 uses for 6 years. As a result, it has been determined that 58 companies have used derivative products for a total of 161 times and there were 187 times where derivative products were not used for 6 years. According to Table 9, it is seen that companies using derivative products are statistically different from companies that do not use derivative products in terms of current ratio and company size. On the other hand, one notes that the companies using derivative products are not statistically different from companies that do not use derivative products in terms of leverage and MTBV ratios. According to these results, companies using derivative products are larger and less liquid than companies that do not use derivatives. The results also meet theoretical expectations.
Conclusion
Companies are expose to many risks in real life. Companies try to control their risks by hedging. One of the ways for hedging is derivative markets and the derivatives trading in these markets. Derivatives and the use of derivatives became very important issues in recent periods when the economy got risky. The usage level of derivatives, which is increasing day by day, remains at very low levels in developing countries.
The purpose of this study is to identify the financial risks which arise from the activities of non-financial companies in BIST 100 index, operating in Turkey, considered a developing country, and investigate the derivatives used in the management of these risks. Moreover, the study tried to be determine the differences between companies using and not using derivative products. For that reason, the year-end financial reports of 58 companies which were consistent in BIST100 index between 2013 and 2018 were analyzed.
When the literature is analyzed in general, it is seen that studies rather focused on the non-financial companies. In addition, the studies emphasized that the companies using derivatives are mostly big companies and they are essentially used for hedging. Furthermore, according to the literature, there is a lack of information about derivative products, the use of derivative products is not at the desired level and some factors (leverage, size, liquidity, etc.) influence the use of derivatives. Studies on derivatives were conducted in many countries such as Sweden, Australia, Brazil, England, Greece, Peru and Italy [1, 5, 9, 10, 14–18].
The analyses in this study centered around 58 companies which fell in the manufacturing [38], transportation (4), sports (3), technology (3), retail (3), energy (2), and construction (1) sectors and the risks that these companies were exposed to, which included credit, liquidity, interest, currency, and other risks. One of the results obtained in the study is that, approximately, only half of the companies used derivatives for hedging and these ratios did not change as the years progressed.
According to this study, the sectors with the highest ratio of derivative use are transportation, energy and construction sectors. Companies used derivatives mostly against the currency risk and the most commonly used contracts are futures contracts. While transportation and construction sectors used futures contracts the most, transportation and energy companies preferred Swap contracts. Although the least used contracts were option contracts, companies in the transportation sector preferred them.
The highest risk of the companies involved is currency risks. This was followed by interest and other risks. Throughout 2013 and 2018, futures contracts were used in the management of foreign currency risks, swap contracts were used in the management of interest risks and options were used in the management of other risks.
According to the results of this study, companies using derivative products are statistically different from companies that do not use derivative products in terms of current ratio and company size. On the other hand, companies using derivative products are not statistically different from companies that do not use derivative products in terms of Leverage and MTBV ratios. So, companies using derivative products are larger and less liquid than companies that do not use derivatives.
As in other studies in literature, the results of this study showed that companies used derivatives against currency risks the most. Interest and other risks followed in importance. Throughout 2013 and 2018, futures contracts were used in the management of foreign currency risks, swap contracts were used in the management of interest risks and options were used in the management of other risks. And companies using derivative products are larger and less liquid than companies not using derivatives.
In the light of these information, it can be concluded that the use of derivatives in Turkey is not at the desired levels. Companies will be more powerful if measures are taken to increase the level of use of derivatives and the economy, therefore, will be influenced positively by this situation. Additionally, whether companies have sufficient information about derivatives or not can be determined in separate studies. Also, the factors affecting the use of derivative products can be investigated by different methods.
Data Availability Statement
The datasets generated for this study can be found at https://www.kap.org.tr/en/.
Author Contributions
EY: creating the draft, researching previous studies, analysis and interpretation of reports, and wrote the result.
Conflict of Interest
The author declares that the research was conducted in the absence of any commercial or financial relationships that could be construed as a potential conflict of interest.
Footnote
1. ^https://www.kap.org.tr/tr/ (accessed March 03, 2019).
References
1. Yilmaz E, Aslan T. Usage derivatives in management financial risks: a study on firms in Borsa Istanbul (BIST) 100 Stock Index. J Bus Res. (2016) 8:663–78. doi: 10.20491/isader.2016.165
3. Capital Markets Licensing Registry and Training Agency Inc. Derivatives, Markets and Risk Management, Licensing Exams Study Notes. (2019). Available online at: https://www.spl.com.tr/docs/other/8439995c-d40c-45.pdf (accessed July 28, 2019).
4. Çonkar K, Ata HA. Use of derivative products as a hedging tool in developed countries and Turkey. Afyon Kocatepe Univ Fac Econ Admin Sci J. (2002) 4:1–17. Available online at: https://dergipark.org.tr/en/pub/akuiibfd
5. Alkebäck P, Hagelin N. Derivatives usage by non-financial firms in Sweden with an International comparison. J Int Finan Manage Account. (1999) 10:105–20. doi: 10.1111/1467-646X.00046
6. Bodnar GM, Hayt GS, Marston RC, Smithson CW. Wharton survey of derivative usage by U.S. non-financial firms. Finan Manage. (1995) 24:104–14. doi: 10.2307/3665538
7. Bodnar GM, Hayt GS, Marston RC. 1995 Wharton survey of derivatives usage by U.S. non-financial firms. Finan Manage. (1996) 25:113–33. doi: 10.2307/3665595
8. Berkman H, Bradbury ME, Magan S. An international comparison of derivatives use. Finan Manage. (1997) 26:69–73. doi: 10.2307/3666128
9. Kapitsinas SK. Derivatives usage in risk management by non-financial firms: evidence from Greece (Doctoral Dissertation). University of Athens, Athens, Greece (2008).
10. Martin MÁ, Rojas W, Eráusquin JL, Vera DYE. Derivatives usage by non-financial firms in emerging markets: the peruvian case. J Econ Finance Administr Sci. (2009) 14:73–86.
11. Yücel T, Mandaci PE, Kurt G. Financial risk management of the companies and derivatives usage: an application at firms in ISE 100 index. J Account Finance. (2007) 36:1–9. Available online at: https://dergipark.org.tr/en/pub/mufad
12. Çil Koçyigit S, Çina Bal E, Bal H. The level of using derivative instruments for risk management in the companies quoted to ISE. Account Audit Rev. (2009) 29:109–30. Available online at: https://www.turmob.org.tr/ekutuphane/c235ac1e-a337-48d9-a9a5-961d26c92b49/muhasebe-ve-denetime-bakis/1
13. Nguyen H, Faff R. On the determinants of derivative usage by Australian Companies. Aust J Manage. (2002) 27:1–24. doi: 10.1177/031289620202700101
14. Saito R, Schiozer RF. Derivatives Usage and Risk Management by Non-financial Firms: A Comparison Between Brazilian and International Evidence. Unpublished paper. Department of Finance, Fundacao Getulio Vargas/EAESP, Brazil (2005). doi: 10.2139/ssrn.677862
15. El-Masry AA. Derivatives use and risk management practices by U.K. Non-financial Companies. Manage Finance. (2006) 32:137–59. doi: 10.1108/0307435061064191
16. Bodnar GM, Consolandi C, Gabbi G, Jaiswal-Dale A. Risk management for Italian non-financial firms: currency and interest rate exposure. Eur Finan Manage. (2013) 19:887–910. doi: 10.1111/j.1468-036X.2012.00659.x
17. Zhou VY, Wang P. Managing foreign exchange risk with derivatives in UK non-financial firms. Int Rev Finan Anal. (2013) 29:294–302. doi: 10.1016/j.irfa.2012.07.005
18. Yilmaz MK, Kurun E. The impact of derivatives on financial stability in turkish economy evidence from the istanbul stock Exchange and TurkDEX. Int Res J Finan Econ. (2007) 9:180–99. Available online at: http://www.eurojournals.com/finance.htm
19. Çömlekçi I, Güngör B. The use of hedging techniques in hotel companies: a research on five-star hotels in Turkey. Dumlupinar Univ J Soc Sci. (2012) 33:49–66. Available online at: https://dergipark.org.tr/en/pub/dpusbe
20. Bayrakdaroglu A, Sari B, Heybetli B. A field study on using derivative instruments for financial risk management in the companies: denizli case study. J Account Finance. (2013) 57:57–72. Available online at: https://dergipark.org.tr/en/pub/mufad
21. Ersoy E, Ünlü U. Over-the-counter derivatives market transactions. Nevşehir Haci Bektaş Veli Univ J ISS. (2016) 6:143–62. Available online at: https://dergipark.org.tr/en/pub/nevsosbilen
22. Gitman LJ. Principles of Managerial Finance. 6th ed. New York, NY: Harper Collins Publisher (1991).
Keywords: derivatives, financial risk, BIST100, financial risk management, use of derivatives
JEL Code: G13, G23, G32
Citation: Yeşildağ E (2019) Financial Risks and Derivative Use of Non-financial Companies in Turkey. Front. Appl. Math. Stat. 5:64. doi: 10.3389/fams.2019.00064
Received: 01 October 2019; Accepted: 03 December 2019;
Published: 18 December 2019.
Edited by:
Simon Grima, University of Malta, MaltaReviewed by:
Yusuf Kaderli, Adnan Menderes University, TurkeySerap Necmiye Vurur, Afyon Kocatepe University, Turkey
Copyright © 2019 Yeşildağ. This is an open-access article distributed under the terms of the Creative Commons Attribution License (CC BY). The use, distribution or reproduction in other forums is permitted, provided the original author(s) and the copyright owner(s) are credited and that the original publication in this journal is cited, in accordance with accepted academic practice. No use, distribution or reproduction is permitted which does not comply with these terms.
*Correspondence: Eser Yeşildağ, ZXNlcnllc2lsZGFnQGdtYWlsLmNvbQ==