 Juliana C. Lacerda
 Celso Freitas1
 Elbert Macau
- 1Associated Laboratory for Computing and Applied Mathematics, National Institute for Space Research-INPE, São José dos Campos, Brazil
- 2Institute of Science and Technology, Federal University of São Paulo, UNIFESP, São Paulo, Brazil
Two of the most remarkable phenomena in non-linear systems are multistability and remote synchronization. In the first one, depending on the initial conditions, the system may set in different states after the transient, while in the other, dynamical units that are not directly connected set in a synchronized state. In this work, we introduce a new approach to detect multistability in the remote synchronization phenomena where the dynamical system is given by a star-like topology whose oscillators are governed by the Stuart-Landau equation. This approach is based on symbolic dynamics characterization and complex network formalism. It has already been used to detect periodic windows and chaos in non-linear systems and now we show that although it is not able to differ from a non-synchronized to a synchronized state, it is able to detect the region where multistability takes place. Our findings are compared with the results obtained by traditional methods such as the partial synchronization index.
1. Introduction
Network of oscillators are dynamical systems in which nodes represent individual elements with degrees of freedom and internal parameters and the edges represent the interactions between them [1]. The dynamics of the nodes are often governed by differential equations that depend on the coupling to the adjacent nodes and on their internal dynamics. Usually these differential equations are given by oscillator models like Kuramoto [2] and Stuart-Landau [3, 4] and an important phenomena that can arise from this is the synchronization of a certain dynamic property of the system [5, 6]. Complete synchronization phenomenon is ubiquitous in natural and technological systems and appears in a diversity of forms [7]. One of these remarkable forms is the situation in which it appears for oscillators that are not directly interconnected. In a simple situation, consider that there are three oscillators in which one (central node) is connected to the other two (extreme nodes) and these two don't present a connection among them and are in complete synchronization while the center one is not. Here, two scenarios may be identified. It may happen that although the center one is not in complete synchronization with the extremes ones, there is actually a weaker form of synchronization among them. This phenomenon is called relay synchronization [8–12] and there is high evidence that in fact the center oscillator and the extreme ones are locked in a generalized synchronization [13, 14], which takes place when there is a function that allow to map a trajectory from a system to another. In a different scenario, there is no synchronization at all between the center node and the oscillators that are located in the extremes. This phenomenon is called remote synchronization [15, 16]. All those phenomena can involve several oscillators interconnected in a complex network. Another phenomenon worth mentioning are the chimera states [17–19] in which a network of oscillators is divided into two domains, one coherent and synchronized and the other incoherent and desynchronized.
In this work, we are interested in the phenomenon of frequency locking, that is, when the phase difference between two dynamical units remains constant through time; it often occurs when the coupling is strong enough so that they start to oscillate with the same instantaneous frequency, even though their natural frequencies are not the same [20]. Also, our focus is in the phenomenon of remote synchronization.
In order to study and quantify synchronization, metrics like the order parameter and the partial synchronization index are used [21, 22]. These metrics take into account the state variable called phase, which describes the motion of the oscillators and is dependent of time. A phenomenon that can arise when studying synchronization is multistability which is the coexistence of multiple attractors [23, 24], implying that the final synchronized state of the system is heavily dependent on the initial conditions, as the system synchronizes only for some of these initial conditions and doesn't for others [25].
An alternative approach to study the dynamics of non-linear systems has been proposed [26, 27]. The main idea is, instead of using the usual metrics to characterize the behavior of a system, like Lyapunov exponents and bifurcation diagrams, network metrics like average degree and betweenness centrality are exploited. It works by using the systems' time series to generate undirected graphs (by the use of symbolic dynamics for example) and then complex network formalism is exploited to extract information from them. One of the methods used in Freitas et al. [26] is the Dynamical Characterization using Symbolic Dynamics (DCSD) which has been shown to able to detect periodic windows and chaos and has been employed to characterize the dynamical behavior of the Hénon [28] and the Logistic [29] maps.
On Lacerda et al. [25] multistable remote synchronization was characterized on dynamical system given by a star network of Stuart-Landau oscillators by using state variables and metrics like the partial synchronization index. In this work, we introduce a new approach to detect multistability for the same dynamical system as we make use of symbolic dynamics characterization, the DCSD model in Freitas et al. [26], and complex networks formalism to study this multistability behavior. Our approach is not able to differ from a synchronized to a non-synchronized state yet it is able to detect the region where multistability takes place. It was also able to detect a region where there is an increase in the incoherence related to the synchronization of units of the system being studied.
2. Model
Following the work done at Lacerda et al. [25], the topology of our first case study is given by a dynamical system composed by a eleven node star network (Network 1), Figure 1, whose dynamics are modeled by the Stuart-Landau equation:
where, N is the number of nodes, α = 1 is the Hopf bifurcation parameter [30], ωn is the natural frequency of oscillator n, k is the coupling constant, dn is the degree of node n and (gnm) is the adjacency matrix as gnm equals one if node n is connected to node m and is equal to zero otherwise. The phase of oscillator n is given by .
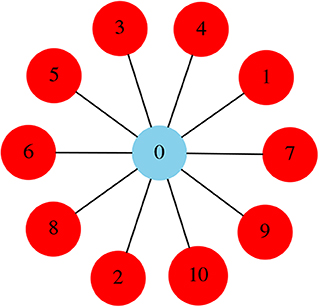
Figure 1. Network 1: Star network composed of N = 11 nodes. The central node, also called hub, is colored blue, the peripheral nodes are colored red.
The natural frequencies are fixed as Lacerda et al. [25]
Our second studied case is given by two eleven node star networks whose hubs are connected (Network 2), Figure 2. Nodes labeled from 0 to 10 will be referred to as Star 1 (S1) and have the same natural frequency distribution as the star presented in Figure 1, which is given by Equation (2). Nodes labeled from 11 to 21 will be referred to as Star 2 (S2) and have the following natural frequency distribution:
The hubs (central nodes) are always represented by the subscript 0 and 11. The initial conditions and vary each time Equation (1) is integrated and are given by a uniform distribution between (−0.5, 0.5).
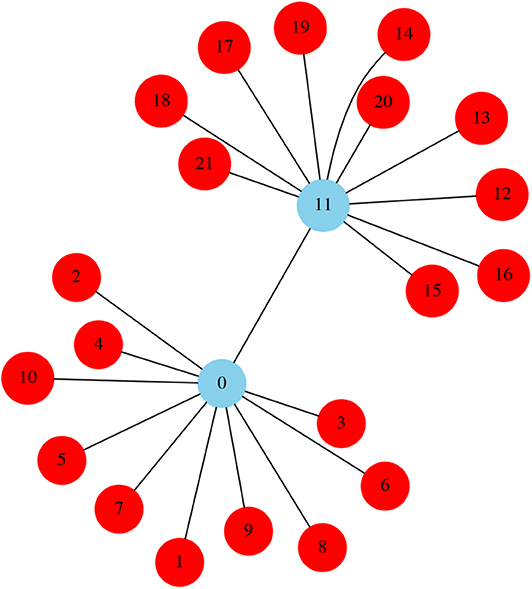
Figure 2. Network 2: Topology composed of two eleven node star networks whose hubs are connected. The star on the lower left, composed of nodes 0 to 10 is referred as Star 1 (S1), the star on the upper right, composed of nodes 11 to 21 is referred to as Star 2 (S2).
In order to study the synchronization of our system, we will make use of the partial synchronization index [22]:
where < .>t denotes the mean through time. This metric will be used to calculate rdirect and rindirect that are defined as follows [16]:
Note that rdirect only takes into account the values of the partial synchronization index that relate the hub (node 0) and the peripheral nodes, on the other hand, rindirect is only related to the partial synchronization index of the peripheral nodes among themselves. When rnm = 1, nodes n and m are frequency locked, meaning that their phase difference remains constant through time. So, rdirect = 1 means that the hub is frequency locked with all the peripheral nodes and rindirect = 1 indicates that all peripheral nodes are synchronized among themselves. In order for the system to present remote synchronization, rindirect must be very close to one, while rdirect has a low value. So, in this work we characterize remote synchronization when rindirect>0.99 and rdirect <0.7.
2.1. Dynamical Characterization Using Symbolic Dynamics and Complex Network Statistics
The symbolic dynamical characterization [26] of Equation (1) is made by following steps 1 to 6:
(1) For each of the N oscillators, Equation (1) is integrated for 20 different initial conditions for several values of coupling 0 ≤ k ≤ 1.
(2) We consider only the x time series to make the characterization as the y time series is qualitatively the same. In our case xn(t)∈[−1, 1] for all nodes. In order to discard the transient, only 105 final values of the x time series are used for this dynamical characterization.
(3) As represented in Figure 3, each time series is transformed into a binary (or symbolic) series. A partition is set at the middle of the range of the x time series (at 0) and we define that if xn(t) <0 the symbol 0 is assigned and if xn(t)≥0, the symbol 1 is assigned, giving rise to a symbolic series. Then a 11 bit template is defined and it moves through the symbolic series at one position at a time, forming several binary words of size 11. This words are converted to their decimal equivalents, forming then a decimal series.
(4) Networks (undirected graphs) are now generated from the decimal series in a way that each one of them sets up a distinct network. To generate a network we proceed as follows: each value of a decimal series corresponds to a node and connection is made only between neighbors of this series; there can be only one edge between a pair of nodes and self-connections are not allowed. The maximum number of nodes a network can have is 211 (as we are using a binary basis and the size of the template is 11). An example of a network generated from a fictitious decimal series can be seen in Figure 4.
(5) For each coupling k, 20 networks are generated for each oscillator as we have 20 different initial conditions.
(6) Using these networks, we calculate the mean and standard deviation of number of nodes, density, diameter, average degree and normalized betweenness centrality for each oscillator at several values of coupling.
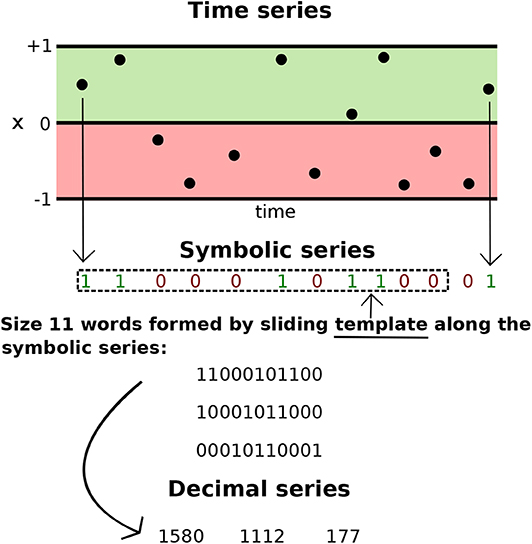
Figure 3. Symbolical and decimal characterization of a time series.
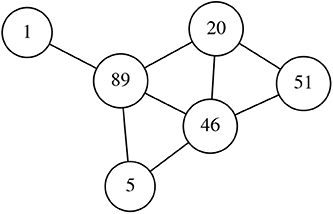
Figure 4. Example of the generation of an undirected network from a decimal series defined as (51, 46, 5, 89, 46, 20, 51, 20, 89, 1).
The degree of a node represents the number of edges it has and the average degree of a network is the average of the degree of all nodes of the network. The diameter is the maximum distance between two nodes of the network. The density is defined as
where E is the number of edges and N the number of nodes. The normalized betweenness centrality of a node n is
where is the normalization factor, σst is the total number of shortest paths between nodes s and t and is the number of these paths that pass through node n. The average normalized betweenness centrality of the network is the average of the value this metric of all the nodes.
3. Results and Discussion
We make use of the usual metrics given by Equations (5) and (6) to study the synchronization of Networks 1 and 2, whose nodes' dynamics are modeled by Equation (1), as a function of the coupling. We then use symbolic dynamics and complex network statistics to characterize the behavior of both systems and make a comparison of both approaches.
Numerical integration of Equation (1) for both network systems is performed for several values of coupling k∈[0, 1]. For each value of k, the system is integrated using 20 different initial conditions and the mean and standard deviation of the metrics rdirect and rindirect are calculated.
The measures rdirect and rindirect of the Network 1 can be seen in Figure 5. Note that for k = 0.425 the metric rindirect is equal to one while the metric rdirect has a low value, approximately 0.3, and this indicates that all peripheral nodes are synchronized, while the hub, which is the only connection among them, is not; in a phenomenon called remote synchronization. As the coupling k increases, more specifically at k≥0.75, rdirect = 1 meaning that the hub gets synchronized with the rest of the nodes and also as rindirect = 1, all nodes of the network are synchronized. One interesting fact that can be noticed at an intermediate value of coupling, 0.575 ≤ k ≤ 0.625, is that the standard deviation of rindirect is high and its mean value is lower than 1, meaning that the peripheral nodes are synchronized only for some initial conditions, in a phenomenon called multistability [25]. Note that the standard deviation of rdirect in this interval of coupling is relatively low and its mean value never gets close to one, thus indicating that multistability is not taking place on the dynamics of the hub. It is important to note that when the peripheral nodes don't present a synchronized state in this region duo to their initial condition, the whole network is incoherent and desynchronized, so there is no possibility of having a Chimera state for example. On Lacerda et al. [25] we properly characterize this multistable behavior by presenting more measures like instantaneous frequency as a function of time, phase space, basin of attraction, and Poincaré section.
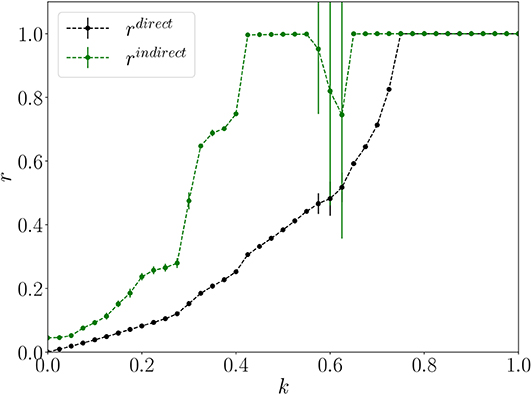
Figure 5. Network 1. Mean and standard deviation of rdirect (black) and rindirect (green) as a function of the coupling k.
Now, we make use of symbolic dynamical characterization and complex network statistics to characterize the dynamics of the eleven node star network whose dynamics is given by Equation (1). As before, we perform numerical integration for 20 distinct initial conditions for several values of coupling. Each of these initial conditions will give rise to an x and y time series for each oscillator. In this work, we will use the x time series to make the characterization as the y time series is qualitatively the same.
Each x time series is converted into a symbolic binary series and then to a decimal series as shown in Figure 3. All the decimal series are then converted into graphs whose mean and standard deviation of the average number of nodes, density, diameter, mean degree and normalized betweenness centrality are calculated and the result can be seen in Figure 6 (see section 2.1, steps 1–6 for details). For each metric at fixed value of k, 11 values of the mean and the standard deviation are plotted, each corresponding to one oscillator. The metrics corresponding to the peripheral nodes are plotted in blue and those of the hub are plotted in red. Note that all the metrics have a constant mean value and a standard deviation very close to zero for the peripheral nodes and for the hub, except at a small region that corresponds to 0.575 ≤ k ≤ 0.625. At this region, the mean value of the metrics that correspond to the hub remain constant and with a very small standard deviation which indicates that the hub doesn't have a multistable behavior, a similar result that was found in Figure 5. As for the peripheral nodes, the mean value of the metrics deviate from the constant values and present a high standard deviation, showing that something unusual is happening, which is the multistable remote synchronization as also showed in Figure 5.
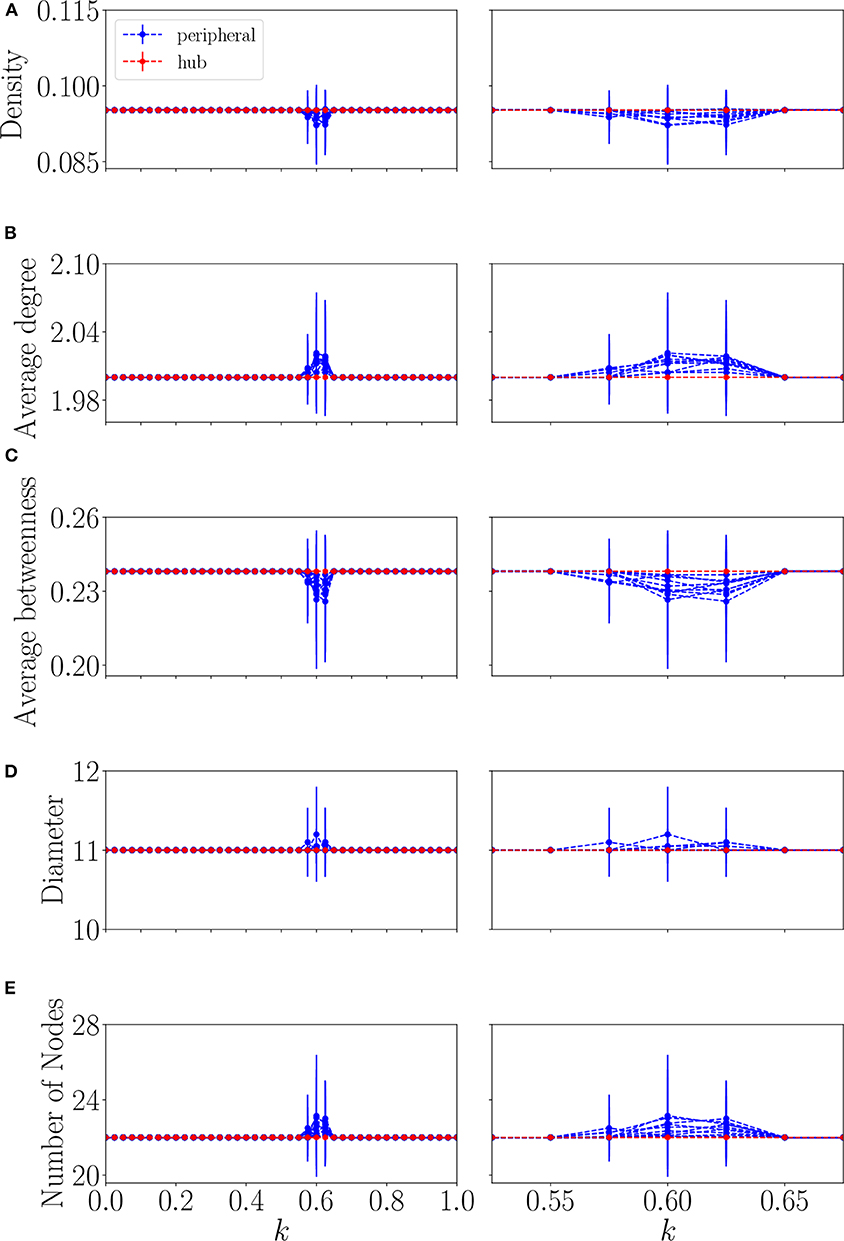
Figure 6. Network 1. Mean and standard deviation of the network metrics (A) density, (B) average degree, (C) average betweenness, (D) diameter, and (E) average number of nodes as a function of coupling k. The plots on the right column are amplifications of the ones on the left. Values of metrics related to the peripheral nodes are in blue and related to the hub are in red.
Analyzing the values of network statistics in Figure 6 at the multistable interval, one sees that the networks generated by the DCSD model present a lower mean value of the statistics density and average betweenness and a higher mean value for the average degree, diameter and number of nodes when compared to the values outside the multistable interval of coupling. As the peripheral oscillators in this interval of coupling present a quasi-periodic motion [25], by Step 3, it is expected to have a greater number of distinct values in the decimal series and therefore generating a network with a greater number of nodes whose average degree and diameter will be also bigger when compared to the values outside this region. On the other hand, as the number of nodes increases, the network gets more sparse, which makes the values of the density and average betweenness to be lower.
Now, in order to test our method in a relatively more complex dynamical system, we consider the network composed of two star networks whose hubs are connected named Network 2 (Figure 2). As before, the system is integrated for several values of coupling and for each coupling, 20 different initial conditions are used and the mean values of the measures rdirect and rindirect are calculated. The difference here is that each of these measures are computed for each star separately, so we have and referring to Star 1 and and referring to Star 2. The results can be seen in Figure 7. Both and reach the maximum value at k = 0.55 while and present a relatively low value, meaning that both sets of peripheral nodes are synchronized among themselves, although they are not synchronized with each other, that is, a peripheral node of Star 1 is not synchronized with a peripheral node of Star 2 (considering all peripheral nodes, rindirect = 0.42 for this value of coupling, and its maximum value is 0.58 when k = 1). The system then enters the region of multistability which for Star 1 takes place at 0.575 < k <0.65 and for Star 2 at 0.575 < k <0.675. One unusual behavior that can be noticed is what happens to (black circle) at 0.75 < k <0.8, although the value of the coupling is increasing, suddenly there is a drop at the value of , indicating that the level of incoherence has increased. This behavior is not detected at Star 2.
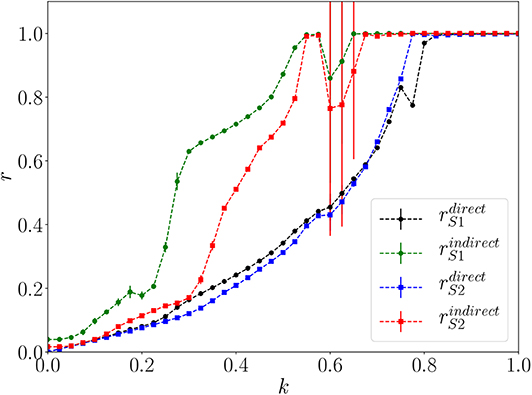
Figure 7. Network 2. Mean and standard deviation of rdirect (black circle) and rindirect (green circle) for Star 1 and rdirect (blue square) and rindirect (red square) for Star 2 as a function of the coupling k.
The results of the analysis of the system using the symbolic dynamics and complex network statistics are shown in Figure 8. For the sake of clarity, we plotted the metrics derived from Star 1 on the left column and the ones from Star 2 on the right. Note that there are two main regions of coupling where the mean values of the metrics differ from a constant one. We start by analyzing the metrics from Star 1. The first region is at 0.475 < k <0.55 for the density, degree, betweenness and number of nodes, for the diameter its at 0.475 < k <0.525. The second region is at 0.575 < k <0.8 for the measures density, degree, betweenness and number of nodes and at 0.575 < k <0.725 for the diameter along with another extra region at 0.75 < k <0.8. One can notice that there is a high standard deviation at the beginning of this region and that it either decreases or remains constant as k increases but when 0.75 < k <0.8 there is a huge increase in the standard deviation. For Star 2, the first is at 0.475 < k <0.55 for all the measures except for the diameter which is at 0.5 < k <0.55. The second is at 0.575 < k <0.775 also for all the measures except for the diameter which is 0.575 < k <0.75.
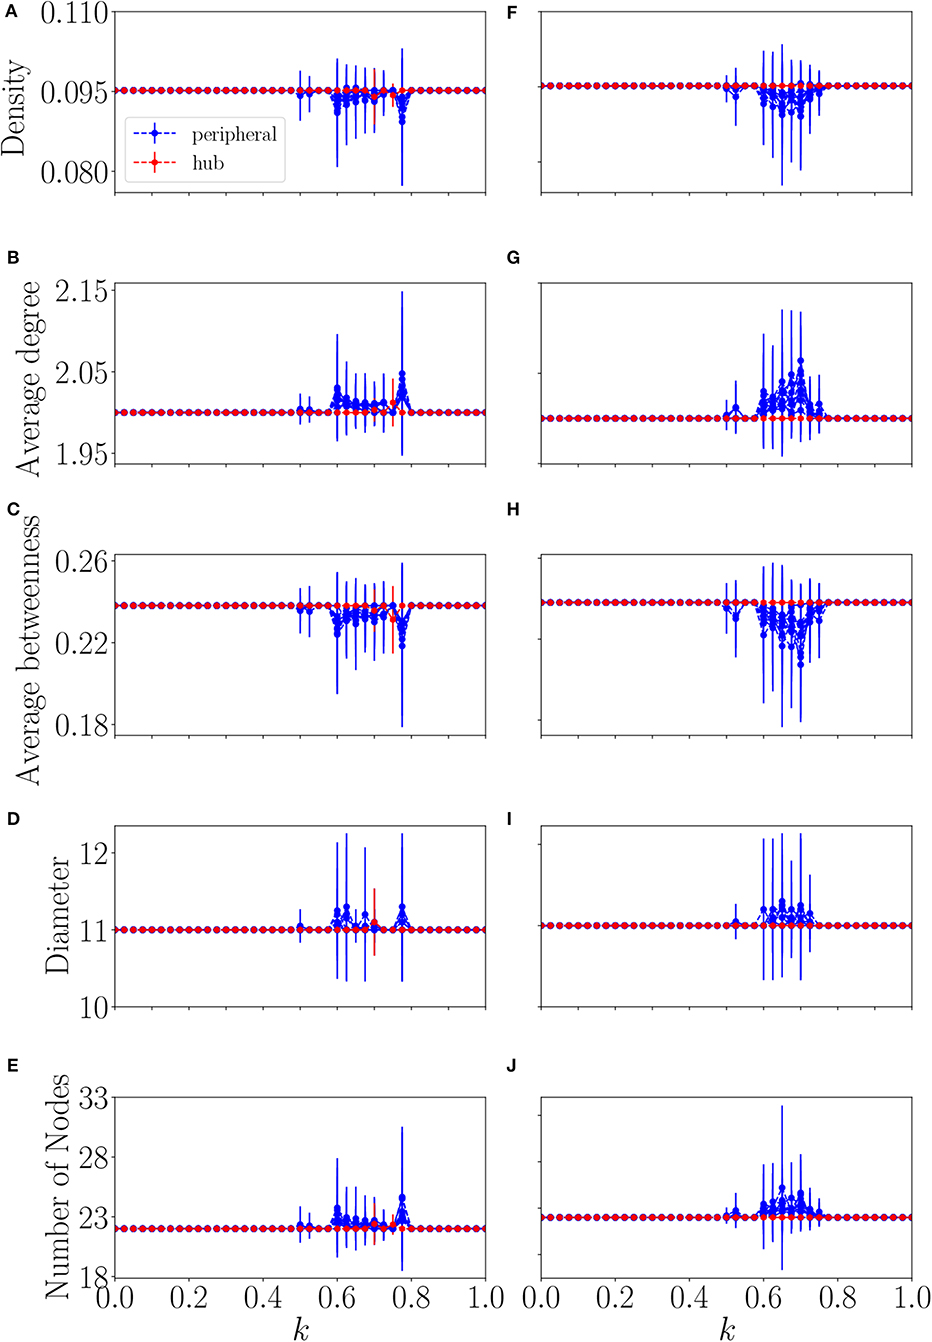
Figure 8. Network 2. Mean and standard deviation of the network metrics (A,F) density, (B,G) average degree, (C,H) average betweenness, (D,I) diameter, and (E,J) average number of nodes as a function of coupling k. The plots on the left refer to Star 1, the plots of the right column refer to the Star 2. Values of metrics related to the peripheral nodes are in blue and related to the hub are in red.
First, we discuss the second region presented above, as it is the region of multistabilty. As previously discussed, considering Figure 7, the system enters the region of multistability which for both stars begins at the coupling k>0.575. Following our definition at the beginning of the paper that we consider that the system reaches remote synchronization when rindirect>0.99, the upper limit of the region of multistability would then be 0.65 for Star 1 and 0.675 for Star 2. But, if we want to be more rigorous and say that the system reaches remote synchronization only when rindirect equals exactly one, this region would then be 0.575 < k <0.8 for Star 1 and 0.575 < k <0.775 for Star 2. So, our method with the DCSD and the complex network statistics, with exception of the diameter, is accurate enough to predict the region of multistability even when the value of rindirect is between 0.99 and 1.0. Also, the increase of the standard deviation of all measures at 0.75 < k <0.8 in Figure 8 for Star 1 indicates that something else is taking place in this region and this in the exact region where there is a drop in the value of , which indicates that the level of incoherence has increased. As for the first region detected by the DCSD method, nothing was detected by the usual metrics and this region has yet to be studied.
4. Conclusions
In this paper, an alternative approach to detect multistability in remote synchronization was proposed. Instead of using the usual metrics like the partial synchronization index, the methodology proposed in this work makes use of symbolic dynamical characterization and complex network statistics. This approach has already been used to characterize and detect periodic windows and chaos in non-linear systems and, for our knowledge, it is the first time that it is used in the study of synchronization and multistability phenomena. Results show that this methodology is also able to detect the region where multistability takes place as the values of all complex networks statistics used show a high standard deviation and a distinct mean value inside this region when compared to the values outside it where all metrics are constant and have a standard deviation close to zero, the only metric used here that didn't present a significant result was the diameter. However, this method is not able to differ from a synchronized to a non-synchronized dynamics as the mean values of all the metrics are the same in both of these regions of coupling. From the complex network statistics, we were able to show that the networks generated by our method present a greater number of nodes, diameter and average degree inside the multistability region when compared to the mean value of the metrics outside of this region. The method proposed in this work was also able to detect a region where there is an increase in the level of incoherence of the hub in relation to the peripheral nodes in a region where the coupling was increasing. We believe that the partial synchronization index and the method proposed in this work should be used together as one complements the other.
Data Availability Statement
The datasets generated for this study are available on request to the corresponding author.
Author Contributions
JL performed numerical simulations and wrote the manuscript with input from all authors. CF and EM advised the entire research.
Funding
JL would like to thank the Conselho Nacional de Desenvolvimento Científico e Tecnológico - CNPq for the financial support. This research was also supported by grant 2015/50122-0 of São Paulo Research Foundation (FAPESP) and DFG-IRTG 1740/2.
Conflict of Interest
The authors declare that the research was conducted in the absence of any commercial or financial relationships that could be construed as a potential conflict of interest.
References
1. Arenas A, Díaz-Guilera A, Kurths J, Moreno Y, Zhou C. Synchronization in complex networks. Phys Rep. (2008) 469:93–153. doi: 10.1016/j.physrep.2008.09.002
2. Kuramoto Y. Self-entrainment of a population of coupled non-linear oscillators. In: International Symposium on Mathematical Problems in Theoretical Physics. Berlin; Heidelberg: Springer-Verlag (1975). p. 420–2. doi: 10.1007/BFb0013365
4. Panteley E, Loria A, El Ati A. On the stability and robustness of stuart-landau oscillators. IFAC Pap Online. (2015) 48:645–50. doi: 10.1016/j.ifacol.2015.09.260
5. Pikovsky A, Rosenblum M, Kurths J. Synchronization. Vol. 12. Cambridge: Cambridge University Press (2003).
6. Daniels BC. Synchronization of globally coupled nonlinear oscillators: the rich behavior of the Kuramoto model. Ohio Wesleyan Physics Dept Essay. (2005) 7:20–76.
7. Boccaletti S, Pisarchik AN, Del Genio CI, Amann A. Synchronization: From Coupled Systems to Complex Networks. Cambridge: Cambridge University Press (2018). doi: 10.1017/9781107297111
8. Leyva I, Sendi na-Nadal I, Sevilla-Escoboza R, Vera-Avila V, Chholak P, Boccaletti S. Relay synchronization in multiplex networks. Sci Rep. (2018) 8:1–11. doi: 10.1038/s41598-018-26945-w
9. Fischer I, Vicente R, Buldú JM, Peil M, Mirasso CR, Torrent M, et al. Zero-lag long-range synchronization via dynamical relaying. Phys Rev Lett. (2006) 97:123902. doi: 10.1103/PhysRevLett.97.123902
10. Wu JG, Wu ZM, Xia GQ, Deng T, Lin XD, Tang X, et al. Isochronous synchronization between chaotic semiconductor lasers over 40-km fiber links. IEEE Photon Technol Lett. (2011) 23:1854–6. doi: 10.1109/LPT.2011.2170212
11. Da Silva IG, Buldú JM, Mirasso CR, Garcia-Ojalvo J. Synchronization by dynamical relaying in electronic circuit arrays. Chaos. (2006) 16:043113. doi: 10.1063/1.2374860
12. Sawicki J, Omelchenko I, Zakharova A, Schöll E. Synchronization scenarios of chimeras in multiplex networks. Eur Phys J Spcl Top. (2018) 227:1161–71. doi: 10.1140/epjst/e2018-800039-y
13. Gutiérrez R, Sevilla-Escoboza R, Piedrahita P, Finke C, Feudel U, Buldu JM, et al. Generalized synchronization in relay systems with instantaneous coupling. Phys Rev E. (2013) 88:052908. doi: 10.1103/PhysRevE.88.052908
14. González-Miranda JM. Generalized synchronization in directionally coupled systems with identical individual dynamics. Phys Rev E. (2002) 65:047202. doi: 10.1103/PhysRevE.65.047202
15. Gambuzza LV, Cardillo A, Fiasconaro A, Fortuna L, Gómez-Gardenes J, Frasca M. Analysis of remote synchronization in complex networks. Chaos. (2013) 23:043103. doi: 10.1063/1.4824312
16. Bergner A, Frasca M, Sciuto G, Buscarino A, Ngamga E, Fortuna L, et al. Remote synchronization in star networks. Phys Rev E. (2012) 85:026208. doi: 10.1103/PhysRevE.85.026208
17. Abrams DM, Strogatz SH. Chimera states for coupled oscillators. Phys Rev Lett. (2004) 93:174102. doi: 10.1103/PhysRevLett.93.174102
18. Laing CR. Chimera states in heterogeneous networks. Chaos. (2009) 19:013113. doi: 10.1063/1.3068353
19. Schöll E. Synchronization patterns and chimera states in complex networks: interplay of topology and dynamics. Eur Phys J Spcl Top. (2016) 225:891–919. doi: 10.1140/epjst/e2016-02646-3
20. Tyloo M, Jacquod P. Global robustness vs. local vulnerabilities in complex synchronous networks. arXiv [Preprint]. arXiv:190503582 (2019). doi: 10.1103/PhysRevE.100.032303
21. Kuramoto Y. Chemical Oscillations, Waves, and Turbulence. Vol. 19. New York, NY: Springer Science & Business Media (2012).
22. Gómez-Gardenes J, Moreno Y, Arenas A. Paths to synchronization on complex networks. Phys Rev Lett. (2007) 98:034101. doi: 10.1103/PhysRevLett.98.034101
23. Pisarchik AN, Feudel U. Control of multistability. Phys Rep. (2014) 540:167–218. doi: 10.1016/j.physrep.2014.02.007
24. Feudel U. Complex dynamics in multistable systems. Int J Bifurcat Chaos. (2008) 18:1607–26. doi: 10.1142/S0218127408021233
25. Lacerda J, Freitas C, Macau E. Multistable remote synchronization in a star-like network of non-identical oscillators. Appl Math Modell. (2019) 69:453–65. doi: 10.1016/j.apm.2018.12.026
26. Freitas VL, Lacerda JC, Macau EE. Complex networks approach for dynamical characterization of nonlinear systems. Int J Bifurc Chaos. (2019) 29:1950188. doi: 10.1142/S0218127419501888
27. Yu X, Jia Z, Jian X. Logistic mapping-based complex network modeling. Appl Math. (2013) 4:1558. doi: 10.4236/am.2013.411210
28. Hénon M. A two-dimensional mapping with a strange attractor. In: The Theory of Chaotic Attractors. New York, NY: Springer (1976). p. 94–102. doi: 10.1007/978-0-387-21830-4_8
29. May RM. Simple mathematical models with very complicated dynamics. Nature. (1976) 261:459–67. doi: 10.1038/261459a0
Keywords: synchronization, multistability, Stuart-Landau, remote synchronization, symbolic dynamics
Citation: Lacerda JC, Freitas C and Macau E (2020) Symbolic Dynamical Characterization for Multistability in Remote Synchronization Phenomena. Front. Appl. Math. Stat. 6:15. doi: 10.3389/fams.2020.00015
Received: 02 March 2020; Accepted: 20 April 2020;
Published: 08 May 2020.
Edited by:
Vijay Kumar Yadav, Nirma University, IndiaReviewed by:
Miguel Pineda, University College London, United KingdomAlexander N. Pisarchik, Polytechnic University of Madrid, Spain
Copyright © 2020 Lacerda, Freitas and Macau. This is an open-access article distributed under the terms of the Creative Commons Attribution License (CC BY). The use, distribution or reproduction in other forums is permitted, provided the original author(s) and the copyright owner(s) are credited and that the original publication in this journal is cited, in accordance with accepted academic practice. No use, distribution or reproduction is permitted which does not comply with these terms.
*Correspondence: Juliana C. Lacerda, anVsaWFuYS5sYWNlcmRhQGlucGUuYnI=