 Leonid Hanin
- Department of Mathematics and Statistics, Idaho State University, Pocatello, ID, United States
In this article, we challenge the existing paradigm that greater tumor shrinkage at the end of treatment leads to longer patient survival. In particular, we identify biological conditions under which the exact opposite is true. A central role in our argument about the paradoxical effect of tumor shrinkage is played by the emergence and self-selection of subpopulations of increasingly faster proliferating cancer cells. This evolutionary factor is often at work during post-treatment tumor regrowth and has a decidedly negative impact on patient survival. We analyze various patterns of post-treatment tumor dynamics and show that if the clones generated by cancer cells present at the end of treatment or the start of a treatment break evolve independently then greater tumor shrinkage leads to progressive enrichment of the re-growing tumor with faster proliferating cells. Importantly, greater tumor shrinkage favors independent clonal expansion. Our findings explain numerous clinical cases where initial tumor shrinkage to undetectable levels was promptly followed by an aggressive tumor recurrence. They also suggest that indiscriminate use of tumor shrinkage as surrogate endpoint in clinical trials should be discouraged.
Introduction
Local or systemic treatment of solid cancers including external beam radiation, brachytherapy, cytotoxic chemotherapy, immuno-, hormonal or targeted therapy has been so far largely dominated by the idea that a malignant tumor should be treated as soon as possible with the maximum dose a patient can tolerate. In the final analysis, this “frontloading” approach is rooted in the fact that a dead cell will never produce offspring. In the case of fractionated radiation, the validity of the frontloading principle can be proved mathematically under very broad, well-defined conditions [1]. However, the maximum tolerated dose (MTD) approach faces two principal challenges. The first is toxicity of anti-cancer drugs and radiation that increases with the dose, thus limiting both the dose rate and the total dose administered to a patient, and negatively affects the patient's overall survival. The second challenge is the pre-existing or emerging resistance to treatment, i.e., selection and proliferation of malignant clones that carry resistant genotypes and/or epigenetically modified resistant phenotypes facilitated by massive elimination of sensitive cells.
More recently, various “smart” multi-drug treatment strategies based on the idea that sensitive cancer cells and/or tumor microenvironment can help control the growth of the resistant cancer cell population were proposed. For example, an evolutionary game formalism accounting for synergistic and antagonistic interactions between sensitive, resistant, and stromal cells and aiming to reach more favorable patient outcomes through rational treatment sequencing and timing was developed in [2]. As yet another example, a personalized approach to treatment relying on a different aspect of evolutionary game theory and based on adaptive selection of drugs and doses depending on the results of periodic assessment of tumor volume and composition was formulated in [3].
In this article, we bring into focus a commonly occurring, yet quite often neglected, evolutionary factor that can cause long-term failure of cancer treatment, be it MTD-based or “smart”– the emergence and self-selection of subpopulations of increasingly faster proliferating cancer cells. Even acting alone, this factor may bring about treatment failure and shorten disease-free, progression-free, and overall survival. Typically, however, it acts in concert with other sources of resistance exacerbating their effects.
The following observation is of paramount importance in the context of this article. The post-treatment period including the breaks between treatment cycles tends to select faster proliferating cancer cells, unless the therapy eradicates cancer completely, or induces a stable disease. In fact, as the residual tumor regrows after treatment, faster proliferating cells will dominate over time the surviving population of cancer cells provided that their fitness is superior or comparable to that of slower proliferating cells. In summary, for every cancer therapy that fails to eliminate or stabilize the disease, treatment holidays are likely to act as a filter that enriches the surviving cancer cell population with faster proliferating cells. Such enrichment may also occur, although perhaps to a lesser degree, during treatment.
That progressive enrichment of the residual tumor with faster proliferating cells has a decisively negative effect on a patient's overall survival is clear. In an untreated patient, this would cause the residual tumor to reach a lethal size over a shorter period of time. If a patient is undergoing treatment then to counter accelerated tumor growth and metastatic dissemination, oncologists have to administer progressively higher doses of more potent anti-cancer drugs. If such treatment fails, as it often does, aggressive proliferation of multi-drug resistant residual tumor and its metastases as well as snowballing side effects will dramatically shorten the patient's remaining lifetime.
Tumor shrinkage is a quantitative measure commonly used to assess the effects of local or systemic cancer treatment. The extent of tumor shrinkage is measured at the end of treatment or one of its cycles in accordance with RECIST guidelines [4]. Tumor shrinkage is used for treatment planning and is widely considered a convenient, readily measurable surrogate endpoint that leads to acceleration of clinical trials, and thereby faster approval of anti-cancer drugs and other interventions resulting from such trials.
There seems to be an almost universal agreement among cancer biologists and oncologists that greater tumor shrinkage entails longer patient survival. An ostensibly compelling reason for such a conclusion is that the smaller the initial tumor size at the end of treatment the greater the time it will take a re-growing tumor to reach a certain fixed threshold used to define a specific survival endpoint, such as disease-free, recurrence-free, or overall survival. This rationale is rooted in a tacit assumption that the dynamics of tumor growth post-treatment is independent of the tumor shrinkage factor. That this assumption is unrealistic follows from the following biological considerations borne out by a vast body of knowledge amassed in cancer biology:
1. Due to the treatment-induced decrease in cell density surviving cancer cells enjoy a greater supply of space, nutrients, oxygen, and growth factors, which is likely to decrease the rates of their death and quiescence and thus to increase their net proliferation rates. Furthermore, this effect is likely to be more pronounced for larger tumor shrinkage. In radiation therapy, the phenomenon of treatment-induced accelerated tumor repopulation has been recognized long ago [5–7].
2. Genomic instability of cancer cells leads to spontaneous emergence of malignant clones with higher net proliferations rates. If such clones are fit enough compared to slower proliferating cancer cells then their survival, combined with the aforementioned filtering effect of treatment breaks, will cause the range of net proliferation rates within the residual tumor to shift to the right, i.e., to higher values. Again, greater tumor shrinkage makes survival of such aberrant clones more likely.
3. Random biological variation causes the net proliferation rates of daughter cells to deviate somewhat from those of mother cells. The filtering effect of treatment breaks will tend to gradually make this random drift one-directional and cause the range of net proliferation rates in the surviving cancer cell population to shift to the right.
In this article, we seek to identify biological conditions under which greater tumor shrinkage in an individual patient may lead to shorter survival. Because, as mentioned above, enrichment of the surviving tumor cell population with faster proliferating cells leads to poorer survival, the main research question we pursue below is as follows: What are the effects of tumor shrinkage on the progressive enrichment of the residual tumor with faster proliferating cancer cells? To answer this question and uncover factors bearing on these effects, we employ mathematical analysis of cancer population dynamics. Detailed tumor dynamics in an individual patient including the laws of growth of various sensitive and resistant subpopulations within the residual tumor are unknown and largely unobservable. That is why in this article we rely on the conclusions that can be made for a number of general, and partially empirically verifiable, patterns of post-treatment tumor growth.
Another way to explore the relationship between tumor shrinkage and patient survival is through statistical data analysis. While some statistical analyses, or meta-analyses, of clinical trial data, typically based on the Cox proportional hazards model, found positive statistical association between tumor shrinkage and overall survival [8–10], other studies did not confirm such an association [11–13]. Such uncertainty is not unexpected. The reasons why statistical methodology is unlikely to definitively confirm or falsify the association of interest are discussed in section Discussion.
Below we study the dynamics of the distribution of net proliferation rates of homogeneous subpopulations forming a residual tumor post-treatment for different tumor shrinkage factors and tumor growth laws. In our analysis, we assume the set of net proliferation rates within a re-growing tumor to be fixed thus focusing our attention on conditions under which larger tumor shrinkage produces an increase in the weights of faster growing subpopulations. The aforementioned naturally occurring shift of cellular net proliferation rates within a re-growing tumor to the right will accelerate the enrichment of the residual tumor with faster proliferating cells even further.
As a technical note, the net proliferation rate of cancer cells in a homogeneous population at a given time is the difference between the rate of cell division and the combined rate of cell death from all sources (apoptosis, necrosis, and autophagy). The net proliferation rate depends on the heritable rates of “intrinsic” cellular proliferation and death as well as on short- and long-range interactions with other cancer and normal cells, the microenvironment, and the immune system. Quiescent cells do not contribute to the net growth rate. Because cell cycle duration in proliferating cells can only vary within narrow limits, the main cause of increase in the net proliferation rate is a drop in the cell death and/or quiescence rates. Such a drop may be due to cell migration, decreased competition with other cells, enhanced supply of space and essential chemicals through more efficient usage of the existing vasculature or neo-angiogenesis, beneficial interaction with other cells and the microenvironment, and through the development of immune system evasion capabilities. Finally, by distribution of net cell proliferation rates in a heterogeneous population at time t we mean the collection of these rates at the time t together with the fractional sizes, or weights, at the time t of homogeneous subpopulations forming a given population.
In this article, a re-growing tumor is thought of as consisting of a subpopulation of quiescent cells and finitely many subpopulations growing according to certain laws. These growing subpopulations may be defined by such cellular characteristics as spatial localization, degree of clonogenicity, oxygenation level, presence of certain mutations or membrane markers, being sensitive or resistant to treatment, etc. In the case of tumors driven by cancer stem cells, the quiescent subpopulation may include the cancer stem cells (assumed to be dividing asymmetrically) while other subpopulations may consist of their descendants in various stages of differentiation. In this case, the growth laws depend, among other factors, on transition rates between the constituent subpopulations. Various versions and particular cases of this general model will be considered in the next three sections.
Methodology And Proof of Principle
To introduce our methodology and give a proof of the principle that greater tumor shrinkage may favor the enrichment of a residual tumor with faster proliferating cancer cells, consider the following simple schematic example. Suppose a pre-treatment cancer cell population forming a solid primary or secondary tumor consisted of N0 cells, and that the size of the population of surviving cells post-treatment is kN0, where k, 0 < k < 1, is the tumor shrinkage factor. Notice that greater tumor shrinkage is associated with smaller values of k. We assume that the surviving population consists of a stable subpopulation and two subpopulations that grow exponentially with net growth rates λ and 2λ. The stable subpopulation may consist of quiescent and/or stem-like cancer cells dividing asymmetrically. Let the respective fractional sizes, or weights, of the stable and growing subpopulations at the end of treatment be q, 1-p-q and p, where 0 < p, q < 1 and p+q < 1, so that p is the weight of the faster growing subpopulation. Then for time t, counted from the end of treatment, when the re-growing tumor will reach a certain size of interest, denoted μN0, where μ > k, we have
Equivalently, in terms of x = exp{λt},
Solving this equation for x we find that
At the time t determined by Equation 1 the fraction, r(k), of faster proliferating cells is kp exp{2λt}/μ = kpx2/μ, and in view of Equations 2 and 3 we find that
where
Interestingly, r(k) is independent of λ. Thus, by the time t the composition of the tumor cell population post-treatment transitioned from (q, 1-p-q, p) to (kq/μ, 1-r(k)-kq/μ, r(k)).
An elementary algebraic computation based on Equations 4 and 5 would show that r(k) > p for all k < μ, which confirms the intuition about the filtering effect of treatment breaks, see section Introduction. Importantly, it follows from Equations 4 and 5 that r(k) is a decreasing function of k and r(k) approaches 1 as k → 0. In particular, for a balanced surviving population without quiescent cells (p = 0.5, q = 0) in the case μ = 1 (i.e., when the re-growing tumor reaches its pre-treatment size) we have
How r(k) depends on k for μ = 1, p = 0.5 and q = 0, 0.1, 0.2, 0.4 is shown graphically in Figure 1B. For comparison, Figures 1A,C show this dependence for an unbalanced residual tumor with p = 0.25 and p = 0.75, μ = 1 and the above values of q such that p+q < 1. Figures 1A–C display a qualitatively similar pattern of the dependence of r on k and clearly demonstrate that r(k) → 1 as k → 0.
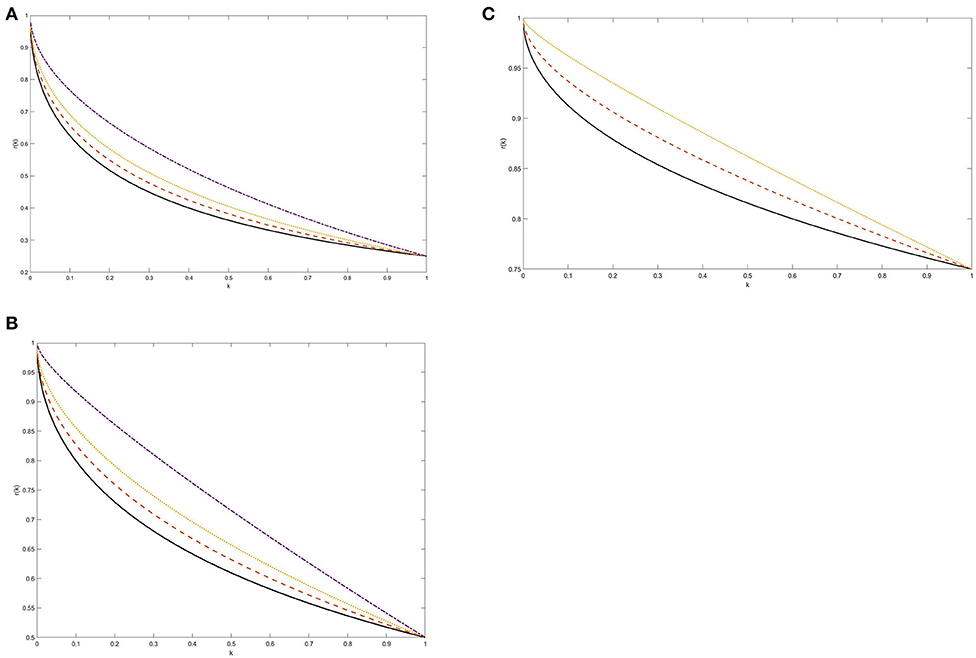
Figure 1. (A–C) The weight of the faster growing subpopulation as a function of tumor shrinkage factor k: Exponential kinetics. The weight r(k) was computed from Equations 4 and 5 at the time when the size of a re-growing tumor reaches its pre-treatment level. Two surviving tumor subpopulations were assumed to grow according to exponential laws with unspecified net rates λ and 2λ. The post-treatment growing subpopulation was assumed either balanced (p = 0.5, B) or symmetrically unbalanced (p = 0.25, A and p = 0.75, C). The following values for the weight of the quiescent cancer cell population were adopted, assuming q <1-p: q = 0 (solid line), q = 0.1 (dashed line), q = 0.2 (dotted line), and q = 0.4 (dashed-dotted line). See section Methodology and Proof of Principle for more details.
Thus, in the case at hand, greater tumor shrinkage leads to a progressive enrichment of the recurrent tumor with faster proliferating cells. This result is not entirely surprising: larger tumor shrinkage leaves more room for the growth of the residual tumor, which over time is increasingly dominated by faster proliferating cells. Below we identify more general post-treatment tumor dynamics scenarios that produce the same effect.
Residual Tumor Growth: Independent Clonal Expansion Model
The exponential growth law considered in the previous section can be derived mathematically from the assumption that cells proliferate and die independently of each other at constant rates. This law provides a good approximation to the dynamics of various treated and untreated tumors both in experimental [14] and clinical [15] settings, especially at the initial stages of tumor growth. We now describe a more general pattern where, as above, larger tumor shrinkage leads, barring complete tumor ablation or induction of a stable disease, to greater enrichment of the residual tumor with faster proliferating cancer cells. Suppose that proliferating clones generated by cancer cells present at the end of treatment or the start of a treatment break do not interact with each other. By contrast, we allow arbitrary interactions between cancer cells within the same clone.
We assume that along with a subpopulation of quiescent cells there are two subpopulations of growing clones—one expanding according to a growth law f(t) and another in accordance with a law of the form g(t) = f(t)h(f(t)), where f and h are increasing differentiable functions such that f(0) = 1 and h(1) = 1. This implies that the second subpopulation grows faster than the first one.
The three most prominent specific examples of such clonal growth laws are as follows:
A. Exponential growth laws, where f(t) = exp{λt} and g(t) = exp{γλt} with λ > 0 and γ > 1. Here h(x) = xγ−1. The case γ = 2 was considered in the previous section.
B. Gompertz laws, where
with λ, β > 0 and γ > 1. Here again h(x) = xγ−1. Functions y = f(t) and y = g(t) satisfy the following ordinary differential equation (ODE)
where α = λ or γλ. This implies that λ and γλ are the intrinsic net growth rates of the clones within the two respective subpopulations while β is the rate of growth inhibition, assumed the same in both subpopulations. Note that as β → 0 the two Gompertz growth laws degenerate into the above exponential laws. In an exponentially growing population, the per-cell net proliferation rate remains constant: y′/y = λ. By contrast, under the Gompertz growth law, it decreases with the increase in the population size: y′/y = α - βln y. The adequacy of the Gompertz law has been confirmed empirically for certain experimental [16, 17] and clinical [18] tumors.
C. Power growth laws of the form f(t) = (1+ct)a and g(t) = (1+ct)b with a, c > 0 and b > a, in which case h(x) = xb/a−1. The power law was first used to describe tumor growth in the 1960s [19]; for more recent applications of this law, see [20, 21].
Similar to Equation 1 we have
where k, 0 < k < 1, is the shrinkage factor, μ > k, and q, 1-p-q, p are the fractional weights of the respective three subpopulations at the end of treatment. Setting in Equation 8 x = f(t) we find that
compare with Equation 2. It follows from our assumptions that Equation 9 has a unique solution x = x(k). Differentiating Equation 9 in k and using our assumption that the weights p, q and function h are independent of k we obtain:
Therefore,
In view of Equation 9 for the scaled weight, ρ(k) = μr(k), of the faster growing subpopulation at time t determined by Equation 8 we have: ρ(k) = kpxh(x) = μ – kq – k(1-p-q)x. Then
Using Equation 10 we obtain after some algebra
Thus, dr(k)/dk < 0, which means that larger tumor shrinkage leads to progressive enrichment of the surviving population with faster proliferating cells.
To compute the limiting value, rmax, of r(k) as k → 0, we derive from Equations 8 and 9 that
If the growth law f(t) is unbounded (as is the case for exponential and power laws) then x → ∞ as k → 0. Therefore, if function h(x) is also unbounded then Equation 11 implies that rmax = 1. Alternatively,
where L = h(∞) in the case of an unbounded function f and bounded function h and L = h[f(∞)] in the case of a bounded (e.g., Gompertz) function f.
Our argument can be generalized to the case where the surviving population of cancer cells consists of any number of non-interacting homogeneous subpopulations with distinct net growth rates. Such subpopulations may consist of sensitive or resistant cells. As an example, we demonstrate that the above-described effect of tumor shrinkage holds for exponentially growing subpopulations. Let the surviving population of cancer cells at the end of treatment or one of its cycles consist of a quiescent subpopulation with weight q and n exponentially growing subpopulations with net growth rates λ1 < λ2 < … < λn and initial post-treatment weights p1, p2, …, pn > 0 such that q + p1 + p2 + …+ pn = 1. Then, similar to Equations 1 and 8
where parameters q, λj and pj, 1 ≤ j ≤ n, are again assumed to be independent of the shrinkage factor k. Setting x = exp{λnt} and γj = λj/λn, 1 ≤ j ≤ n, we represent Equation 12 in the form
Therefore, x → ∞ as k → 0. Differentiating this equation in k we find that
Then for the weight, r = r(k), of the fastest growing subpopulation given by
we have
Combining the inequalities in Equations 13 and 15 we conclude that r(k) is a decreasing function of k. Also, it follows from Equation 14 that r(k) approaches 1 as k → 0.
Expansion of Interacting Clones: Gompertzian Growth
We now analyze the effects of tumor shrinkage on the distribution of net proliferation rates in a cancer cell population where cell interaction is allowed to happen not only within the clones generated by initiator cells present at the end of treatment or the start of a treatment break but also between the clones within the same homogeneous subpopulation. The most widely used growth law allowing for such interactions is the Gompertz law.
Consider a cell population growing according to the Gompertz law. The size, y(t), of such population satisfies the following ODE
which is the same as Equation 7 except now we are not limited to the case N0 = 1. Here, as above, λ represents the intrinsic net proliferation rate and β is the rate of growth inhibition due to cell-to-cell interaction, competition for space, nutrients, oxygen and growth factors, and other reasons. The solution of Equation 16 has the form
compare with Equation 6 corresponding to the case N0 = 1. Thus, the size of the population at time t is identical to the total size at time t of a population of N non-interacting clones with the same Gompertz kinetic parameters. The limiting size of the population as t → ∞ is K = exp{λ/β}, which is independent of N0 and represents the carrying capacity of the environment. The Gompertz growth law given by Equation 17 can be alternatively represented as
Suppose a residual tumor consists of two non-interacting subpopulations, S1 and S2, whose growth is governed by Gompetrz laws with respective parameters λ1, β and λ2, β, where λ2 > λ1. As above, we let k denote the shrinkage factor, p be the weight of the faster growing subpopulation, S2, at the end of treatment, and
represent the respective carrying capacities. We assume that there are no quiescent cells. For time t when the total population reaches a given size M, where kN0 < M < K1 + K2, we set z = exp{-βt} to obtain
or equivalently
Therefore, the time t satisfying this equation is a decreasing function of the tumor shrinkage factor k.
Denote by y1 and y2 the respective sizes of subpopulations S1 and S2 at the time t. Notice that the relative weight, r(k) = y2/M = y2/(y1+y2), of subpopulation S2 has the same pattern of monotonicity in k as the ratio y2/y1. The same is also true for the ratio u2/u1 of population sizes scaled to their carrying capacities. Then, see Equation 18,
The ratio u2/u1 depends on k only through variable z (or equivalently, time t). If at the end of treatment subpopulation S2 had a larger weight relative to its carrying capacity i.e., if
then Equation 20 implies that under the above assumptions and for any given threshold, M, for the total population size and any pre-treatment tumor size N0, greater tumor shrinkage followed by tumor repopulation will favor the expansion of the slower growing subpopulation S1. Conversely, if at the end of treatment subpopulation S1 constituted a larger fraction of the residual tumor, relative to its carrying capacity, than the faster growing subpopulation S2 then greater tumor shrinkage will favor expansion of subpopulation S2 at the expense of S1. Notice a stark contrast with the case of non-interacting clones where tumor shrinkage confers a blanket advantage on the faster growing subpopulation.
To illustrate a complex dependence of the weight of the faster growing subpopulation of cancer cells on the shrinkage factor for a fixed total population size in the case of Gompertzian kinetics, we selected the following values of model parameters: (i) K1 = 1013 cells and K2 = 2 · 1013 cells, which implies that λ2 is 2.3% larger than λ1; (ii) N0 = 109 or 1010 cells (i.e., about 1 or 10 cm3); (iii) the overall survival endpoint was defined as reaching the total tumor size of M = 1012 cells, assumed lethal; and (iv) for the initial post-treatment weight, p, of the faster growing subpopulation we chose two values: p = 0.5 and p = 0.8 (notice that p = 0.8 satisfies the inequality in Equation 21 while p = 0.5 does not). With these parameters, the weight, r(k), of the faster growing subpopulation is given by
where z is related to k through Equation 19. The results shown in Figures 2A,B for the two selected values of N0 confirm the aforementioned dependence of the monotonicity pattern of r(k) on the relationship between p/K2 and (1-p)/K1, see Equation 21. It follows from Equation 19 that z approaches 0 as k → 0, and from Equation 22 we conclude that the limiting value of r(k) as k → 0 is 2/3, which is clearly seen in Figure 2.
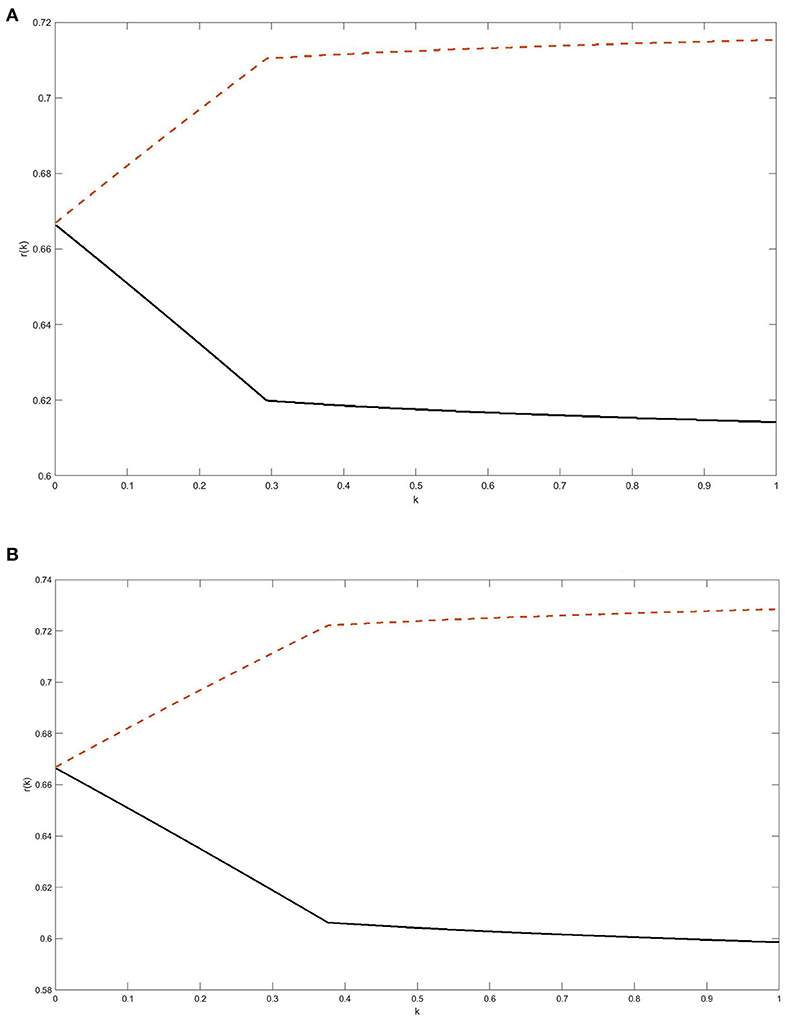
Figure 2. (A,B) The weight of the faster growing subpopulation as a function of tumor shrinkage factor k: Gompertzian kinetics. The two surviving subpopulations of cancer cells were assumed to grow independently according to Gompertz laws with the same unspecified growth inhibition parameter β and carrying capacities K1 = 1013 cells and K2 = 2.1013 cells. The initial pre-treatment tumor size was assumed N0 = 109 cells in A and 1010 cells in B. The weight r(k) of the faster growing subpopulation was computed at the time when re-growing residual tumor reaches a lethal size M = 1012 cells. For the initial post-treatment weight, p, of the faster growing subpopulation we adopted the values of p = 0.5 or p = 0.8; the respective plots for r(k) are the lower (solid) curve and the upper (dashed) curve in (A,B). For background and relevant equations, see section Expansion of Interacting Clones: Gompertzian Growth.
In the foregoing examples, the effects of greater tumor shrinkage on the qualitative dynamics of the fastest growing subpopulation was either universal, as in the independent clonal growth model, see the previous section, or dependent only on a combination of kinetic parameters of the two populations and the compositional parameter p of the cancer cell population at the end of treatment, as in the above Gompertz model. In the case of two independently evolving Gompertz subpopulations with distinct values of the growth inhibition coefficient β the pattern of such dynamics changes with time. Even more complex pattern can be expected when the residual tumor consists of several interacting subpopulations.
Discussion
In this article, we explored systematic biomedical reasons behind the hypothesis that greater treatment-induced tumor shrinkage may lead to shorter overall survival of cancer patients. To validate this hypothesis, we viewed the effects of tumor shrinkage on post-treatment survival through the lens of progressive enrichment of a recurrent residual tumor with increasingly faster proliferating cancer cells. Such an enrichment occurs post-treatment or during treatment breaks and clearly has a negative effect on long-term survival of cancer patients. The enrichment results from four mechanisms: (A) progressive dominance of faster proliferating cells that occurs in every re-growing heterogeneous tumor post-treatment provided that faster proliferating cells have higher, or similar, fitness compared to slower proliferating cells; (B) increase in the net proliferation rates of surviving cancer cells due to a greater per-cell supply of space, oxygen, nutrients, and growth factors as well as to diminished competition between cancer cells for these resources; (C) emergence of aberrant malignant clones with higher net proliferation rates whose expansion and domination are facilitated by the above factors A and B; and (D) random deviation of net proliferation rates of daughter cells relative to those of mother cells, which in combination with the filtering factor A and facilitating factor B causes a gradual shift of the spectrum of net proliferation rates to the right. Greater treatment-induced tumor shrinkage tends to make the effects of processes A-D even more pronounced. Additionally, tumor shrinkage occurs mostly at the expense of sensitive cancer cells while leaving resistant cells essentially intact. The emergence of faster proliferating resistant subpopulations narrows treatment options, necessitates dose escalation with an attendant increase in the risks and severity of adverse side effects, and often leads to treatment failure.
We showed that in the case where clones generated by the surviving cancer cells grow independently of each other more extensive tumor shrinkage leads to greater enrichment of a re-growing tumor with faster proliferating cells, see section Residual Tumor Growth: Independent Clonal Expansion Model. In this argument, we assumed that the pattern of post-treatment dynamics of the residual tumor does not change over time. In reality, the above mechanisms B, C and D will likely make the rate of the enrichment even greater. Conversely, in the case of significant interaction between surviving clones such as the one occurring under the Gompertz growth model, larger tumor shrinkage may bestow greater or lesser advantage on faster proliferating cells, depending on the kinetics of the surviving subpopulations, the initial composition of the residual tumor, the tumor shrinkage factor, and time.
Thus, somewhat paradoxically and contrary to the common belief that greater tumor shrinkage is universally beneficial and increases patient survival, it can be expected that in a significant fraction of patients increased tumor shrinkage is actually a predictor of treatment failure and will entail shorter survival. Furthermore, this conclusion is likely to be true for various kinds of local and systemic treatment and across many types of solid cancer and stages of the disease.
Are there clinical scenarios where independent propagation of the clones generated by surviving cancer cells present at the end of treatment or the start of a treatment break, and hence the paradoxical effect of greater tumor shrinkage on patient survival, is likely to occur? First, extensive tumor shrinkage may leave enough space and create sufficient supply of essential chemicals for the surviving clones to grow independently, at least on the initial stages of tumor repopulation. Second, surviving cancer cells that have preexisting or acquired migration capability will tend to spread over a larger volume; the resulting spatial separation of the initiator cells will reduce interaction between their clones. Third, such separation of clones may be due to anatomic reasons; for example, primary colon tumor grows through the expansion of clones anatomically sequestered in crypts and the involvement of new crypts in the carcinogenic process through crypt fission [22]. Fourth, many cancers form deposits on nutrient- and oxygen-rich surface of blood vessels. When the surviving cancer cells on such a surface spawn their clones, the presence of a spatial dimension orthogonal to the surface reduces the inter-clone competition for space, which would tend to make the expansion of such clones independent as along as contact inhibition and competition for resources do not play a significant role in the dynamics of clonal expansion.
It is well-known that tumor latency time from the emergence of the first malignant clonogenic cell to the event of tumor detection typically comprises many years or even decades. Yet in a large number of clinical cases tumor shrinkage to undetectable levels induced by local or systemic treatment is followed by aggressive tumor recurrence within just a few months. The results of this study offer a natural explanation of this phenomenon.
Our results also suggest that the choice between the MTD and “smart” approaches to cancer treatment is a delicate one. One the one hand, resistant cells pose a greater threat to patients' survival than sensitive cells, and constraining accelerated proliferation of resistant cells through competition with sensitive cells seems a reasonable “smart” approach conducive to the patients' overall survival. On the other hand, cancer cells usually become resistant to a given treatment through acquisition of new functions whose maintenance requires extra energy and material resources. As a result, resistant cells are generally expected to be less fit than sensitive cells [23]. Therefore, the residual tumor is more likely to be progressively enriched with faster proliferating sensitive cells than resistant ones, which would favor a more aggressive treatment against sensitive cells. Thus, adaptive combinations of the two treatment strategies like the ones advocated in [3] seem to be most promising.
Many cancer patients whose tumor shrunk to undetectable levels as a result of treatment are declared “cancer-free” and put on a laxer follow-up schedule than patients whose treatment did not result in such a dramatic reduction of tumor burden. Quite often, tumor recurrence in such highly responsive patients is detected through onset of symptoms rather than in the course of a pre-scheduled medical exam. The results of this work suggest a recommendation that cancer patients with extensive tumor shrinkage should be followed up, at least initially, as frequently as other cancer patients, and perhaps even more so. It is expected that the proposed management of this well-defined group of patients will require relatively few additional resources.
Timely detection of rapid recurrence in cancer patients whose treatment resulted in extensive tumor shrinkage requires development of highly sensitive biomarkers that would reliably differentiate between fast growing and indolent tumors before they become visible on CT, PET, MRI, and other diagnostic images.
In this study, we identified one mechanism leading to shorter overall survival of cancer patients—progressive enrichment of the residual primary or secondary tumor with faster proliferating cells that occurs post-treatment or during treatment breaks. In many patients, this largely unobservable process manifests clinically as distant metastatic relapse. There is a competing mechanism that may bring about the same clinical outcome—treatment-induced escape from metastatic dormancy and accelerated growth and vascularization of those active metastases that remain undetected during the treatment of the primary tumor. In the case of breast cancer, the widespread presence of dormant metastases at the time of primary tumor detection and their role as critical determinant of long-term patient survival were demonstrated in the body of work by Bernard Fisher that spanned more than half-century, see his reviews [24, 25]. More generally, a compelling new paradigm of cancer centered around tumor dormancy was formulated in [26]. The aforementioned metastasis-promoting effect of the treatment of primary tumor is due to a number of factors:
(1) Suppression of metastasis by the primary tumor. Starting with the pioneering works [27, 28] published in the 1910s this phenomenon was observed in many animal studies, see comprehensive reviews [29, 30]. It would come as no surprise, then, that extensive shrinkage of the primary tumor could accelerate metastasis; moreover, one would expect this effect to be proportional to the extent of tumor shrinkage. In the case of primary tumor resection, rapid outgrowth of metastases in animal models was directly observed in [27, 28] and since then in countless experimental studies and clinical cases, as reviewed in [29–33]. A detailed experimental investigation of the interruption of dormancy of the immune system-controlled distant tumors in mice triggered by primary tumor resection was conducted in [34]. Finally, mathematical modeling revealed considerable acceleration of metastatic growth in ten prostate cancer patients treated with chemotherapy and adjuvant hormonal therapy [35].
(2) Increased local and systemic production of growth and angiogenesis factors required for the healing of injury caused by radiation treatment. For a discussion of the role of wounding in promotion of metastasis, see [36] and references therein.
(3) Transient inflammation and temporary immunosuppression that may cause metastases to escape from dormancy and evade immune surveillance. To quote a seminal experimental study by Panigrahy et al. [37], “Cancer treatment is a double-edged sword, as surgery (including biopsy), chemotherapy, or radiation can induce tumor-dormancy escape and subsequent metastatic outgrowth by impairing tumor-specific immunity through inflammation-mediated growth signals and loss of resolution of inflammation…”
One would expect that the utility of tumor shrinkage as a predictor of long-term survival could be confirmed through statistical analysis, or meta-analysis, of data resulting from observational studies, or clinical trials. Results of such analyses, however, are controversial [8–13]. This can be explained by five non-mutually exclusive factors. First, observations of tumor shrinkage and long-term survival of patients are often separated by long periods of time, typically ranging from a few months to many years. Quite often, various health-related events and interventions occur over this period of time, which may affect the association of interest. Second, short- and long-term responses of patients to treatment are often very heterogeneous: while some patients fail to positively respond to treatment, responses of others may lie anywhere between partial and complete; additionally, the treatment may produce side effects ranging from minor and transient to permanent and life-threatening, which may also affect long-term survival in many essential ways. Such heterogeneity of responses may preclude rigorous statistical analysis [38]. Third, as discussed above, survival effects of the progressive enrichment of a recurrent residual primary tumor with increasingly faster proliferating cancer cells are confounded by those of treatment-induced acceleration of metastasis, which makes separation of these two factors by statistical means a daunting task. Furthermore, in many cases reduction in patient survival time caused by both mechanisms is expected to be more pronounced for greater tumor shrinkage. Fourth, statistical methods utilized to ascertain an association between short-term response to treatment and its long-term benefits are predicated on various untestable assumptions. For example, the Cox proportional hazards model widely used for this purpose depends on the empirically untestable, and most likely unrealistic, assumption that unobservable individual hazard functions of cancer patients in a queried group associated with a long-term outcome of interest are proportional. Finally, the gap between the real goal of establishing a cause-and-effect relationship between tumor shrinkage and improvement in long-term survival of cancer patients on the one hand and confirming a statistical association or correlation between them on the other hand is a formidable one to fill [39].
Progressive enrichment of the residual tumor with faster proliferating cells has a universal prerequisite—interruption or termination of treatment, usually due to toxicity and/or emergence of resistance. One therapy type where such interruption does not have to occur necessarily is metronomic treatment, i.e., continuous exposure to low doses of an anti-cancer drug, which is the exact opposite of the MTD approach. The metronomic treatment strategy resulted from a cancer growth model developed in [40] and was successfully tested by Dr. Michael Retsky, one of the authors of that study, on his stage IIIc colon cancer [41–43]. Our results suggest that benefits of metronomic treatments deserve a thorough investigation.
We have shown that greater tumor shrinkage does not necessarily translate into improved long-term patient survival. Thus, tumor shrinkage may be a poor surrogate for long-term survival endpoint in clinical trials of anti-cancer drugs and other interventions. Moreover, for some potentially identifiable categories of cancer patients and treatment modalities, considerable tumor shrinkage may serve as a predictor of treatment failure. Their identification will add more nuance and realism to treatment planning, increase utility of clinical trials, stimulate the design of better and more personalized treatments, and ultimately improve patient survival outcomes.
Author Contributions
LH is responsible for all components of the manuscript and all aspects of its preparation.
Conflict of Interest
The author declares that the research was conducted in the absence of any commercial or financial relationships that could be construed as a potential conflict of interest.
References
1. Hanin L, Zaider M. Optimal schedules of fractionated radiation therapy by way of the greedy principle: biologically-based adaptive boosting. Phys Med Biol. (2014) 59:4085–98. doi: 10.1088/0031-9155/59/15/4085
2. Basanta D, Scott JG, Fishman MN, Ayala G, Hayward SW, Anderson ARA. Investigating prostate cancer tumour-stroma interactions: clinical and biological insights from an evolutionary game. Br J Cancer. (2012) 106:174–81. doi: 10.1038/bjc.2011.517
3. Stanková K, Brown JS, Dalton WS, Gatenby RA. Optimizing cancer treatment using game theory: a review. JAMA Oncol. (2019) 5:96–103. doi: 10.1001/jamaoncol.2018.3395
4. Eisenhauer EA, Therasse P, Bogaerts J, Schwartz LH, Sargent D, Ford R, et al. New response evaluation criteria in solid tumours: revised RECIST guideline (version 1.1). Eur J Cancer. (2009) 45:228–47. doi: 10.1016/j.ejca.2008.10.026
5. Ang KK, Thames HD, Jones SD, Jiang G-L, Milas L, Peters LJ. Proliferation kinetics of a murine fibrosarcoma during fractionated irradiation. Radiat Res. (1988) 116:327–36. doi: 10.2307/3577469
6. Jones B, Dale RG. Cell loss factors and the linear-quadratic model. Radiother Oncol. (1995) 37:136–9. doi: 10.1016/0167-8140(95)01589-9
7. Tucker SL, Taylor JM. Improved models of tumour cure. Int J Radiat Biol. (1996) 70:539–53. doi: 10.1080/095530096144743
8. Piessevaux H, Buyse M, Schlichting M, Van Cutsem E, Bokemeyer C, Heeger S, et al. Use of early tumor shrinkage to predict long-term outcome in metastatic colorectal cancer treated with cetuximab. J Clin Oncol. (2013) 31:3764–75. doi: 10.1200/JCO.2012.42.8532
9. Douillard JY, Siena S, Peeters M, Koukakis R, Terwey JH, Tabernero J. Impact of early tumour shrinkage and resection on outcomes in patients with wild-type RAS metastatic colorectal cancer. Eur J Cancer. (2015) 51:1231–42. doi: 10.1016/j.ejca.2015.03.026
10. Sakamaki K, Kito Y, Yamazaki K, Izawa N, Tsuda T, Morita S, et al. Exploration of time points and cut-off values for early tumour shrinkage to predict survival outcomes of patients with metastatic colorectal cancer treated with first-line chemotherapy using a biexponential model for change in tumour size. ESMO Open. (2017) 2:e000275. doi: 10.1136/esmoopen-2017-000275
11. Advanced Colorectal Cancer Meta-Analysis Project. Modulation of fluorouracil by leucovorin in patients with advanced colorectal cancer: evidence in terms of response rate. J Clin Oncol. (1992) 10:896–903. doi: 10.1200/JCO.1992.10.6.896
12. Grothey A, Hedrick EE, Mass RD, Sarkar S, Suzuki S, Ramanathan RK, et al. Response-independent survival benefit in metastatic colorectal cancer: a comparative analysis of N9741 and AVF2107. J Clin Oncol. (2008) 26:183–9. doi: 10.1200/JCO.2007.13.8099
13. Colloca GA, Venturino A, Guarneri D. Early tumor shrinkage after first-line medical treatment of metastatic colorectal cancer: a meta-analysis. Int J Clin Oncol. (2019) 24:231–40. doi: 10.1007/s10147-019-01405-1
14. Skipper H, Schabel F Jr. Quantitative and cytokinetic studies in experimental tumor systems. In: Holland JF, Frei E, III, editors. Cancer Medicine, 2nd edn. Philadelphia, PA: Lea and Febiger (1982). p. 636–48.
15. Klein M, Bartoszyński R. Estimation of growth and metastatic rates of primary breast cancer. In: Arino O, Axelrod DE, Kimmel M, editors. Mathematical Population Dynamics. New York, NY: Marcel Dekker (1991). p. 397–412.
17. Norton L, Simon R. Growth curve of an experimental solid tumor following radiotherapy. J Natl Cancer Inst. (1977) 58:1735–41. doi: 10.1093/jnci/58.6.1735
19. Dethlefsen LA, Prewitt JMS, Mendelsohn ML. Analysis of tumor growth curves. J Natl Cancer Inst. (1968) 40:389–405. doi: 10.1093/jnci/40.2.389
20. Benzekry S, Lamont C, Beheshti A, Tracz A, Ebos JML, Hlatky L, et al. Classical mathematical models for description and prediction of experimental tumor growth. PLoS Comput Biol. (2014) 10:e1003800. doi: 10.1371/journal.pcbi.1003800
21. Talkington A, Durett R. Estimating tumor growth rates in vivo. Bull Math Biol. (2015) 77:1934–54. doi: 10.1007/s11538-015-0110-8
22. Humphries A, Wright NA. Colonic crypt organization and tumorigenesis. Nat Rev Cancer. (2008) 8:415–24. doi: 10.1038/nrc2392
23. Enriquez-Navas PM, Wojtkowiak JW, Gatenby RA. Application of evolutionary principles to cancer therapy. Cancer Res. (2015) 75:4675–80. doi: 10.1158/0008-5472.CAN-15-1337
24. Fisher B. Laboratory and clinical research in breast cancer: a personal adventure. The David A. Karnofsky memorial lecture. Cancer Res. (1980) 40:3863–74.
25. Fisher B. From Halsted to prevention and beyond: advances in the management of breast cancer during the twentieth century. Eur J Cancer. (1999) 35:1963–73. doi: 10.1016/S0959-8049(99)00217-8
26. Demicheli R, Retsky MW, Swartzendruber DE, Bonadonna G. Proposal for a new model of breast cancer metastatic development. Ann Oncol. (1997) 8:1075–80. doi: 10.1023/A:1008263116022
27. Marie P, Clunet J. Fréquences des métastases viscérales chez les souris cancéreuses après ablation chirurgicale de leur tumeur. Bull Assoc Française pour L'étude du Cancér. (1910) 3:19–23.
28. Tyzzer EE. Factors in the production and growth of tumor metastases. J Med Res. (1913) 28:309–32.
29. Gorelik E. Concomitant tumor immunity and resistance to a second tumor challenge. Adv Cancer Res. (1983) 39:71–120. doi: 10.1016/S0065-230X(08)61033-7
30. Chiarella P, Bruzzo J, Meiss RP, Ruggiero RA. Concomitant tumor resistance. Cancer Letters. (2012) 324:133–41. doi: 10.1016/j.canlet.2012.05.021
31. Demicheli R, Retsky M, Hrushesky WJM, Baum M, Gukas ID. The effects of surgery on tumor growth: A century of investigations. Ann Oncol. (2008) 19:1821–28. doi: 10.1093/annonc/mdn386
32. Retsky M, Demicheli R, Hrushesky WJM, Baum M, Gukas I. Surgery triggers outgrowth of latent distant disease in breast cancer: an inconvenient truth? Cancers. (2010) 2:305–37. doi: 10.3390/cancers2020305
33. Tohme S, Simmons RL, Tsung A. Surgery for cancer: a trigger for metastases. Cancer Res. (2017) 77:1548–52. doi: 10.1158/0008-5472.CAN-16-1536
34. Krall JA, Reinhardt F, Mercury OA, Pattabiraman DR, Brooks MW, Dougan M, et al. The systemic response to surgery triggers the outgrowth of distant immune-controlled tumors in mouse models of dormancy. Sci Transl Med. (2018) 10:eaan3464. doi: 10.1126/scitranslmed.aan3464
35. Hanin L, Zaider M. Effects of surgery and chemotherapy on metastatic progression of prostate cancer: evidence from the natural history of the disease reconstructed through mathematical modeling. Cancers. (2011) 3:3632–60. doi: 10.3390/cancers3033632
36. Retsky M, Demicheli R, Hrushesky W, James T, Rogers R, Baum M, et al. Breast cancer and the black swan. Ecancermedicalscience. (2020) 14:1050. doi: 10.3332/ecancer.2020.1050
37. Panigrahy D, Gartung A, Jun Yang, Haixia Yang, Gilligan MM, Sulciner ML, et al. Preoperative stimulation of resolution and inflammation blockade eradicates micrometastases. J Clin Invest. (2019) 129:2964–79. doi: 10.1172/JCI127282
38. Hanin L. Why statistical inference from clinical trials is likely to generate false and irreproducible results. BMC Med Res Methodol. (2017) 17:127. doi: 10.1186/s12874-017-0399-0
39. Hill AB. The environment and disease: association or causation? Proc R Soc Med. (1965) 58:295–300. doi: 10.1177/003591576505800503
40. Speer JF, Petrosky VE, Retsky MW, Wardwell RH. A stochastic numerical model of breast cancer growth that simulates clinical data. Cancer Res. (1984) 44:4124–30.
41. Retsky MW. Metronomic chemotherapy was originally designed and first used in 1994 for early stage cancer–why is it taking so long to proceed? J Bioequivalence Bioavailab. (2011) 3:i–iv. doi: 10.4172/jbb.100000e6
42. Retsky MW. An argument for discovery-driven research: from physicist to cancer researcher. Ecancermedicalscience. (2014) 8:ed38. doi: 10.3332/ecancer.2014.ed38
43. Bernstein J. MIA in the war in cancer: where are the low-cost treatments? ProPublica. (2014). Available online at: https://www.propublica.org/article/where-are-the-low-cost-cancer-treatment
Keywords: cancer treatment, exponential growth, Gompertz growth, net proliferation rate, overall survival, tumor shrinkage
Citation: Hanin L (2020) Paradoxical Effects of Tumor Shrinkage on Long-Term Survival of Cancer Patients. Front. Appl. Math. Stat. 6:27. doi: 10.3389/fams.2020.00027
Received: 31 January 2020; Accepted: 30 June 2020;
Published: 05 August 2020.
Edited by:
Marusia N, Bojkova, Sofia University, BulgariaReviewed by:
Oksana Sorokina, University of Edinburgh, United KingdomRainer K. Sachs, University of California, Berkeley, United States
Michael W. Retsky, Harvard T. H. Chan School of Public Health, United States
Copyright © 2020 Hanin. This is an open-access article distributed under the terms of the Creative Commons Attribution License (CC BY). The use, distribution or reproduction in other forums is permitted, provided the original author(s) and the copyright owner(s) are credited and that the original publication in this journal is cited, in accordance with accepted academic practice. No use, distribution or reproduction is permitted which does not comply with these terms.
*Correspondence: Leonid Hanin, aGFuaW5AaXN1LmVkdQ==