 Sarah B. Minucci
 Rebecca L. Heise
 Angela M. Reynolds
- 1Department of Mathematics & Applied Mathematics, Virginia Commonwealth University, Richmond, VA, United States
- 2Department of Biomedical Engineering, Virginia Commonwealth University, Richmond, VA, United States
Lung inflammation may occur due to viral and bacterial infections, structural damage, or inhalation of dangerous particles. These injuries may be quickly resolved by the immune system, treated effectively through various interventions, become chronic problems, or lead to death. Mathematical modeling has been used to understand immune system dynamics during a number of pulmonary infections and injuries, identify key mechanisms, and provide important insights into new treatments. In this review, we present long-accepted modeling techniques and novel strategies for simulating various lung injuries to highlight the usefulness of mathematical modeling in addressing these life-threatening conditions. Advances in computational power have allowed for a diverse collection of models ranging from those using only Boolean operatorsto complex hybrid multi-scale models, each specifically designed to address relevant biological questions. To illustrate the findings from these mathematical approaches, we present detailed examples, summarize results, and consider future directions from modeling influenza, pneumonia, COVID-19, tuberculosis, anthrax, and other non-infectious injuries.
1. Introduction
Inflammation in the lungs can occur for many reasons, from bacterial infections to stretch by mechanical ventilation. The immune response to these insults has been widely studied, but there is still much unknown, including the roles of immune cells such as macrophages, neutrophils and T cells and the downstream effects of subcellular signaling. Mathematical modeling is a useful tool in trying to understand complex processes like the immune system (Figure 1). Mathematical analysis and simulations can reproduce known biology and predict response to interventions. This review highlights long-accepted and well-documented modeling techniques as well as novel strategies that provide insight into the immune response in the lungs and inspiration for future models.
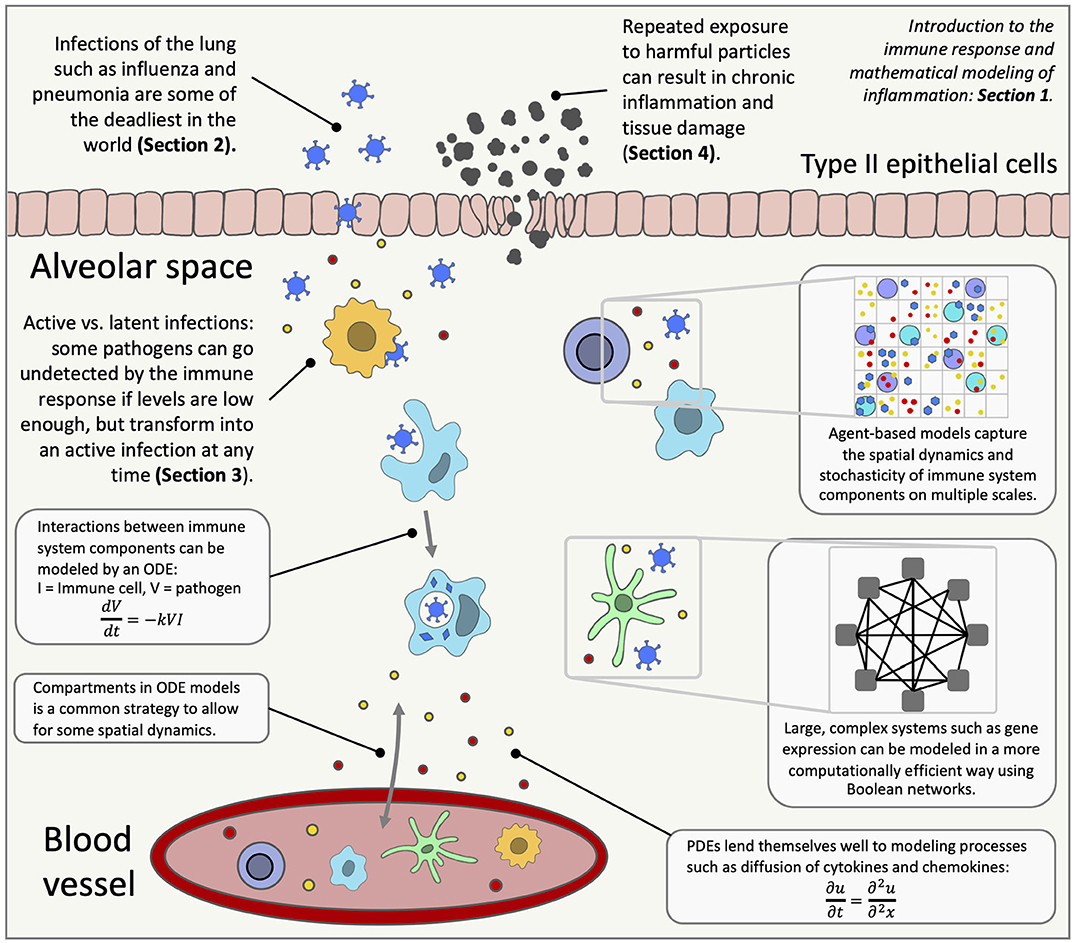
Figure 1. An overview of lung inflammation, which is the focus of this review, and the mathematical techniques used to model the immune response. ODE, ordinary differential equation; PDE, partial differential equation.
1.1. Biological Background
The immune response is triggered to protect the host from invading pathogens or tissue damage. Type I and type II alveolar cells interact with a foreign agent or respond to stress, releasing pro-inflammatory signaling proteins, including cytokines and chemokines, to elicit an immune response [1]. The innate immune system responds to these signals and provides the first line of defense, subsequently triggering the adaptive immune response which consists of immune mechanisms specific to the insult. Most immune responses involve varying intensities of both [2–5].
There are two stages of inflammation: pro-inflammatory and anti-inflammatory, classified by the cytokines that up- or down-regulate the immune cells and those produced by the immune cells. Typically the first stage is a pro-inflammatory response during which damaged cells and pathogens are destroyed [1, 6]. Innate immune cells such as neutrophils, eosinophils, and macrophages are recruited to the damaged or threatened site [7]. These cells work to remove the insult, often by phagocytizing the pathogen and sending pro-inflammatory signals to recruit other immune cells [8].
In response to pro-inflammatory roles of cytokines and chemokines, neutrophils remove damaged tissue and pathogens through a number of mechanisms, including phagocytosis and release of neutrophil extracellular traps. They also produce molecules such as serine proteases and reactive oxygen species that aid in the containment of pathogens. Though neutrophils can be very effective at eliminating foreign agents, an excessive neutrophil response or unprogrammed cell death, called necrosis, can lead to chronic inflammation [9–11]. Eosinophils release their own extracellular traps that capture microorganisms, and granules within eosinophils release proteins that participate in the removal of the inflammatory stimuli [7]. Mast cells are immune cells involved in the response to various diseases and play a role in wound healing and asthma. Mast cells are recruited from the blood and release various cytokines and chemokines such as TNF-α and IL-4 [12].
In addition to these immune cells, macrophages and dendritic cells (DCs) eliminate the threat, phagocytize debris and other immune cells, and send signals, but are also antigen-presenting cells (APCs) [3]. APCs, in general, present antigens to adaptive immune cells triggering a specific defense against the insult. Tissue-resident macrophages are already present and form a primary line of defense against pathogens. Circulating monocytes mature into macrophages, which are rapidly recruited to the site of inflammation upon damage. Macrophages have high plasticity, with the two main subtypes classified as classically activated, or M1, and alternatively activated, or M2, although these groups have overlapping features [13]. M1 macrophages release pro-inflammatory cytokines and phagocytize microorganisms, damaged cells, and apoptotic cells [14–16]. M2 macrophages generally promote regulation of inflammation and wound repair and play a critical role in resolution of allergic inflammation [17, 18]. As with macrophages there are many types of DCs, including CD103+ respiratory DCs which deal well with foreign particles and CD11bhi DCs which produce significant amounts of chemokines [1, 19].
APCs acquire antigens and migrate to the lymph nodes (LN) where adaptive immune cells are activated. APCs display the pathogen antigens on their surfaces, promoting naive T cells to develop an adaptive response specific to that pathogen [20]. T cells fall under two main categories, CD8+ helper and CD4+ cytotoxic. CD8+ T cells kill infected cells directly whereas CD4+ T cells use more indirect methods such as supporting the production of antibodies through activation of B cells [21]. Natural killer (NK) cells, from the same family as B and T cells, are involved in injuries such as influenza and tuberculosis. NK cells release high levels of cytokines, especially IFN-γ, regulate the function of other immune cells, and aid in the transition to an adaptive immune response [22].
The second stage of the immune response is the anti-inflammatory response. Pro-inflammatory signaling is down-regulated and anti-inflammatory mediators and the anti-inflammatory functions of pleiotropic mediators, such as IL-10, promote repair and a return to normal health [20, 23]. This second phase is orchestrated by both the innate and adaptive arms of the immune response [1]. An anti-inflammatory environment and phagocytosis of apoptotic neutrophils causes M1 macrophages to shift to an M2 phenotype. This shift is characterized by the decrease in production of pro-inflammatory mediators and an increase in that of anti-inflammatory and repair mediators [14, 24]. DCs also utilize a process called efferocytosis to clear apoptotic cells, contributing to initiation of the anti-inflammatory response. In addition to their role in the pro-inflammatory phase, T cells and DCs can also produce cytokines with anti-inflammatory roles [19, 25]. Another important cell type is the fibroblast, appearing at the beginning of the anti-inflammatory phase and recruited by chemoattractants such as IL-1β and TNF-α. Fibroblasts produce extracellular matrix components to support healing of damaged tissue [26].
As evidenced by the various and overlapping roles of immune cells, both innate and adaptive, and the cytokines and chemokines they produce, the immune response is complex and in many ways specific to the insult type. Furthermore, the proper shift from a pro-inflammatory response to an anti-inflammatory response is extremely important, and an imbalance in either phase can cause severe complications, especially for immunocompromised individuals [27–29]. The preceding paragraphs are meant to give an overview of the immune response and details related to specific diseases that are addressed in this review will be highlighted in the following sections.
Inflammation specifically in the lungs is caused either by a foreign insult, by tissue damage due to stretch or strain, and in rare cases, an autoimmune disorder. Infections of the lungs are some of the deadliest infections in the world [30, 31], some of which have been studied for decades such as tuberculosis, influenza, and pneumonia. On the other hand, the novel coronavirus, causing coronavirus disease 2019 (COVID-19) has precipitated a global pandemic since its first case in December 2019 and many of its underlying mechanisms and behaviors have yet to be confirmed [32]. COVID-19 is caused by SARS-COV2 and primarily attacks the respiratory system [33]. Symptoms range from none apparent to severe and life-threatening, resulting in the need for support such as mechanical ventilation [34, 35]. Co-infection with pathogens or preexisting medical conditions can be especially life-threatening. Bacterial pneumonia complicated more than 95% of the 50 million or more deaths during the 1918 influenza pandemic [36].
This review explores the mathematical modeling of various aspects of the biology summarized here. The first section focuses on acute infections that can be completely eradicated from the body given the proper immune response. We give a brief overview of COVID-19 models, but since in silico studies of the immune response to this disease are still in their infancy at the time of this review, we focus on the two infections, pneumonia and influenza. In fact, much of the morbidity associated with influenza is due to co-infection with pneumonia [37]. The bacteria which causes pneumonia, Streptococcus pneumoniae (Sp), can mutate and become resistant to antibiotics and the virus causing influenza can similarly mutate and develop new strains. In fact, antibiotic resistance is becoming an increasing concern in the global community and a significant threat to public health [38]. The need to adapt to evolving pathogens is a significant motivation for the development of mathematical models [39, 40] [for more information on the pathogenesis of these infections, see [41–44] for influenza and [45] for Sp.].
Unlike the pathogens causing influenza and pneumonia, those that cause tuberculosis and anthrax may not necessarily be fully eradicated in the body. Instead, levels can be so low that they are not acted upon by the immune system and thus rendered inactive. This is called a latent infection, and no symptoms are exhibited although an active infection and subsequent transmission may result at any point [46]. Section 3 focuses on these pathogens.
Anthrax is a serious infection caused by the bacterium Bacillus anthracis. Inhalation of anthrax occurs when anthrax spores enter the body via the respiratory tract rather than via the digestive tract or wound. Although inhaled anthrax is the rarest form of an anthrax infection [47], it is of the greatest present-day concern due to its potential as a bioterrorism threat [48]. The immune response to anthrax is not completely known; however, it is known that pathogenesis is significantly different from the immune responses to other bacterial infections and thus requires a unique model.
The bacterium that causes tuberculosis, Mycobacterium tuberculosis, is thought to infect around one-third of the world's population. Although only 5–10% of these cases actually develop symptoms [49], tuberculosis (TB) was responsible for about 1.5 million deaths in 2015 and even more in previous years, making it one of the top causes of death in the world [31]. Although many advances have been made in the prevention and treatment of both TB and anthrax, the reasons individuals experience different outcomes is unclear, precipitating modeling efforts to better understand and treat these pathogens.
In addition to viral and bacterial infections, various immune responses can be elicited from the inhalation of dangerous particles due to smoking, air pollution, and occupational exposure [50]. The third section focuses on these insults. Smoking can lead to Chronic Obstructive Pulmonary Disease (COPD), which is a largely irreversible degenerative lung disease characterized by chronic inflammation [51, 52]. Another example of chronic inflammation occurs through repeated asthma attacks over time, resulting in airway remodeling. The severity of these attacks varies from patient to patient, rendering the disease difficult to manage clinically [53]. The immune response to damage induced by mechanical ventilation (MV) has also recently received attention, especially since it can exacerbate complications from the original need for MV [54, 55]. For these conditions, the dynamics of the immune response are still incompletely understood, particularly the roles of macrophages and other inflammatory cells in airway damage and the resolution of inflammation in asthmatic and allergic episodes [56, 57].
In the following sections, we elucidate the techniques used to model these injuries and insults. Many open questions still exist to better treat infections, especially under the threat of antibiotic resistance. Furthermore, chronic inflammation is of particular interest regarding lung cancer, since there is evidence that chronic inflammation contributes to carcinogenesis [58, 59]. In addition, connections between smoking, COPD, and lung cancer have been drawn [60, 61]. In this work, we examine the different causes of lung inflammation as described above and how mathematical modeling helps understand the inflammatory response in each.
1.2. Mathematical Background
The immune system spans the organ level down to the molecular level with positive and negative feedback loops and highly non-linear behavior. Mathematical modeling addresses scales that include subcellular and molecular interactions, communication between individual cells, interaction between various cell types and other signals at the tissue level, up to host and population levels. Various types of interactions within the immune system can be modeled using mathematical techniques, providing predictions and simulations for real-life scenarios and suggesting interventions, including development and testing of new personalized treatments [62, 63]. Figure 1 gives an overview of the immune response in the lungs and highlights the mathematical modeling methods used to research diseases that trigger lung inflammation.
Differential equations are commonly used for modeling biological systems because of their ability to effectively capture non-linear behavior and demonstrate interactions between numerous variables, measuring continuous populations over time. Each state variable represents a component of a system, such as a cell, protein, or a quality like overall damage [64]. Terms in each equation may represent rates of interactions between cells or mechanisms and thus have biological significance, which is useful when analyzing the system.
Ordinary differential equation (ODE) models are used to create kinetic models describing average interactions between large numbers of cells, molecules and/or individuals. ODEs typically describe dynamics over a continuous time period, assume that the environment is well-mixed and, therefore, do not account for spatial dynamics. The model can be calibrated by fitting to time series data. A variety of mathematical and computational techniques have been developed for ODE models, including uncertainty and sensitivity analysis, optimal control methods, bifurcation analysis, and parameter estimation and identifiability [62, 65].
Some spatial features can be accounted for with compartmental ODE model. These have variables associated with cell or molecule populations in each compartment and their movement in and/or out of the compartments. For example, Marino et al. incorporated a lung compartment and a lymph node (LN) compartment into their model. This paints a more biologically realistic picture, accounting for migration of CD8+ T cells to the site of inflammation from the lymph nodes [66]. An ODE model is limited by the amount of data available; large and detailed data sets are required for higher confidence in the model and its parameters. Furthermore, the ability of ODEs to account for spatial dynamics is limited and the assumption of an environment in which populations are well-mixed is not always the case.
Delay differential equations (DDEs) are similar to ODEs, but incorporate time delays into the interactions between components. For example, Krishnapriya et al. incorporates a time delay into their model of H1N1 influenza to replicate the latency period, the time between an individual's exposure to the virus and the time when the individual becomes infectious. DDEs may result in a better fit for systems without modeling all components of the process causing the delay. Sensitivity analysis for the model by Krishnapriya et al. showed that this length of time may be important for determining the course of action in treatment [67]. Compared to ODEs, DDEs are more difficult to simulate and analyze [65].
Partial differential equations (PDEs) account for continuous time and space. Because of their multi-dimensional nature, they often require more computation time. However, PDEs have been used to track populations throughout a spatial domain, such as macrophages and cytokines in a granuloma [68] or T cells in LPS-induced experimental asthma. Stability and sensitivity analysis can be performed for PDEs [69], though this is more commonly done with ODE models.
Currently most of the differential equation models for lung inflammation are deterministic and do not include stochastic events or noise-induced variations in response. Therefore, output of the model is entirely determined by the parameter values and initial conditions, and the same results are obtained every time the simulation is repeated. Stochastic models, on the other hand, incorporate biological randomness this causes simulations with the same parameters and initial conditions to have different model output, which can sometimes vary significantly. Stochastic differential equations (SDEs) are differential equations that include one or more terms incorporating inherent randomness into the model. Stochasticity is most often applied to ODEs, though used in PDEs and DDEs as well. SDEs are more computationally complex and more difficult to parameterize than their deterministic counterparts, and to date have not been commonly used for immunological models [70].
Other stochastic models used to model lung inflammation include cellular automata (CA) models and agent-based models (ABMs). These are used to account for spatial interactions between immune components, but in a discrete manner rather than a continuous one. In both CA models and ABMs, cells, molecules, and other components of the immune response are identified as “agents.” These agents interact on a defined two- or three- dimensional space based on a set of rules informed by the behavior of the biological system. The stochastic component is a strength of these types of models, since deterministic models such as ODEs and PDEs may lose accuracy when the molecules or cells being modeled have low total counts and randomness effects their interaction rates [62]. Using a set of simple rules, highly complex behavior can emerge.
The main difference between CA models and ABMs is that in CA models, agents do not move but rather interact and are changed based on their neighborhood (often a Moore neighborhood [71]) and other processes around them. ABMs include some, if not all, agents that move around the space, interacting with other agents and making decisions. The purpose of CA models is generally to detect patterns or structures that emerge from the rules, whereas ABMs seek to explore how changes in individual agents or interactions impact overall system behavior [72]. One limitation of ABMs and CA models is that they are computationally intensive. ABMs can incorporate a variety of agent types and scales but are difficult to parameterize or analyze mathematically. Spatial domains or cell counts are reduced, in order to have a reasonable number of agents. This can lead to results that are often more qualitative, such as examining overall tissue damage [50], as opposed to the quantitative population results of a differential equations model.
Boolean networks are discrete models in which individual units are represented as nodes and the interactions between them are edges, defined by Boolean logic. By simplifying interactions in this way, large models can be constructed with high-throughput data to discover underlying system properties [73]. For example, a molecule may be represented by 0 for “unactivated/off,” then 1 for “activated/on,” when bound to its receptor. The combinations of ON, OFF, AND, OR, and NOT can be combined for more detailed interactions. These models can be developed to include pathways with hundreds of interactions and connections. Boolean models may be pruned to exclude nodes and interactions that are discovered to be unimportant by the data and can incorporate multiple scales. Boolean models do not include spatial dynamics and do not capture non-linearities well [62, 74]. Methods have been developed to analyze these large signaling networks. In Abou Jaoude et al. the authors reviewed these methods focusing on model attractors, reachability properties, reducing large models and assessing the effects on dynamics when varying external signals [75].
With the rise in computational power, models have become increasingly complex, allowing for multiple scales and model types to be integrated. Hybrid models contain two or more model types whereas multiscale models contain two or more scales; often models include both [76]. For example, Cilfone et al. incorporate details of the cytokines TNF-α and IL-10 with macrophages and other cell types to explore granuloma formation using an agent-based model for cellular and subcellular interactions. Additionally, ODEs are used to describe secretion of TNF-α and IL-10 from individual cells, and PDEs model diffusion of cytokines and chemokines throughout the lung environment. Hybrid and multiscale models are highly computationally expensive and difficult to calibrate. Optimization and sensitivity analysis are uncommon for these model types [70].
The amount and quality of available experimental data is typically a limitation for mathematical modelers because it limits their ability to accurately estimate model parameters. To account for this sparsity, advanced parameter estimation and uncertainty analysis methods have been developed [77, 78]. Alternatively, models may be simplified to capture the overall behavior of the immune system with a few parameters.
After developing a mathematical model, there are some common themes when discussing future work. Models can be made more realistic by adding more detail to the current work; for example, specific immune cell roles can be explicitly modeled rather than using parameters [79]. Other directions for future work may include refining parameter values using different estimation techniques or additional experimental data and combining with other existing models or linking across scales [80, 81].
It is worth noting that aside from replicating the dynamics of the immune system, many models focus on replicating the mechanics of the lung injuries themselves. Mathematical approaches to other topics in immunology have also been extensively covered, including T cell turnover and diversity [82, 83], intercellular communication via cytokines [84], cancer and tumor growth [70, 85], viral dynamics [41], and general immune system function [86].
In this review, we focus on mathematical models that examine the immune response caused by lung injury or disease. Each of the following sections, grouped by insult type, begins with a summary of the mathematical models used. We then choose a model to describe in greater detail; these illustrative examples showcase the methods utilized by many other models in the section and are representative of the overall direction of modeling in that field. By choosing a different model type for each section, we also provide the reader with examples of how mathematical and computational methods are implemented to illustrate immune system dynamics. Each section also includes a comprehensive view of conclusions from the models in which we link mathematical approaches to biological knowledge and identify patterns in model results.
2. Pathogen-Induced Inflammation: Pneumonia, Influenza, and COVID-19
Pneumonia, influenza, and COVID-19 are acute infections that can benefit from mathematical and computational modeling, especially given the ability of the influenza virus to mutate, the fact that much is still unknown about the novel coronavirus, and the comorbidities associated with all three. The models examined in this section aim to contribute to a more detailed and robust knowledge of the effects of various strains of these pathogens and the development of new and personalized treatments for the most susceptible individuals. Aside from the illustrative example, we outline models in this section, often grouping several together based on similarities. Tables 1, 2 focus on models for influenza and pneumonia, respectively, stating the type of model, summary of the key variables and parameters, and main results. Most mathematical models associated with COVID-19 at the time of this review are population-level spread of disease models. To our knowledge, the only model published so far on the immune response is an ODE model by Du and Yuan [121]. Wang et al. presents a community-driven effort to model COVID-19 [122], and a few other preliminary reports related to modeling the immune response to SARS-COV2 are available thus far [123, 124]. Given the limited models at this point we do not include a table for COVID-19 models.
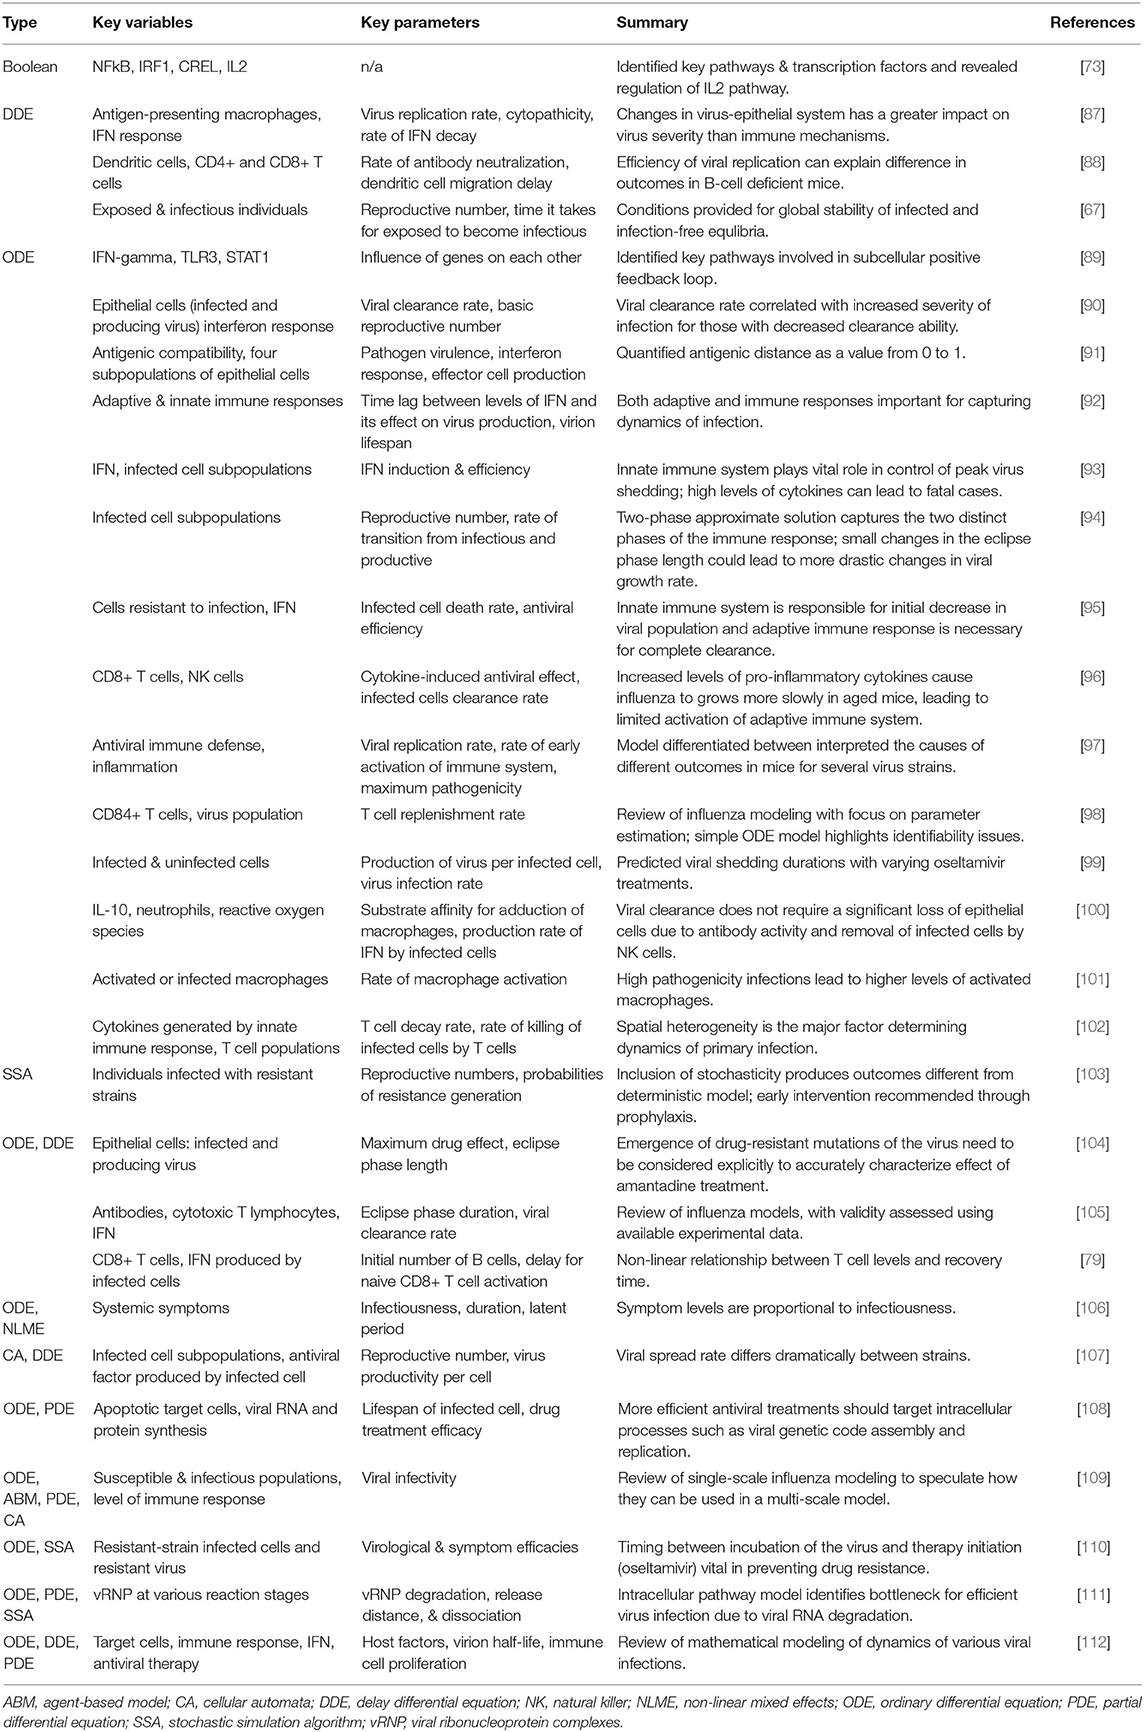
Table 1. Summary of models of influenza.
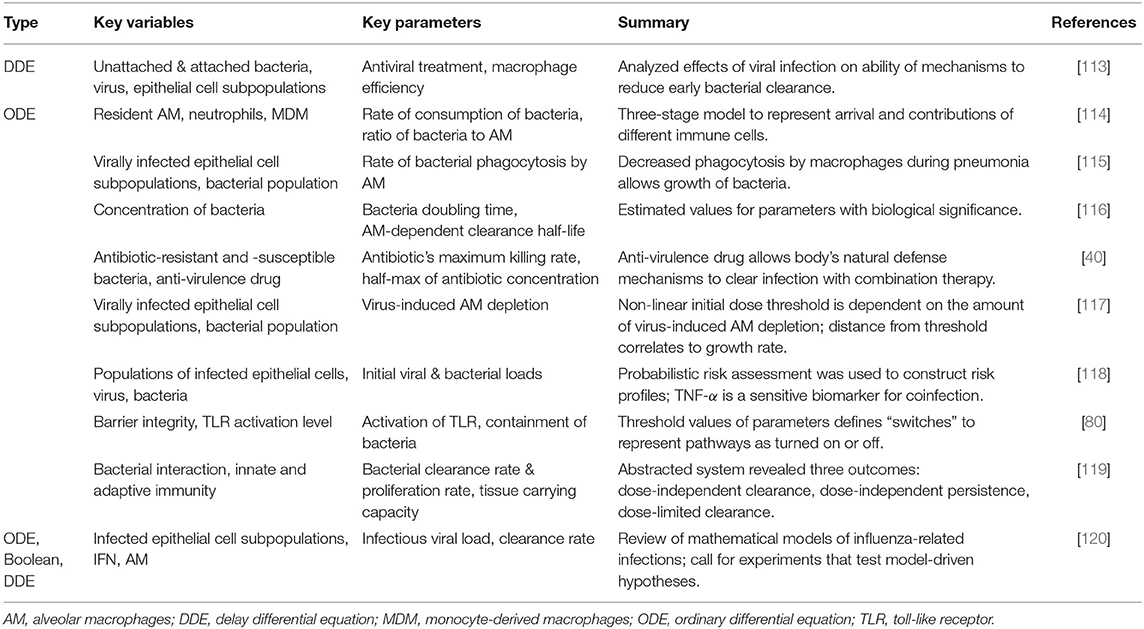
Table 2. Summary of models of host response to pneumonia and coinfection with pneumonia.
2.1. Overview and Models From the Literature
For influenza and pneumonia models, a majority are ODE-based models, which can encompass the diverse needs of the modeler. Many ODE models, especially within the context of influenza, simplify dynamics by including the virion and epithelial cells as variables. Then the severity of the infection is quantified by the amount of epithelial cells destroyed by the pathogen, tracked by one of the ODEs. The three-dimensional set of equations modeling the virus, target cells, and infected cells is commonly known as a target cell-limited model, and many of these ODE models are variations on the target cell-limited model. A model may not represent immune components by a separate equation but instead include the effects of the innate and/or adaptive immune system as parameters or terms within the equations; this provides added simplicity and computational efficiency, especially when there is a lack of data [99, 104, 108, 115–118]. For example, Miao et al. [6] and Smith et al. [94] describe the death of infected cells by a constant rate instead of explicitly modeling apoptosis by phagocytes such as macrophages. On the other hand, for a more biologically realistic model, facets of the immune response can be included as state variables to track the levels or concentrations of immune components during response to the infection. In these models, emphasis is commonly put on infected and uninfected cell populations [90, 93, 95, 115, 117], T cells [96, 98, 102], and macrophages [100, 101, 114].
Delay differential equations, though more mathematically and numerically complicated, may be used to represent delays such as the latency period (the time between entry of the pathogen into a cell and the resulting release of new pathogens from the host cell) or the time lag between production of interferon (IFN) and its effect on pathogen production [67, 79, 87, 88, 92, 104, 113]. In place of explicit delay differential equations, some modelers choose to simulate a delay by including an additional equation in an ODE model to represent different states of host cells, such as two separate populations of infected epithelial cells [90].
A few other differential equation models have been proposed. Schelker et al. considers the effects of spatial interactions through a PDE to understand how influenza is delivered into the nucleus [111] and Handel et al. uses a stochastic version of an SIR model to consider resistant strains of the virus [103].
Aside from these most common model types, Mitchell et al. developed a CA model and a set of ODEs and compared their results [107]. Murillo et al. and Smith et al. review models including differential equations and ABMs, anticipating the shift toward more complex, multi-scale models [109] and better incorporation of data [120]. A Boolean model was developed by Anderson et al. to reveal important subcellular signaling pathways within a dendritic cell [73]. We focus on summarizing more recent findings, though noteworthy contributions have heretofore been made. We select an example to illustrate one of the ways that models are used to shed light on lung inflammation. Results from a variety of models will then be discussed, demonstrating the advantages and limitations of various mathematical modeling methods.
The COVID-19 model by Du and Yuan [121] is a target cell-limited model, where the innate and adaptive immune responses are accounted for by parameters in the equations. Results from the model show that the timing of the innate and adaptive responses in relation to the time of viral load peak could be important in distinguishing mild and severe cases. Although modeling of COVID-19 is still in its early stages, understanding of the differences between this disease and other respiratory infections as well as knowledge of mathematical and computational tools to study them will be important in developing treatments and antiviral drugs.
2.2. Illustrative Example: Manchanda et al.
As mentioned previously, mathematical models can range from simple with a few dimensions to complex with multiple model types and scales. Manchanda et al. employed a simplified approach to the host response to influenza through a three-dimensional system of ODEs [97]. A condensed model is advantageous when there is limited data available; such is the case here.
The system of ODEs is shown in Equations (1–3). The first variable P, is the pathogenicity of the virus, i.e., its ability to cause an infection. D, the overall host immune defense, includes both the innate and adaptive responses. I is inflammation due to the pro-inflammatory response. Figure 2 gives the model schematics governing these interactions.
Pathogenicity, as represented by Equation (1), is controlled by the virulence of the virus (first term) and suppressed by the immune response (second term). Equation (2) shows that the immune response is activated in the presence of the pathogen and decays once the virus is cleared. Inflammation from the pro-inflammatory response, Equation (3), is characterized by the effects of cytokines and chemokines, modeled by the first term and taken from Kumar et al. [125]. The second term represents the anti-inflammatory response which counteracts pro-inflammatory behavior. The authors also include a “clinical score,” adapted from Smith et al. [126]. The clinical score (also called symptom score), a measure of how sick the host is, sheds light on the characteristics of an infection by quantifying its severity. It is calculated by:
These were sufficient to characterize the four different strains studied, two of which are shown in Figure 2B. This model is also able to link viral pathogenicity with clinical symptoms. To compare to the model clinical score, mice were assigned a laboratory clinical score ranging from 0 to 7 based on observation to gauge severity of the infection. For mice with a model-generated clinical score peak that occurred between 3 and 6 days, such as the Jena/5555 strain in Figure 2B, little inflammation was observed. Oh the other hand, high inflammation was seen for mice with a biphasic course of symptoms such as those with the Jena/5258 strain, also shown in Figure 2B. The authors speculate that this second peak in the biphasic response could be in part due to inflammation and high values for α, δ, and ϵ.
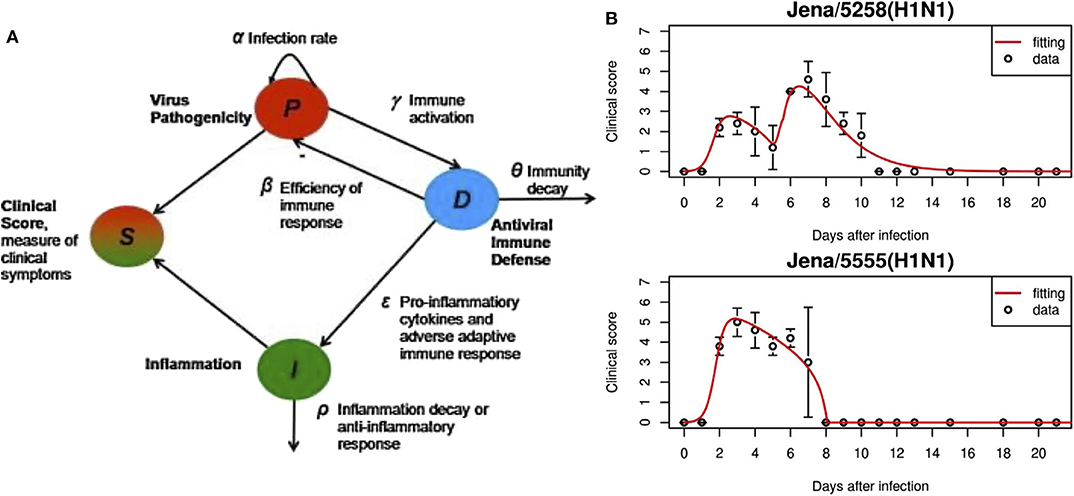
Figure 2. (A) In this model, overall responses were quantified, including pathogenicity (P), antiviral immune defense (D), overall inflammation due to pro-inflammatory response (I). S is the symptom score calculated based on the three state variables. (B) Experimental data and fitted model results for virus strains Jena/5258 and Jena/5555. Figure reprinted from Manchanda et al. [97] with permission from Elsevier.
A small-scale model can direct future mathematical and experimental efforts in the study of influenza; the main drawback is that the explanation of outcomes is reduced to differences in inflammation. As we have described, the inflammatory response is highly complex and regulated; additional work is required to parse out the specific mechanisms of inflammation that contribute to these differences.
2.3. General Results and Conclusions From Modeling Influenza and Pneumonia
The conclusions from models of influenza and pneumonia generally fall under two broad categories: (1) a further understanding of the dynamics of the immune response and (2) recommendations for antibiotic and antiviral treatments, including in the case of coinfection.
A common thread throughout many of the influenza models is an emphasis on the role of the adaptive immune response in clearing the virus [79, 88, 91, 92, 95, 96, 98, 102]. Handel et al. found that both the innate and adaptive, instead of only the innate, immune responses were needed in their model to accurately explain the data [92]. Similarly, Pawelek et al. concluded that although the considerable drop in the viral concentration after its peak is due to the innate immune response in their model, the complete elimination of virus is achieved by the adaptive immune response [95]. Other models focused on CD8+ T cells, main players in the adaptive immune response, because of their regulatory role via production of anti-inflammatory cytokines throughout the course of infection [127]. Numerous models identified the presence and effectiveness of adaptive immune cells such as antibodies and cytotoxic cells in their model as vital to recovery time and viral load [79, 88, 91, 96, 102].
Another use of mathematical modeling is estimating parameters or values that have biological relevance and are otherwise difficult or even impossible to determine [40, 90]. These parameter values can then help identify disease phenotypes or strains that could become pandemic [97]. One commonly estimated parameter is the reproductive number of the bacteria/virus or a similar threshold condition separating eradication of the pathogen and infection [67, 87, 107]. Other calculated values are the incubation period (the period of time between entrance of the pathogen into the host and recognition by the immune system) [106] and parameters related to the life of the pathogen such as pathogen half-life and bacteria doubling time [94, 104, 116].
Identifying sensitive parameters can also suggest effective treatment possibilities. Many important factors in the immune response to influenza can be quantified with only a few parameters, supporting the development of simplified systems. Based on identifiable and highly sensitive parameters, the model by Manchanda et al. revealed that adaptive immunity and early pro-inflammatory responses are some of the most impactful factors in the dynamics of influenza [97]. Baccam et al. calculated the reproductive number R0 which represents the number of new infections that an infected cell can produce [90]. Kamal et al. utilized a small-scale model, finding that treatments influencing the parameter representing viral infectivity may be effective [99]. A model developed by Smith et al. indicates that differences in outcome could be explained by small changes in the mechanism which controls bacterial-induced impairment of macrophages [115].
Often different pathogenic behaviors arise from models, and modelers categorize these behaviors to understand what may cause specific outcomes and how an individual might transition from a healthy state to an infected one. Some models delineate between the eradication of the pathogen and sustained growth [87, 114, 117, 119] whereas others go into greater detail by identifying different characterizations of the infections such as low and high pathogenicity [80, 101]. For example, Almocera et al. identifies three outcomes of pneumonia based on bifurcation parameters: dose-independent clearance, in which the infection is cleared by the immune system regardless of the bacterial dose size; dose-independent persistence, in which the immune system is unable to remove the bacteria regardless of dose; and dose-limited clearance, in which the bacteria can be cleared depending on the dose size [119]. Comparing these distinct outcomes can identify possible processes or parameter thresholds responsible for the different behaviors.
As previously mentioned, mathematical modeling provides the ideal platform to test optimal dosage and hypothesize treatments before expensive and time-consuming experiments are performed. Beauchemin et al. [104] and Canini et al. [110] consider viral resistance and its effect on treatment efficacy by including random drug-resistant mutations. Models also vary intervention time and duration [80, 88, 99, 103, 113] and determine which mechanisms the model predicts to be most useful for developing new treatments [88, 108, 112]. With regards to intervention time, some models recommend starting treatment no later than 2 days after symptoms appear for maximum efficacy [88, 101] though exact windows for effective treatment depend on various factors, such as type of intervention.
For example, in Schirm et al. a sum of time-dependent pulse functions was used to model antibiotic injections [81]. The authors found that, beginning 24 h after infection with Sp, doses of the antibiotic Ampicillin every 12 h was effective, whereas every 48 h was insufficient. Furthermore, they found a threshold of the initial number of bacteria which determined whether or not the immune system by itself could eradicate the infection. This could be useful in determining the least amount of antibiotics necessary to recover from pneumonia, decreasing chances of antibiotic resistance. Focusing on the cells affected by the infection, the model by Domínguez-Hüttinger et al. used the Boolean concept of “switches,” described as either on or off, to represent a pathway as activated or not and determine by a threshold value whether the immune system can clear the pathogen without treatment [80]. Based on the different pathogenic behaviors, at least one switch, i.e., pathway, needs to be turned off to eliminate the pathogen. Results from the model suggested that treatment within 36 h is extremely important in preventing sepsis; this was consistent with experimental observation.
Coinfection is of particular interest because of the potential threat it poses when patients already infected with the influenza virus are also infected with a bacterial infection, especially during an epidemic or pandemic. Models explore the effects of antiviral therapy in preventing the secondary infection [98, 113, 115, 117, 118]. Smith et al. emphasize the role of alveolar macrophages and how their impairment by virions affects the host's ability to fight the secondary bacterial infection [115, 117]. Shrestha et al. also examined the effects of antiviral treatment on growth of Sp. in an ODE model and found a 4-day window in which antiviral treatment can reduce the severity of a secondary infection [113].
Many authors stated that future work could involve including mechanisms not explicitly modeled in their current work [79, 98, 106, 110, 115, 118, 128], refining parameter values [80, 81, 91, 97, 114, 128], and combining their models with other existing models [80, 81]. Additional considerations that would be helpful in a greater understanding of these infections include the effects of aging [98] and spatial information [109].
3. Latent vs. Active Inflammation: Tuberculosis and Anthrax
Anthrax and tuberculosis both exhibit latent infections, in which levels of the pathogen are so low they go undetected by the immune system but can spontaneously resurface as an active infection. The main purpose of the models in this section is to further understand the complex dynamics of the infections, providing insight into the effectiveness of antibiotics and development of other treatments, especially under the threat of growing antibiotic resistance.
3.1. Overview and Models From the Literature
Tables 3, 4 provide details and frameworks of numerous tuberculosis and anthrax models, respectively, with summaries of model trends and results in the following sections. The pathogenesis of tuberculosis has been an ongoing subject of computational and mathematical modeling for decades; several thorough reviews on modeling TB have been published [164, 176, 180, 181] including recent ones from Kirschner et al. [76] and Cardona et al. [182].
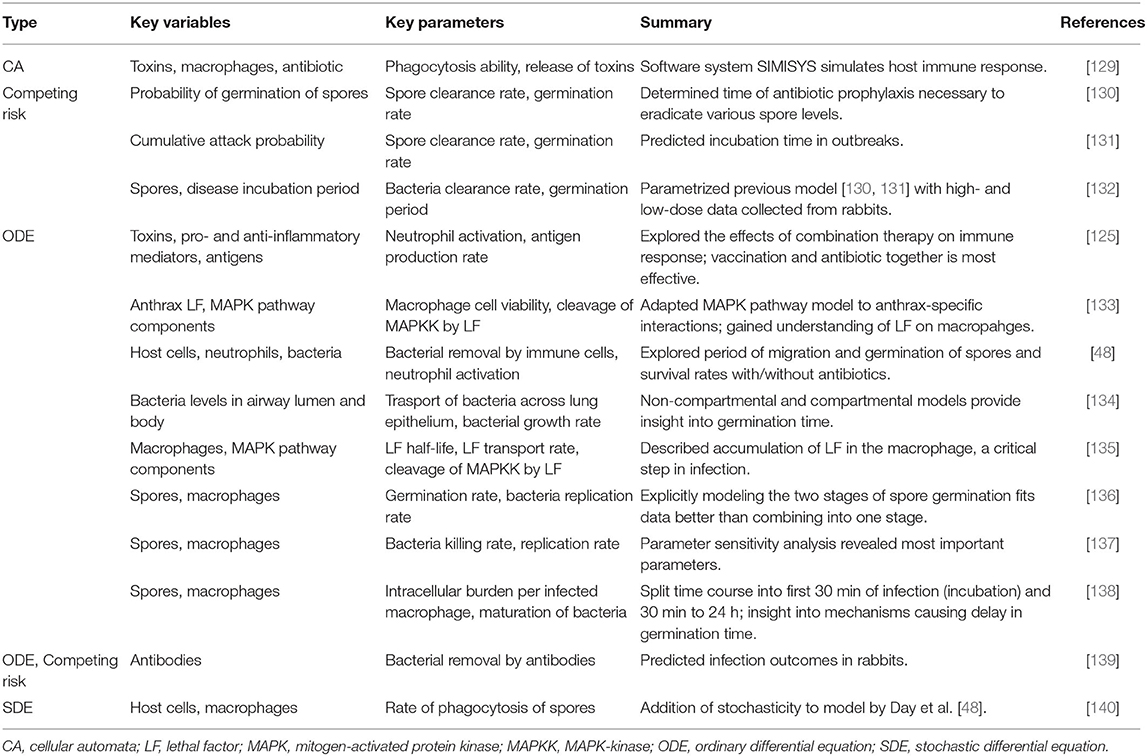
Table 3. Summary of models of host response to anthrax.
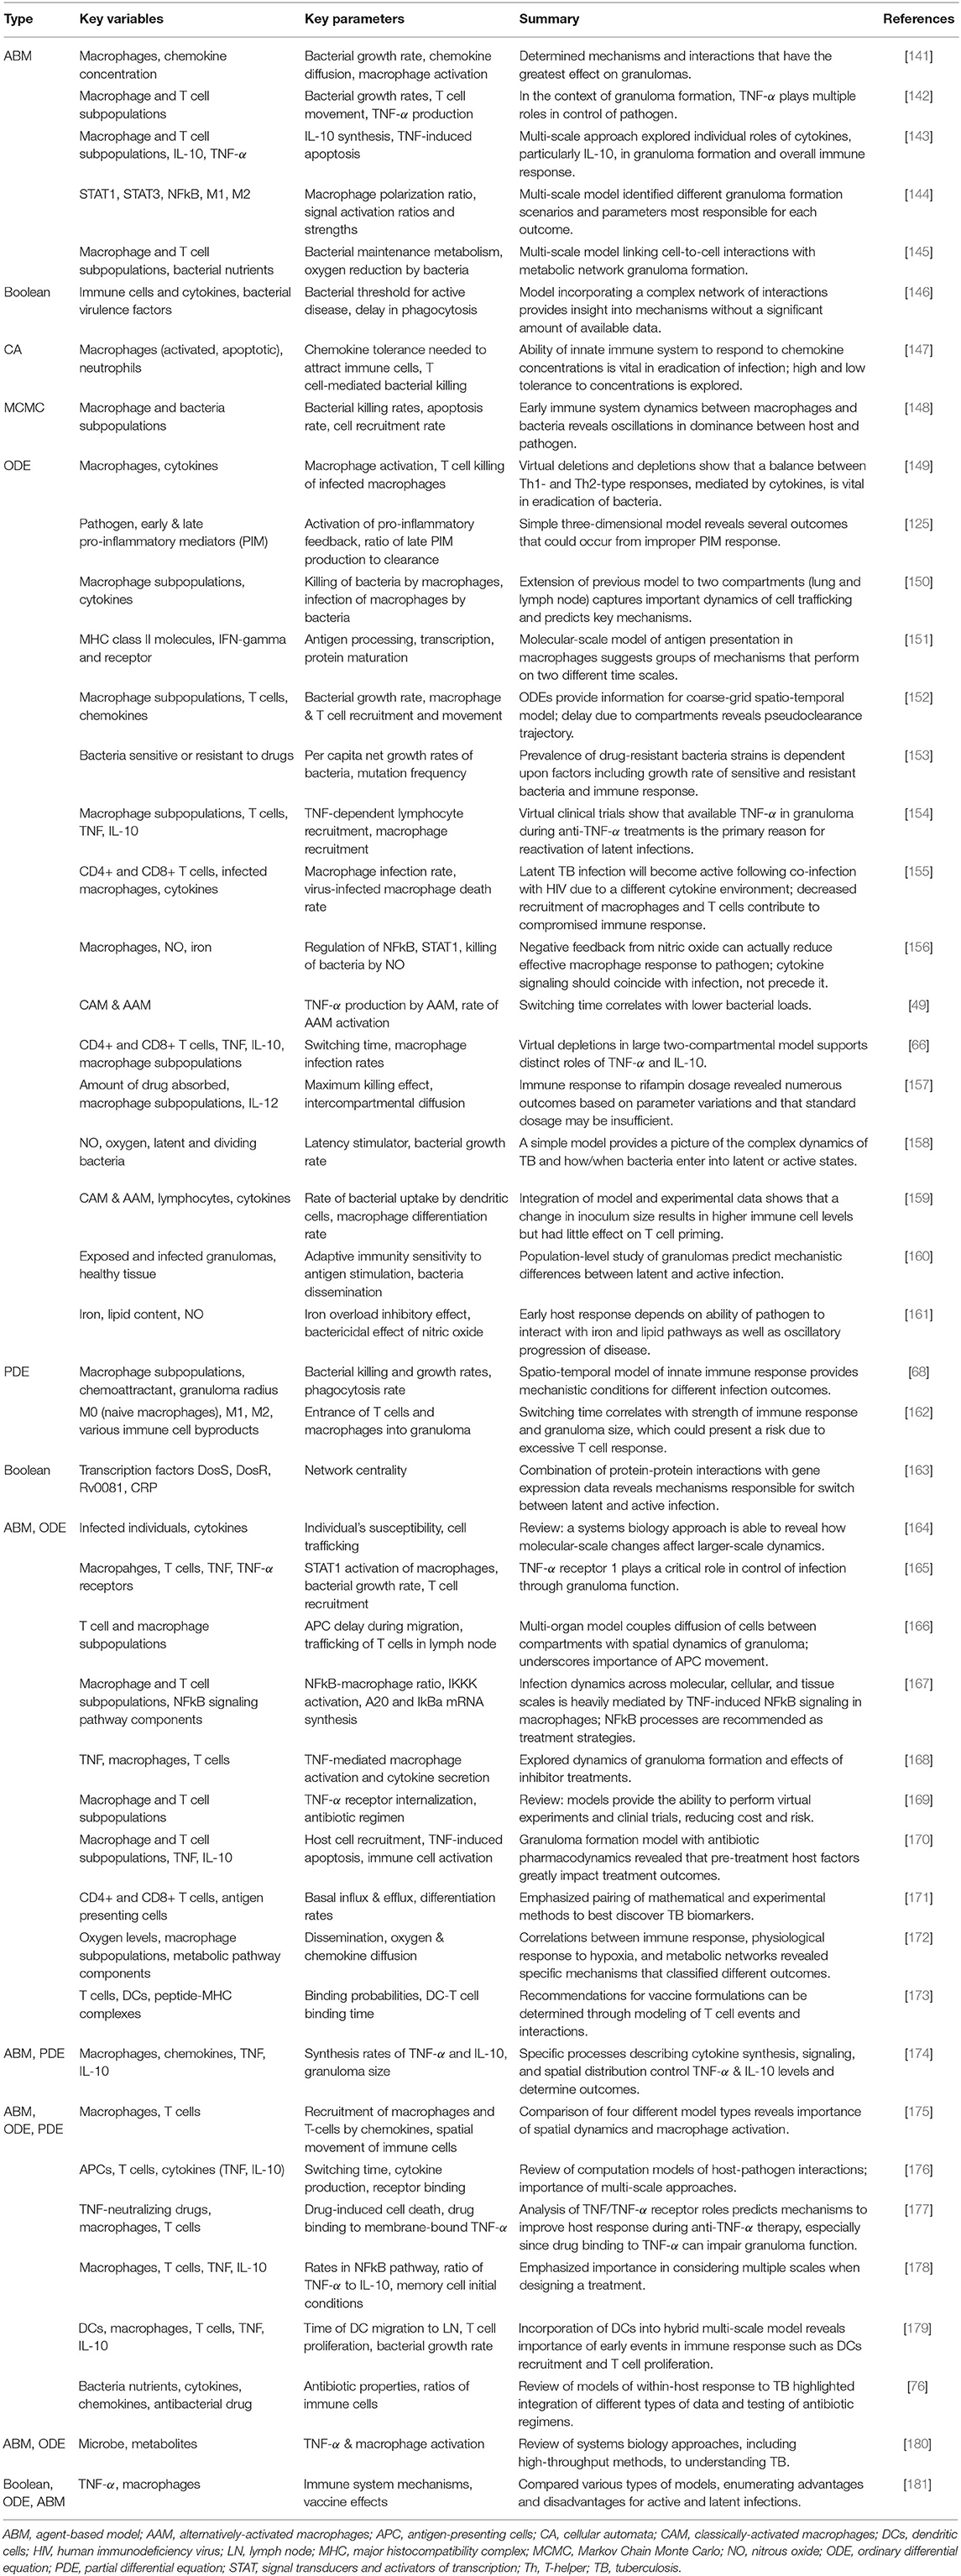
Table 4. Summary of models of host response to tuberculosis.
TB modeling has benefited greatly from an increase in computational power, leading to highly complex hybrid models. ODE models of TB generally cover cellular and subcellular interactions, especially with macrophage phenotypes, T cells, and various cytokines [49, 66, 125, 149–161, 183]. For example, Marino et al. included all three in an ODE model with 16 equations, tracking three different macrophage subpopulations, four T cell subtypes, and several cytokine concentrations [154]. PDE-only models have also been developed, modeling the spatial structure of granulomas, collections of immune cells and bacteria vital in fighting infection [68, 162].
For a different spatial approach, some modelers chose an ABM or CA model [141–145, 147]. All of these incorporate dynamics on a cellular and subcellular scale, and many are concerned with granuloma formation. Several, including those from Ray et al. [142], Cilfone et al. [143], and Bru and Cardona [147], are particularly interested in how the granuloma is affected by various cytokines. A few other methods have been used, including Boolean for cellular and subcellular interactions [146] and signaling pathways within a cell [163]. Additionally, Pienaar and Lerm used the computational Markov Chain Monte Carlo (MCMC) method to simulate molecular level interactions in which variables were discrete and stochastic but did not include a spatial component [148].
Multi-scale hybrid modeling has gained traction particularly in the area of tuberculosis modeling. Combinations of ABMs, ODEs, and PDEs are the most common and range from granuloma formation [165–168, 171, 178, 179] to properties and efficacy of antibiotic drugs [170, 173]. Generally a tissue-scale ABM is integrated with ODEs or PDEs modeling for molecular dynamics. The development of these multi-scale models will help to answer open questions about how changes on a cellular or subcellular level can impact population-level dynamics; the time scales range from minutes to decades, and the complexity of these models will introduce challenges but also great opportunity for new treatments [164].
Anthrax models are primarily ODEs, exploring the interactions between anthrax spores and immune cells [48, 133–135, 137–139, 184]. Diverse mathematical tools are used to model migration of spores, including the use of compartments [48, 134] or an additional equation [136]. A few other approaches have been used: a stochastic adaptation of an existing ODE model [140], use of a previously-develop immune system-simulating CA framework [129], and a probabilistic model called a competing risk model [130, 131, 139]. See Table 3 for more detailed descriptions of these models.
3.2. Illustrative Example: Marino and Kirschner
In the previous illustrative example, we explored the methods and benefits of a models with a few variables. These are particularly helpful when little data is available. Increases in computational power have allowed for added complexity in models. This can be seen in TB modeling, in which models have built on one another over the years, increasing in detail and scale. Furthermore, TB has been widely studied and extensive data has been collected. Thus, larger models can be developed and calibrated based on this information. In this section, we highlight one such model.
A hallmark of the immune response to TB is the development of granulomas, spherical concentrations of immune cells designed to isolate and kill the bacteria. The authors had previously developed an ABM, GranSim (http://malthus.micro.med.umich.edu/GranSim/), to model the immune response to TB, including the formation of granulomas and traffic to and from the lungs, bloodstream, and lymph nodes (LN). In this work they further expand the model to explicitly include dendritic cells, then calibrate the model to data and investigate the mechanisms driving behavior in granulomas [179].
The version of GranSim used in this illustrative example is a hybrid multi-compartmental model, shown in Figure 3A. The ABM models the formation of a single granuloma in the lung, including interactions between immune cells such as macrophages, CD4+ and CD8+ T cells, signaling molecules, and Mtb, the bacteria that causes TB. In previous versions of GranSim, DCs were represented by a more general APC agent; in this one, DCs have a role unique from other APCs in that DCs are immediately stimulated upon coming into direct or indirect contact with Mtb. Additionally, macrophages do not leave the grid whereas DCs migrate to the LN for T cell priming.
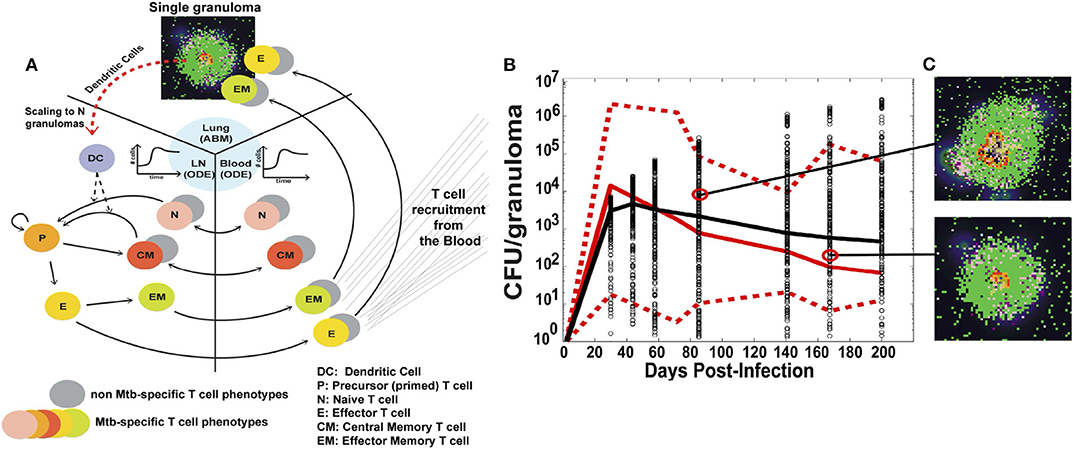
Figure 3. (A) Schematic of the three compartments in the hybrid ABM developed by Marino and Kirschner. A single granuloma is modeled by an ABM, and scaled to reflect the total number of granulomas in a host 4 weeks after infection. The total number of DCs migrating from the lungs to the LN is integrated into a set of multi-compartmental ODEs representing the LN and blood. (B) CFU per granuloma over time. Red solid and dotted lines are the median and min/max of the data, respectively. Black circles are the CFU/granuloma generated by the model for 3000 granulomas, and the black line is the median trajectory. (C) Snapshots of two different ABM simulations of a granuloma, taken at the times indicated. Figure from Marino and Kirschner [179].
The authors then linked the single granuloma model to the host scale; this connection is important to understanding how cellular-scale dynamics can affect the overall outcome of the host. The number of granulomas in a host range from 13 to 97 at 4 weeks. A scaling factor, scalingMDC, is introduced which multiplies the number of DCs migrating from a single granuloma by the total number of granulomas in the host. The total number of DCs is then passed to the bloodstream and LN compartments, modeled by a set of non-linear ODEs. This number directs the priming of T cells and their recruitment back to the lungs. The model can also control the time it takes for the DCs to reach the LN.
The model was calibrated using data primarily from humans and non-human primates (NHPs). Data was collected in the blood for T cell dynamics and in the lung for bacteria levels. The use of detailed spatial and temporal data in multiple locations is critical for a more complex model such as this, and allows for greater confidence in model results. Figure 3B shows model simulations compared to data for colony-forming units (CFU), i.e., number of bacteria, per granuloma. The stochasticity of the ABM allows the model to cover the ranges observed experimentally over time. Figure 3C shows individual snapshots of two such granulomas simulated by the model.
For uncertainty and sensitivity analysis, the authors used Latin Hypercube Sampling (LHS) to uniformly and randomly sample the parameter space and Partial Rank Correlation Coefficient (PRCC) to calculate the association between parameters and model output. PRCCs can be calculated over time to examine whether some mechanisms are more important than others at specific times.
Analysis shows that T cell priming and proliferation and the timing of DC movement to the LN are critical functions. The parameter k13, representing CD8+ T cell proliferation, generates high PRCC values for all inflammation outcomes tested, including intra- and extracellular Mtb burden and total activated macrophages. The authors also found that a delay in DC movement to the LN had a negative impact on memory T cell roles and that higher levels of DCs pre-infection resulted in better outcomes.
The authors concluded that timing is key when it comes to both the innate and adaptive immune responses to Mtb. Early protection against the bacteria results in better outcomes, and specific recommendations for intervention were strengthening DC migration and CD8+ and CD4+ T cell trafficking. The inclusion of DCs into the model allowed for new conclusions to be drawn about mounting a timely and effective immune response. Future work mentioned included an ABM formulation of LN to replicate vaccine trials and test immunotherapy strategies.
By using a multi-scale model, the authors were able to examine specific details of the immune response mechanisms driving changes in model output, connecting cell behavior to overall host response. Sufficient data over multiple scales, such as that obtained by Marino and Kirschner, is needed to make effective conclusions; this should be considered when one is choosing a modeling technique.
3.3. General Results and Conclusions From Modeling Tuberculosis and Anthrax
Although simpler models have been developed [125], in the past decade the complexity of the models of these infections has grown as more key processes, cells and mediators are included. In particular, hallmarks of TB studies focus on the granuloma [76, 141, 142, 145, 148, 152, 156, 157, 160, 165–168, 170, 171, 174, 176, 177, 179, 180], TNF-α, and other cytokine signaling [66, 142–144, 146, 149, 154, 156, 159, 163, 165, 167, 174, 177, 178, 180, 185], and the underlying mechanisms of latent infection [149, 150, 153–155, 158, 163, 181, 185, 186]. Particularly for anthrax models, the germination period, the period of time in which spores become vegetative bacteria, and incubation period, the time between initial exposure and onset of symptoms, are of great interest [48, 130–132, 136, 137, 187] and were predicted to be able to tell the difference between survival and death. In the following paragraphs we elucidate these results and find common threads throughout models.
Granuloma formation has been widely studied in the context of TB as one of the main methods used by the immune system to eliminate bacteria. Through the use of multi-scale modeling, not only granulomas as a whole but also individuals macrophages and their functions have been studied at length [66, 68, 129, 135, 137, 138, 146, 149–151, 155, 175, 188, 189]. Because granulomas are localized clusters of cells, spatial distribution was found to be a significant factor in infection outcome [156, 174]. To examine molecular interactions in granuloma, Fallahi-Sichani et al. explored the dynamics of the NFκB signaling pathway across molecular, cellular, and tissue scales in their ABM [167]. Results highlight the need for a balance between activated and infected macrophages, responding to and regulated by NFκB signaling. Several roles of TNF-α within the granuloma were also found to be critical to outcome, including interaction with its receptor [165] and polarization of macrophages via TNF-α [66, 141, 142, 144, 156].
Additionally, activation of and phagocytosis by macrophages are among the most important mechanisms of host defense [49, 68, 138, 146, 149, 150]. The spectrum of macrophage phenotypes from pro-inflammatory to anti-inflammatory has been studied more recently, including in TB research. Specifically, the “switching time,” the time point at which M1 (classically activated) macrophages becomes more dominant than M2 (alternatively activated) macrophages was a useful way to measure the M1-M2 balance. Day et al. found that an increase in the parameter k16, which controls the ability of infected AAM to inhibit bacterial growth, decreased bacterial loads but increased the switching time [49, 157, 162, 176]. Marino et al. adapted a similar approach, in which AAM immediately become infected when they engulf a bacterium and CAM kill the bacterium [66]. Models also predicted results of antibiotics and other treatments' interaction with granuloma structures [170, 177].
Coupling multiple scales can elucidate how signals and changes on a molecular scale can influence the immune response on a cellular or tissue scale [76, 143, 145, 164, 165, 167, 168, 175, 176, 178, 179, 190]. Another widely-accepted practice is the consideration of several locations in the body affected by TB through a multi-compartmental model [48, 134, 160, 171, 178, 180, 189]. This is helpful in understanding the interaction between tissues and recruitment of immune cells. Results from bringing together various scales, organs, and tissues have elucidated the processes that regulate TNF-α and IL-10 concentration [143, 165, 167, 174, 178, 180], the importance of infection rate in outcome [145, 175, 189], and the role of cell-to-cell interactions [176, 179].
Since latent infection is a significant issue and can develop into active infection at any time, many models investigated this disease scenario. Results suggest the important role of T cells [155, 186], the phagocytic capability of immune cells [149, 150], the presence of TNF-α [154], and the identification of specific proteins as drug targets [163, 181]. Other models provide suggestions for the treatment of latent infections such as TNF-α inhibitors or antimicrobial drugs [153, 154]. For example, Agliari et al. found an exact solution to their differential equations model which allowed them to predict the number of latent infections that would become active for patients undergoing anti-TNF therapy [185].
Signaling via cytokines, especially the pro-inflammatory cytokine TNF-α, has been studied extensively in the context of tuberculosis and to some extent in anthrax [133, 135]. With TNF inhibitors as a current treatment, models recommend adjusted dosage and timing for better results for both active and latent infections [154, 170, 177, 178]. The balance between TNF-α and IL-10, an anti-inflammatory cytokine, was also predicted to be a significant regulator of Mtb [66, 143, 146, 149, 159, 174, 178]. TNF-α has been the subject of a host of other TB models [49, 66, 142, 143, 165, 168–170, 174, 176–181] because of experimental evidence surrounding its important role. Virtual depletions, deletions, and clinical trials have also been studied in several models as a cost-effective path toward more personalized treatment and unique intervention strategies [66, 149, 169].
Sensitivity analysis revealed that common important values were bacterial replication and decay rates for both TB [68, 141, 145, 172] and anthrax models [135–138, 189]. These rates could often determine in the model whether bacteria persisted or were eliminated by the immune response [68]. For example, the model by Segovia-Juarez et al. showed that a slower bacterial growth rate within infected cells is worse for the host [141]. Bacterial replication and decay rates as well as other model components identified distinct pathological states including early clearance, granuloma formation, and persistent infection [68, 140, 150, 152, 160, 165, 166, 172, 179, 188].
Future directions in TB modeling include further in silico testing of antibiotics and other treatment strategies, study of antibiotic resistance, simultaneous modeling of multiple granulomas, and continuation of multi-scale modeling for a more complete and integrated understanding of TB [76, 181]. In the less-developed field of anthrax models, future work revolves around adding complexity such as more detail in host immune function [134] and heterogeneity and stochasticity [137, 191]. Recommendations for treatment as informed by the models include a faster initial response by the immune system, potentially achieved through vaccination. Response from classically activated macrophages and T cells, which reduce bacterial loads earlier in the infection, are especially significant. These conclusions were achieved through using different types of models, highlighting the importance of diversity in modeling techniques.
4. Models of Non-infectious Injury
From smoking to COPD and in asthma, the complex interplay from molecular to tissue scales in non-infectious injuries is unclear. Many models for these types of injuries have been developed but primarily focus on biomechanics and general inflammation [54, 192–197]. However, there have been some models for non-infectious injury that have explicitly studied the immune response.
4.1. Overview and Models From the Literature
The wide variety of injuries covered in this section necessitates a number of modeling methods. Reviews of mathematical and computational models of immune system mechanisms involved in fibrosis, autoimmunity, COPD, and asthma highlight the need for multi-scale approaches and greater computational power [198–200]. ABMs and CA models lend themselves well to this end as many non-infectious diseases and disorders are associated with inhalation and diffusion of particles. Furthermore, they can be integrated with other types of mathematical models such as ODEs and PDEs [54, 55, 201, 202].
Simpler models still hold significant explanatory power. ABMs have been used in particular to track particle inhalation [50, 53, 56] and CA models have incorporated strain and its effect on the immune response [54, 203]. ODEs [52, 204, 205], and PDEs [69, 206, 207] track populations of immune cells and concentrations of molecules such as CAM, AAM, IFN-γ, and TNF-α. Summaries of models for the immune response to non-infectious lung injury are found in Table 5.
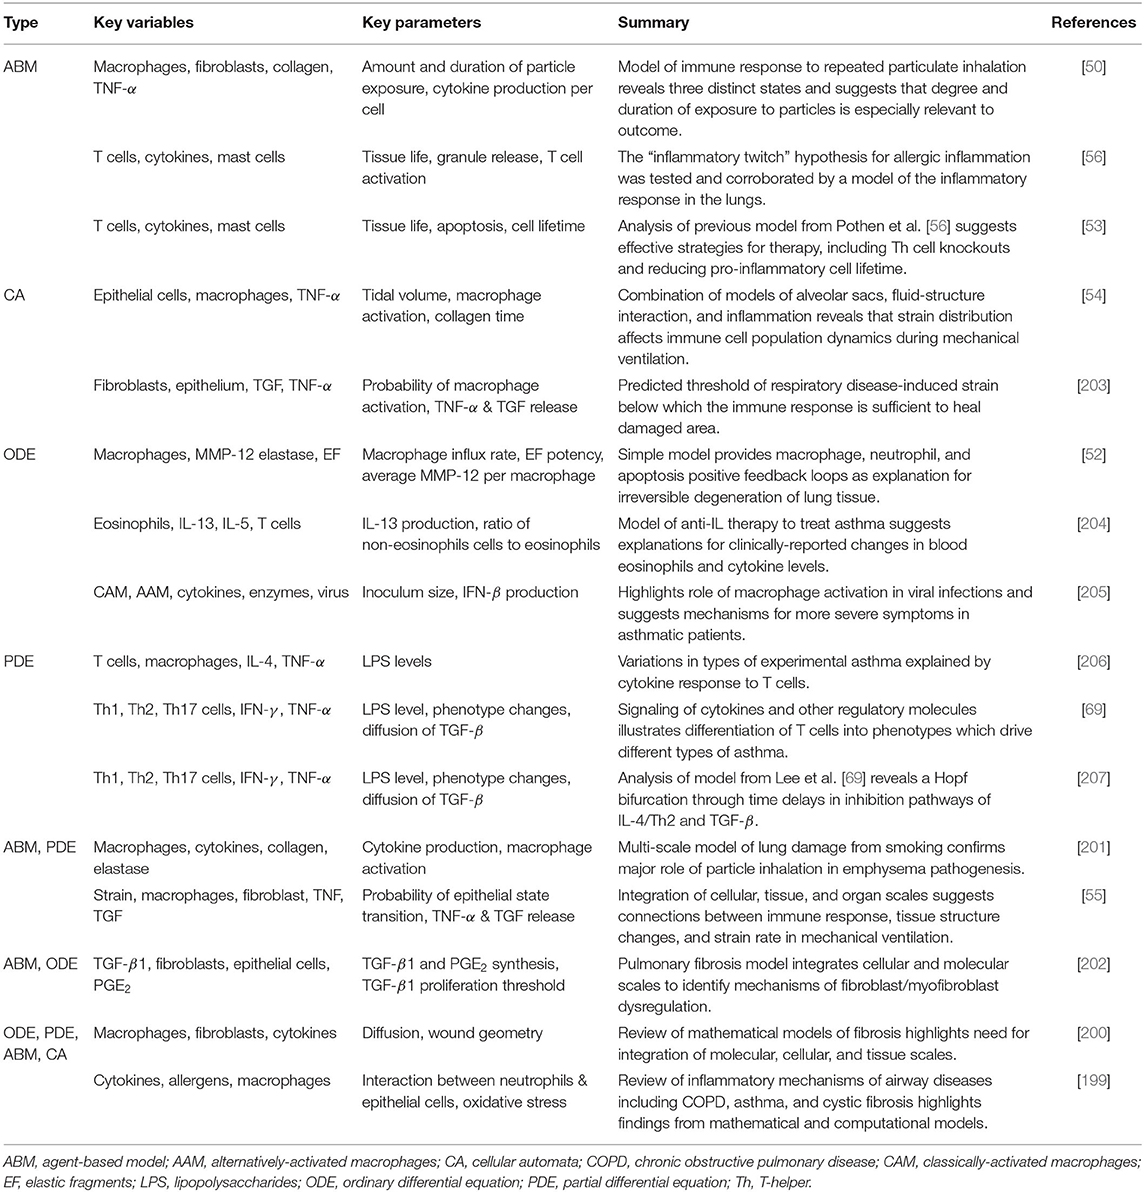
Table 5. Summary of models of host response to non-infectious injury.
4.2. Illustrative Example: Brown et al.
The level of detail described and approaches used by the model in this section is both representative of the types of models utilized for non-infectious insults and also provides an alternative approach to the two models described in the previous sections. Many models for non-infectious injuries are ABMs or CA models and examine different interactions between immune cells and signaling molecules. Whereas, Manchanda et al. considered inflammation as a single variable and Marino and Kirschner described multiple subpopulations of immune cells, Brown et al. finds a level of complexity between these two to identify three distinct pathologies for particle inhalation, highlighting the need for personalized treatments.
The ABM by Brown et al. [50] is a system with abstracted populations of cells to develop a higher-level view of events instead of an exhaustive description of every interaction. The authors noted that in reality, multiple types of cells could fall under the category of one variable. For example, TNF-α and TGF-β1 represent all pro- and anti-inflammatory cytokines, respectively. The schematic is shown in Figure 4A.
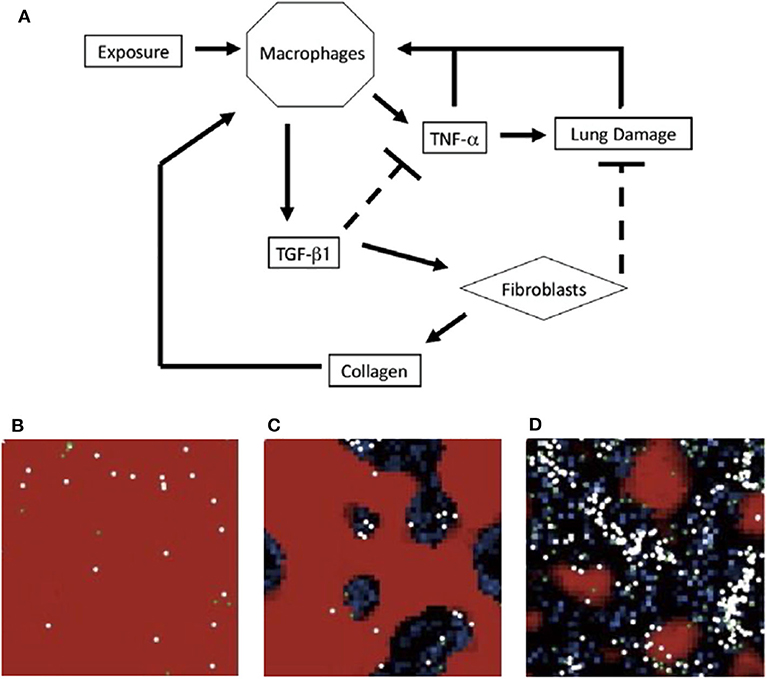
Figure 4. (A) Schematic for model of immune response to inhalation of particles of different sizes and concentrations. Upon inhalation, activated macrophages produce TNF-α, which attracts more macrophages. The pro-inflammatory role of TNF-α also causes additional damage. As a part of the later anti-inflammatory stage, macrophages produce TGF-β1 which inhibits TNF-α production and recruits fibroblasts. Fibroblasts deposit collagen and repair lung damage. An overabundance of collagen can recruit additional macrophages. (B–D) ABM simulations from Brown et al. in a section of lung tissue. Each section represents a different state: (B) self-resolving inflammation, (C) localized tissue damage and fibrosis, and (D) persistent tissue damage and fibrosis. Darker areas represent damage. Figure reprinted from Brown et al. [50] with permission from Elsevier.
A simulation begins when particles are “released” into the system, initiating the immune response. Some examples of rules in the model include:
• Macrophages on the same patch as a particle become activated for 50 time steps.
• Activated macrophages release pro-inflammatory cytokines and for the last 5 time steps of activation, they release anti-inflammatory cytokines.
• Fibroblasts move toward and heal damaged tissue by depositing collagens and increasing the “Tissue Life” value.
A trademark of mathematical modeling is quantifying events that are difficult or even impossible to measure experimentally. The model in this example, as well as several described in previous sections, assess tissue damage as overall health. Here, damage is based on a value, “tissue life,” which measures health on a scale from 0 to 100, where 100 is perfect health with no damage. Each patch has a health value, decreased by the presence of pro-inflammatory cells on that patch, and increased by the presence of anti-inflammatory cells. The average over all patches is the overall tissue life. Because ABMs focus more on qualitative representations of a system, tissue life is an important variable to quantify results.
On a 50-by-50 grid, Brown et al. performed simulations with exposures of 5, 10, 15, or 20 particles occurring at intervals of 50, 100, or 200 time steps. To model different frequencies, particles were added into the model 50, 100, or 200 times. These conditions were meant to test theories that both frequency and quantity of particle inhalation, such as how often an individual smokes cigarettes vs. the number of cigarettes smoked, play a role in the development of chronic lung disease. Risk factors may include smoking, air pollutants, and occupations such as coal mining; studies have examined the differences between these insults and how the lungs and immune system respond [208–210]. Based on the degree and duration of particle exposure, the model elicited three distinct states, shown in Figures 4B–D. The model suggested the most damage is due to increased particulate exposure at higher frequencies, even with short duration.
Categorization of outcomes is common in mathematical modeling and allows for quantification of states through specific parameter ranges or combinations. Brown et al. showed that this can be achieved using lumped variables, another frequently-used technique. In addition, they remarked that a well-mixed model such as a system of ODEs may not have identified these states, pointing to the need for spatial effects to be considered in modeling. A limitation of this model is that it is not calibrated to data. Also, the inclusion of more detailed mechanisms and interactions may further shed light on inflammatory activity.
4.3. General Results and Conclusions From Models of Non-infectious Injury
Although many of the key players in the immune response, such as macrophages, T-cells, and neutrophils, appear regardless of injury type, the progression of damage and the mechanisms by which the immune system brings about healing is very different depending on the type of damage.
Chronic obstructive pulmonary disease (COPD) is a disabling, irreversible disease often brought on by smoking and characterized by excessive inflammation and limited airflow [211]. A focus on macrophages, including the M1-M2 spectrum of activation, is a common denominator among COPD models [52, 57, 201]. Models by Cox [52] and Ceresa et al. [201] both identified positive macrophage feedback loops that contributed to inflammation.
In asthma, memory T cells are developed in response to allergens and are the focus of many mathematical models of asthma [204, 206, 207, 212]. Models also identified important regulators of the immune response to asthmatic episodes including the cytokines IL-13 [204] and IL-4 [207].
Pulmonary fibrosis is a lung disease caused by an over-remodeling of lung tissue after damage. Ben Amar et al. and Warsinske et al. are in agreement that a multi-scale approach, including cellular and molecular scales, is an important step toward a more complete understanding of fibrosis, both in the lung and other tissues [200, 202].
Mechanical ventilation provides support to patients with difficulty breathing but can cause stress and strain resulting in an immune response. To this end, models were developed to better understand how strain levels and distributions interact with the immune system. Results from the models show that strain distribution plays an important role in immune cell populations [54, 203] but that strain rate was not as important as parameters related to the immune response [55].
Future research in modeling these types of injury includes multi-scale modeling for better treatments involving multiple targets [55, 199, 213] and combining data-driven and mechanistic models [214].
5. Conclusion and the Future of Modeling
Mathematical modeling is a method for obtaining a deeper understanding of the immune response to lung injuries, complementing and informing experimental and clinical strategies. By summarizing methods and providing specific examples in the literature, we show how unique additions to well-documented modeling practices and novel, computationally intensive methods revealed new information about the pathogenesis of infections, recovery from damage, and the multi-scale complexity of lung dynamics.
Research on bacterial and viral dynamics has progressed greatly due to mathematical and computational modeling efforts, elucidating immune system mechanisms for pathogen clearance and quantifying important parameters in the viral life cycle. Mathematical research of the effects of aging on the immune system, coinfections, and use of vaccinations could improve the treatment of influenza. Complex mechanisms such as activation of different phenotypes of immune cells like macrophages should be studied further, as well as the positive and negative feedback loops that, when dysregulated, can exacerbate inflammation or contribute to the reappearance of infection [62]. ABMs, “omics” data, systems-based approaches, and high-performance computing have been suggested for future modeling efficacy [98, 109, 112].
With the introduction of COVID-19 onto the global stage, the need for mechanistic modeling has never been greater. Small-scale models such as that by Du and Yuan [121] borrowed from influenza models, making use of limited data. Though computational tools such as machine learning algorithms have become useful in detecting patterns and important predictors, they require large amounts of data that are not yet available for COVID-19. Therefore, mathematical modeling of the immune response to SARS-COV2 to better understand the unique mechanisms involved will be vital in the accelerated path toward developing vaccines and treatments.
The complex, non-linear interplay between cells, cytokines, proteins, and other host factors in the immune response to an insult has led to significant development of multi-scale models over multiple biological and time scales [164, 180, 200]. Many successful complex models were built upon previous models and then calibrated with experimental data. However, many modeling efforts begin with models that have few variables and/or group similar cell types and/or mediators. This approach is often used when there is limited data available. The resulting models are typically small-scale models that have the advantage of being mathematically analyzable in order to gain insight in the biological problem using stability analysis and by finding bifurcations [117, 186]. These models have been used as the foundations for building more complex models. Mathematical modelers are more and more pairing classic mathematical methods with computational approaches to develop models which are calibrated and validated with data. These efforts from various fields have led to open-source platforms [129, 215–217].
Mathematical modeling will provide frameworks to test new hypotheses, analyze phenomena, perform virtual clinical trials, inform experimental strategies, and recommend general and personalized therapies. Mathematical and computational modeling is playing an increasingly important role in science as a whole, and, as shown in this review, can contribute greatly to cutting-edge treatment of a wide variety of lung injuries.
Author Contributions
SM, AR, and RH designed and developed the project. SM compiled the information and wrote the manuscript under the supervision of AR. RH consulted on the biological aspects of this work. AR and RH reviewed and edited manuscript.
Funding
This work was supported by the National Science Foundation via award CMMI-1351162 (RH).
Conflict of Interest
The authors declare that the research was conducted in the absence of any commercial or financial relationships that could be construed as a potential conflict of interest.
References
1. Braciale TJ, Sun J, Kim TS. Regulating the adaptive immune response to respiratory virus infection. Nat Rev Immunol. (2012) 12:295–305. doi: 10.1038/nri3166
2. Deng JC, Standiford TJ. Growth factors and cytokines in acute lung injury. Compr Physiol. (2011) 1:81–104. doi: 10.1002/cphy.c090011
3. Hammad H, Lambrecht BN. Dendritic cells and airway epithelial cells at the interface between innate and adaptive immune responses. Allergy. (2011) 66:579–87. doi: 10.1111/j.1398-9995.2010.02528.x
4. Holgate ST. Innate and adaptive immune responses in asthma. Nat Med. (2012) 18:673–83. doi: 10.1038/nm.2731
5. Kato A, Schleimer RP. Beyond inflammation: airway epithelial cells are at the interface of innate and adaptive immunity. Curr Opin Immunol. (2007) 19:711–20. doi: 10.1016/j.coi.2007.08.004
6. Miao H, Hollenbaugh JA, Zand MS, Holden-Wiltse J, Mosmann TR, Perelson AS, et al. Quantifying the early immune response and adaptive immune response kinetics in mice infected with influenza A virus. J Virol. (2010) 84:6687–98. doi: 10.1128/JVI.00266-10
7. Robb CT, Regan KH, Dorward DA, Rossi AG. Key mechanisms governing resolution of lung inflammation. Semin Immunopathol. (2016) 38:425–48. doi: 10.1007/s00281-016-0560-6
8. Kumar V, Sharma A. Neutrophils: Cinderella of innate immune system. Int Immunopharmacol. (2010) 10:1325–34. doi: 10.1016/j.intimp.2010.08.012
9. Grommes J, Soehnlein O. Contribution of neutrophils to acute lung injury. Mol Med. (2011) 17:293–307. doi: 10.2119/molmed.2010.00138
10. Kolaczkowska E, Kubes P. Neutrophil recruitment and function in health and inflammation. Nat Rev Immunol. (2013) 13:159–75. doi: 10.1038/nri3399
11. Aulakh GK. Neutrophils in the lung: “the first responders”. Cell Tissue Res. (2018) 371:577–88. doi: 10.1007/s00441-017-2748-z
12. Amin K. The role of mast cells in allergic inflammation. Respir Med. (2012) 106:9–14. doi: 10.1016/j.rmed.2011.09.007
13. Bosco MC. Macrophage polarization: reaching across the aisle? J Allergy Clin Immunol. (2019) 143:1348–50. doi: 10.1016/j.jaci.2018.12.995
14. Herold S, Mayer K, Lohmeyer J. Acute lung injury: how macrophages orchestrate resolution of inflammation and tissue repair. Front Immunol. (2011) 2:65. doi: 10.3389/fimmu.2011.00065
15. Koh TJ, DiPietro LA. Inflammation and wound healing: the role of the macrophage. Expert Rev Mol Med. (2011) 13:e23. doi: 10.1017/S1462399411001943
16. Wang N, Liang H, Zen K. Molecular mechanisms that influence the macrophage M1-M2 polarization balance. Front Immunol. (2014) 5:614. doi: 10.3389/fimmu.2014.00614
17. Gieseck RL, Wilson MS, Wynn TA. Type 2 immunity in tissue repair and fibrosis. Nat Rev Immunol. (2018) 18:62–76. doi: 10.1038/nri.2017.90
18. Martinez FO, Gordon S. The M1 and M2 paradigm of macrophage activation: time for reassessment. F1000Prime Rep. (2014) 6:13. doi: 10.12703/P6-13
19. Cook PC, MacDonald AS. Dendritic cells in lung immunopathology. Semin Immunopathol. (2016) 38:449–60. doi: 10.1007/s00281-016-0571-3
20. Mosser DM, Edwards JP. Exploring the full spectrum of macrophage activation. Nat Rev Immunol. (2008) 8:958–69. doi: 10.1038/nri2448
21. Chen K, Kolls JK. T Cell-mediated host immune defenses in the lung. Annu Rev Immunol. (2013) 31:605–33. doi: 10.1146/annurev-immunol-032712-100019
22. Newton AH, Cardani A, Braciale TJ. The host immune response in respiratory virus infection: balancing virus clearance and immunopathology. Semin Immunopathol. (2016) 38:471–82. doi: 10.1007/s00281-016-0558-0
23. Opal SM, DePalo VA. Anti-inflammatory cytokines. Chest. (2000) 117:1162–72. doi: 10.1378/chest.117.4.1162
24. Gharib SA, McMahan RS, Eddy WE, Long ME, Parks WC, Aitken ML, et al. Transcriptional and functional diversity of human macrophage repolarization. J Allergy Clin Immunol. (2019) 143:1536–48. doi: 10.1016/j.jaci.2018.10.046
25. Akbari O, DeKruyff RH, Umetsu DT. Pulmonary dendritic cells producing IL-10 mediate tolerance induced by respiratory exposure to antigen. Nat Immunol. (2001) 2:725–31. doi: 10.1038/90667
26. Bainbridge P. Wound healing and the role of fibroblasts. J Wound Care. (2013) 22:407–11. doi: 10.12968/jowc.2013.22.8.407
27. Canan CH, Gokhale NS, Carruthers B, Lafuse WP, Schlesinger LS, Torrelles JB, et al. Characterization of lung inflammation and its impact on macrophage function in aging. J Leukocyte Biol. (2014) 96:473–80. doi: 10.1189/jlb.4A0214-093RR
28. Soehnlein O, Steffens S, Hidalgo A, Weber C. Neutrophils as protagonists and targets in chronic inflammation. Nat Rev Immunol. (2017) 17:248–61. doi: 10.1038/nri.2017.10
29. Stupka JE, Mortensen EM, Anzueto A, Restrepo MI. Community-acquired pneumonia in elderly patients. Aging Health. (2009) 5:763–74. doi: 10.2217/ahe.09.74
30. World Health Organization. Pneumonia (2019). Available online at: http://www.who.int/mediacentre/factsheets/fs331/en/
31. World Health Organization. The Top 10 Causes of Death (2018). Available online at: http://www.who.int/mediacentre/factsheets/fs310/en/
32. WHO Timeline-COVID-19. Library Catalog. (2020). Available online at: https://www.who.int/news-room/detail/27-04-2020-who-timeline---covid-19
33. Rothan HA, Byrareddy SN. The epidemiology and pathogenesis of coronavirus disease (COVID-19) outbreak. J Autoimmunity. (2020) 109:102433. doi: 10.1016/j.jaut.2020.102433
34. Mahase E. Covid-19: most patients require mechanical ventilation in first 24 hours of critical care. BMJ. (2020) 368:m1201. doi: 10.1136/bmj.m1201
35. Rao VUS, Arakeri G, Subash A, Rao J, Jadhav S, Suhail Sayeed M, et al. COVID-19: loss of bridging between innate and adaptive immunity? Med Hypotheses. (2020) 144:109861. doi: 10.1016/j.mehy.2020.109861
36. McCullers JA. The co-pathogenesis of influenza viruses with bacteria in the lung. Nat Rev Microbiol. (2014) 12:252–62. doi: 10.1038/nrmicro3231
37. Siegel SJ, Roche AM, Weiser JN. Influenza promotes pneumococcal growth during coinfection by providing host sialylated substrates as a nutrient source. Cell Host Microbe. (2014) 16:55–67. doi: 10.1016/j.chom.2014.06.005
38. World Health Organization. Antibiotic Resistance. (2018). Available online at: https://www.who.int/news-room/fact-sheets/detail/antibiotic-resistance
39. Handel A, Longini IM Jr, Antia R. Neuraminidase inhibitor resistance in influenza: assessing the danger of its generation and spread. PLoS Comput Biol. (2007) 3:e240. doi: 10.1371/journal.pcbi.0030240
40. Ternent L, Dyson RJ, Krachler AM, Jabbari S. Bacterial fitness shapes the population dynamics of antibiotic-resistant and -susceptible bacteria in a model of combined antibiotic and anti-virulence treatment. J Theoret Biol. (2015) 372:1–11. doi: 10.1016/j.jtbi.2015.02.011
41. Perelson AS. Modelling viral and immune system dynamics. Nat Rev Immunol. (2002) 2:28–36. doi: 10.1038/nri700
42. Herold S, Becker C, Ridge KM, Budinger GRS. Influenza virus-induced lung injury: pathogenesis and implications for treatment. Eur Respir J. (2015). 45:1463-78. doi: 10.1183/09031936.00186214
43. Iwasaki A, Pillai PS. Innate immunity to influenza virus infection. Nat Rev Immunol. (2014) 14:315–28. doi: 10.1038/nri3665
44. Goraya MU, Wang S, Munir M, Chen JL. Induction of innate immunity and its perturbation by influenza viruses. Protein Cell. (2015) 6:712–21. doi: 10.1007/s13238-015-0191-z
45. Cole J, Aberdein J, Jubrail J, Dockrell DH. Chapter 4: The role of macrophages in the innate immune response to Streptococcus pneumoniae and Staphylococcus aureus: mechanisms and contrasts. In: Poole RK, editor. Advances in Microbial Physiology. Vol. 65 of Advances in Bacterial Pathogen Biology. San Diego, CA: Academic Press (2014). p. 125–202. doi: 10.1016/bs.ampbs.2014.08.004
46. Dutta NK, Karakousis PC. Latent tuberculosis infection: myths, models, and molecular mechanisms. Microbiol Mol Biol Rev. (2014) 78:343–71. doi: 10.1128/MMBR.00010-14
47. WHO. Guidance on Anthrax: Frequently Asked Questions. Available online at: http://www.who.int/csr/disease/Anthrax/anthraxfaq/en/
48. Day J, Friedman A, Schlesinger LS. Modeling the host response to inhalation anthrax. J Theoret Biol. (2011) 276:199–208. doi: 10.1016/j.jtbi.2011.01.054
49. Day J, Friedman A, Schlesinger LS. Modeling the immune rheostat of macrophages in the lung in response to infection. Proc Natl Acad Sci USA. (2009) 106:11246–51. doi: 10.1073/pnas.0904846106
50. Brown BN, Price IM, Toapanta FR, DeAlmeida DR, Wiley CA, Ross TM, et al. An agent-based model of inflammation and fibrosis following particulate exposure in the lung. Math Biosci. (2011) 231:186–96. doi: 10.1016/j.mbs.2011.03.005
51. Barnes PJ. Immunology of asthma and chronic obstructive pulmonary disease. Nat Rev Immunol. (2008) 8:183–92. doi: 10.1038/nri2254
52. Cox LAT. A causal model of chronic obstructive pulmonary disease (COPD) risk. Risk Anal. (2011) 31:38–62. doi: 10.1111/j.1539-6924.2010.01487.x
53. Pothen JJ, Poynter ME, Bates JHT. A computational model of unresolved allergic inflammation in chronic asthma. Am J Physiol Lung Cell Mol Physiol. (2015) 308:L384–90. doi: 10.1152/ajplung.00268.2014
54. Aghasafari P, Bin M Ibrahim I, Pidaparti R. Strain-induced inflammation in pulmonary alveolar tissue due to mechanical ventilation. Biomech Model Mechanobiol. (2017) 16:1103–18. doi: 10.1007/s10237-017-0879-5
55. Ibrahim IBM, Pidaparti RM, Ward KR. Evaluation of ventilation-induced lung inflammation through multi-scale simulations. IEEE J Transl Eng Health Med. (2018) 6:1–7. doi: 10.1109/JTEHM.2018.2795031
56. Pothen JJ, Poynter ME, Bates JHT. The inflammatory twitch as a general strategy for controlling the host response. J Immunol. (2013) 190:3510–6. doi: 10.4049/jimmunol.1202595
57. Xue J, Schmidt SV, Sander J, Draffehn A, Krebs W, Quester I, et al. Transcriptome-based network analysis reveals a spectrum model of human macrophage activation. Immunity. (2014) 40:274–88. doi: 10.1016/j.immuni.2014.01.006
58. Azad N, Rojanasakul Y, Vallyathan V. Inflammation and lung cancer: roles of reactive oxygen/nitrogen species. J Toxicol Environ Health B. (2008) 11:1–15. doi: 10.1080/10937400701436460
59. Ballaz S, Mulshine JL. The potential contributions of chronic inflammation to lung carcinogenesis. Clin Lung Cancer. (2003) 5:46–62. doi: 10.3816/CLC.2003.n.021
60. Lee G, Walser TC, Dubinett SM. Chronic inflammation, chronic obstructive pulmonary disease, and lung cancer. Curr Opin Pulmonary Med. (2009) 15:303–7. doi: 10.1097/MCP.0b013e32832c975a
61. Yao H, Rahman I. Current concepts on the role of inflammation in COPD and lung cancer. Curr Opin Pharmacol. (2009) 9:375–83. doi: 10.1016/j.coph.2009.06.009
62. Cantone M, Santos G, Wentker P, Lai X, Vera J. Multiplicity of mathematical modeling strategies to search for molecular and cellular insights into bacteria lung infection. Front Physiol. (2017) 8:817. doi: 10.3389/fphys.2017.00817
63. Eberhardt M, Lai X, Tomar N, Gupta S, Schmeck B, Steinkasserer A, et al. Third-kind encounters in biomedicine: immunology meets mathematics and informatics to become quantitative and predictive. Methods Mol Biol. (2016) 1386:135–79. doi: 10.1007/978-1-4939-3283-2_9
64. Nieman G, Brown D, Sarkar J, Kubiak B, Ziraldo C, Dutta-Moscato J, et al. A two-compartment mathematical model of endotoxin-induced inflammatory and physiologic alterations in swine. Crit Care Med. (2012) 40:1052–63. doi: 10.1097/CCM.0b013e31823e986a
65. Eftimie R, Gillard JJ, Cantrell DA. Mathematical models for immunology: current state of the art and future research directions. Bull Math Biol. (2016) 78:2091–134. doi: 10.1007/s11538-016-0214-9
66. Marino S, Myers A, Flynn JL, Kirschner DE. TNF and IL-10 are major factors in modulation of the phagocytic cell environment in lung and lymph node in tuberculosis: a next generation two compartmental model. J Theoret Biol. (2010) 265:586–98. doi: 10.1016/j.jtbi.2010.05.012
67. Krishnapriya P, Pitchaimani M, Witten TM. Mathematical analysis of an influenza A epidemic model with discrete delay. J Comput Appl Math. (2017) 324:155–72. doi: 10.1016/j.cam.2017.04.030
68. Gammack D, Doering CR, Kirschner DE. Macrophage response to Mycobacterium tuberculosis infection. J Math Biol. (2004) 48:218–42. doi: 10.1007/s00285-003-0232-8
69. Lee S, Hwang HJ, Kim Y. Modeling the role of TGF-β in regulation of the Th17 phenotype in the LPS-driven immune system. Bull Math Biol. (2014) 76:1045–80. doi: 10.1007/s11538-014-9946-6
70. Eftimie R, Bramson JL, Earn DJ. Interactions between the immune system and cancer: a brief review of non-spatial mathematical models. Bull Math Biol. (2011) 73:2–32. doi: 10.1007/s11538-010-9526-3
71. Moore EF. Machine models of self-reproduction. In: Mathematical Problems in the Biological Sciences. Providence, RI: American Mathematical Society (1962). doi: 10.1090/psapm/014/9961
72. Clarke KC. Cellular automata and agent-based models. In: Handbook of Regional Science. Berlin; Heidelberg: Springer-Verlag (2014) 1217–33. doi: 10.1007/978-3-642-23430-9_63
73. Anderson CS, DeDiego ML, Topham DJ, Thakar J. Boolean modeling of cellular and molecular pathways involved in influenza infection. Comput Math Methods Med. (2016) 2016:7686081. doi: 10.1155/2016/7686081
74. Wang RS, Saadatpour A, Albert R. Boolean modeling in systems biology: an overview of methodology and applications. Phys Biol. (2012) 9:055001. doi: 10.1088/1478-3975/9/5/055001
75. Abou-Jaoude W, Traynard P, Monteiro PT, Saez-Rodriguez J, Helikar T, Thieffry D, et al. Logical modeling and dynamical analysis of cellular networks. Front Genet. (2016) 7:94. doi: 10.3389/fgene.2016.00094
76. Kirschner D, Pienaar E, Marino S, Linderman JJ. A review of computational and mathematical modeling contributions to our understanding of Mycobacterium tuberculosis within-host infection and treatment. Curr Opin Syst Biol. (2017) 3:170–185. doi: 10.1016/j.coisb.2017.05.014
77. Bocharov G, Volpert V, Ludewig B, Meyerhans A. Parameter estimation and model selection. In: Bocharov G, Volpert V, Ludewig B, Meyerhans A, editors. Mathematical Immunology of Virus Infections. Cham: Springer International Publishing (2018). p. 35–95. doi: 10.1007/978-3-319-72317-4_3
78. Holte SE, Mei Y. Precision in the specification of ordinary differential equations and parameter estimation in modelling biological processes. In: Chan C, Hudgens MG, Chow SC, editors. Quantitative Methods for HIV/AIDS Research. Boca Raton, FL: CRC Press (2017). doi: 10.1201/9781315120805-15
79. Cao P, Wang Z, Yan AWC, McVernon J, Xu J, Heffernan JM, et al. On the role of CD8+ T cells in determining recovery time from influenza virus infection. Front Immunol. (2016) 7:611. doi: 10.3389/fimmu.2016.00611
80. Domínguez-Hüttinger E, Boon NJ, Clarke TB, Tanaka RJ. Mathematical modeling of Streptococcus pneumoniae colonization, invasive infection and treatment. Front Physiol. (2017) 8:115. doi: 10.3389/fphys.2017.00115
81. Schirm S, Ahnert P, Wienhold S, Mueller-Redetzky H, Nouailles-Kursar G, Loeffler M, et al. A Biomathematical model of pneumococcal lung infection and antibiotic treatment in mice. PLoS ONE. (2016) 11:e0156047. doi: 10.1371/journal.pone.0156047
82. De Boer RJ, Perelson AS. Quantifying T lymphocyte turnover. J Theoret Biol. (2013) 327:45–87. doi: 10.1016/j.jtbi.2012.12.025
83. Lythe G, Molina-París C. Some deterministic and stochastic mathematical models of naïve T-cell homeostasis. Immunol Rev. (2018) 285:206–17. doi: 10.1111/imr.12696
84. Altan-Bonnet G, Mukherjee R. Cytokine-mediated communication: a quantitative appraisal of immune complexity. Nat Rev Immunol. (2019) 19:205–17. doi: 10.1038/s41577-019-0131-x
85. Mantzaris NV, Webb S, Othmer HG. Mathematical modeling of tumor-induced angiogenesis. J Math Biol. (2004) 49:111–87. doi: 10.1007/s00285-003-0262-2
86. Germain RN, Meier-Schellersheim M, Nita-Lazar A, Fraser ID. Systems biology in immunology: a computational modeling perspective. Annu Rev Immunol. (2011) 29:527–85. doi: 10.1146/annurev-immunol-030409-101317
87. Bocharov GA, Romanyukha AA. Mathematical model of antiviral immune response III. Influenza A virus infection. J Theoret Biol. (1994) 167:323–60. doi: 10.1006/jtbi.1994.1074
88. Lee HY, Topham DJ, Park SY, Hollenbaugh J, Treanor J, Mosmann TR, et al. Simulation and prediction of the adaptive immune response to influenza A virus infection. J Virol. (2009) 83:7151–65. doi: 10.1128/JVI.00098-09
89. Manchanda H, Seidel N, Blaess MF, Claus RA, Linde J, Slevogt H, et al. Differential biphasic transcriptional host response associated with coevolution of hemagglutinin quasispecies of influenza A virus. Front Microbiol. (2016) 7:1167. doi: 10.3389/fmicb.2016.01167
90. Baccam P, Beauchemin C, Macken CA, Hayden FG, Perelson AS. Kinetics of influenza A virus infection in humans. J Virol. (2006) 80:7590–9. doi: 10.1128/JVI.01623-05
91. Hancioglu B, Swigon D, Clermont G. A dynamical model of human immune response to influenza A virus infection. J Theoret Biol. (2007) 246:70–86. doi: 10.1016/j.jtbi.2006.12.015
92. Handel A, Longini IM, Antia R. Towards a quantitative understanding of the within-host dynamics of influenza A infections. J R Soc Interface. (2010) 7:35–47. doi: 10.1098/rsif.2009.0067
93. Saenz RA, Quinlivan M, Elton D, MacRae S, Blunden AS, Mumford JA, et al. Dynamics of influenza virus infection and pathology. J Virol. (2010) 84:3974–83. doi: 10.1128/JVI.02078-09
94. Smith AM, Adler FR, Perelson AS. An accurate two-phase approximate solution to an acute viral infection model. J Math Biol. (2010) 60:711–26. doi: 10.1007/s00285-009-0281-8
95. Pawelek KA, Huynh GT, Quinlivan M, Cullinane A, Rong L, Perelson AS. Modeling within-host dynamics of influenza virus infection including immune responses. PLoS Comput Biol. (2012) 8:e1002588. doi: 10.1371/journal.pcbi.1002588
96. Hernandez-Vargas EA, Wilk E, Canini L, Toapanta FR, Binder S, Uvarovskii A, et al. The effects of aging on influenza virus infection dynamics. J Virol. (2014) 88:4123-31. doi: 10.1128/JVI.03644-13
97. Manchanda H, Seidel N, Krumbholz A, Sauerbrei A, Schmidtke M, Guthke R. Within-host influenza dynamics: a small-scale mathematical modeling approach. Biosystems. (2014) 118(Suppl C):51–9. doi: 10.1016/j.biosystems.2014.02.004
98. Boianelli A, Nguyen V, Ebensen T, Schulze K, Wilk E, Sharma N, et al. Modeling influenza virus infection: a roadmap for influenza research. Viruses. (2015) 7:5274–304. doi: 10.3390/v7102875
99. Kamal MA, Gieschke R, Lemenuel-Diot A, Beauchemin CAA, Smith PF, Rayner CR. A Drug-disease model describing the effect of oseltamivir neuraminidase inhibition on influenza virus progression. Antimicrob Agents Chemother. (2015) 59:5388–95. doi: 10.1128/AAC.00069-15
100. Price I, Mochan-Keef ED, Swigon D, Ermentrout GB, Lukens S, Toapanta FR, et al. The inflammatory response to influenza A virus (H1N1): an experimental and mathematical study. J Theoret Biol. (2015) 374:83–93. doi: 10.1016/j.jtbi.2015.03.017
101. Pawelek KA, Dor D Jr, Salmeron C, Handel A. Within-host models of high and low pathogenic influenza virus infections: the role of macrophages. PLoS ONE. (2016) 11:e0150568. doi: 10.1371/journal.pone.0150568
102. Zarnitsyna VI, Handel A, McMaster SR, Hayward SL, Kohlmeier JE, Antia R. Mathematical model reveals the role of memory CD8 T cell populations in recall responses to influenza. Front Immunol. (2016) 7:165. doi: 10.3389/fimmu.2016.00165
103. Handel A, Longini IM, Antia R. Antiviral resistance and the control of pandemic influenza: the roles of stochasticity, evolution and model details. J Theoret Biol. (2009) 256:117–25. doi: 10.1016/j.jtbi.2008.09.021
104. Beauchemin CAA, McSharry JJ, Drusano GL, Nguyen JT, Went GT, Ribeiro RM, et al. Modeling amantadine treatment of influenza A virus in vitro. J Theoret Biol. (2008) 254:439–51. doi: 10.1016/j.jtbi.2008.05.031
105. Dobrovolny HM, Reddy MB, Kamal MA, Rayner CR, Beauchemin CAA. Assessing mathematical models of influenza infections using features of the immune response. PLoS ONE. (2013) 8:e57088. doi: 10.1371/journal.pone.0057088
106. Canini L, Carrat F. Population modeling of influenza A/H1N1 virus kinetics and symptom dynamics. J Virol. (2011) 85:2764–70. doi: 10.1128/JVI.01318-10
107. Mitchell H, Levin D, Forrest S, Beauchemin CAA, Tipper J, Knight J, et al. Higher level of replication efficiency of 2009. (H1N1) Pandemic influenza virus than those of seasonal and avian strains: kinetics from epithelial cell culture and computational modeling. J Virol. (2011). 85:1125–35. doi: 10.1128/JVI.01722-10
108. Heldt FS, Frensing T, Pflugmacher A, Gropler R, Peschel B, Reichl U. Multiscale modeling of influenza A virus infection supports the development of direct-acting antivirals. PLoS Comput Biol. (2013) 9:e1003372. doi: 10.1371/journal.pcbi.1003372
109. Murillo LN, Murillo MS, Perelson AS. Towards multiscale modeling of influenza infection. J Theoret Biol. (2013) 332:267–90. doi: 10.1016/j.jtbi.2013.03.024
110. Canini L, Conway JM, Perelson AS, Carrat F. Impact of different oseltamivir regimens on treating influenza A virus infection and resistance emergence: insights from a modelling study. PLoS Comput Biol. (2014) 10:e1003568. doi: 10.1371/journal.pcbi.1003568
111. Schelker M, Mair CM, Jolmes F, Welke RW, Klipp E, Herrmann A, et al. Viral RNA degradation and diffusion act as a bottleneck for the influenza A virus infection efficiency. PLoS Comput Biol. (2016) 12:e1005075. doi: 10.1371/journal.pcbi.1005075
112. Zitzmann C, Kaderali L. Mathematical analysis of viral replication dynamics and antiviral treatment strategies: from basic models to age-based multi-scale modeling. Front Microbiol. (2018) 9:1546. doi: 10.3389/fmicb.2018.01546
113. Shrestha S, Foxman B, Dawid S, Aiello AE, Davis BM, Berus J, et al. Time and dose-dependent risk of pneumococcal pneumonia following influenza: a model for within-host interaction between influenza and Streptococcus pneumoniae. J R Soc Interface. (2013) 10:20130233. doi: 10.1098/rsif.2013.0233
114. Smith AM, McCullers JA, Adler FR. Mathematical model of a three-stage innate immune response to a pneumococcal lung infection. J Theoret Biol. (2011) 276:106–16. doi: 10.1016/j.jtbi.2011.01.052
115. Smith AM, Adler FR, Ribeiro RM, Gutenkunst RN, McAuley JL, McCullers JA, et al. Kinetics of coinfection with influenza A virus and Streptococcus pneumoniae. PLoS Pathog. (2013) 9:e1003238. doi: 10.1371/journal.ppat.1003238
116. Camberlein E, Cohen JM, Jose R, Hyams CJ, Callard R, Chimalapati S, et al. Importance of bacterial replication and alveolar macrophage-independent clearance mechanisms during early lung infection with Streptococcus pneumoniae. Infect Immun. (2015) 83:1181–9. doi: 10.1128/IAI.02788-14
117. Smith AM, Smith AP. A critical, nonlinear threshold dictates bacterial invasion and initial kinetics during influenza. Sci Rep. (2016) 6:38703. doi: 10.1038/srep38703
118. Cheng YH, You SH, Lin YJ, Chen SC, Chen WY, Chou WC, et al. Mathematical modeling of postcoinfection with influenza A virus and Streptococcus pneumoniae, with implications for pneumonia and COPD-risk assessment. Int J Chronic Obstruct Pulmonary Dis. (2017) 12:1973–88. doi: 10.2147/COPD.S138295
119. Almocera AES, Hernandez-Mejia G, Parra-Rojas C, Hernandez-Vargas EA. The trichotomy of pneumococcal infection outcomes in the host. Commun Nonlinear Sci Num Simul. (2019) 73:1–13. doi: 10.1016/j.cnsns.2019.01.025
120. Smith AM. Host-pathogen kinetics during influenza infection and coinfection: insights from predictive modeling. Immunol Rev. (2018) 285:97–112. doi: 10.1111/imr.12692
121. Du SQ, Yuan W. Mathematical modeling of interaction between innate and adaptive immune responses in COVID-19 and implications for viral pathogenesis. J Med Virol. (2020). doi: 10.1002/jmv.25866. [Epub ahead of print].
122. Wang Y, An G, Becker A, Cockrell C, Collier N, Craig M, et al. Rapid community-driven development of a SARS-CoV-2 tissue simulator. bioRxiv [Preprint]. (2020). doi: 10.1101/2020.04.02.019075
123. Ghosh I. Within host dynamics of SARS-CoV-2 in humans: modeling immune responses and antiviral treatments. arXiv[Preprint].arXiv:200602936. (2020).
124. Sahoo S, Hari K, Jhunjhunwala S, Jolly MK. Mechanistic modeling of the SARS-CoV-2 and immune system interplay unravels design principles for diverse clinicopathological outcomes. bioRxiv [Preprint]. (2020). doi: 10.1101/2020.05.16.097238
125. Kumar R, Clermont G, Vodovotz Y, Chow CC. The dynamics of acute inflammation. J Theoret Biol. (2004) 230:145–55. doi: 10.1016/j.jtbi.2004.04.044
126. Smith AM, Perelson AS. Influenza A virus infection kinetics: quantitative data and models. Wiley Interdiscipl Rev Syst Biol Med. (2011) 3:429–45. doi: 10.1002/wsbm.129
127. Sun J, Madan R, Karp CL, Braciale TJ. Effector T cells control lung inflammation during acute influenza virus infection by producing IL-10. Nat Med. (2009) 15:277–84. doi: 10.1038/nm.1929
128. Mochan E, Swigon D, Ermentrout GB, Lukens S, Clermont G. A mathematical model of intrahost pneumococcal pneumonia infection dynamics in murine strains. J Theoret Biol. (2014) 353(Suppl C):44–54. doi: 10.1016/j.jtbi.2014.02.021
129. Kalita JK, Chandrashekar K, Selvam P, Newell MK. Computational modeling and simulation of the immune system. Int J Bioinform Res Appl. (2006) 2:26. doi: 10.1504/IJBRA.2006.009194
130. Brookmeyer R, Johnson E, Bollinger R. Modeling the optimum duration of antibiotic prophylaxis in an anthrax outbreak. Proc Natl Acad Sci USA. (2003) 100:10129–32. doi: 10.1073/pnas.1631983100
131. Brookmeyer R, Johnson E, Barry S. Modelling the incubation period of anthrax. Stat Med. (2005) 24:531–42. doi: 10.1002/sim.2033
132. Gutting BW, Marchette D, Sherwood R, Andrews GA, Director-Myska A, Channel SR, et al. Modeling low-dose mortality and disease incubation period of inhalational anthrax in the rabbit. J Theoret Biol. (2013) 329:20–31. doi: 10.1016/j.jtbi.2013.03.020
133. Robinson PJ, Fleming EJ, Hack CE, Schneider DJ, Gearhart M. Biologically-based modeling of anthrax infection: modulation of macrophage MAPK signaling pathway by lethal toxin. J Med CBR Def. (2010) 8:1–19.
134. Gutting B. Deterministic models of inhalational anthrax in New Zealand white rabbits. Biosecurity Bioterrorism Biodefense Strategy Practice Science. (2014) 12:29–41. doi: 10.1089/bsp.2013.0067
135. Robinson PJ, Hack CE, Hanes AL, Fleming EJ, Gearhart JM, Yu KO. Host-Pathogen Coupled Networks: Model for Bacillus Anthracis Interaction with Host Macrophages. Henry M. Jackson Foundation for the Advancement of Military Medicine Wright-Patterson AFB OH (2015). Available online at: https://apps.dtic.mil/docs/citations/ADA625935
136. Pantha B. Anthrax models involving immunology, epidemiology, and controls (Doctoral dissertations). University of Tennessee, Knoxville, TN, United States (2016). Available online at: https://trace.tennessee.edu/utk_graddiss/3869
137. Gonzalez Y, Macias-Bedolla M, Powell M. Parameter sensitivity for in vitro anthrax studies. Spora J Biomath. (2018) 4:51–9. doi: 10.30707/SPORA4.1Gonzalez
138. Pantha B, Cross A, Lenhart S, Day J. Modeling the macrophage-anthrax spore interaction: Implications for early host-pathogen interactions. Math Biosci. (2018) 305:18–28. doi: 10.1016/j.mbs.2018.08.010
139. Gutting BW, Channel SR, Berger AE, Gearhart JM, Andrews GA, Sherwood RL, et al. Mathematically modeling inhalational anthrax. Microbe Mag. (2008) 3:78–85. doi: 10.1128/microbe.3.78.1
140. Aslinger K. Numerical solution of stochastic differential equations with an application to an inhalation anthrax model. Masters theses (2014). Available online at: https://trace.tennessee.edu/utk_gradthes/2701
141. Segovia-Juarez JL, Ganguli S, Kirschner D. Identifying control mechanisms of granuloma formation during M. tuberculosis infection using an agent-based model. J Theoret Biol. (2004) 231:357–76. doi: 10.1016/j.jtbi.2004.06.031
142. Ray JCJ, Flynn JL, Kirschner DE. Synergy between individual TNF-dependent functions determines granuloma performance for controlling Mycobacterium tuberculosis infection. J Immunol. (2009) 182:3706–17. doi: 10.4049/jimmunol.0802297
143. Cilfone NA, Ford CB, Marino S, Mattila JT, Gideon HP, Flynn JL, et al. Computational modeling predicts IL-10 control of lesion sterilization by balancing early host immunity-mediated antimicrobial responses with caseation during Mycobacterium tuberculosis infection. J Immunol. (2015) 194:664–77. doi: 10.4049/jimmunol.1400734
144. Marino S, Cilfone NA, Mattila JT, Linderman JJ, Flynn JL, Kirschner DE. Macrophage polarization drives granuloma outcome during Mycobacterium tuberculosis infection. Infect Immun. (2015) 83:324–38. doi: 10.1128/IAI.02494-14
145. Pienaar E, Matern WM, Linderman JJ, Bader JS, Kirschner DE. Multiscale model of Mycobacterium tuberculosis infection maps metabolite and gene perturbations to granuloma sterilization predictions. Infect Immun. (2016) 84:1650–69. doi: 10.1128/IAI.01438-15
146. Raman K, Bhat AG, Chandra N. A systems perspective of host-pathogen interactions: predicting disease outcome in tuberculosis. Mol Biosyst. (2010) 6:516–30. doi: 10.1039/B912129C
147. Bru A, Cardona PJ. Mathematical modeling of tuberculosis bacillary counts and cellular populations in the organs of infected mice. PLoS ONE. (2010) 5:e12985. doi: 10.1371/journal.pone.0012985
148. Pienaar E, Lerm M. A mathematical model of the initial interaction between Mycobacterium tuberculosis and macrophages. J Theoret Biol. (2014) 342:23–2. doi: 10.1016/j.jtbi.2014.02.007
149. Wigginton JE, Kirschner D. A model to predict cell-mediated immune regulatory mechanisms during human infection with Mycobacterium tuberculosis. J Immunol. (2001) 166:1951–67. doi: 10.4049/jimmunol.166.3.1951
150. Marino S, Kirschner DE. The human immune response to Mycobacterium tuberculosis in lung and lymph node. J Theoret Biol. (2004) 227:463–86. doi: 10.1016/j.jtbi.2003.11.023
151. Chang ST, Linderman JJ, Kirschner DE. Multiple mechanisms allow Mycobacterium tuberculosis to continuously inhibit MHC class II-mediated antigen presentation by macrophages. Proc Natl Acad Sci USA. (2005) 102:4530–5. doi: 10.1073/pnas.0500362102
152. Kirschner DE, Gammack D, Ganguli S. A metapopulation model of granuloma formation in the lung during infection with Mycobacterium tuberculosis. Math Biosci Eng. (2005) 2:535–60. doi: 10.3934/mbe.2005.2.535
153. Alavez-Ramirez J, Castellanos JRA, Esteva L, Flores JA, Fuentes-Allen JL, Garcia-Ramos G, et al. Within-host population dynamics of antibiotic-resistant M. tuberculosis. Math Med Biol J IMA. (2007) 24:35–56. doi: 10.1093/imammb/dql026
154. Marino S, Sud D, Plessner H, Lin PL, Chan J, Flynn JL, et al. Differences in reactivation of tuberculosis induced from anti-TNF treatments are based on bioavailability in granulomatous tissue. PLoS Comput Biol. (2007) 3:e194. doi: 10.1371/journal.pcbi.0030194
155. Bauer AL, Hogue IB, Marino S, Kirschner DE. The effects of HIV-1 infection on latent tuberculosis. Math Modell Nat Phenomena. (2008) 3:229–66. doi: 10.1051/mmnp:2008051
156. Ray JCJ, Wang J, Chan J, Kirschner DE. The timing of TNF and IFN-γ signaling affects macrophage activation strategies during Mycobacterium tuberculosis infection. J Theoret Biol. (2008) 252:24–38. doi: 10.1016/j.jtbi.2008.01.010
157. Goutelle S, Bourguignon L, Jelliffe RW, Conte JE, Maire P. Mathematical modeling of pulmonary tuberculosis therapy: insights from a prototype model with rifampin. J Theoret Biol. (2011) 282:80–92. doi: 10.1016/j.jtbi.2011.05.013
158. Magombedze G, Mulder N. A mathematical representation of the development of Mycobacterium tuberculosis active, latent and dormant stages. J Theoret Biol. (2012) 292:44–59. doi: 10.1016/j.jtbi.2011.09.025
159. Myers AJ, Marino S, Kirschner DE, Flynn JL. Inoculation dose of Mycobacterium tuberculosis does not influence priming of T cell responses in lymph nodes. J Immunol. (2013) 190:4707–16. doi: 10.4049/jimmunol.1203465
160. Gong C, Linderman JJ, Kirschner D. A population model capturing dynamics of tuberculosis granulomas predicts host infection outcomes. Math Biosci Eng. (2015) 12:625–42. doi: 10.3934/mbe.2015.12.625
161. Pedruzzi G, Rao KVS, Chatterjee S. Mathematical model of mycobacterium-host interaction describes physiology of persistence. J Theoret Biol. (2015) 376:105–17. doi: 10.1016/j.jtbi.2015.03.031
162. Hao W, Schlesinger LS, Friedman A. Modeling granulomas in response to infection in the lung. PLoS ONE. (2016) 11:e0148738. doi: 10.1371/journal.pone.0148738
163. Hegde SR, Rajasingh H, Das C, Mande SS, Mande SC. Understanding communication signals during mycobacterial latency through predicted genome-wide protein interactions and Boolean modeling. PLoS ONE. (2012) 7:e33893. doi: 10.1371/journal.pone.0033893
164. Young D, Stark J, Kirschner D. Systems biology of persistent infection: tuberculosis as a case study. Nat Rev Microbiol. (2008) 6:520–8. doi: 10.1038/nrmicro1919
165. Fallahi-Sichani M, El-Kebir M, Marino S, Kirschner DE, Linderman JJ. Multiscale computational modeling reveals a critical role for TNF-α receptor 1 dynamics in tuberculosis granuloma formation. J Immunol. (2011) 186:3472–83. doi: 10.4049/jimmunol.1003299
166. Marino S, El-Kebir M, Kirschner D. A hybrid multi-compartment model of granuloma formation and T cell priming in Tuberculosis. J Theoret Biol. (2011) 280:50–62. doi: 10.1016/j.jtbi.2011.03.022
167. Fallahi-Sichani M, Kirschner DE, Linderman JJ. NF-κB signaling dynamics play a key role in infection control in tuberculosis. Front Physiol. (2012) 3:170. doi: 10.3389/fphys.2012.00170
168. Fallahi-Sichani M, Marino S, Flynn JL, Linderman JJ, Kirschner DE. A systems biology approach for understanding granuloma formation and function in tuberculosis. In: McFadden J, Beste DJV, Kierzek AM, editors. Systems Biology of Tuberculosis. New York, NY: Springer (2013). p. 127–55. doi: 10.1007/978-1-4614-4966-9_7
169. Linderman JJ, Kirschner DE. In silico models of M. tuberculosis infection provide a route to new therapies. Drug Discov Tdy Disease Models. (2015) 15:37–41. doi: 10.1016/j.ddmod.2014.02.006
170. Pienaar E, Cilfone NA, Lin PL, Dartois V, Mattila JT, Butler JR, et al. A computational tool integrating host immunity with antibiotic dynamics to study tuberculosis treatment. J Theoret Biol. (2015) 367:166–79. doi: 10.1016/j.jtbi.2014.11.021
171. Marino S, Gideon HP, Gong C, Mankad S, McCrone JT, Lin PL, et al. Computational and empirical studies predict Mycobacterium tuberculosis-specific T cells as a biomarker for infection outcome. PLoS Comput Biol. (2016) 12:e1004804. doi: 10.1371/journal.pcbi.1004804
172. Sershen CL, Plimpton SJ, May EE. Oxygen modulates the effectiveness of granuloma mediated host response to Mycobacterium tuberculosis: a multiscale computational biology approach. Front Cell Infect Microbiol. (2016) 6:6. doi: 10.3389/fcimb.2016.00006
173. Ziraldo C, Gong C, Kirschner DE, Linderman JJ. Strategic priming with multiple antigens can yield memory cell phenotypes optimized for infection with Mycobacterium tuberculosis: a computational study. Front Microbiol. (2016) 6:1477. doi: 10.3389/fmicb.2015.01477
174. Cilfone NA, Perry CR, Kirschner DE, Linderman JJ. Multi-scale modeling predicts a balance of tumor necrosis factor-α and interleukin-10 controls the granuloma environment during Mycobacterium tuberculosis infection. PLoS ONE. (2013) 8:e68680. doi: 10.1371/journal.pone.0068680
175. Gammack D, Ganguli S, Marino S, Segovia-Juarez J, Kirschner D. Understanding the immune response in tuberculosis using different mathematical models and biological scales. Multiscale Model Simul. (2005) 3:312–45. doi: 10.1137/040603127
176. Marino S, Linderman JJ, Kirschner DE. A multifaceted approach to modeling the immune response in tuberculosis. Wiley Interdiscipl Rev Syst Biol Med. (2011) 3:479–89. doi: 10.1002/wsbm.131
177. Fallahi-Sichani M, Flynn JL, Linderman JJ, Kirschner DE. Differential risk of tuberculosis reactivation among anti-TNF therapies is due to drug binding kinetics and permeability. J Immunol. (2012) 188:3169–78. doi: 10.4049/jimmunol.1103298
178. Linderman J, Cilfone N, Pienaar E, Gong C, Kirschner D. A multi-scale approach to designing therapeutics for tuberculosis. Integrat Biol. (2015) 7:591–609. doi: 10.1039/c4ib00295d
179. Marino S, Kirschner DE. A multi-compartment hybrid computational model predicts key roles for dendritic cells in tuberculosis infection. Computation. (2016) 4:39. doi: 10.3390/computation4040039
180. Kirschner DE, Young D, Flynn JL. Tuberculosis: global approaches to a global disease. Curr Opin Biotechnol. (2010) 21:524–31. doi: 10.1016/j.copbio.2010.06.002
181. Magombedze G, Dowdy D, Mulder N. Latent tuberculosis: models, computational efforts and the pathogen's regulatory mechanisms during dormancy. Front Bioeng Biotechnol. (2013) 1:4. doi: 10.3389/fbioe.2013.00004
182. Cardona PJ, Catalá M, Arch M, Arias L, Alonso S, Cardona P, et al. Can systems immunology lead tuberculosis eradication? Curr Opin Syst Biol. (2018) 12:53–60. doi: 10.1016/j.coisb.2018.10.004
183. Smith RJ, Schwartz EJ. Predicting the potential impact of a cytotoxic T-lymphocyte HIV vaccine: How often should you vaccinate and how strong should the vaccine be? Math Biosci. (2008) 212:180–7. doi: 10.1016/j.mbs.2008.02.001
184. Kumar R, Chow CC, Bartels JD, Clermont G, Vodovotz Y. A mathematical simulation of the inflammatory response to anthrax infection. Shock. (2008) 29:104–11. doi: 10.1097/SHK.0b013e318067dcfe
185. Agliari E, Asti L, Barra A, Scrivo R, Valesini G, Wallis RS. Application of a stochastic modeling to assess the evolution of tuberculous and non-tuberculous mycobacterial infection in patients treated with tumor necrosis factor inhibitors. PLoS ONE. (2013) 8:e55017. doi: 10.1371/journal.pone.0055017
186. Antia R, Koella JC, Perrot V. Models of the within-host dynamics of persistent mycobacterial infections. Proc R Soc Lond Ser B Biol Sci. (1996) 263:257–63. doi: 10.1098/rspb.1996.0040
187. Wilkening DA. Sverdlovsk revisited: modeling human inhalation anthrax. Proc Natl Acad Sci USA. (2006) 103:7589–94. doi: 10.1073/pnas.0509551103
188. Bordbar A, Lewis NE, Schellenberger J, Palsson BO, Jamshidi N. Insight into human alveolar macrophage and M. tuberculosis interactions via metabolic reconstructions. Mol Syst Biol. (2010) 6:422. doi: 10.1038/msb.2010.68
189. Gillard JJ, Laws TR, Lythe G, Molina-Paris C. Modeling early events in Francisella tularensis pathogenesis. Front Cell Infect Microbiol. (2014) 4:169. doi: 10.3389/fcimb.2014.00169
190. Kirschner DE, Hunt CA, Marino S, Fallahi-Sichani M, Linderman JJ. Tuneable resolution as a systems biology approach for multi-scale, multi-compartment computational models. Wiley Interdiscipl Rev Syst Biol Med. (2014) 6:289–309. doi: 10.1002/wsbm.1270
191. Kabilan S, Suffield SR, Recknagle KP, Jacob RE, Einstein DR, Kuprat AP, et al. Computational fluid dynamics modeling of Bacillus anthracis spore deposition in rabbit and human respiratory airways. J Aerosol Sci. (2016) 99:64–77. doi: 10.1016/j.jaerosci.2016.01.011
192. Reynolds A, Ermentrout GB, Clermont G. A mathematical model of pulmonary gas exchange under inflammatory stress. J Theoret Biol. (2010) 264:161–73. doi: 10.1016/j.jtbi.2010.01.011
193. Chernyavsky IL, Croisier H, Chapman LAC, Kimpton LS, Hiorns JE, Brook BS, et al. The role of inflammation resolution speed in airway smooth muscle mass accumulation in asthma: insight from a theoretical model. PLoS ONE. (2014) 9:e90162. doi: 10.1371/journal.pone.0090162
194. Golov A, Simakov S, Soe YN, Pryamonosov R, Mynbaev O, Kholodov A. Multiscale CT-based computational modeling of alveolar gas exchange during artificial lung ventilation, cluster (Biot) and periodic (Cheyne-Stokes) breathings and bronchial asthma attack. Computation. (2017) 5:11. doi: 10.3390/computation5010011
195. Aghasafari P, Heise RL, Reynolds A, Pidaparti RM. Aging effects on alveolar sacs under mechanical ventilation. J Gerontol Ser A. (2019) 74:139–46. doi: 10.1093/gerona/gly097
196. Pidaparti RM, Burnette M, Heise RL, Reynolds A. Analysis for stress environment in the alveolar sac model. J Biomed Sci Eng. (2013) 6:901–7. doi: 10.4236/jbise.2013.69110
197. Provinciali M, Cardelli M, Marchegiani F. Inflammation, chronic obstructive pulmonary disease and aging. Curr Opin Pulmon Med. (2011) 17:S3. doi: 10.1097/01.mcp.0000410742.90463.1f
198. Vodovotz Y, Constantine G, Rubin J, Csete M, Voit EO, An G. Mechanistic simulations of inflammation: current state and future prospects. Math Biosci. (2009) 217:1–10. doi: 10.1016/j.mbs.2008.07.013
199. Aghasafari P, George U, Pidaparti R. A review of inflammatory mechanism in airway diseases. Inflamm Res. (2019) 68:59–74. doi: 10.1007/s00011-018-1191-2
200. Ben Amar M, Bianca C. Towards a unified approach in the modeling of fibrosis: a review with research perspectives. Phys Life Rev. (2016) 17:61–85. doi: 10.1016/j.plrev.2016.03.005
201. Ceresa M, Olivares AL, Noailly J, Gonzalez Ballester MA. Coupled immunological and biomechanical model of emphysema progression. Front Physiol. (2018) 9:388. doi: 10.3389/fphys.2018.00388
202. Warsinske HC, Wheaton AK, Kim KK, Linderman JJ, Moore BB, Kirschner DE. Computational modeling predicts simultaneous targeting of fibroblasts and epithelial cells is necessary for treatment of pulmonary fibrosis. Front Pharmacol. (2016) 7:183. doi: 10.3389/fphar.2016.00183
203. Ibrahim IBM, Sanjay Sharma VO, Pidaparti RM. Simulation of healing threshold in strain-induced inflammation through a discrete informatics model. IEEE J Biomed Health Inform. (2018) 22:935–41. doi: 10.1109/JBHI.2017.2669729
204. Karelina T, Voronova V, Demin O, Colice G, Agoram B. A mathematical modeling approach to understanding the effect of anti-interleukin therapy on eosinophils: modeling the effects of monoclonal antibodies. CPT Pharmacometr Syst Pharmacol. (2016) 5:608–16. doi: 10.1002/psp4.12129
205. Lee J, Adler FR, Kim PS. A mathematical model for the macrophage response to respiratory viral infection in normal and asthmatic conditions. Bull Math Biol. (2017) 79:1979–98. doi: 10.1007/s11538-017-0315-0
206. Kim Y, Lee S, Kim YS, Lawler S, Gho YS, Kim YK, et al. Regulation of Th1/Th2 cells in asthma development: a mathematical model. Math Biosci Eng. (2013) 10:1095–133. doi: 10.3934/mbe.2013.10.1095
207. Lim J, Lee S, Kim Y. Hopf bifurcation in a model of TGF-$\beta$ in regulation of the Th 17 phenotype. Discrete Continuous Dyn Syst B. (2016) 21:3575–602. doi: 10.3934/dcdsb.2016111
208. Liu Y, Lee K, Perez-Padilla R, Hudson NL, Mannino DM. Outdoor and indoor air pollution and COPD-related diseases in high- and low-income countries [State of the Art Series. Chronic obstructive pulmonary disease in high- and low-income countries. Edited by G. Marks and M. Chan-Yeung. Number 2 in the series]. Int J Tuberculosis Lung Dis. (2008) 12:115–27.
209. Oxman AD, Muir DCF, Shannon HS, Stock SR, Hnizdo E, Lange HJ. Occupational dust exposure and chronic obstructive pulmonary disease: a systematic overview of the evidence. Am Rev Respir Dis. (1993) 148:38–48. doi: 10.1164/ajrccm/148.1.38
210. Yoshida T, Tuder RM. Pathobiology of cigarette smoke-induced chronic obstructive pulmonary disease. Physiol Rev. (2007) 87:1047–82. doi: 10.1152/physrev.00048.2006
211. Celli BR, MacNee W, Agusti A, Anzueto A, Berg B, Buist AS, et al. Standards for the diagnosis and treatment of patients with COPD: a summary of the ATS/ERS position paper. Eur Respir J. (2004) 23:932–46. doi: 10.1183/09031936.04.00014304
212. Walsh ER, Thakar J, Stokes K, Huang F, Albert R, August A. Computational and experimental analysis reveals a requirement for eosinophil-derived IL-13 for the development of allergic airway responses in C57BL/6 mice. J Immunol. (2011) 186:2936–49. doi: 10.4049/jimmunol.1001148
213. Brown D, Namas RA, Almahmoud K, Zaaqoq A, Sarkar J, Barclay DA, et al. Trauma in silico: individual-specific mathematical models and virtual clinical populations. Sci Transl Med. (2015) 7:285ra61. doi: 10.1126/scitranslmed.aaa3636
214. Vodovotz Y. Computational modelling of the inflammatory response in trauma, sepsis and wound healing: implications for modelling resilience. Interface Focus. (2014) 4:20140004. doi: 10.1098/rsfs.2014.0004
215. Kirschner DE. GranSim. (2020). Available online at: https://www.who.int/news-room/fact-sheets/detail/antibiotic-resistance
216. Carnevale NT, Hines ML, Moore JW. NEURON-Empirically-Based Simulations of Neurons and Networks of Neurons. (2019). Available online at: https://neuron.yale.edu/neuron/
Keywords: lung inflammation, mathematical modeling, differential equations, macrophages, agent-based models, pulmonary infection
Citation: Minucci SB, Heise RL and Reynolds AM (2020) Review of Mathematical Modeling of the Inflammatory Response in Lung Infections and Injuries. Front. Appl. Math. Stat. 6:36. doi: 10.3389/fams.2020.00036
Received: 27 April 2020; Accepted: 17 July 2020;
Published: 26 August 2020.
Edited by:
Matteo Barberis, University of Surrey, United KingdomReviewed by:
Kevin Thurley, German Rheumatism Research Center (DRFZ), GermanyAnna Niarakis, University of Évry Val d'Essonne, France
Copyright © 2020 Minucci, Heise and Reynolds. This is an open-access article distributed under the terms of the Creative Commons Attribution License (CC BY). The use, distribution or reproduction in other forums is permitted, provided the original author(s) and the copyright owner(s) are credited and that the original publication in this journal is cited, in accordance with accepted academic practice. No use, distribution or reproduction is permitted which does not comply with these terms.
*Correspondence: Angela M. Reynolds, YXJleW5vbGRzMkB2Y3UuZWR1