 Necmiye Serap Vurur
- School of Applied Sciences, University of Afyon Kocatepe, Afyonkarahisar, Turkey
The Covid 19 pandemic is the first major crisis facing cryptocurrencies. Therefore, the reaction of the cryptocurrency markets is important. News about epidemics affects investors' decisions. Panic index (PIndex) is an index created from news about the Covid 19 outbreak. In the study, it is used to measure the impact of decisions on the crypto money market. As cryptocurrencies, Bitcoin (BTC), Etherium (ETH), and Ripple (XRP), which have the highest transaction volume in the crypto money market, are included in the analysis. The relationship between Panic Index and the three major cryptocurrencies with the largest share in the cryptocurrency market was investigated by Ardl and Hatemi-J asymmetric causality test. Traditional causality tests acknowledge that the effects of positive and negative changes are the same. However, there may be asymmetric information and different investor behaviors in financial markets. In the study, Hatemi-J [1] Asymmetric Causality Test was conducted to examine the asymmetric relationship and symmetric relationship between Pindex and cryptocurrencies by separating them into positive and negative shocks. According to the results of the Hatemi-J causality analysis, positive shocks in the panic index are the cause of negative shocks for all cryptocurrencies. In other words, increases in the panic index are caused to fall the value of Bitcoin, Ethereum, and Ripple cryptocurrencies decrease. The results show that cryptocurrencies were not a safe haven for the investor during the Covid 19 period, as they acted similarly to other financial assets.
Introduction
The Covid 19 pandemic emerged in China in late 2019. On March 11, 2020, the World Health Organization (WHO) declared a global pandemic due to the number of cases approaching 500,000 and its spread to more than 170 countries. It is known that the Covid 19 outbreak affected all financial markets. This rapid progress in the pandemic caused the risk to rapidly become unpredictable in the financial markets and the loss of investors. In the world markets, 30% decreases were seen in the first quarter of 2020.
The loss of confidence in financial institutions and the financial structures of governments after the global crisis in 2008 caused the popularity of crypto money systems to increase. Cryptocurrencies have been viewed as an alternative to avoiding political interference, war risks, and the damage caused by Central Bank policies.
Cryptocurrencies, which attracted the attention of investors in money exchanges, were also affected by the pandemic [2]. The crypto money market, which has grown considerably in recent years, is frequently addressed by financial and government institutions globally. Among thousands of cryptocurrencies, Bitcoin is the best known due to the size of its capitalization. Bitcoin, which has the highest market value since 2020, is followed by Ethereum and Ripple, respectively [3]. Bitcoin has attracted great attention in recent years as the first and best-known cryptocurrency.
The news in the media about epidemics affect the feelings and decisions of the investors. Investors have difficulty in assessing the impact and importance of this news. Studies in the literature show that, statistically, the financial markets overreact to the news, despite the low weight that investors place on news in their decisions [4–6]. The panic index was created by the Ravenpack big data analysis company as a measure of the news about the Covid 19 pandemic. The Ravenpack panic index measures the panic with worldwide news about the Coronavirus. The index has been calculated since 08 January 2020. Values range from 0 to 100. The panic index taking a value of 12 indicates that 12 percent of all news globally is about panic and epidemic. It is thought that when the index value increases, panic increases too.
The aim of the study is to reveal the effect of investors' concerns on cryptocurrencies during the pandemic period. It is aimed to contribute to the currently inadequate literature by examining the response of cryptocurrencies to the pandemic. In the study, the panic index was used as the sensitivity criterion of investors against Covid 19. According to CoinMarketCap data, Bitcoin ranks in the top three in the cryptocurrency market with 61%, Etherium with 13.70% and Ripple with 2.19% (Access 30.10.2020). Bitcoin, Ethereum, and Ripple, which have the highest trading volume as cryptocurrencies, were included in the analysis. As cryptocurrencies, Bitcoin, Etherium, and Ripple, which have the highest transaction volume, were included in the analysis. Since the panic index was started to be created on 08.01.2020, daily data for the period 08.01.2020-31.12.2020 were used in the study.
There are few studies in the literature regarding the effect of Covid-19 on the crypto market. Studies have investigated the effectiveness of cryptocurrencies in the Covid 19 period with Largest Lyapunov Exponent (LLE), multifractal analysis, and quantitative methods. Unlike other studies, our study will use the asymmetric Hatemi-J causality test, taking into account that the effect of positive and negative shocks in the Covid-19 pandemic may not be the same on cryptocurrencies. In the study, the asymmetric relationship between cryptocurrencies and the panic index was investigated with the Hatemi-J asymmetric causality test.
The remainder of the study is organized as follows: Existing literature investigating cryptocurrencies, the relationship between cryptocurrencies and panic index are summarized in the second section. Data is introduced in the third section. In the fourth section, the relationship between the cryptocurrencies and the panic index is analyzed econometrically. The study is completed with the conclusion section where empirical analysis results are evaluated.
Literature Review
Recently, the literature on the financial aspects of the cryptocurrency market has been rapidly developing. Studies in the literature are mostly about determining the factors that affect the changes in the price of Bitcoin, the supply and demand factor, investor interest, and the main determinants of the price of bitcoin [7–11]. The Covid 19 pandemic is the first major crisis facing cryptocurrencies. Therefore, the reaction of the cryptocurrency markets is important. In the literature, the hedging capabilities of cryptocurrencies have been investigated as to whether they are an alternative to gold in times of crisis in the stock market [2, 12–16].
There are a limited number of studies on crypto money markets during the Covid 19 period. Some of the studies conducted indicate that the cryptocurrency market in the pandemic periods showed a safe haven feature in short-term shocks [17–20]. Umar and Guberava [21] examined the interaction between the Ravenpack panic index and Euro, British Pound and Renminbi currencies, Galaxy Crypto Index in the Covid 19 period with wavelet analysis. They stated that cross-currency hedging strategies used in the normal period are likely to fail in a crisis like the Covid 19. In the Covid 19 period, cryptocurrencies and stock exchanges were examined comparatively [22]. Lahmiri and Bekiros [22] investigated information efficiency in 45 cryptocurrency markets and 16 international exchanges during and before the Covid 19. His measurements applied the largest Lyapunov base (LLE) methods, based on price time series and approximate Entropy (ApEn), to estimate the degrees of stability and irregularity in cryptocurrency and the International Stock Exchange. According to Lahmiri and Bekiros [22], cryptocurrencies show more disorder than stock exchanges, and investing in digital assets is riskier in periods of a major crisis. It is also claimed that its efficiency has increased among cryptocurrencies in the Covid 19 process [23]. The main purpose of the studies of Mnif et al. [23] is to examine the efficiency of the cryptocurrency through multifractal analysis before and after the coronavirus pandemic. According to the empirical results of the study, Covid 19 has had a positive effect on cryptocurrency market efficiency. While the efficiency of Bitcoin was high in the pre-Covid 19 periods, it was observed that Ethereum was more effective in the Covid 19 process [23]. Yarayova et al. [24] the herding behavior in the four major cryptocurrency markets (USD, EURO, JPY, and KRW) was examined during the Covid 19 period. In the study, it was concluded that Covid 19 did not increase herding in crypto money markets, with the exception of Euro [24].
When the literature is examined, no study has been found that investigates the causality relationship between panic regarding coronavirus and cryptocurrencies. Studies have generally investigated the relationship of cryptocurrencies with other currencies and exchanges. The effect of the increase and decrease in concern caused by the pandemic on the value of cryptocurrencies has not been investigated. Unlike other studies, showing the effect of increases and decreases in panic levels on cryptocurrencies during the pandemic period is the motivation of the study. Our study aims to contribute to the literature by revealing the asymmetric causality relationship between panic index, which is an indicator of panic regarding coronavirus, and cryptocurrencies.
Methodology
Autoregressive-Distributed Lag Cointegration Test
ARDL approach allows the investigation of the cointegration relationship if the level of stationarity is different between variables. ARDL cointegration test also has several advantages such as being able to be applied to small samples, using optimal lag lengths, and not needing pre-tests [25–28].
In the ARDL approach, after determining the stationarity levels as I (0) and I (1), the appropriate ARDL model is established by determining the lag lengths of the data of the variables. The existence of a cointegration relationship is decided by performing an F-test on the established model. After the cointegration decision is made, long and short-term relationships between variables are analyzed. The equation used in long-term relationship estimation according to the ARDL approach is as follows:
The error correction model according to the ARDL approach is as follows:
a1 is the error correction coefficient of the variable. The coefficient a1 shows how much of the short-term deviation will be balanced in the long run, and it is expected to have a negative sign [25].
CUSUM and CUSUMQ tests are used to examine the stability of the long- and short-term coefficients of the model. The CUSUM test gives a graph of the long- and short-term coefficients of the cumulative error terms of the number of observations at a confidence interval of 5%. The CUSUMQ test evaluates the coefficients according to the squares of the cumulative error terms. When the error terms are within the confidence interval showing the 5% significance level, it is concluded that the estimated coefficients are stable.
Hatemi-J Asymmetric Causality Test
In tests developed for causality analysis, it is based on the assumption that positive and negative shocks have the same effect while measuring the relationship between two time series [29–31]. Hatemi-J asymmetric causality test takes into account the presence of asymmetric information in the financial markets in the causality analysis by separating the negative and positive shocks in the variables.
The asymmetric causality test examines the causality between positive and negative cumulative shocks and can be applied to both stationary and non-stationary series. The asymmetric causality test developed by Hatemi-J [1] aims to examine the up and down causality relationship between variables. Two integrated variables y1t and y2t that we want to determine the asymmetric causality relationship is defined as [1]:
When the constants t = 1,2,… t, y10, and y20 are initial values, and the variables ε1i ve ε2iindicate white noise terms. Positive and negative shocks are defined as:
It is expressed as and . From here, the following equations are created.
Hatemi-J [1] treats positive and negative shocks cumulatively and arranges them for causality testing as follows:
The next step in the asymmetric causality test is testing the causal relationship between variables as a positive and negative shock. The test method is defined only for the data vector generated for positive cumulative shocks, but the test method is the same for negative shocks. Assuming , the causality test can be applied using the following vector autoregressive p, VAR (p) model:
The optimal lead-lag is determined by considering the model selection criteria proposed by Hatemi-J [1]. After determining the optimal lead-lag, the null hypothesis, which states that there is no causality between variables, is tested. If the value of the Wald test statistic is greater than the critical value, the null hypothesis is rejected at the α significance level. Bootstrap critical values are for three different severity levels. Boots simulations are performed using statistical software components written in GAUSS [1].
Data and Empirical Results
Data
This study examines how the Panic index (PIndex) affects cryptocurrencies. Bitcoin (BTC), Ethereum (ETH), and Ripple (XRP) are included in the study as cryptocurrencies. Since the panic index started to be arranged on 08.01.2020, daily data for the period 08.01.2020 – 31.12.2020 were used in the study. Panic index data were taken from the ravenpack.com database, data belonging to BTC, ETH, and Rupple were taken from the investing.com database. The asymmetric relationship between the panic index and BTC, ETH, XRP has been analyzed with EViews 9 and Gauss 10 package programs. A graphical representation of the variables used in the study is given in Figure 1.
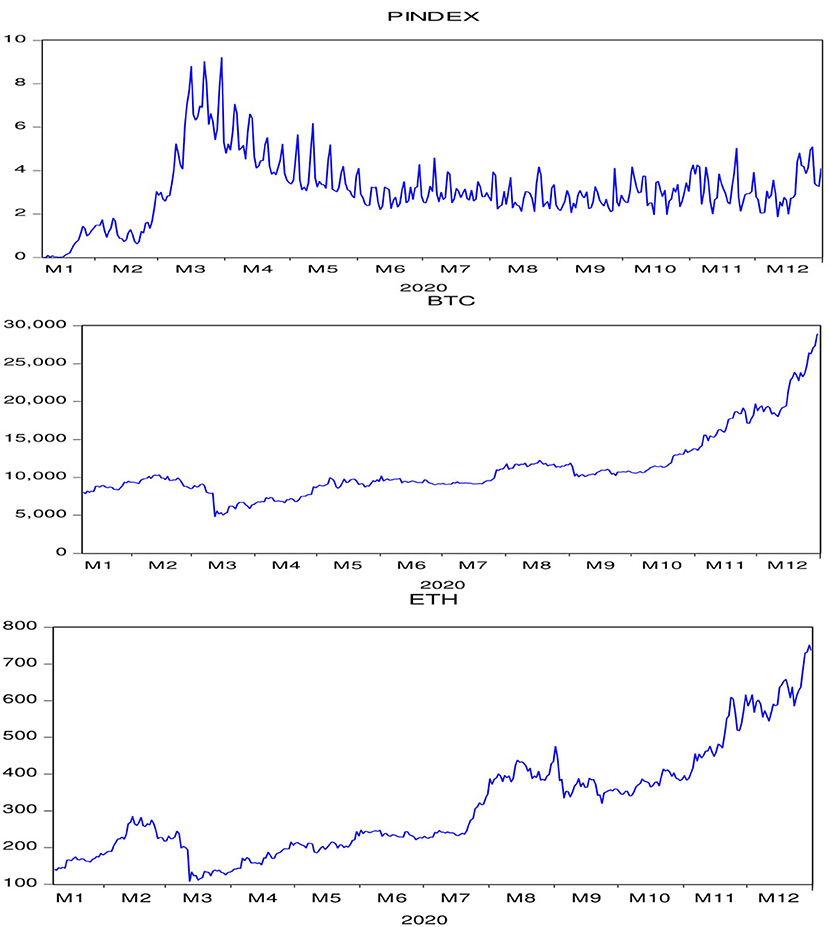
Figure 1. Panic Index, Bitcoin, Ethereum, and Ripple Values Distribution Graphs.
When the graphs are examined, it is seen that the panic index reached its highest point with the World Health Organization declaring a pandemic. When it comes to the summer months, it is seen that the panic index has moved within a certain range, but by the end of 2020, the index tends to rise again. During the initial periods when the Panic index peaked, it is seen that the value of BTC, ETH, and XRP cryptocurrencies has decreased. However, by the end of 2020, with the rise in the panic index, the value of cryptocurrencies is observed to peak remarkably.
Descriptive statistics of PIndex, BTC, ETH, and XRP are shown in Table 1. The Jarque-Bera coefficient is a statistical value that indicates whether a series is normally distributed. According to Table 1, it was determined that the Jarque-Bera coefficients of the series are statistically significant and the series are not normally distributed.
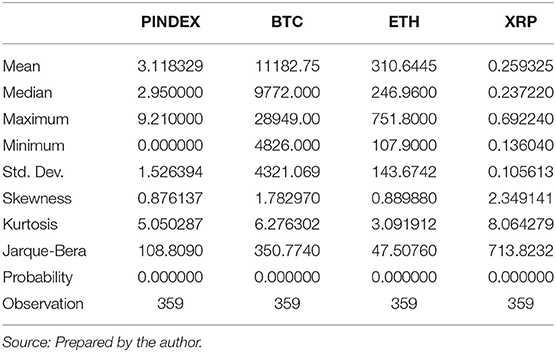
Table 1. Descriptive statistics.
Unit root tests are performed first in order to make a causality analysis in time series. In the study, ADF (Extended Dickey-Fuller) unit root test developed by Dickey and Fuller [32] and PP (Phillips-Perron) unit root tests developed by Phillips Perron [33] were preferred. Unit root test results are presented in Table 2.
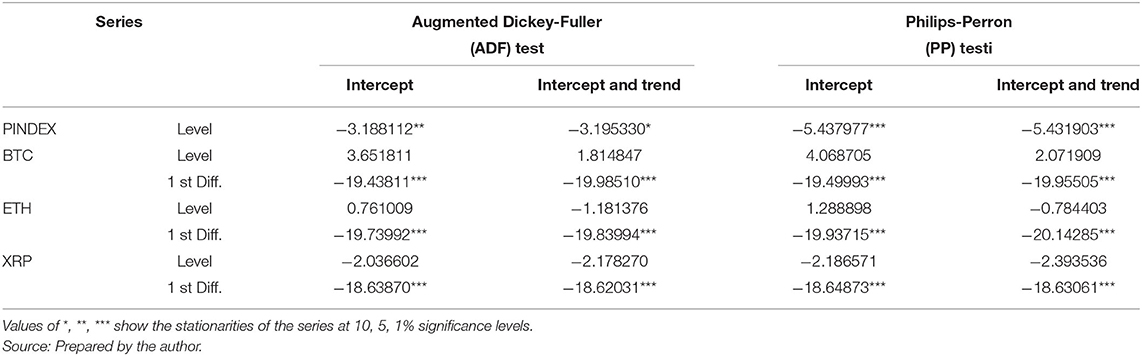
Table 2. Results of unit root tests.
In ADF (Augmented Dickey-Fuller) and PP (Philips-Perron) tests, H0 (basic hypothesis) is established as the series has a unit root, that is, it is not stationary. According to ADF test results, t statistics calculated for the Panic index series are lower than their critical values at 1, 5, and 10% significance levels. Accordingly, the null hypothesis was rejected and it was determined that this variable did not have a unit-root. Therefore, the panic index series is stable in level values. The t statistics calculated for the cryptocurrency series are greater than their respective critical values at the 1% significance level. Accordingly, the null hypothesis was accepted and it was determined that these series have unit-roots. Therefore, Bitcoin, Ethereum, and Ripple series are not stable in their level values. Phillips Perron test statistics also provide results that support the ADF test statistics. The first difference of the unstable Bitcoin, Ethereum, and Ripple series was taken and the first difference of the series was determined to be stationary.
Empirical Results
In this section, the long-run relationship between (PIndex, BTC, ETH, XRP) is examined using the ARDL bounds testing procedure. In the first step, the lag order of the variables in the equations was obtained from unconstrained models using Hannan Quinn Information Criteria. The Schwartz Bayesian Criterion shows that the optimal lag for the model is 1. (Results are not reported here).
After determining the optimum lag for the equations, in the next step, the F boundary test was applied to examine a long-term relationship between the studied variables. The results of the bound test are reported in Table 3.
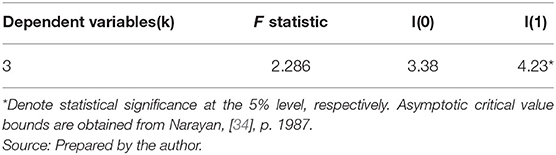
Table 3. Bounds F-test for cointegration.
When Table 3 is examined, it is seen that the calculated F statistic is less than the lower critical value. Therefore, the basic hypothesis showing that there is no cointegration relationship between variables could not be rejected. According to these results, it is determined that there is no long-term cointegration relationship between the PIndex and BTC, ETH, and XRP. It can be said that the data period is short as the reason for the lack of a cointegration relationship between the panic index and cryptocurrencies.
In order to see in which way, the increases and decreases in the panic index affect the cryptocurrencies, the asymmetric relationship has been discussed separately. The results of the Hatemi-J asymmetric causality test, which examines the asymmetric causality relationship between Panic Index, Bitcoin, Ethereum, and Ripple are shown in Table 4.
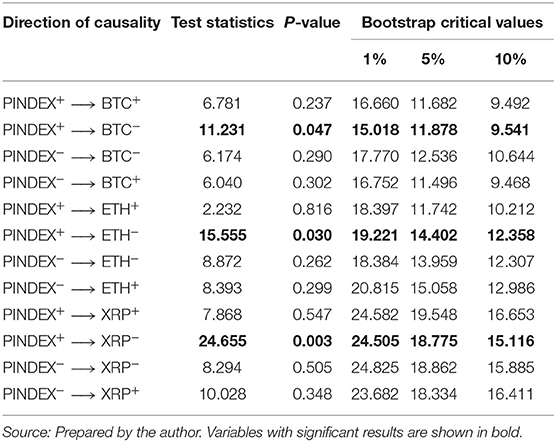
Table 4. Results of Hatemi-J asymmetric causality test.
When the asymmetric relationship between the panic index and Bitcoin is examined; one unit of positive shock in the panic index appears to cause a negative shock on the Bitcoin cryptocurrency. In other words, the null hypothesis that the positive shocks in the panic index are not the cause of the negative shocks on Bitcoin could not be rejected. However, it has been determined that negative shocks in the panic index do not have any causal effect on Bitcoin.
When the asymmetric relationship between the panic index and Ethereum is examined; one unit of positive shock in the panic index appears to cause a negative shock on Ethereum cryptocurrency. In other words, the positive increase in the panic index causes the Ethereum value to fall.
When the asymmetric relationship between the panic index and Ripple is examined; one unit of positive shock in the panic index appears to cause a negative shock on Ripple cryptocurrency. In other words, the positive increase in the panic index causes the Ripple value to fall. These results show that the increases in the panic index cause negative shock (decrease) on cryptocurrencies.
Conclusion
In this study, the relationship between the Coronavirus Panic Index (PINDEX) and a selected group of cryptocurrencies (BTC, ETH, XRP) was investigated in the first period of the Covid-19 pandemic. First of all, the cointegration relationship between variables was examined by the ARDL cointegration test. Then, the causality relationship between variables was investigated with the Hatemi-J asymmetric causality test. As a result of the ARDL cointegration test, the cointegration relationship between the panic index and cryptocurrencies was not found. According to the results of the Hatemi-J causality analysis, positive shocks in the panic index are the cause of negative shocks for all cryptocurrencies. In other words, increases in the panic index cause to decrease in the value of Bitcoin, Ethereum, and Ripple cryptocurrencies. However, negative shocks in the panic index could not have any effect on cryptocurrencies. The positive shocks in the panic index are the cause of the decreases in BTC, ETH, and XRP. However, the causality relationship between the negative shocks in the panic index and BTC, ETH, and XRP could not be found. These results show that cryptocurrencies are more sensitive to bad news.
The results have indicated that cryptocurrencies move similarly to other financial assets in periods of crisis. In Covid 19 period, cryptocurrencies are not a safe haven for investors. Our research shows that it would not be appropriate to allocate resources to cryptocurrencies to reduce the risk of their investors, as it may not serve as a safe haven during the coronavirus outbreak. The findings of the study are supported by Bouri et al. [14], Conlon and McGee [2] in the literature. Since cryptocurrencies may not serve as a safe haven during the coronavirus pandemic, investors are advised to keep less space in their portfolios. Policymakers and regulators should take into account the sensitivity of cryptocurrency markets during periods of high uncertainty, such as the Covid 19 era. The results of our study will be useful when deciding on the policies to be implemented during periods of high uncertainty.
Cryptocurrencies (BTC, ETH, XRP) with the highest share in the cryptocurrency market were selected for analysis. As an indicator of panic in the market, The Panic Index developed by Ravenpack was used. The use of three cryptocurrencies in the study, the continuation of the Covid 19 outbreak and the inability to predict its effects are the limits of the study.
Different cryptocurrencies and panic indicators can affect the analysis results. In future studies, different cryptocurrencies, cryptocurrency exchanges, or panic indicators can be included in the analysis. The results obtained will be useful in portfolio-building processes during periods of high risk.
Data Availability Statement
The raw data supporting the conclusions of this article will be made available by the authors, without undue reservation.
Author Contributions
The author confirms being the sole contributor of this work and has approved it for publication.
Conflict of Interest
The author declares that the research was conducted in the absence of any commercial or financial relationships that could be construed as a potential conflict of interest.
References
1. Hatemi-JA. Asymmetric causality tests with an application. Empir Econ. (2012) 43:447–56. doi: 10.1007/s00181-011-0484-x
2. Conlon T, McGee R. Safe haven or risky hazard? Bitcoin during the COVID-19 bear market. Finance Res Lett. (2020) 35:1–10. doi: 10.1016/j.frl.2020.101607
4. Barberis N, Shleifer A, Vishny R. A model of investor sentiment. J Financ Econ. (1998) 49:307–43. doi: 10.1016/S0304-405X(98)00027-0
5. Vasterman P, Yzermans JC, Dirkzwager AJ. The role of the media and media hypes in the aftermath of disasters. Epidemiol Rev. (2005) 27:107–14. doi: 10.1093/epirev/mxi002
6. Young ME, King N, Harper S, Humphreys KR. The influence of popular media on perceptions of personal and population risk in possible disease outbreaks. Health Risk Soc. (2013) 15:103–14. doi: 10.1080/13698575.2012.748884
7. Ciaian P, Rajcaniova M, Kancs DA. The economics of Bitcoin price formation. Appl Econ. (2016) 48:1799–815. doi: 10.1080/00036846.2015.1109038
8. Panagiotidis T, Stengos T, Vravosinos O. The effects of markets, uncertainty and search intensity on bitcoin returns. Int Rev Financ Anal. (2019) 63:220–42. doi: 10.1016/j.irfa.2018.11.002
9. Christie WG, Huang RD. Following the pied piper: do individual returns herd around the Market? Financ Anal J. (1995) 51:31–7. doi: 10.2469/faj.v51.n4.1918
10. Bikhchandani S, Sharma S. Herd behavior in financial Markets, IMF staff papers. Int Monet Fund. (2001) 47:279–310. doi: 10.2139/ssrn.228343
11. Dastgir S, Demir E, Downing G, Gozgor G, Lau CKM. The causal relationship between Bitcoin attention and Bitcoin returns: evidence from the Copula-based Granger causality test. Finance Res Letter. (2019) 28:160–4. doi: 10.1016/j.frl.2018.04.019
12. Baur DG, Lucey BM. Is gold a hedge or a safe haven? An analysis of stocks, bonds and gold. Financ Rev. (2010) 45:217–29. doi: 10.1111/j.1540-6288.2010.00244.x
13. Sandoval L, Franca IDP. Correlation of financial markets in times of crisis. Physica A. (2012) 391:187–208. doi: 10.1016/j.physa.2011.07.023
14. Bouri E, Molnar P, Azzi G, Roubaud D, Hagfors LI. On the hedge and safe haven properties of Bitcoin: is it really more than a diversifier. Finance Res Lett. (2017) 20:192–8. doi: 10.1016/j.frl.2016.09.025
15. Dyhrberg AH. Bitcoin, gold and the dollar-A GARCH volatility analysis. Finance Res Lett. (2016) 16:85–92. doi: 10.1016/j.frl.2015.10.008
16. Ballis A, Drakos K. Testing for herding in the cryptocurrency market. Finance Res Lett. (2020) 33:1012010. doi: 10.1016/j.frl.2019.06.008
17. Mariana CD, Ekaputra IA, Husoda A. Are Bitcoin and Ethereum safe-havens for stocks during the COVID-19 pandemic? Finance Res Lett. (2021) 38:101798. doi: 10.1016/j.frl.2020.101798
18. Corbet S, Larkin C, Lucey B. The contagion effects of the COVID-19 pandemic: evidence from gold and cryptocurrencies. Finance Res Lett. (2020) 35:1–7. doi: 10.1016/j.frl.2020.101554
19. Chen C, Liu L, Zhao N. Fear sentiment, uncertainty, and Bitcoin price dynamics: the case of COVID-19. Emerg Mark Finance Trade. (2020) 56:2298–309. doi: 10.1080/1540496X.2020.1787150
20. Demir E, Bilgin MH, Karabulut G. The relationship between cryptocurrencies and COVID-19 pandemic. Eurasian Econ Rev. (2020) 10:349–60. doi: 10.1007/s40822-020-00154-1
21. Umar Z, Guberava M. A time-frequency analysis of the impact of the Covid-19 induced panic on the volatility of currency and cryptocurrency markets. J Behav Exp Finance. (2020) 28:100404. doi: 10.1016/j.jbef.2020.100404
22. Lahmiri S, Bekiros S. The impact of COVID-19 pandemic upon stability and sequential irregularity of equity and cryptocurrency markets. Chaos Solitons Fractals. (2020) 138:109936. doi: 10.1016/j.chaos.2020.109936
23. Mnif E, Jarboui A, Mouakbar K. How the cryptocurrency market has performed during COVID 19? A multifractal analysis. Finance Res Lett. (2020) 36:101647. doi: 10.1016/j.frl.2020.101647
24. Yaravayo L, Matkovsky R, Jalon A. The effects of a ‘Black Swan' event (COVID-19) on herding behavior in cryptocurrency markets: evidence from cryptocurrency USD, EUR, JPY and KRW markets. SSRN Electron J. (2020) 1–50. doi: 10.2139/ssrn.3586511
25. Pesaran HM, Shin Y, Smith J. Bounds testing approaches to the analysis of level relationships. J Appl Econ. (2001) 16:289–326. doi: 10.1002/jae.616
26. Vogelvang B. Econometrics: Theory and Applications with EViews. Amsterdam: Prentice Hall. (2005).
27. De Vita G, Abbott A. Are saving and investment cointegrated? An ARDL bounds testing approach. Econ Lett. (2002) 77:293–9. doi: 10.1016/S0165-1765(02)00139-8
28. Nazlioglu S, Soytas U. World oil prices and agricultural commodity prices: evidence from emerging markets. Energy Econ. (2011) 33:488–96. doi: 10.1016/j.eneco.2010.11.012
30. Granger CWJ. Some recent developments in a concept of causality. J Econom. (1988) 39:199–211. doi: 10.1016/0304-4076(88)90045-0
31. Toda HY, Yamamoto T. Statistical inference in vector autoregressions with possibly integrated processes. J Econom. (1995) 66:225–50. doi: 10.1016/0304-4076(94)01616-8
32. Dickey D, Fuller WA. Distributions of the estimators for autoregressive time series with a unit root. Am Stat Assoc. (1979) 74:423–31. doi: 10.1080/01621459.1979.10482531
33. Perron P. Testing for a unit root in a time series with a changing mean. J Bus Econ Stat. (1990) 8:153–62. doi: 10.1080/07350015.1990.10509786
Keywords: Covid 19, Panic Index, Bitcoin, Ethereum, Ripple, Asymetric Causality
Citation: Vurur NS (2021) The Asymmetric Effect of Panic Index on Cryptocurrencies. Front. Appl. Math. Stat. 7:661388. doi: 10.3389/fams.2021.661388
Received: 30 January 2021; Accepted: 22 February 2021;
Published: 09 April 2021.
Edited by:
Simon Grima, University of Malta, MaltaReviewed by:
Ramona Rupeika-Apoga, University of Latvia, LatviaBeata Anna Swiecka, University of Szczecin, Poland
Syed Tahir, International Islamic University, Islamabad, Pakistan
Copyright © 2021 Vurur. This is an open-access article distributed under the terms of the Creative Commons Attribution License (CC BY). The use, distribution or reproduction in other forums is permitted, provided the original author(s) and the copyright owner(s) are credited and that the original publication in this journal is cited, in accordance with accepted academic practice. No use, distribution or reproduction is permitted which does not comply with these terms.
*Correspondence: Necmiye Serap Vurur, c2VyYXB2dXJ1ckBha3UuZWR1LnRy