 Subhradeep Roy
 Jeremy Lemus
- 1Department of Mechanical Engineering, Embry-Riddle Aeronautical University, Daytona Beach, FL, United States
- 2Department of Mechanical Engineering, California State University, Northridge, Los Angeles, CA, United States
The present study investigates how combined information from audition and vision impacts group-level behavior. We consider a modification to the original Vicsek model that allows individuals to use auditory and visual sensing modalities to gather information from neighbors in order to update their heading directions. Moreover, in this model, the information from visual and auditory cues can be weighed differently. In a simulation study, we examine the sensitivity of the emergent group-level behavior to the weights that are assigned to each sense modality in this weighted composite model. Our findings suggest combining sensory cues may play an important role in the collective behavior and results from the composite model indicate that the group-level features from pure audition predominate.
1 Introduction
Collective behavior in animal groups refers to the formation of group-level patterns from local interactions. Specifically, each individual in the group acts based on the information they receive by interacting with local neighbors. As a result, coordinated motion emerges in the absence of any centralized control. Collective behavior is commonly observed across biological systems, for example, ant colonies [1], fish schools [2, 3], mosquito swarms [4], and bird flocks [5]. A key benefit of living in a group is access to higher level of information, which helps social animals to locate food sources [6], avoid predators [7], and find mates [8].
To study the mechanism that produces group-level patterns from local interactions, a variety of models have been proposed in the literature that simulates group coordination [9–13]. The mathematical modeling of collective behavior involves different approaches: modeling the system as a continuous medium [9] or continuous-time [11] or modeling it as a collection of agents interacting in discrete-time [14]. A popular agent-based model to study collective behavior is the Vicsek model [15] that assumes behavioral rules at the individual level. Precisely, in the original Vicsek model, each individual moves with a constant speed within a two-dimensional confined space and aligns itself in the average direction of its neighbors, along with its free will modeled as an intrinsic noise. Beside the intrinsic noise, one can consider the extrinsic noise, which is used to model errors resulting from incorrect assumptions about the environment or others’ information [16]. The neighbors in the original Vicsek model are individuals residing inside a circular sensing region centered at the given individual’s current position. The simulation results show a phase transition from a random disordered state to an ordered state as the number of individuals or the noise strength is varied. The effect of intrinsic and extrinsic noise on phase transition has been studied in [16]. The results in [16] indicate that the phase transition due to intrinsic noise is continuous, but is discontinuous in the presence of extrinsic noise. The simplicity of the original Vicsek model has been adopted as the starting point, and it has prompted the study of many variants that intend to include biologically relevant features, for example, consideration of both attractive and repulsive interactions [17, 18] and a generalization to three-dimensions [19]. Moreover, considering the range of interactions for real-world biological swarms, as they may not have an omnidirectional view, restrictions are imposed in the field of vision from a circular disk to a sector [20–22].
Most collective behavior models implicitly assume that individuals communicate using a sensing modality analogous to vision [20, 21, 23]. However, some social animals make use of auditory cues for communication, such as bats and dolphins [24]. There is limited consideration in the literature for models implementing audition-based interaction, for instance, a model inspired by acoustic sensing in midges [25] and echolocation in bats [26]. A study in [27] employs auditory sensing within a modified Vicsek model to examine the differences in behavior at the group-level by comparing simulation results with a model that uses purely visual sensing. The auditory sensory system is modeled as a sector of a circle [27] using a well-characterized directivity pattern observed in the formation of ultrasonic beams and inspired by biological systems [28]. Auditory and visual modes within the model of [27] are defined differently in terms of neighbors and result contrasts the auditory mode with the visual mode in terms of higher alignment and lower aggregation.
Even though efforts have been made to study group behavior in the presence of individual sensing cues, only a limited model exists in the literature that allows one to consider the fusion of stimulus information resulting from multiple sensing cues. On the other hand, evidence from the real world studies in [28–30] suggests that bats communicate and navigate using multimodal sensing, including audition, vision, somatosensory and vestibular perception, and chemoreception. Furthermore, being equipped with vision and audition, bats gather complementary information; for example, vision helps detect long-range objects, while audition helps detect small ones with great accuracy [30]. More examples of behavioral studies of bats reporting the multisensory integration of information can be found in [30–34].
Multisensory integration has several advantages; for example, previous research shows that it reduces reaction times [35]. A study in [31] shows bats benefit from multimodal sensing since they do worse on avoiding obstacles when the ambient light is reduced. Moreover, the empirical evidence in [29] shows that the bats alter their flight even before they hear their neighbors’ echoes, showing how vision affects their flight behavior. Several studies in [32, 33, 36] show that bats continuously use two sensory modalities to find prey. According to [37], the high visual acuity and angular resolution of megabats make vision their preferred mode of navigation. The study on Egyptian fruit bats in [38] shows that bats increase the rate and intensity of their echolocation at low light levels when the bats’ visual abilities are limited, suggesting that at times vision influences echolocation. All this empirical evidence suggests that bats utilize different sensory modalities as they benefit from multisensory integration to compensate for information that is not accessible via a single modality. Therefore, depending on the task, information from different sensory modalities may be weighed differently.
It is, therefore, crucial to improve our understanding of how multimodal sensing positively impacts group behavior. To accomplish this, a graph-theoretic approach utilizing consensus and synchronization protocols is proposed in [39, 40] to analyze the impact of more than one sensing modalities. However, the approach in [39, 40] ignores the spatial distribution of individuals. In the present work, we introduce a composite model that allows information from auditory and visual sensing cues to be weighed differently within a two-dimensional Vicsek model for the first time. We conduct simulations to understand how the relative strength of these sensory cues influences group behavior, measured in terms of three different order parameters.
2 Modeling Weighted Auditory and Visual Sensing Modalities
This section describes the novel implementation of the weighted auditory and visual sensing modalities within a modified Vicsek model and defines the order parameters that capture the behavior at the group-level.
2.1 Original Vicsek Model
The original Vicsek model is comprised of N number of particles moving in a two-dimensional square box of size L × L with periodic boundary conditions and average particle density is given by ρ = N/L2. All the particles update their positions and heading directions in discrete-time. The initial positions and velocity directions of the N particles are randomly chosen within the square box and in the range [0, 2π], respectively, with uniform distributions. For an ith particle at time step k, the vectors
where v0 denotes the speed of the particles, and is assumed to be constant for all particles and for all time. To update heading direction, at every time step, each particle is subjected to short range interaction and assumes the average heading direction of itself and its neighbors with an error term characterized by a random noise. In the original Vicsek model, the neighbors for a given particle are defined as the other particles which are located within a circular region of radius r around it. This circular region is similar to a sensing region, which limits within which a particle can sense the presence of other particles. The interaction of a particle i with its neighbors at time step k + 1 is modeled in terms of heading angle
where
2.2 Modified Vicsek Model
Here we consider a modified version of the original Vicsek model where the particles use two distinct sensing modalities inspired from audition and vision to interact with other particles in the system. Moreover, we introduce a weighted update protocol, where the particles can ascribe different interaction strengths on these two sensing modalities. Below we describe the implementation of auditory and visual sensing modalities and the weighted update protocol.
The auditory and visual sensing modalities are incorporated similar to the work in [27]. In the visual sensing mode, each particle is assumed to have a sensing region similar to a field of vision, represented as a sector enclosed by two radii of length r and a central angle 2ϕ, where ϕ denotes the sensing angle. The sensing angle can vary from 0 to π, and is assumed to be symmetric about the individual’s current heading direction. The visual neighbors of the ith particle at time step k denoted as
In the modified Vicsek model, we keep the position update protocol same as that in Eq. 1 and introduce a weighted protocol, different from Eq. 2, to update a particle’s heading direction which allows the information from the above two sensory modalities to weigh differently. In this weighted protocol, the heading angle of a particle i at time step k + 1 updates as
where αv and αa are coupling parameters representing the interaction weights ascribed to the visual and auditory sensing mode, respectively, and can have values between zero and one, such that αv = 1 − αa. A schematic is shown in Figure 1 to describe the auditory and visual sensing schemes and an example have been used to demonstrate the weighted update protocol for the modified Vicsek model. Note that similar to the original Vicsek model (as in Eq. 2), we retain the stochastic component (
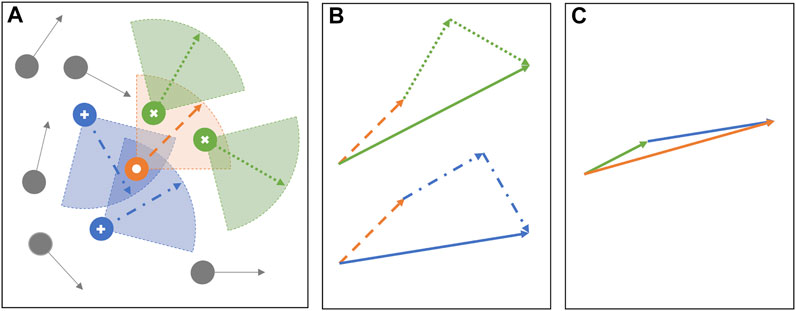
FIGURE 1. (A) The schematic shows the auditory and visual sensing schemes for a target individual (white circle). The “visual neighbors” are the individuals that the target “can see” and are marked using cross symbols. The “auditory neighbors” are the individuals that the target “can hear from” and are marked with plus symbols. In the present model, the auditory and visual sensing sectors are assumed to be geometrically similar having same r and ϕ for a given simulation. (B) Shows the vectorial addition of the heading directions from the two independent sensing modes, vision (top) and audition (bottom). Note that the heading direction (dashed orange vector) of the target appears in the vectorial addition of both the modes, allowing the total contribution from itself to be one. The resultant vector from vision (green solid vector) and audition (blue solid vector) averages the heading direction of visual and auditory neighbors, respectively. Finally (C) shows an example heading direction update in the next time step using the weighted protocol, with αa = 2/3 and αv = 1/3. Thus, the heading direction of the individual is computed by scaling the resultant vector of vision by one-third (one-third length of the green solid vector in B) and the resultant vector of audition by two-thirds (two-thirds length of the blue solid vector in B), followed by the vectorial addition. The solid orange arrow is the updated heading direction of the target at the next time step.
A preliminary study on the simultaneous use of visual and auditory sensing is previously considered in [41], which introduces a composite model that combines the sensory neighbors from pure vision and pure audition, and the update protocol was kept similar to Eq. 2 as in original Vicsek model. In other words, the interaction weight is kept constant of value one, irrespective of audition and vision. This leads to an important distinction between our present weighted composite model with that of the earlier composite model in [41]. Specifically, to consider the equal contribution from audition and vision in the present model, we set the coupling weights to be 0.5, and thus, only if a particle j qualifies as both auditory and visual neighbor, then the total weight ascribed to its heading angle is one. This is because in such a scenario, both
2.3 Order Parameters
To characterize the collective behavior that emerges from the above protocols in Eqs 1, 3, we consider three observables, also termed as order parameters. The first observable is polarization, which is a measure of group alignment, defined at each time step k as the absolute value of the average normalized velocity, calculated as
where
To investigate the spatial distribution of the particles with respect to the overall center of mass, we consider the second order parameter called cohesion. To compute cohesion, we first find the group’s center of mass calculated as
where the scaling coefficient, la = 4r, consistent with the study in [11]. Similar to polarization, cohesion can have values between zero and one, where cohesion value one corresponds to all particles congregating at the center of mass, while small values indicate that all particles are scattered far from the center of mass. Note that as we perform the simulations considering a finite arena, and with the assumption of the periodic boundary conditions, it is not possible for the system to attain cohesion value zero.
Finally, the third observable we consider is the largest cluster size of system. A collection of particles belong to a cluster when each particle in the cluster is connected to every other particle through a series of undirected edges that are drawn between each particle and its neighbors. If there are multiple such clusters at a given time, we only consider the largest cluster size, Sk, which corresponds to the total number of particles present in it. Therefore, when all particles are in the same cluster, the size of the largest cluster equals the size of the system, and that is what we select as the order parameter for the system.
3 Simulation Results and Discussion
Next, we conduct numerical simulations to study the group-level behaviors in terms of the order parameters defined above. For our simulations, we choose the length of the square box L = 10, the constant speed v0 = 0.03, and the radius of the sensing sectors for both audition and vision r = 1. We further set ρ = 10 and vary the control parameters noise intensity η, sensing angle ϕ, and the coupling parameter αa. Note that changing αa automatically changes αv following the relation αv = 1 − αa. The main focus of our present work is to study the differences in the group-level behavior as we vary the relative interaction strengths between audition and vision. Accordingly, we assume that the two sensing sectors corresponding to vision and audition are geometrically similar so that the observed differences in group behaviors are due to relative coupling weights rather than the differences in sensing regions. In other words, for a given simulation, we keep r and ϕ of audition same as that of r and ϕ of vision. Despite the fact that the sensing sectors for audition and vision are geometrically similar, the set of auditory neighbors differ from visual neighbors based on their definitions. Finally, the particles’ initial positions and heading directions are randomly generated within the square box and the unit circle, respectively, with uniform distributions. We generate the initial conditions once and keep them identical for all our simulations. We run each of our simulations for 50,000 time-steps and record positions and velocities of all the particles after excluding the initial transient of 10,000 time-steps. Next, we compute the mean polarization, mean cohesion, and mean largest cluster size, averaged over the remaining 40,000 time-steps.
Figure 2 presents the results for the mean polarization at different values of αa. Within each sub-figure (A to J), η (noise intensity) is varied along the vertical axis from 0.1 to 1 with a small increment of 0.1 and then from 1 to 5 with an increment of 1, and ϕ is increased along horizontal axis from 0 to π with a constant increment of π/15. To study the dependence of mean polarization on the coupling parameter, we choose a range of values for αa as [0, 0.01, 0.05, 0.1, 0.15, 0.2, 0.25, 0.50.75, 1]. Likewise Figures 3, 4 show the results for mean cohesion and mean largest cluster size, respectively.
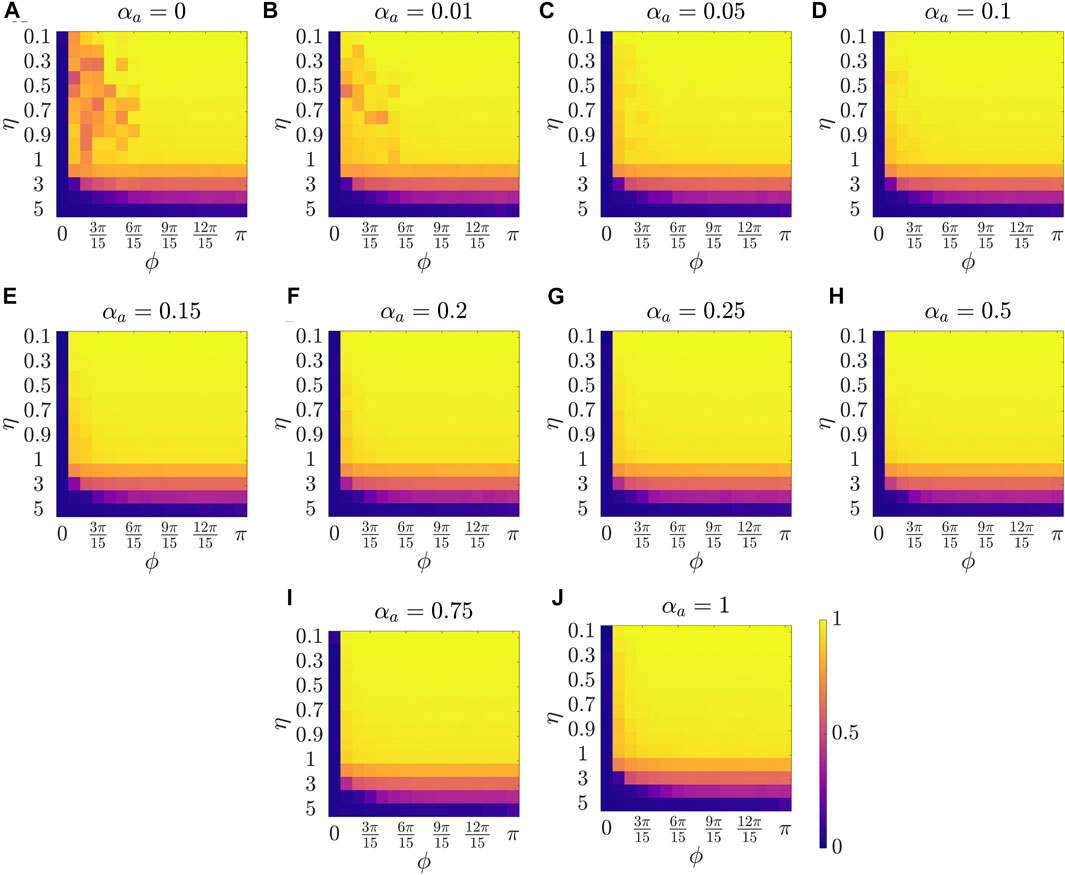
FIGURE 2. Results for the mean polarization at different values of αa, shown at the title of each sub-figure. Within each sub-figure (A–J), η is varied along the vertical axis, and ϕ is varied along the horizontal axis.
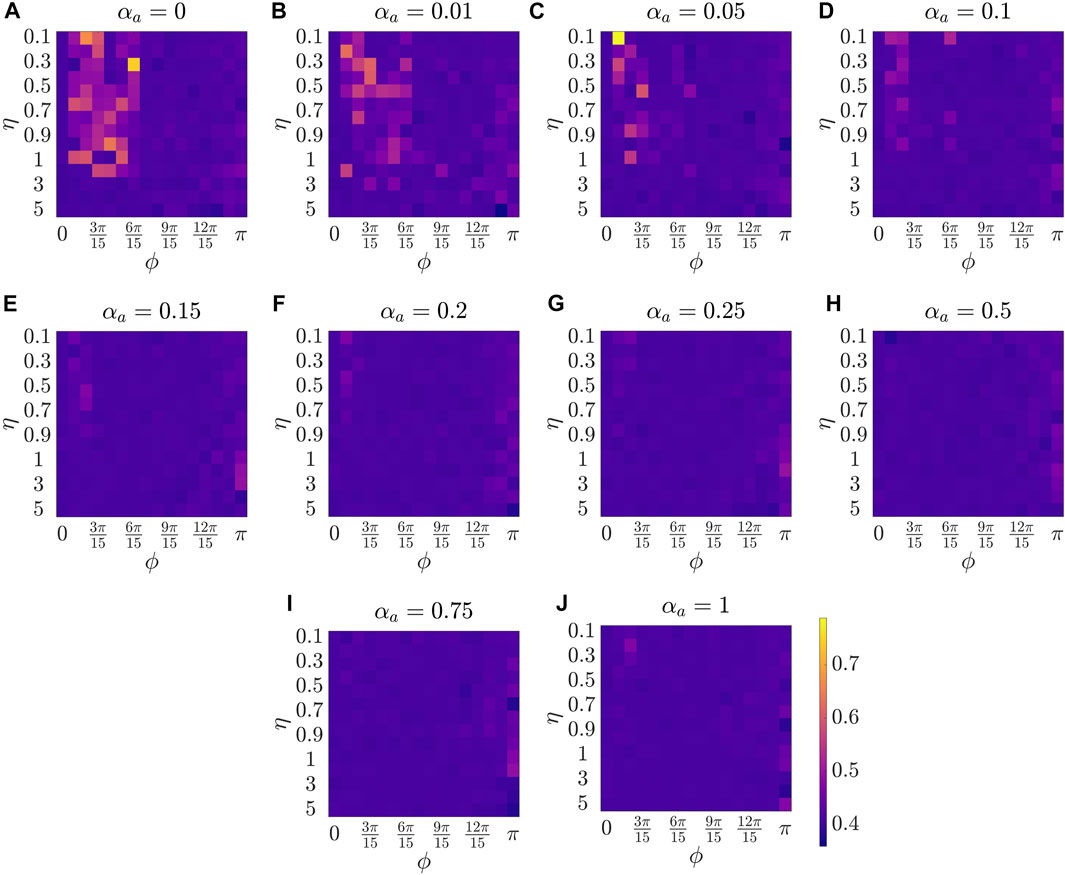
FIGURE 3. Results for the mean cohesion size at different values of αa, shown at the title of each sub-figure. Within each sub-figure (A–J), η is varied along the vertical axis, and ϕ is varied along the horizontal axis.
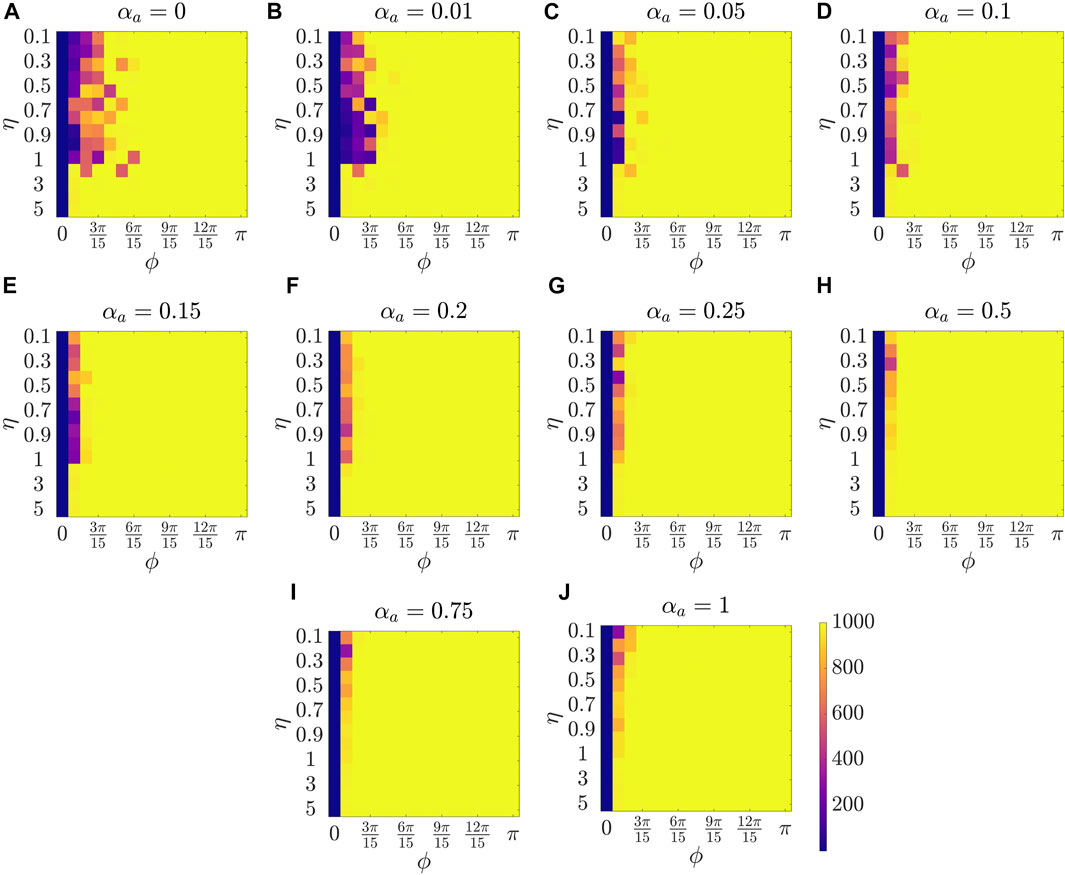
FIGURE 4. Results for the mean largest cluster size at different values of αa, shown at the title of each sub-figure. Within each sub-figure (A–J), η is varied along the vertical axis, and ϕ is varied along the horizontal axis.
Observing each sub-figure in Figure 2, we identify that polarization is zero when ϕ = 0, and polarization increases with increasing ϕ as prominently observed in Figure 2A with αa = 0. Note that when ϕ = 0, particles do not have a sensing region, and thus they do not interact, resulting in a random walk with polarization value zero. Increasing ϕ results in increased interactions which benefits the group to achieve group alignment. In presence of interaction (i.e., ϕ > 0), we observe a trend of decreasing polarization with increasing η at a constant ϕ, for example in Figure 2C at ϕ = π/15. This phenomenon, commonly observed in the Vicsek model, shows that increasing the amplitude of noise intensity destroys the group alignment of the system.
Next, by comparing pure vision in Figure 2A with αa = 0 and pure audition in Figure 2J with αa = 1, we identify a disparate behavior, similar to the study in [27]. In particular, we observe that in the pure vision, polarization is relatively small at small sensing angles ϕ ≤ 6π/15, whereas, in the pure audition, the particles achieve a polarization of one for ϕ > 3π/15. To understand the small values of polarization at small sensing angles in pure vision, we look at the corresponding values of mean cohesion and mean largest cluster size in Figures 3, 4, respectively. For example, for ϕ ≤ 6π/15, Figure 3A shows that the cohesion values are high, whereas Figure 4A shows that the size of the largest cluster is small. These results suggest that in pure vision at small sensing angles, the particles form multiple clusters, thus decreasing the size of the largest cluster. Furthermore, the particles within these individual clusters are closely spaced, which increases cohesion values; however, all these clusters do not necessarily move in the same direction, thus decreasing the polarization values. On the other hand, in pure audition, even for small sensing angles (3π/15 ≤ ϕ ≤ 6π/15), we observe high values for both polarization and largest cluster size but small values for cohesion. This is because all the particles group into one large cluster with the same heading direction and thus achieves polarization value one, but the particles within the cluster are loosely packed and evenly distributed in space, thus decreasing cohesion.
To explore the group-level behavior in composite sensing of weighted audition and vision, we start with polarization. The modified Vicsek model introduced in this work allows us to observe the changes in the group-level features as we transition from pure vision to pure audition by increasing the tuning parameter αa from zero to one. Thus, we start with very weak auditory coupling but strong visual coupling. Interestingly, Figure 2B (αa = 0.01) and Figure 2C (αa = 0.05) show that even in the presence of very weak auditory coupling, the polarization values at small sensing angles increase compared to pure vision as in Figure 2A. As we keep increasing αa, we observe that the polarization values at small sensing angles (ϕ ≤ 3π/15) keep increasing from Figure 2D (αa = 0.1) to Figure 2G (αa = 0.25). The polarization reaches a maximum in Figure 2H when αa = 0.5, which corresponds to equal contribution from audition and vision. This can be observed by comparing polarization values between Figure 2G (mean polarization is 0.920), 2H (mean polarization is 0.936), and 2I (mean polarization is 0.924), at ϕ = π/15, and η = 0.9. From these observations, we summarize that the system can achieve a perfect group alignment, even using a narrow sensing region, by combining information from audition and vision as in the weighted composite model. Furthermore, the system gets the maximum benefit when the contribution from the individual modes are equal.
Next, we explore group-level behavior in terms of cohesion and the largest cluster size in the weighted composite model. Figure 3 shows a decrease in cohesion values at small sensing angles with increasing αa, and cohesion is observed to be minimum when αa = 0.5. Similarly, Figure 4 shows an increase in the largest cluster size at small sensing angles with increasing αa, and the maximum value is observed at αa = 0.5. Moreover, the differences are only observed in the three order parameters starting from αa = 0.2 to αa = 1 when ϕ is at its smallest value of π/15, whereas results are identical at other values of ϕ. These results show that once the auditory sensing is introduced in the system, even in weak form, the traits from pure audition dominates the group-level features.
4 Conclusion and Future Work
In the present work, we take inspiration from the observations of real bats that integrate visual and auditory information for effective navigation and introduce a modified Vicsek model that uses a weighted scheme to update individual heading directions. Specifically, the update scheme allows the information from both visual and auditory cues to weigh differently. Next, we conduct simulations to study the effect of relative weights ascribed to each sensing modality on emergent group behavior. Finally, we measure the group behavior in terms of three order parameters, and results show that the group-level features from pure audition dominate the behavior. This study demonstrates that combining information from multiple sensory cues can play a significant role in collective behavior.
An improvement of the present study can be in terms of validating the model using empirical data of bats. However, there is limited availability of a large dataset of bats, as tracking individuals in a large group for a long time is an immensely challenging task. For example, an onboard microphone is needed to collect acoustic data of the bat’s location, which is difficult given the bat’s small size and lightweight [42].
Finally, the present study relies on the use of a “minimal” setup that can produce a cohesive moving group, which the Vicsek model achieves, in order to examine the effect of simultaneous use of audition and vision on the group level behavior. Accordingly our model is built on the same set of assumptions as that of the original Vicsek model, which limits its ability in its current form to incorporate some real-world features. For example, the speed of the individuals are assumed to be constant for all time. Moreover, the number of individuals in conserved but the momentum is not conserved under the alignment interactions [43]. In addition, a two-dimensional model is considered in the present study as the first effort to implement composite sensing cues. We will relax some of these assumptions in future study and will consider biologically relevant and geometrically different parameters to model the auditory and visual sensing sectors, explore a generalized three-dimensional Vicsek model with composite sensing modalities, and consider the extrinsic (measurement) noise which will make the model more realistic.
Data Availability Statement
The original contributions presented in the study are included in the article/Supplementary Material, further inquiries can be directed to the corresponding author.
Author Contributions
SR conceived the study and developed the model, JL conducted the simulation, SR analyzed the results, and wrote the main manuscript.
Conflict of Interest
The authors declare that the research was conducted in the absence of any commercial or financial relationships that could be construed as a potential conflict of interest.
Publisher’s Note
All claims expressed in this article are solely those of the authors and do not necessarily represent those of their affiliated organizations, or those of the publisher, the editors and the reviewers. Any product that may be evaluated in this article, or claim that may be made by its manufacturer, is not guaranteed or endorsed by the publisher.
References
1. Couzin, ID, and Franks, NR. Self-organized Lane Formation and Optimized Traffic Flow in Army Ants. Proc R Soc Lond B (2003) 270:139–46. doi:10.1098/rspb.2002.2210
2. Parrish, JK, Viscido, SV, and Grünbaum, D. Self-organized Fish Schools: an Examination of Emergent Properties. Biol Bull (2002) 202:296–305. doi:10.2307/1543482
3. Abaid, N, and Porfiri, M. Fish in a Ring: Spatio-Temporal Pattern Formation in One-Dimensional Animal Groups. J R Soc Interf (2010) 7:1441–53. doi:10.1098/rsif.2010.0175
4. Butail, S, Manoukis, NC, Diallo, M, Ribeiro, JMC, and Paley, DA. The Dance of MaleAnopheles Gambiaein Wild Mating Swarms. J Med Entomol (2013) 50:552–9. doi:10.1603/me12251
5. Ballerini, M, Cabibbo, N, Candelier, R, Cavagna, A, Cisbani, E, Giardina, I, et al. Interaction Ruling Animal Collective Behavior Depends on Topological rather Than Metric Distance: Evidence from a Field Study. Proc Natl Acad Sci (2008) 105:1232–7. doi:10.1073/pnas.0711437105
6. Pitcher, TJ, Magurran, AE, and Winfield, IJ. Fish in Larger shoals Find Food Faster. Behav Ecol Sociobiol (1982) 10:149–51. doi:10.1007/bf00300175
7. Ioannou, CC, Guttal, V, and Couzin, ID. Predatory Fish Select for Coordinated Collective Motion in Virtual Prey. Science (2012) 337:1212–5. doi:10.1126/science.1218919
8. Cowan, DP. Group Living in the European Rabbit (oryctolagus Cuniculus): Mutual Benefit or Resource Localization. J Anim Ecol (1987) 56:779–95. doi:10.2307/4948
9. Topaz, CM, Bertozzi, AL, and Lewis, MA. A Nonlocal Continuum Model for Biological Aggregation. Bull Math Biol (2006) 68:1601–23. doi:10.1007/s11538-006-9088-6
10. Couzin, ID, Krause, J, James, R, Ruxton, GD, and Franks, NR. Collective Memory and Spatial Sorting in Animal Groups. J Theor Biol (2002) 218:1–11. doi:10.1006/jtbi.2002.3065
11. Aureli, M, and Porfiri, M. Coordination of Self-Propelled Particles through External Leadership. Epl (2010) 92:40004. doi:10.1209/0295-5075/92/40004
12. Vicsek, T, and Zafeiris, A. Collective Motion. Phys Rep (2012) 517:71–140. doi:10.1016/j.physrep.2012.03.004
13. Barbaro, ABT, Taylor, K, Trethewey, PF, Youseff, L, and Birnir, B. Discrete and Continuous Models of the Dynamics of Pelagic Fish: Application to the Capelin. Mathematics Comput Simulation (2009) 79:3397–414. doi:10.1016/j.matcom.2008.11.018
14. Zhang, W, and Yang, Y. A Survey of Mathematical Modeling Based on Flocking System. Vibroengineering PROCEDIA (2017) 13:243–8. Available at: https://www.jvejournals.com/article/18839.
15. Vicsek, T, Czirók, A, Ben-Jacob, E, Cohen, I, and Shochet, O. Novel Type of Phase Transition in a System of Self-Driven Particles. Phys Rev Lett (1995) 75:1226–9. doi:10.1103/physrevlett.75.1226
16. Aldana, M, Larralde, H, and Vázquez, B. On the Emergence of Collective Order in Swarming Systems: a Recent Debate. Int J Mod Phys B (2009) 23:3661–85. doi:10.1142/s0217979209053552
17. Tarras, I, Bakir, R, Hader, A, Mazroui, M, Cambui, DS, and Boughaleb, Y. The Combined Effect of Repulsion Zone and Initial Velocity on Vicsek Model. Sens Lett (2018) 16:123–7. doi:10.1166/sl.2018.3923
18. Chaté, H, Ginelli, F, Grégoire, G, Peruani, F, and Raynaud, F. Modeling Collective Motion: Variations on the Vicsek Model. Eur Phys J B (2008) 64:451–6. doi:10.1140/epjb/e2008-00275-9
19. Czirók, A, Vicsek, M, and Vicsek, T. Collective Motion of Organisms in Three Dimensions. Physica A Stat Mech its Appl (1999) 264:299–304. doi:10.1016/s0378-4371(98)00468-3
20. Tian, BM, Yang, HX, Li, W, Wang, WX, Wang, BH, and Zhou, T. Optimal View Angle in Collective Dynamics of Self-Propelled Agents. Phys Rev E Stat Nonlin Soft Matter Phys (2009) 79:052102. doi:10.1103/PhysRevE.79.052102
21. Li, Y-J, Wang, S, Han, Z-L, Tian, B-M, Xi, Z-D, and Wang, B-H. Optimal View Angle in the Three-Dimensional Self-Propelled Particle Model. Epl (2011) 93:68003. doi:10.1209/0295-5075/93/68003
22. Durve, M, and Sayeed, A. First-order Phase Transition in a Model of Self-Propelled Particles with Variable Angular Range of Interaction. Phys Rev E (2016) 93:052115. doi:10.1103/PhysRevE.93.052115
23. Wang, X-G, Zhu, C-P, Yin, C-Y, Hu, D-S, and Yan, Z-J. A Modified Vicsek Model for Self-Propelled Agents with Exponential Neighbor Weight and Restricted Visual Field. Physica A: Stat Mech its Appl 392 (2013) 2398–405.sdoi:10.1016/j.physa.2013.01.022
24. Thomas, JA, Moss, CF, and Vater, M. Echolocation in Bats and Dolphins. University of Chicago Press (2004).
25. Gorbonos, D, Ianconescu, R, Puckett, JG, Ni, R, Ouellette, NT, and Gov, NS. Long-range Acoustic Interactions in Insect Swarms: an Adaptive Gravity Model. New J Phys (2016) 18:073042. doi:10.1088/1367-2630/18/7/073042
26. Shirazi, MJ, and Abaid, N. Collective Behavior in Groups of Self-Propelled Particles with Active and Passive Sensing Inspired by Animal Echolocation. Phys Rev E (2018) 98:042404. doi:10.1103/physreve.98.042404
27. Roy, S, Shirazi, MJ, Jantzen, B, and Abaid, N. Effect of Visual and Auditory Sensing Cues on Collective Behavior in Vicsek Models. Phys Rev E (2019) 100:062415. doi:10.1103/PhysRevE.100.062415
28. Yovel, Y, and Greif, S. Bats-Using Sound to Reveal Cognition. Field and Laboratory Methods in Animal Cognition: A Comparative Guide (2018) 31–59.
29. Kong, Z, Fuller, N, Wang, S, Özcimder, K, Gillam, E, Theriault, D, et al. Perceptual Modalities Guiding Bat Flight in a Native Habitat. Sci Rep (2016) 6:27252. doi:10.1038/srep27252
30. Whiley, RE, and Day, RM. Multisensory Integration of Echolocation and Vision in Mammals. West Undergraduate Psychol J (2019) 7 (1).
31. Orbach, DN, and Fenton, B. Vision Impairs the Abilities of Bats to Avoid Colliding with Stationary Obstacles. PLoS One (2010) 5:e13912. doi:10.1371/journal.pone.0013912
32. Eklöf, J, Svensson, AM, and Rydell, J. Northern Bats,Eptesicus Nilssonii, Use Vision but Not Flutter-Detection when Searching for Prey in Clutter. Oikos (2002) 99:347–51. doi:10.1034/j.1600-0706.2002.990216.x
33. Rydell, J, and Eklf, J. Vision Complements Echolocation in an Aerial-Hawking Bat. Naturwissenschaften (2003) 90:481–3. doi:10.1007/s00114-003-0464-x
34. Geva-Sagiv, M, Romani, S, Las, L, and Ulanovsky, N. Hippocampal Global Remapping for Different Sensory Modalities in Flying Bats. Nat Neurosci (2016) 19:952–8. doi:10.1038/nn.4310
35. Stein, BE, and Stanford, TR. Multisensory Integration: Current Issues from the Perspective of the Single Neuron. Nat Rev Neurosci (2008) 9:255–66. doi:10.1038/nrn2331
36. Boonman, A, Bar-On, Y, Yovel, Y, and Cvikel, N. It's Not Black or white-on the Range of Vision and Echolocation in Echolocating Bats. Front Physiol (2013) 4:248. doi:10.3389/fphys.2013.00248
37. Thiele, A, Rübsamen, R, and Hoffmann, KP. Anatomical and Physiological Investigation of Auditory Input to the superior Colliculus of the Echolocating Megachiropteran Bat Rousettus Aegyptiacus. Exp Brain Res (1996) 112:223–36. doi:10.1007/BF00227641
38. Danilovich, S, Krishnan, A, Lee, W-J, Borrisov, I, Eitan, O, Kosa, G, et al. Bats Regulate Biosonar Based on the Availability of Visual Information. Curr Biol (2015) 25:R1124–R1125. doi:10.1016/j.cub.2015.11.003
39. Roy, S, and Abaid, N. Consensus of Conspecific Agents via Collaborative and Antagonistic Interactions. In Dynamic Systems and Control Conference, American Society of Mechanical Engineers (2015) doi:10.1115/dscc2015-9655
40. Roy, S, and Abaid, N. On the Effect of Collaborative and Antagonistic Interactions on Synchronization and Consensus in Networks of Conspecific Agents. IEEE Trans Automat Contr (2016) 61:4063–8. doi:10.1109/tac.2016.2538999
41. Lemus, J, and Roy, S. The Effect of Simultaneous Auditory and Visual Sensing Cues in a Two-Dimensional Vicsek Model. In Dynamic Systems and Control Conference. American Society of Mechanical Engineers (2020) doi:10.1115/dscc2020-3277
42. Roy, S, Howes, K, Müller, R, Butail, S, and Abaid, N. Extracting Interactions between Flying Bat Pairs Using Model-free Methods. Entropy (2019) 21:42. doi:10.3390/e21010042
Keywords: audition, collective behavior, vicsek model, vision, weighted composite model, multisensory integration, order parameters
Citation: Roy S and Lemus J (2021) How Does the Fusion of Sensory Information From Audition and Vision Impact Collective Behavior?. Front. Appl. Math. Stat. 7:758711. doi: 10.3389/fams.2021.758711
Received: 14 August 2021; Accepted: 16 September 2021;
Published: 01 October 2021.
Edited by:
Raluca Eftimie, University of Franche-Comté, FranceReviewed by:
Paola Lecca, Free University of Bozen-Bolzano, ItalyAnthony O’Hare, University of Stirling, United Kingdom
Kevin Rio, Facebook Reality Labs Research, United States
Copyright © 2021 Roy and Lemus. This is an open-access article distributed under the terms of the Creative Commons Attribution License (CC BY). The use, distribution or reproduction in other forums is permitted, provided the original author(s) and the copyright owner(s) are credited and that the original publication in this journal is cited, in accordance with accepted academic practice. No use, distribution or reproduction is permitted which does not comply with these terms.
*Correspondence: Subhradeep Roy, c3ViaHJhZGVlcC5yb3lAZXJhdS5lZHU=