- Department of Mathematics, Rowan University, Glassboro, NJ, United States
The purpose of this paper is to examine the effects of vegetative growth on the reliability of electric power distribution system under normal (storm exclusion) operating conditions, and to determine an effective vegetation maintenance schedule. Generalized statistical linear regression models, including Poisson, Negative Binomial, Zero-Inflated, and their mixed model variants are developed and are applied into a 5-years outage data along with vegetation maintenance history from a power company in Midwestern United States. From the methodological point of view, advanced statistical models such as zero-inflated models and mixed models are utilized the first time on outage data and provided good fit to the occurrence of outages. In practice, numerical results from this study suggest that an optimal cycle length of every 6 years could be greatly helpful for power companies in devising a cost-effective schedule, improving system reliability, and maintaining customer satisfaction.
1 Introduction
Virtually all power distribution circuitry in the United States operate in a multi-earth-grounded configuration. This means that an electrical fault will exist if an electrical connection is made to ground. If the normal growth of vegetation under or next to distribution lines is not held in check by pruning, growth will eventually bring it close enough to the wires to create a conductive path to earth; causing a fault which will lead to an outage.
To ensure high levels of reliability in the distribution system, vegetative maintenance (tree trimming and other vegetation control measures) is periodically conducted by electric utilities. Since the costs of such maintenance counts a large fraction of the total amount spent on distribution system maintenance [1] and can be millions of dollars even for a small utility [2], the cycle length is generally selected by economics. It might seem like a longer trimming cycle would be the most economical choice because it spreads the cost out over time. However, this thinking is flawed because the amount of work that has to be done increases very rapidly with time. The work load increases due to two factors. First, the amount of biomass that must be cut and handled increases rapidly with each year of growth and second, as the tree grows closer to the energized lines, workers must use caution to keep from getting hurt or killed. In fact, short cycles are expensive due to the amount of work and long cycles are also costly due to excessive biomass and loss of productivity. Therefore, an advanced understanding on the relationship between vegetative growth and system reliability can help the power companies determine an effective vegetation maintenance schedule.
Some studies have been made to quantitatively analyze the effects of vegetative growth on distribution system outages. The paper [3] presented a time series and a non-linear machine learning regression model for predicting the number of vegetation-related outages that occur in power distribution systems on a monthly basis. In the article [1], several direct failure-rate models were investigated to predict the time-varying, vegetation-related failure rates of overhead distribution power lines. The authors in [4] developed statistical models for estimating the impacts of tree trimming on electric power system outages under normal operating conditions. Another study [5] reported a maintenance-scheduling algorithm that determines the optimal location and time for performing vegetation maintenance on overhead distribution feeders using a vegetation failure rate model. However, the number of literature on this critical issue is still limited due to the difficulty of collecting outage data, therefore this problem has not been investigated to the fullest extent yet.
In this paper, a novel approach to quantify the impact of vegetation growth on electric power system outages is proposed. Utilizing statistical and machine learning predictive models, the proposed method advances the understanding on the relationship between vegetative growth and system reliability and enables effective and timely decision-making actions by power industry. What distinguishes this approach from the other studies in the literature could be summarized in the following three aspects:
• From a theoretical perspective, to the best of our knowledge, ours is the first study that includes some statistical models such as zero-inflated Poisson and zero-inflated Negative Binomials, as well as the mixed models into the analysis of actual outage data. Considering a majority of 0’s in the data and the clustering nature, those models provide better fit to the occurrence of outages than the existing methods.
• One main reason for the perceived lack of studies on this critical problem is the limited access to a sufficient amount of outage data. Our approach takes advantage of a considerable amount of vegetation-related outage data that is provided by a power company in Midwestern United States, thus allows a sound statistical basis and strong conclusions to be drawn.
• In practice, our study explicitly suggests an optimal cycle length of every 6 years, which could be greatly helpful for power companies in devising a cost-effective schedule, improving system reliability, and maintaining customer satisfaction.
The rest of this paper is organized as follows. Section 2 describes the outage data. In Section 3, generalized statistical linear regression models, including Poisson, Negative Binomial, Zero-Inflated, and their mixed model variants are introduced and developed. In Section 4, we fit the statistical models on a real outage data, the results are presented and discussed. The paper ends with discussion and future research directions.
2 Data Description
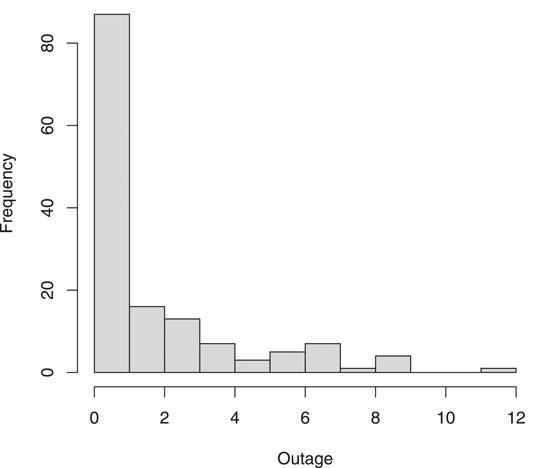
The analysis in this paper is based on data from a power company in Midwestern U.S, containing 431 vegetation-caused outages on 144 circuits for 2012 through 2016. A vegetation-caused outage is defined as any outage caused when the vegetation gets close enough to sway into the line or to create a path for a tree dwelling animal to bridge the air-gap between energized lines and vegetation, under normal (storm exclusion) operating conditions. For this data, the date and time of each outage, the duration of the outage, the name of the circuit where the outage occurred, the number of years since the last routine vegetation maintenance was performed (year of vegetative growth), and the number of customers affected by the outage are recorded. Figure 1 shows the histogram of vegetation-caused outages on each circuit. It can be seen that most circuits only have 1 outage, and the distribution is right skewed.
3 Statistical Models
In statistics, count data is a type of data in which the observations can take only the non-negative integer values, for example, the number of power outages on a circuit in this paper. When modeling count data, the classical ordinary least-squares (OLS) regression is often inappropriate because the homoscedasticity and normality assumptions are violated. The violation of the basic OLS assumptions can result in inaccurate estimates of standard errors, and misleading p-values and consequent confidence intervals [6]. A class of generalized linear regression models has been developed for modeling count data. These models have a number of advantages over an ordinary linear regression model, including a skew, discrete distribution, and the restriction of predicted values to non-negative numbers [7].
The most widely used model for count data is Poisson model. The Poisson model is made up of a Poisson probability mass function (PMF) denoted as P (yi = k) used to calculate the probability of observing k events given a mean event rate of λ, and a link function that is used to express the mean rate λ as a function of the regression variables X. The Poisson PMF is
where yi is the observed count for the ith row in the dataset, λi is the event rate corresponding to the ith sample. The link function of the Poisson regression model is expressed as
where ln (⋅) is the natural logarithm function, xi = [xi1, xi2, … , xip] is the regression variables in the ith row, and β is the vector of regression coefficients.
The Poisson model assumes that the mean and variance of the errors are equal, but usually in practice the variance of the errors is larger than the mean. In these cases, we say that the data is “overdispersed”. When overdispersion arises, the Poisson model is not proper, and an alternative is a Negative Binomial (NB) model. The Negative Binomial distribution is a form of the Poisson distribution in which the distribution’s parameter is itself considered a random variable. The variation of this parameter can account for a variance of the data that is higher than the mean. With a NB model, the count data are assumed to follow a NB PMF as what follows,
where Γ(⋅) is the gamma function, α is the overdispersion parameter, and the regression model is same as for the Poisson model in (3.2).
When count data has both excess zeros and large counts, zero-inflated Poisson regression (ZIP [8]) is a practical way to deal with such situation. It assumes that with probability p the only possible observation is zero, and with probability 1 − p a Poisson (λ) random variable is observed. The intuition behind the ZIP model is that there is a second underlying process that is determining whether a count is zero or non-zero. A ZIP distribution can be written as
The Poisson mean λi and the probability pi are linked to the explanatory variables through the log link in (3.2) and logit link as
where zi is the vector of covariates for the ith subject, and γ is the vector of the corresponding regression coefficients.
The zero-inflated Negative Binomial (ZINB) regression is used for count data that exhibits overdispersion and excess zeros. The data distribution combines the NB distribution and the logit distribution. The model can be expressed as
where g (yi) = P (yi = k) is defined in (3.3), and the link functions are the same with the ZIP model in (3.2) and (3.5).
4 Statistical Analysis
In this section, we fit the models on the outage data set and draw conclusions on the basis of these fitted models. The Akaike Information Criterion (AIC [9]) and Bayesian Information Criterion (BIC [10]) are utilized to compare models. The AIC of a fitted model is defined as
and the BIC is expressed as
where
4.1 Total Outages v.s. Cumulative Growth Years
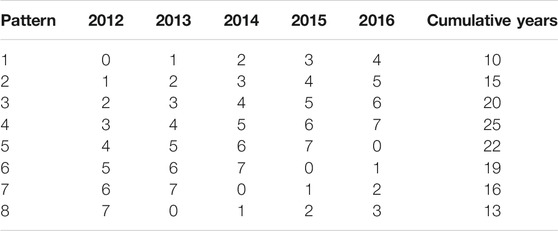
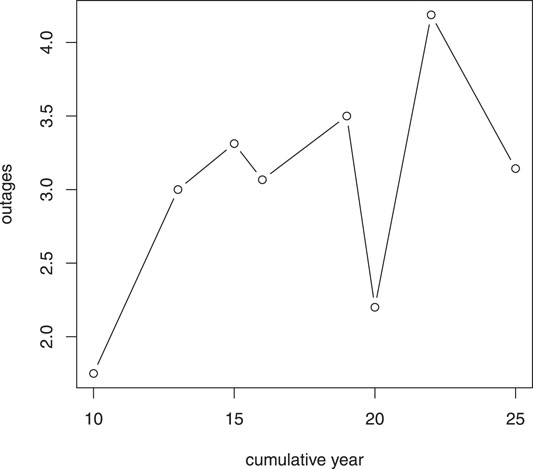
First, we focus on the relationship between the total vegetation-caused outages on each circuit and its cumulative vegetative growth year. Over the 5-years of reliability data on the current 7 years maintenance cycle, there are eight possible trimming patterns for each of the circuit. For example, for all circuits last maintained in 2012, the years of growth after the trimming for 2012–2016 are 0,1,2,3,4, respectively, therefore are assigned pattern 1 and this pattern has a cumulative years of growth 0 + 1 + 2 + 3 + 4 = 10. Likewise, the rest of the patterns look like in Table 1. Assuming all the circuits are independent, using the total outages on a circuit as the response and the cumulative years of vegetative growth as the predictor is to fulfill the independence assumption of classical regression models. In Figure 2 we can observe an overall increasing trend in the mean outages as cumulative years grow.
For each circuit i, i = 1, … , 144, we sum the total number of vegetation-caused incidents on circuit i in the 5-years period and define the vector the response variable yi, and let the predictor xi be the cumulative years of growth from 2012 to 2016. We then apply the four regression models discussed in Section 3 on this data. In order to fit for the ZIP and ZINB models, we subtract the number of outages by 1 so that to have a majority of 0’s in the data. Statistical software R is used to facilitate this analysis. The “glm” and “glm.nb” functions are implemented to fit the Poisson and NB models, both of which are in the package “MASS”, and the “zeroinfl” function within the package “pscl” is applied to fit the ZIP and ZINB models. The regression parameter estimates and p-values, as well as the values of AIC and BIC from the four models are reported in Table 2.

TABLE 2. The regression parameter estimates, p-values, values of AIC and BIC from the Poisson, NB, ZIP, and ZINB models.
Overall, NB-type models fit the data substantially better than Poisson models do. It is not surprising as the response variable is overdispersed with a variance of 6.216 and a mean of 1.993. Based on the values of AIC and BIC, we find that the NB model fits the data the best. The results demonstrate that vegetative growth has a significant positive effect on vegetation-caused outages.
To decide the optimal cycle length, we introduce some indicator variables pj as follows,
Along the 7 years trimming cycle, j = 0, … , 7. For example, growth year of 7 is included in trimming patterns 4, 5, 6, 7, 8, thus
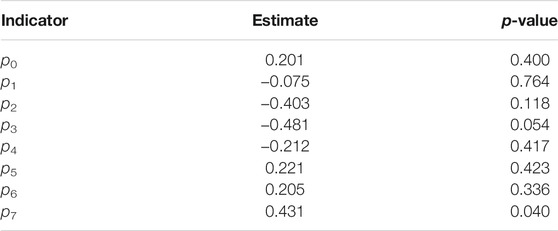
If p7 is a significant predictor on outages, it means the patterns involving year 7 have significant more outages than other patterns, in other words, growth year 7 tends to have more outages than other years. We then fit the NB model with the response yi on each pj, individually. The results are included in Table 3. Table 3 shows that growth year 7 tends to have significantly more outages than other years, therefore the power company should consider shortening the current 7 years trimming cycle to a 6 years cycle, in order to decrease vegetation-caused outages.
4.2 Outages v.s. Vegetative Growth Years
In this section, we will quantify the relationship between the number vegetative-caused outages in each year on each circuit and the number of years of vegetative growth when the outage occurred. If we consider each circuit as a cluster, thus the data has a clustered structure and the outages on the same circuit across different years are correlated. Statistical models introduced in Section 3 can not be directly employed to clustered data since they all assume the observations are independent. The violation of the independence assumption might result in misleading conclusions. The mixed effects models treat clustered data adequately and assumes two sources of variation, within cluster and between clusters. Two types of coefficients are distinguished in the mixed model: fixed effects and random effects (or cluster specific effects). The fixed effects have the same meaning as in classical statistics, the random effects are random and are estimated as posterior means [11].
For count data specially, a generalized linear mixed model, i.e., a Poisson generalized linear mixed (GLM) model with a random intercept, is conducted for this analysis. This model assumes that the conditional distribution of the count data is the Poisson distribution as in (3.2), but it adds an extra random term in the link function as shown in (4.3),
where bi is the random effect in cluster i and represents circuit-specific variability. By accommodating both fixed and random effects, this model provides an effective and flexible way of representing the mean as well as the covariance structure of the data. Similarly, we can have the GLM variant for NB, ZIP, ZINB models in Section 3.1.
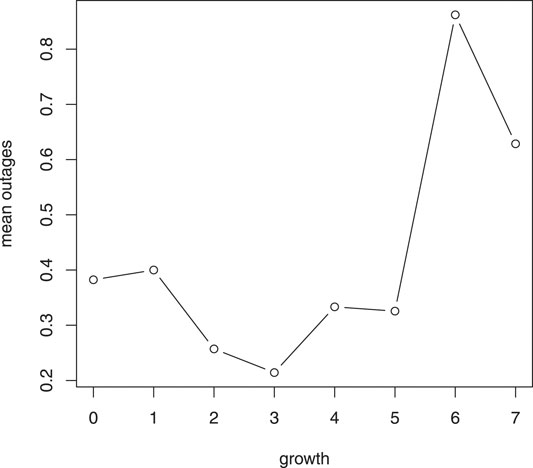
We then define the response variable yij as the total number of vegetative-caused outages incidents on circuit i on growth year j, and let the fixed effect xij be the growth year for circuit i on year j, the circuit effect is consider random in the mixed model. For each circuit, we only focus on those years having vegetative-caused outages, thus yij > 0 for all (i, j). This generates a data set with 306 observations from 144 circuits. Figure 3 shows an increasing trend of the mean vegetative-caused outages over growth years.
In order to fit for the ZIP and ZINB GLM models, we subtract the number of outages by 1, so that we have a majority of 0’s in the data. The “glmmPQL” function in package “MASS”, “glmer.nb” function in package “lme4”, “glmmTMB” function in package “glmmTMB”, and “gam” function in package “mgcv”, are implemented to fit the GLM models for Poisson, NB, ZIP, and ZINB, respectively. The fixed effect estimates and p-values, as well as the values of AIC and BIC from the four models are reported in Table 4.

TABLE 4. The fixed effect estimates, p-values, values of AIC and BIC from the Poisson, NB, ZIP, and ZINB GLM models.
The estimates from different models in Table 4 are fairly close and are all have a small p-value, thus we can conclude that the vegetative growth has significant effect on the number of outages. Based on the ZINB model which has the smallest AIC and BIC, we estimate that as the growth year increases by 1, the expected number of outages increases by exp (0.114) = 1.12 or about 12%.
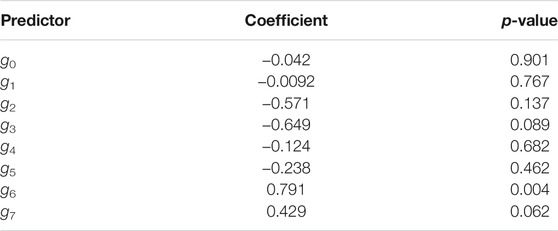
To decide the optimal cycle length, we define several indicator variables gk as follows,
where k = 0, … , 7. For example,
If g7 is a relevant predictor, it would suggest that growth year 7 tends to have more outages than other years. We then fit the ZINB GLM model with the response yij on each gk, individually. The results are shown in Table 5. We observe from Table 5 that both growth years 6 and 7 have more outages than other years. Notice that the conclusions drawn from Section 4.1 and Section 4.2 are consistent, both of which show that there is a significant statistical relationship between the reliability of the electric power distribution system and the number of years of vegetative growth on distribution circuits, and advocate a 6 years cycle as the reasonable vegetation maintenance schedule.
5 Concluding Remarks
This paper investigates the role of vegetative growth on distribution reliability. Some statistical models including Poisson, Negative Binomial, Zero-Inflated models and their variants are utilized. Based on this study, the following conclusions can be drawn.
1) There is a significant statistical relationship between the reliability of the electric power distribution system and the number of years of vegetative growth on distribution circuits.
2) An optimal vegetation maintenance should be scheduled every 6 years.
3) The Negative Binomial model and its modifications are particularly effective at fitting vegetation-caused outages.
The study can advance the understanding on the relationship between vegetative growth and system reliability and should be useful to help the power companies determine an effective vegetation maintenance schedule. However, there are three main limitations of the models and future research could be conducted to obtain more accurate results.
First, we limited the attention on the effect of vegetative growth on power system reliability, other possible factors are not included due to lack of access to related data. As a result, the performance of the analysis may be improved by the inclusion of additional climate and geographical information. The second limitation lies on the fact that the models are fit with data from only normal (storm exclusion) operating conditions, which means that our models might underestimate the benefits of tree pruning. Additional data and study would be needed to learn the impacts of tree maintenance on distribution system reliability under storm conditions. The third limitation is that the analysis is based on data from only one company, consequently the model may not fit the data from another power company, especially if the region where the tree types, temperature, population density, wind regimes, and precipitation patterns is substantially different from Midwestern United States. If more data are available, it will further test the effectiveness of the statistical models, and enhance insights on the importance of vegetative maintenance in improving power system reliability.
Data Availability Statement
The datasets presented in this article are not readily available because company confidential. Requests to access the datasets should be directed tocGFuQHJvd2FuLmVkdQ==.
Author Contributions
JP developed the method, conducted the numerical experiments, and wrote the manuscript.
Conflict of Interest
The author declares that the research was conducted in the absence of any commercial or financial relationships that could be construed as a potential conflict of interest.
Publisher’s Note
All claims expressed in this article are solely those of the authors and do not necessarily represent those of their affiliated organizations, or those of the publisher, the editors and the reviewers. Any product that may be evaluated in this article, or claim that may be made by its manufacturer, is not guaranteed or endorsed by the publisher.
References
1. Radmer, DT, Kuntz, PA, Christie, RD, Venkata, SS, and Fletcher, RH. Predicting vegetation-related failure rates for overhead distribution feeders. IEEE Trans Power Deliv (2002) 17:4. doi:10.1109/tpwrd.2002.804006
2. Lovlace, WR. Vegetation Management on Distribution Line Right-of-Way Are You Getting Top Value for Your Money. Proc Rural Electric Power Conf (1996): B5. doi:10.1109/REPCON.1996.495241
3. Doostan, M, Sohrabi, R, and Chowdhury, B. A data-driven approach for predicting vegetation-related outages in power distribution systems. Int Trans Electr Energ Syst. (2020) 30:1. doi:10.1002/2050-7038.12154
4. Guikema, SD, Davidson, RA, and Liu, H. Statistical models of the effects of tree trimming on power system outages. IEEE Trans Power Deliv (2006) 21:3. doi:10.1109/tpwrd.2005.860238
5. Kuntz, PA, Christie, RD, and Venkata, SS. Optimal vegetation maintenance scheduling of overhead electric power distribution systems. IEEE Trans Power Deliv (2002) 17:4. doi:10.1109/tpwrd.2002.804007
6. Du, J, Park, YT, Theera-Ampornpunt, N, McCullough, JS, and Speedie, SM. The use of count data models in biomedical informatics evaluation research. J Am Med Inform Assoc (2012) 19:39–44. doi:10.1136/amiajnl-2011-000256
7. Cameron, C, and Trivedi, P. Regression Analysis of Count Data. ” 2nd ed. Cambridge: Cambridge University Press (1998).
8. Lambert, D. Zero-inflated Poisson Regression, with an Application to Defects in Manufacturing. Technometrics (1992) 34:1–14. doi:10.2307/1269547
9. Akaike, H. A new look at the statistical model identification. IEEE Trans Automat Contr (1974) 19(6):716–23. doi:10.1109/tac.1974.1100705
10. Schwarz, G. Estimating the dimension of a model. Ann Stat (1978) 6:461–4. doi:10.1214/aos/1176344136
Keywords: power distribution system, vegetation maintenance, vegetationrelated outage, optimal cycle length, statistical modeling
Citation: Pan J (2021) Statistical Modeling for the Effects of Vegetative Growth on Power Distribution System Reliability. Front. Appl. Math. Stat. 7:769355. doi: 10.3389/fams.2021.769355
Received: 01 September 2021; Accepted: 05 October 2021;
Published: 20 October 2021.
Edited by:
Min Wang, University of Texas at San Antonio, United StatesReviewed by:
Liucang Wu, Kunming University of Science and Technology, ChinaFangyuan Zhang, Texas Tech University, United States
Copyright © 2021 Pan. This is an open-access article distributed under the terms of the Creative Commons Attribution License (CC BY). The use, distribution or reproduction in other forums is permitted, provided the original author(s) and the copyright owner(s) are credited and that the original publication in this journal is cited, in accordance with accepted academic practice. No use, distribution or reproduction is permitted which does not comply with these terms.
*Correspondence: Juming Pan, cGFuQHJvd2FuLmVkdQ==
 Juming Pan