- Department of Applied Mathematics and Statistics, Stony Brook University, Stony Brook, NY, United States
We formulate multifractal models for velocity differences and gradients which describe the full range of length scales in turbulent flow, namely: laminar, dissipation, inertial, and stirring ranges. The models subsume existing models of inertial range turbulence. In the localized ranges of length scales in which the turbulence is only partially developed, we propose multifractal scaling laws with scaling exponents modified from their inertial range values. In local regions, even within a fully developed turbulent flow, the turbulence is not isotropic nor scale invariant due to the influence of larger turbulent structures (or their absence). For this reason, turbulence that is not fully developed is an important issue which inertial range study can not address. In the ranges of partially developed turbulence, the flow can be far from universal, so that standard inertial range turbulence scaling models become inapplicable. The model proposed here serves as a replacement. Details of the fitting of the parameters for the τp and ζp models in the dissipation range are discussed. Some of the behavior of ζp for larger p is unexplained. The theories are verified by comparing to high resolution simulation data.
1. Introduction
We develop a conceptual framework for turbulent scaling laws across length scales extending beyond the inertial range. Classically, fully developed turbulence is defined as occurring on length scales in which energy transfer is dominated by inertial forces. Partially developed turbulence is defined as turbulent (i.e., non-laminar) ranges with significant dissipation or significant stirring. Thus, length scales with significant dissipation and stirring forces are included within partially developed turbulence. We propose new models with supporting verification which subsume and extend inertial and non-inertial range models of others. From our models and data analysis, we explain phenomena not previously observed and phenomena previously observed but not explained.
The inertial range is defined as an intermediate range of length scales, l, which are far from the Kolmogorov scale η and integral scale L, i.e., η ≪ l ≪ L. The dissipation range is the range of length scales between the laminar range and the inertial range. The stirring range can be at any length scale, but in common experiments, observations and simulations, stirring is at large scales. The influence of stirring decreases (in a controlled and scaling measurable manner) outside for scales smaller than those actually stirred. This line of investigation, while observed by the authors, has not been developed systematically in the present paper and could be addressed in the future.
Structure functions give a precise meaning to clustering of bursts of turbulent intensity and compound clustering (i.e., clustering of clusters) etc. They measure the dependence of these compound clustering rates on the length scale set by the observational size of the cluster. Two families of structure functions are studied here: one characterizes the powers of the energy dissipation rate, ϵ, and the other characterizes powers of the velocity difference, δu.
The turbulent dissipation rate can be derived from the turbulent velocity gradients as:
where ν is the kinematic viscosity of the fluid and u is the fluctuating velocity, and the summation convention is applied to repeated indices represented the three Cartesian directions by following the definition by [1].
We define the coarse grained, local average of the dissipation rate ϵl as,
where is a volume with a diameter l centered around in 3D. The coarse grained averaging means that ϵl reflects properties occurring on the length scale l.
The structure functions of δlu and ϵl satisfy asymptotic scaling relations as a power of the length scale l. The structure functions and the associated scaling exponents τp and ζp are given by the expectation relations,
The length scale dependent scaling exponents τp and ζp are obtained from logarithmic local slopes, i.e.,
as suggested by [2].
The main thrust of the theory is that turbulent scaling laws remain in effect across all length scale ranges, but with modified length dependent scaling exponents.
A key step in the parameterization of the introduced scaling models is that τp and ζp in Equation (4) are linear in ln l in the dissipation range. Hence, the slopes of τp and ζp are constructed,
which are modeled across all length scales as piecewise constant.
The piecewise constant values of Tp and Zp appear to be a new discovery. These piecewise constant values over the 4 length scale ranges are described as follows:
In the inertial range, we take Tp = 0. We do not observe Tp = 0 from our data in this range, but include this to be consistent with the classical model by [3], denoted SL, in lieu of a more comprehensive theory.
and are constant in the dissipation range, and and are constant in the stirring range for the problems we study. These Tp and Zp values are verified in the JHTDB and the Tp values in the UMA data shown in section 4.1 addressing the laminar region where the eddy length scale is smaller than the Kolmogorov microscale η. In addition, we observe that Tp is linear in p, and Zp is given by an explicit p dependent formula in the dissipation range.
In the dissipation range, the logarithmic dissipation rate is proportional to ln (l). In contrast, the dissipation defined in the Navier-Stokes equation itself occurs in the laminar range at a rate proportional to the length scale l. For p = 2, the laminar energy dissipation rate ϵ includes the classical viscosity ν within its definition. The increase of both τp and ζp for all p in a limit as l approaches η from above leads to negative constant values of Tp and Zp in their respective dissipation ranges.
The key property of constant slopes Tp and Zp is also satisfied in the stirring range and observed in the JHTDB data. In principle, stirring forces can be added in an arbitrary manner at any length scale. Parameterization of the stirring range is not addressed in this paper.
We provide a brief literature review in section 2. The numerical verification data from JHTDB and UMA are described in section 3 as well as the methods used for data analysis. The scaling law results, which are the technical core of the paper, are presented in sections 4, 6. The extended and refined scaling analytical methods are discussed in section 5. A comment on the asymptotics of the viscous limit can be found in section 7. Conclusions are summarized in section 8.
2. Inertial Range Prior Results
Kolmogorov [4], denoted K41, postulated universal laws to govern the statistics on all such length scales in the inertial range in which the flow is statistically self similar. Dimensional analysis in K41, based on the self similarity hypothesis, led to the −5/3 scaling law. However, because the energy dissipation for turbulent flows is intermittent, this model has been refined in various ways over the years to yield a multifractal scaling law. Summarized in [5], the K41 exponent ζp is modified to capture the compound clustering of turbulent structure using a multifractal analysis. Kolmogorov [6] refined his similarity hypothesis, denoted K62, added the influence of the large flow structure and included the influence of the intermittency. The refined similarity hypothesis in [6] for the classical inertial range links the scaling exponent ζp of the longitudinal velocity structure and the scaling exponent τp of the energy dissipation rate as
where , or equivalently
The log-normal model from SL defines a theoretical model for the PDF of the coarse-grained energy dissipation in the inertial range. SL studied the quantity defined as the ratio:
where p can be any non-negative integer. The and are related to the mean fluctuation structure and the filamentary structure. The scaling law for p → ∞ is . As p → ∞, the definition of τp stating that,
or . The codimension C is evaluated as C = 3 − 1 = 2 based on the assumption that the elementary filamentary structures have dimension 1. The expectation has an l dependence which is not a pure exponential, but a mixture of exponentials, i.e., the scaling exponents for are defined as a weighted average of exponentials.
From the assumption of the interaction between structures of different order, SL proposed the following relation between structures of adjacent order:
Based on Equations (9, 11), SL derives a two step recursion for τp. This recursion relation implies that , where f(∞) = 0 is assumed. The equation for f(p) has the solution f(p) = αβp and with the boundary conditions τ0 = τ1 = 0, the solution becomes
Substituting Equation (12) into the relation shown in (8) yields
Novikov [7] suggested that the −2/3 on the RHS of Equation (10) should be replaced by −1 based on the theory of infinitely divisible distributions applied to the scaling of the locally averaged energy dissipation rate ϵl. Chen and Cao [8], denoted CC, accepted Novikov's suggestions and derived the formula:
which uses the classical value τ2 ≈ −0.22, which is derived from simulations, observations, experiments, and theory (SL) all in approximate agreement.
Kolmogorov proposed that ζ3 = 1 for incompressible, isotropic and homogeneous turbulence. Frick et al. [9] showed that in the case of non-homogeneous shell models with ζ3 ≠ 1, the scaling of velocity structure functions in incompressible turbulence from SL still holds as .
Boldyrev et al. [10] predicted a new scaling law for the scaling exponent ζp of velocity structure functions as
in supersonic turbulence for star formation based on a Kolmogorov-Burgers model. The same behavior is observed by [11] in incompressible MHD.
The SL model has generated a considerable interest in the hierarchical nature of turbulence. Experiments and simulations have been conducted to evaluate the velocity and energy dissipation structures. Chavarria et al. [12–14] demonstrated experimental variables for the hierarchical structure assumption for the function ζp in Equation (13). Experimental studies on a turbulent pipe flow and a turbulent mixing layer by [15] verified the SL hierarchical symmetry. Cao et al. [16] showed agreement between the SL scaling exponents and high-resolution direct numerical simulations (DNS) of 3D Navier-Stokes turbulence.
Chevillard et al. [17] clearly frames the problem we address as the major theme of our paper. Their model and ours study the ζp and τp exponents in the turbulent dissipative regime. Their predictions are limited to the structure of order 4 or less. The validation results are complicated by differences in the experimental data, but each of their plots shows agreement with some of the data. Briefly, our results go beyond this work in several respects. We model the scaling exponent ζp and τp scaling asymptotics, each with two parameters, giving both the scaling exponent and the multiplying coefficient. We set these (4 in total, p dependent) parameters for values up to p = 10 on ζp and up to p = 30 on τp, with consistent validation against two independent sets of simulation data.
We relate our modeling to a variety of other and more recent studies of the setting of parameters for the She Levegue model. Traditionally, stirring is introduced at the large length scales and becomes less significant at the smaller ones as has been studied [18–20] previously. We also observed the same effect, and in our study of the JHTDB, found scaling laws similar to that reported in the dissipative regime, as is suggested in the drawing of Figures 2–4.
3. Methods
3.1. JHTDB Data
We analyze the DNS data of the forced isotropic turbulence simulation from the Johns Hopkins Turbulence Database (JHTDB) performed by [21] and [22]. The simulated flow has an integral scale Reynolds number Re = 23,298 and a Taylor scale Reynolds number Reλ = 433. The JHTDB data are generated by direct numerical simulation of forced isotropic turbulence in a cubic domain with length L = 2π and periodic boundary conditions in each direction. The simulation has a resolution of 10243 of cells. Energy is injected to maintain a constant value for the total energy. The JHTDB data are collected after the simulation has reached a statistical stationary state. The data are posted on the website http://turbulence.pha.jhu.edu The JHTDB data focus on analysis of the inertial range. Because of this emphasis, its coverage of the dissipation and stirring ranges is limited. The ratio of the Kolmogorov length scale to the computational grid space is η/Δx = 0.46. Thus, the JHTDB data do not fully resolve the Kolmogorov length scale η. With these data, we confirm many aspects of our scaling law model. We anticipate the need for additional simulation data such as the 40963 cell data from the JHTDB in further analysis of laminar and dissipation ranges.
3.2. JHTDB Data Analysis
The velocity differences have a tensorial dependence on the velocity component directions and the differencing directions. The longitudinal direction is more convenient for experiments, and many experimental prior studies focused on the longitudinal velocity increment based on Taylor's hypothesis. Details are described by [23]. We define the longitudinal velocity increment as δlu(x, y, z, t) = u(x + l, y, z, t) − u(x, y, z, t), where u is the x component of velocity.
The coarse-graining length scale, l, in the structure function definition, Equation (2) is implemented by a 3D average over distances of a scale l, and ϵ is given at discrete locations in space. From previous literature, the averaging volume is taken to be a sphere or a cube. The definition of l as radius or diameter is not consistent in the literature. In this paper, we distinguish between spherical and cubic average with a diameter l. The dominant effects on the averaging element, sphere or cube, come from the most extreme points on the elements, i.e., the boundary of the sphere or corners of the cube, and always with these extreme points at distance l/2 from the center.
In Figure 1, we observe an approximate but not exact agreement between the cubic and spherical averages. The cubic average, producing a consistent but less noisy range, is used for the local average of the energy dissipation rate in this paper.
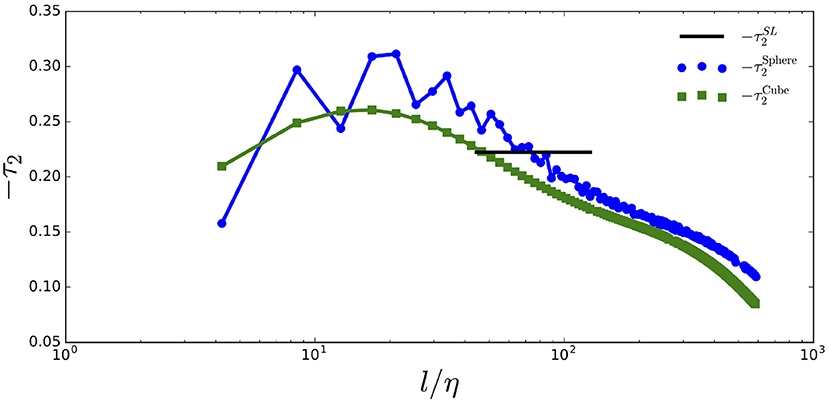
Figure 1. Comparison of the cubic to the spherical average with a diameter l for ϵl in the computation of −τ2. The horizontal solid line is the constant local exponent value from SL and is located at the inertial range that is determined by ζ2 from JHTDB.
A further observation is that τ2 in the inertial range is not consistent with prevailing theory i.e., τ2 is not constant while ζ2 is constant in this range. Figure 1 shows the theoretical value for the inertial range as a horizontal line. The local slope measurements are points connected by line segments. While an average across a large range is consistent with SL, no universal constant local slope is found that is consistent with . For this reason, we regard the τp theory from SL more exactly as a theory for ζp rather than a theory for τp.
3.3. UMA Data Analysis
The UMA data from [24] are based on a DNS of isotropic homogeneous turbulence from the University of Massachusetts Amherst (UMA). This simulation uses a third-order Adams-Bashforth and pseudo-spectral method. The simulation uses a periodic cube with edge length 2π and a 20483 numerical grid. The simulation parameters are η/Δx = 3.04 and ηkmax = 6.4. The flow has an integral scale Reynolds number Re = 3,426 and a Taylor scale Reynolds number Reλ = 151. The inertial range turbulence is fully developed and the data also describe with a complete dissipation range with length scales smaller than the Kolmogorov length scale. There are sufficient data to provide verification in the laminar range. We digitized the local slopes −τp from the published UMA data for p = 2, 3, 4 by [24].
The UMA locally averaged dissipation rate ϵl data are defined as a spherical average with a diameter l. An interpolation consistent with the numerical method is used to solve the governing equations and allows the elimination of the noise.
As noted in Figure 1, the spherical average leads to a higher −τp value than the cubic average. A vertical shift of 0.04 for −τ2 of the cubic averaged JHTDB data is needed to reach the spherical averaged UMA maximum for comparison. In addition, a horizontal shift of the normalized length scale l/η is needed to compensate for the JHTDB under resolution of the Kolmogorov scale.
3.4. Schematic Model Formulation
Figure 2 summarizes our major ideas. The laminar, dissipation, inertial and stirring ranges are labeled. This figure displays the slopes, Tp, as linear segments in the dissipation and stirring ranges. In Figure 1, −τ2 does not show a clear flat range to indicate the classical inertial range. The flat segment shown in the schematic representation is taken from the SL theory. We comment on its absence from the JHTDB and UMA data in section 4.3.
Figures 3, 4 show that as p increases, so do the values for −τp and ζp. Laminar flow occurs at a nearly zero and is shown as a nearly horizontal line on the semi-log plots in Figures 2–4. The linearity of τp in the dissipation range implies the equation
where Tp represents the constant slope observed in τp and bp is the τp value at the Kolmogorov length scale (η).
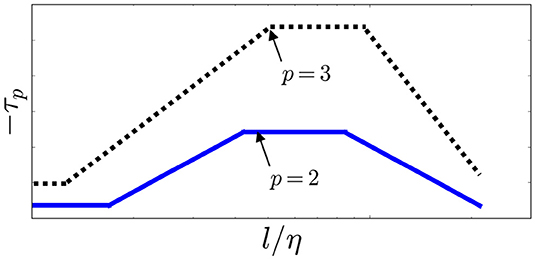
Figure 3. Schematic representation of the local slope, −τp vs. log length scale with the p-dependence shown by the arrow.
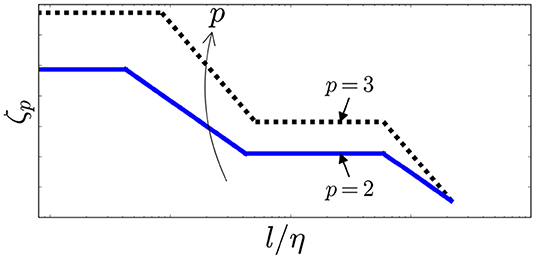
Figure 4. Schematic representation of the local slope, ζp vs. log length scale with the p-dependence shown by the arrow.
Similarly, in the dissipation range, we define
where Zp represents the constant slope observed in ζp and ap = ζp at the Kolmogorov length scale (η).
A transition point in the schematic representation occurs at the length scale where the slope of τp or ζp changes. The transition from turbulent dissipation to laminar dissipation occurs approximately at l = η. The detailed locations of the transition are dependent on p and are different for ζp and τp. The transition actually occurs gradually rather than discontinuously as we see in Figure 5. However, in our modeling, Tp and Zp are piecewise constant in ln l as an approximation to an exact theory. All other transitions are determined similarly.
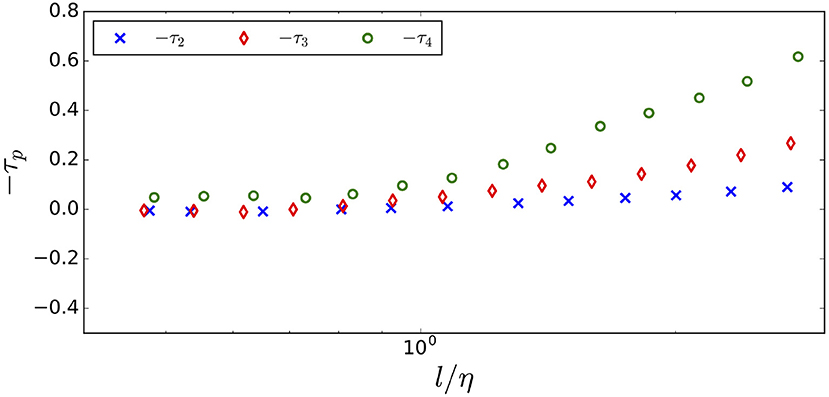
Figure 5. The digitized −τp values from the UMA data enlarged for the laminar range, for p = 2, 3, 4. We observe constant −τp values with weak p dependence for smaller lengths.
In this modeling, ζp or τp for each p defines its own inertial range. The SL model holds within the inertial range defined by ζp.
4. Scaling Laws for the Energy Dissipation Rate
4.1. The Laminar Range
In the laminar region, velocity fluctuation is zero, so dissipation is no longer at a power law in the exponent and operates on a linear scale as normal NS small amplitude. The digitized UMA data of −τp for p = 2, 3, 4 in the laminar range is shown in Figure 5. −τ2 and −τ3 are close to zero here with, perhaps, a small p dependence shown in the τ4 data. The transition is observed to be gradual in the simulation data analyzed from an exponential point of view. Thus, we assume that the τp values are approximately zero in the laminar range in which l/η < 1.
4.2. The p-Dependent Linear Slopes in the Dissipation Range
The UMA data of Figure 6 and the JHTDB of Figure 7 show the linear segment of τp in the dissipation range. With limited data in small length scales but including higher p values (up to p = 10), we reach the same conclusion from Figure 8 for the JHTDB data. The solid lines are modeled by the CC2 model and will be explained in section 5. The linear slopes are determined by least squares.
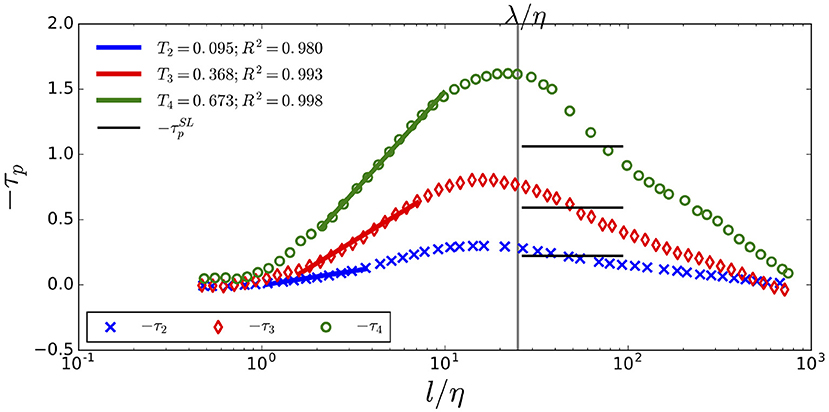
Figure 6. The digitized −τp UMA data. The horizontal solid lines are the constant local exponent −τp values from SL with the inertial range determined by ζ2 from JHTDB. The vertical line marks the Taylor micro scale.
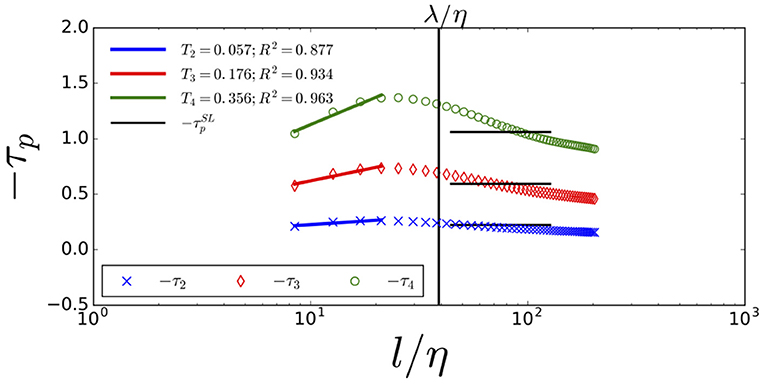
Figure 7. The local slopes −τ2, −τ3, −τ4 from the JHTDB data are linear in ln(l/η) in the dissipative ranges, with constant slopes Tp. An R2 value closes to 1 indicates the goodness of the fit.
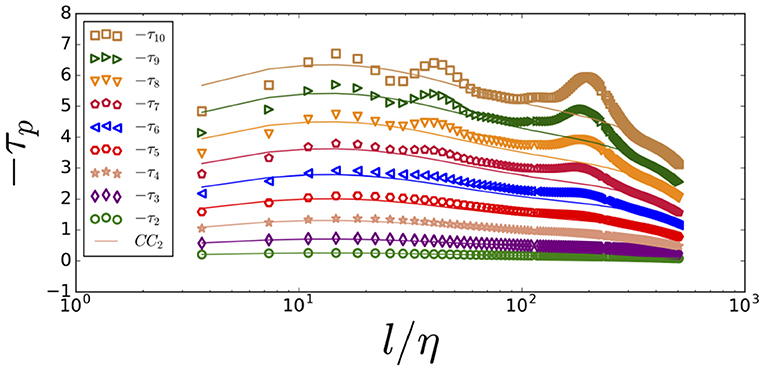
Figure 8. The local slope τp for all 2 ≤ p ≤ 10 with p increasing from the bottom to the top. The JHTDB data are shown in scatter points and the modeled −τp values are in solid lines from the CC2 model explained in section 5.
Recall that τp = Tp ln (l/η) + bp. In Figure 9, we plot the Tp for p up to 30 in the dissipation range. The slopes, Tp, are linear in p, with a T2 data dependence, i.e.,
We find that dTp/dp = −0.323 from the JHTDB data.
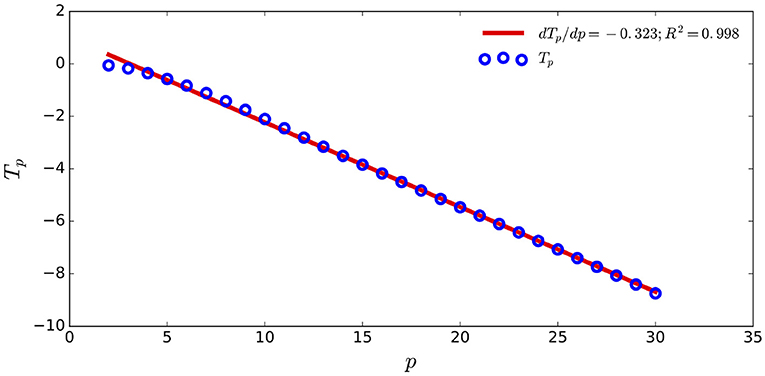
Figure 9. The Tp in the dissipative range is linear for p in the range 2 ≤ p ≤ 30 for the JHTDB data.
4.3. Full τp Parameterization
We have developed a model that captures all of the length scales from the laminar range up to the small length scale end of inertial range for the energy dissipation rate Based on Equation (18) and the assumption of τp ≈ 0 in the laminar range. A model for τp in the dissipation range is
which can be extended for length l up to the Taylor micro-scale λ.
In the JHTDB and UMA data, there is no flat inertial range observed for τp and the τp peak occurs approximately at the Taylor micro-scale λ. The peak could be an isolated point represents a transition to the stirring range. Alternatively, there maybe a small inertial range and a large transition range, in which case, it is possible that with higher Reynolds number, a true (flat) inertial range for τp may appear.
5. The Extended and Refined CC Models for the Scaling Exponent of the Energy Dissipation Rate
The CC model defined by [8] shown in Equation (14) has a dependence on inertial constant value from SL. We extend the model beyond the inertial range, where a constant is no longer an accurate value for length scale dependent τ2. To calculate τp for p > 2, we substitute the τ2 data that are measured across all length scales into Equation (14). The extended model is denoted as the CC2 model. Figure 10 shows this model for τ3 (solid line) in comparison to the observed τ3 value (data points). The same comparison for p ≤ 10 is shown in Figure 8. The data and model values agree for small p ≤ 5, but diverge at higher p values. We propose a modification of CC2, which we denote as CCq model. Instead of taking a measured τ2, as in our extended CC2 model, we substitute the measured τq data that is available across all measurable length scales, and solve numerically for shown as below:
Then, the calculated can be substituted back to Equation (14) to calculate τp for any p. From this point, all τp values can be modeled as a function of p and the measured τq using the CCq model.
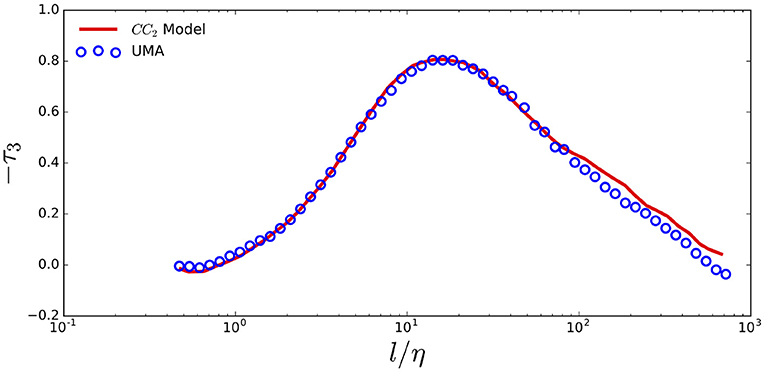
Figure 10. The extended CC2 model for −τ3 shows agreement with the UMA data across all measurable length scales.
Figure 11 shows the linear fit T2 of τ2 that is calculated from the CCq model using measured τq values in the dissipation range, for q = 2, 3, …, ∞. This sequence of T2 values are fitted by:
for any q value. T2 decreases and converges asymptomatically to 0.001 as q → ∞. Hence, the CC∞ model is defined as .
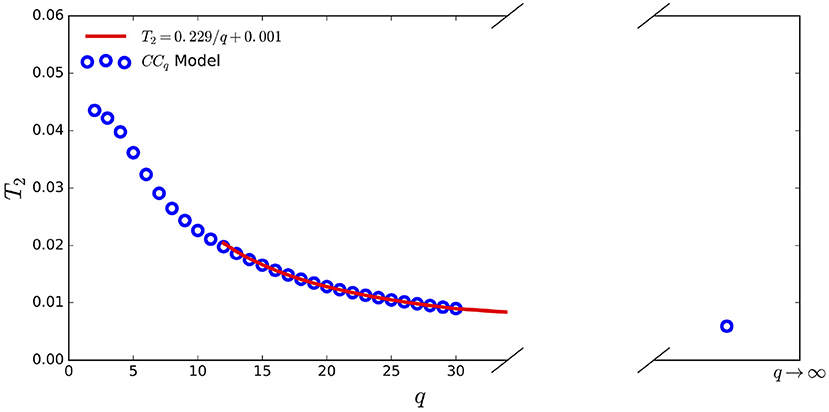
Figure 11. The linear slopes T2 of τ2 calculated from the CCq model for q from 2 to 30 using JHTDB is plotted vs. q in the dissipative range.
6. Scaling Laws for the Longitudinal Velocity Increment Structure Functions
6.1. The p-Dependent Linear Slopes in the Dissipation Range
The JHTDB data for the slopes Zp of the longitudinal velocity increment vs. ln (l/η) for p = 2, 3, 6 are shown in Figure 12. We see that ζp is consistent with the horizontal solid lines of values obtained from Equation (13) in the inertial range. In addition, ζp is linear in ln (l/η) in the dissipation range. Summary data for all p up to 10 are given in Figure 13 with linear extrapolation from the dissipation range to the Kolmogorov scale for the JHTDB data.
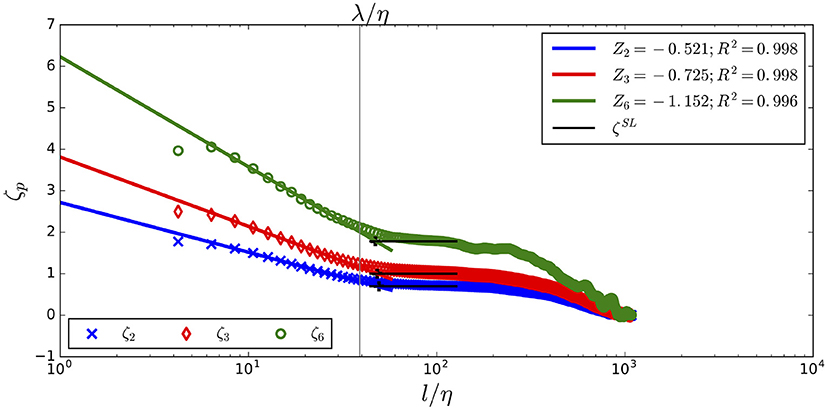
Figure 12. ζ2, ζ3, ζ6 are linear in the dissipative ranges with the solid line representing the linear fit of ζp in the dissipation range, extrapolated to the Kolmogorov scale for the JHTDB data. The horizontal lines are the corresponding SL model values and the vertical line marks the Taylor micro-scale. The bold “+” near the Taylor scale values λ/η are the transition points from the dissipation ranges to the inertial ranges.
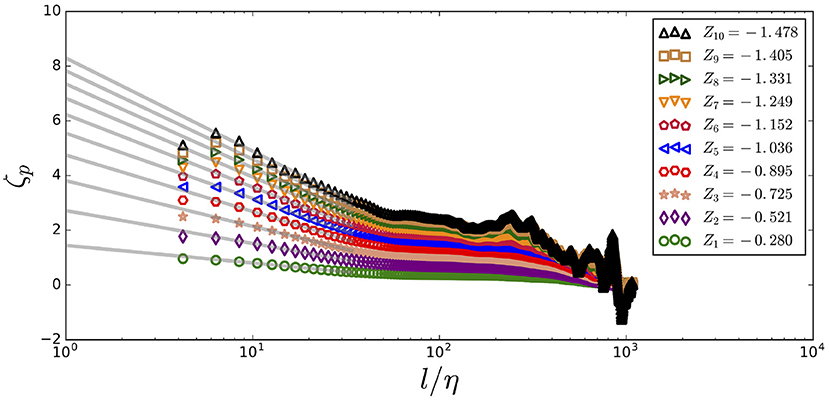
Figure 13. The JHTDB defined ζp with p increasing from 1 to 10 from the bottom to the top across all available length scales. The plot shows scatter points with solid lines representing the linear fit of ζp in the dissipation range extrapolated to the Kolmogorov scale.
Recall that in our linear model for longitudinal velocity increment in the dissipation range. This equation gives a new relation for the linear slope ratio Zp/Z3 and the ratio ap/a3 as:
Based on the model representation (15) and on Equation (22), we develop a model for the longitudinal velocity structure in the dissipation range as:
This law is valid for the JHTDB data up to p = 10 as shown in Figure 14.
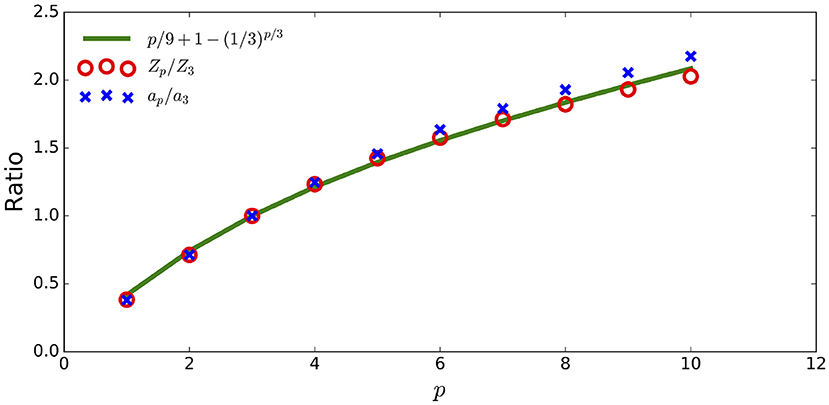
Figure 14. The new ratio model agrees with the ratios of Zp/Z3 and of ap/a3 from JHTDB data in the dissipation range.
Given Z3, Zp can be modeled in the dissipation range by Equation (6.1). Note ζ15 is not linear in ln (l/η) in the dissipation range. This is typical for p > 10, so we do not include a model for ζp for larger p. The mismatch between the data and model for larger p raises the question whether the model needs to be improved, the numerical methods are unstable for high moments, or the data need improvement.
6.2. Full ζp Parameterization
We have developed a model that captures the longitudinal velocity increments for all of the small length scales up to and including the inertial range. The ζp parameterization starts with ζp = ap at the Kolmogorov length scale (l/η = 1) as shown in Equation (17). Based on Equation (6.1), a model for ζp that captures the linear segment in the dissipative range for each p with input Z3 and a3 value dependence is defined as:
We have parameterized ζp for longitudinal velocity increments at the dissipation range with a finite number of parameters for p up to 10. It is p dependent, with the variables Z3 and a3 calculated from ζ3.
The dissipation range begins at the Kolmogorov length scale and ends at the intersection with the theoretical value from SL, which marks the start of the inertial range. This transition occurs approximately at the Taylor microscale [19]. The transition point can be found by
We solve this equation for length scale l with the known variable Z3 and a3 from ζ3 data along with the known η. The p dependent transition points of ζp for p = 2, 3, 6 are shown as the thick plus symbols in Figure 12.
7. The SL Conjecture for the Laminar Limit
SL discusses the large p asymptotes of in developing parameters for their τp inertial range methodology. They predicted dominance by vortices in this regime. We come to the same conclusion in the large p asymptotes more directly through an analysis of ζp, which reflects the intensity of the vortical structures. We find in Figure 13 and Equation (24) that ζp is increasing in p as the length l/η moves toward the dissipation range.
We interpret the length scale l/η limit in terms of Taylor-Green vortices continued past the instability point. Assuming the CC model remains applicable in this range, Figure 11 analyzes the CC∞ model and shows a non-zero residual value for T2 and similarly for all Tp. Line vortices do not dissipate energy and are described by the vanishing τp for all p. The presence of non-zero Tp for all p indicates that the line vortices occur in an unstable state, as occurs in a Taylor-Green vortex, continued past its singular value.
8. Conclusions
We have extended scaling laws for longitudinal velocity increments and energy dissipation rate structure functions from the inertial range to all length scales by modifying their exponential scaling exponents. We verify the complete parameterization models for τp and ζp in the dissipation range, i.e., from the Kolmogorov scale to the Taylor scale, limited to p ≤ 10 for ζp. Our major model feature, linearity of the log scale dissipation processes, is verified through comparison to the JHTDB and UMA data.
In local regions, even within a fully developed turbulent flow, the turbulence is not isotropic nor scale invariant due to the influence of larger turbulent structures (or their absence). For this reason, turbulence that is not fully developed is an important issue which the present analysis addresses.
In Kolmogorov theory and in advanced multifractal scaling law theories, ζ2 has a range in which it is a flat line of constant value in log length scale, as observed. It has been noted that τp is not constant in the inertial range that is defined by ζ2. Our data analysis and data of others show no clearly defined inertial range for the energy dissipation rate. The τp peak is p dependent, but occurs approximately at the Taylor micro-scale. The transition from the dissipation range to the inertial range takes place near the Taylor micro-scale.
We find that the Chen and Cao model for τp can be extended across all length scales for small p moments. Our refined CCq model describes the relation between any τp and τq exponents. The CC∞ model complements the SL analysis of vortices in the l/η → 1 limit are given.
Data Availability Statement
Publicly available datasets were analyzed in this study. This data can be found here: http://turbulence.pha.jhu.edu/.
Author Contributions
AH took the lead in the numerical analysis of the DNS data and in some of the discovery of the analysis algorithms. RK took the lead in designing the numerical algorithms had a major role in the interpolation of the data. JG lead in the overall planning and formulation of the study outline. All authors contributed to all aspects of the study, numerics, analysis, and conceptual modeling.
Conflict of Interest
The authors declare that the research was conducted in the absence of any commercial or financial relationships that could be construed as a potential conflict of interest.
Publisher's Note
All claims expressed in this article are solely those of the authors and do not necessarily represent those of their affiliated organizations, or those of the publisher, the editors and the reviewers. Any product that may be evaluated in this article, or claim that may be made by its manufacturer, is not guaranteed or endorsed by the publisher.
References
2. Miller LP, Dimotakis EP. Stochastic geometric properties of scalar interfaces in turbulent jets. Phys Fluids A Fluid Dyn. (1991) 3:168–77.
3. She ZS, Leveque E. Universal scaling laws in fully developed turbulence. Phys Rev Lett. (1994) 72:336–9.
4. Kolmogorov AN. Local structure of turbulence in incompressible viscous fluid for very large Reynolds number. Doklady Akad Nauk SSSR. (1941) 30:299–3031.
5. Frisch U. Turbulence: The Legacy of A. N. Kolmogorov. Cambridge: Cambridge Univeristy Press (1996).
6. Kolmogorov AN. A refinement of previous hypotheses concerning the local structure of turbulence in a viscous incompressible fluid at high Reynolds number. J Fluid Mech. (1962) 13:82–5.
9. Frick P, Dubrulle B, Babiano A. Scaling properties of a class of shell models. Phys Rev E. (1995) 51:5582–93.
10. Boldyrev S, Nordlund A, Padoan P. Scaling relations of supersonic turbulence in star-forming molecular clouds. Astrophys J. (2002) 573:678–84. doi: 10.1086/340758
11. Müller WC, Biskamp D. Scaling properties of three-dimensional magnetohydrodynamic turbulence. Phys Rev Lett. (2000) 84:475–8. doi: 10.1103/PhysRevLett.84.475
12. Chavarria G, Baudet C, Benzi R, Ciliberto S. Hierarchy of the velocity structure functions in fully developed turbulence. J Phys. (1995) 5:485–90.
13. Chavarria GR, Baudet C, Ciliberto S. Hierarchy of the energy dissipation moments in fully developed turbulence. Phys Rev Lett. (1995) 74:1986–9.
14. Chavarria G, Baudet C, Benzi R, Ciliberto S. Scaling laws and dissipation scale of a passive scalar in fully developed turbulence. Phys D Nonlinear Phenomena. (1996)99:369–80.
15. Zou Z, Zhu Y, Zhou M, She ZS. Hierarchical structures in a turbulent pipe flow. Fluid Dyn Res. (2003) 33:493–508. doi: 10.1016/j.fluiddyn.2003.07.002
16. Cao N, Chen S, She ZS. Scalings and relative scalings in the Navier-Stokes turbulence. Phys Rev Lett. (1996) 76:3711–4.
17. Chevillard L, Castaing B, Leveque E, Arneodo A. Unified multifractal description of velocity increments statistics in turbulence: intermittency and skewness. Phys D Nonlinear Phenomena. (2006) 218:77–82. doi: 10.1016/j.physd.2006.04.011
18. Lundgren TS. Linearly Forced Isotropic Turbulence. Center for Turbulence Research Annual (2003).
19. Obligado M, Vassilicos J. The non-equilibrium part of the inertial range in decaying homogeneous turbulence. Europhys Lett. (2019) 127:64004. doi: 10.1209/0295-5075/127/64004
20. Meldi M, Sagaut P. Turbulence in a box: quantification of large-scale resolution effects in isotropic turbulence free decay. J Fluid Mech. (2017) 818:697–715. doi: 10.1017/jfm.2017.158
21. Li Y, Perlman E, Wan M, Yang Y, Burns R, Meneveau C, et al. A public turbulence database cluster and applications to study Lagrangian evolution of velocity increments in turbulence. J Turbulence. (2008) 9:1–29. doi: 10.1080/14685240802376389
22. Perlman E, Burns R, Li Y, Meneveau C. Data exploration of turbulence simulations using a database cluster. In: SC '07 Proceedings of the 2007 ACM/IEEE Conference on Supercomputing. Seattle, WA (2007).
23. He G, Doolen GD, Chen S. Calculations of longitudinal and transverse velocity structure functions using a vortex model of isotropic turbulence. Phys Fluids. (1999) 11:3743–8.
Keywords: turbulence, multifractals, scaling law, structure functions, intermittency
Citation: Hsu A, Kaufman R and Glimm J (2022) Scaling Laws for Partially Developed Turbulence. Front. Appl. Math. Stat. 7:812330. doi: 10.3389/fams.2021.812330
Received: 10 November 2021; Accepted: 27 December 2021;
Published: 20 January 2022.
Edited by:
Snezhana I. Abarzhi, University of Western Australia, AustraliaReviewed by:
Lawrence Forbes, University of Tasmania, AustraliaPrabir Daripa, Texas A&M University, United States
Copyright © 2022 Hsu, Kaufman and Glimm. This is an open-access article distributed under the terms of the Creative Commons Attribution License (CC BY). The use, distribution or reproduction in other forums is permitted, provided the original author(s) and the copyright owner(s) are credited and that the original publication in this journal is cited, in accordance with accepted academic practice. No use, distribution or reproduction is permitted which does not comply with these terms.
*Correspondence: Abigail Hsu, YWJpZ2FpbC5oc3UyMDA5QGdtYWlsLmNvbQ==
 Abigail Hsu
 Ryan Kaufman