 Ali Murad Syed
- Department of Economics and Finance, College of Business Administration, University of Bahrain, Zallaq, Bahrain
COVID-19 has rapidly evolved into a global pandemic and has strongly impacted financial markets of the world, including the Gulf Cooperation Council (GCC) region. Since the outbreak is unprecedented, there is a need to analyze the effects of the disease on volatility spillovers between equity and bond markets. We empirically investigated the impact of the COVID-19 pandemic on the financial equity and debt markets in the GCC region. We used the TVP-VAR dynamic connectedness approach to measure risk transmission in the GCC market. This study investigated the time-varying behavior of GCC equity and conventional and Islamic debt markets using data from 1 January 2019 to 30 August 2021. The results were also validated by performing a DCC-GARCH analysis to check the shock and spillovers among the GCC markets. We found the persistent shock transmitter roles of equity markets to bond and Sukuk markets in the GCC region, and the total dynamic connectedness increased during the first wave of the COVID-19 pandemic. Overall, the significant level of interconnectedness exists within the GCC markets.
Introduction
The COVID-19 pandemic started in late 2019 in China and then spread globally. After its spread in a number of countries, the World Health Organization (WHO) declared it a global pandemic in March 2020. According to studies, coronavirus disease 2019 (COVID-19) has become the fifth documented pandemic since the flu pandemic in 1918. The outbreak initiated in December 2019 from Hubei Province, and according to the AJMC [1], it is categorized as one of the most infectious viruses to have ensued in recent times. COVID-19 is attributed to the SARS-CoV-2, a family of SARS-CoV-1 that almost caused a pandemic in 2002.
Furthermore, in early 2020, the pandemic spread rapidly throughout the world, which led to economic problems all over the world. COVID-19 has crippled the existence of many, causing numerous losses of lives and livelihoods. As a result of these economic and mortality issues, a number of research studies were conducted to find the economic impact of the crisis, especially in areas of high recorded cases.
With the surge in COVID-19 cases, governments of different countries were forced to implement movement restrictions to control the spread of the disease. These restrictions/lockdowns resulted in adverse consequences in terms of economies. Hence, governments were in the dilemma of choosing between public health concerns and the recovery of economies [2–4]. Furthermore, governments were also not sure about the effectiveness of these policy measures. As a result, some countries eased these restrictions to mitigate the adverse impacts on their economies.
COVID-19 also affected financial markets (equity, debt, commodities, and cryptocurrencies) since it was declared a global pandemic [5–9]. These health-based concerns shattered investors' conferences on financial markets. Investors in equity, debt, and commodity markets faced significant losses due to negative growth projections as investors base their financial decisions on news, economic news, market announcements, and sentiment, which showed higher volatilities [10–13].
The impact of the COVID-19 pandemic first appeared in Chinese stock markets when fears of the spread of COVID-19 to different countries increased. Various Chinese stock market indices exhibited a decreasing trend during the initial phase of the COVID-19 pandemic [14–16]. The fears of the spread of the pandemic further reduced the Dow Jones Industrial Average index, and S&P 500 index plunged rapidly in March 2020. The FTSE 100 Index of the European market also experienced a sharp fall during the initial wave of COVID-19 [17]. Overall, major equity market indices lost 30–42% market valuation during the COVID-19 pandemic [18].
Surprisingly, the bond market was also adversely affected by the COVID-19 pandemic. For instance, the 10-year sovereign government, which is a risk-free asset, was also affected by the COVID-19 pandemic. For example, U.S., U.K, German, and French bonds plunged from 5.50 to 6.5%. The existing studies show that the COVID-19 pandemic increased sovereign bond spreads and sovereign risk premiums and increased interest rates [19–21]. The initial adverse impacts on bond markets were mitigated by the timely intervention by the U.S. Federal Reserve [22–24]. Overall, the bond market appeared relatively stable, while the stock market experienced high-level volatility. However, the advent of the second decade of the 21st century saw the equity market returns to dominance. Notwithstanding, the bond markets kept producing substantial returns. Although the U.S. Federal Reserve (Fed) reduced special interest rates in 2019, the U.S. bond market still had impressive returns.
As the Gulf Cooperation Council (GCC) region faced a threat to the economy due to the low oil price shocks, governments and regulators in these countries aimed to protect the lives of their people and stabilize the economy from adverse shocks due to the COVID-19 pandemic [4, 25–27].
However, the literature on the GCC debt market is scarce, which warrants further investigation during the COVID-19 pandemic to guide the investment managers and governments of GCC countries. Therefore, to contribute to this stream of literature, this study investigates the volatility transmission behavior of equity and debt markets of the GCC region by using the TVP-VAR model.
The study findings reveal the net transmitter role of the GCC equity markets toward the bond and Sukuk markets. Overall, the S&P equity markets of GCC countries and at the regional level are persistent transmitters of shocks to debt markets. These results support the equity market investment managers to hedge their risks during the COVID-19 pandemic.
The remainder of this article is organized as follows: Section 2 provides a brief literature review on the impact of COVID-19 on stock and debt markets in the GCC region; section 3 explains the dataset used in this study and presents the methodology employed; section 4 discusses empirical results; and section 5 concludes the study.
Literature review
Several studies have discovered that the health of a population, as measured by birth and mortality rates, is directly connected to economic growth [28]. According to McKibbin and Fernando [29], there are numerous conduits through which disease outbreaks impact the economy. Some are seen through direct and indirect economic consequences, such as high inflation rates, prices of commodities, GDP growth, and other macroeconomic factors. At the same time, different channels may be classified as having positive or negative impacts. However, these factors have been the subject of study, entailing the use of several modeling techniques to assess the effect of infectious outbreaks.
The COVID-19 pandemic also adversely affected global supply chains, which further slowed economic activities as most of the countries rely on inputs of China. As a result, global financial markets have plunged. The COVID-19 crisis is unique and cannot be compared with the global financial crisis as lockdowns and movement restrictions are not present in previous financial crises. Today's world is also integrated, and spillover effects arise from one market affect the other. For instance, equity and bond markets are closely integrated, and spillover risk also affects the bond markets [30]. The COVID-19 pandemic can potentially disturb the economy if proper measures for mitigation of its adverse impacts are not implemented [31]. COVID-19 can reduce 0.5% of global GDP if not adequately managed [32].
The adverse impacts of COVID-19 are also reflected in the poor financial performance of stock markets. There was a high level of uncertainty, volatility, and danger experienced in financial markets from February 2020 to 23 March 2020. The equity markets witnessed a drastic decline, losing about 30% of their value within a few weeks, and the sell-off speed was faster than that during 2008/2009 Global Financial Crisis (GFC) [18]. The COVID-19 pandemic wreaked havoc on financial institutions. As the coronavirus kept spreading throughout the globe, borrowers and businesses began to experience job losses, reduced sales, and decreased profitability. The economic situations that emerged from the COVID-19 pandemic were unanticipated, thus prompting a swift response from the Federal Reserve.
The loss in stock markets requires policy interventions from regulators and governments to safeguard the financial system and reduce excessive volatilities [33]. Most of the capital is invested in stock markets, and market returns are highly influenced by macroeconomic news and investors sentiments [34–36]. Investors can predict stock returns by considering macroeconomic factors, but this task becomes problematic when a health-based crisis affect financial markets.
Investors base their investment decisions by considering the volatility of stock markets as greater volatility denotes an increase in the risks, and low volatility denotes stable prices, which may increase the returns of portfolio managers [37, 38]. Thus, investors anticipate a bearish market in the presence of higher volatility. For instance, a bearish market was present during the COVID-19 pandemic when most of the markets plunged.
The existing studies [39] highlighted the negative impact of the COVID-19 pandemic on stock markets. Baker et al. [39] highlighted various reasons for negative returns of the U.S. stock market: restrictions, social distancing, and the lack of economic activities. Onali [40] investigated the impact of COVID-19 on the U.S. stock market returns using the GARCH model and found that stock market returns are not affected by COVID-19 cases and deaths. Furthermore, Yousfi et al. [41] studied the impact of COVID-19 on returns and volatility of U.S. and Chinese stock markets during the first and second waves, and they found contagion effects between these markets during the initial wave of the COVID-19 pandemic. Corbet et al. [42] also found the contagion effects of firms named corona in Chinese stock markets by using the DCC-GARCH method. Zhang et al. [43] also found that the spread of COVID-19 is associated with an increase in the risk of global financial markets, which causes significant losses for investors. Narayan et al. [44] tested the effect of government response regarding COVID-19 in G7 countries on stock returns. They found the positive impact of lockdowns, economic stimulus packages, and travel restrictions. Phan and Narayan [45] found that unexpected news regarding COVID-19 may lead to over-reaction of investors, and the market will recover with the availability of information.
Furthermore, some studies highlighted the impact of the COVID-19 pandemic on the uncertainty in economic policies. For example, Ashraf [46] used the COVID-19 cases and death to investigate the response of the stock market to the COVID-19 pandemic. Overall, their findings suggest that the stock markets responded negatively to the increase in new cases.
Some studies [47–49] also highlighted the adverse impacts of COVID-19 on stock market volatility using the wavelet coherence approach to find the time-varying effect of COVID-19 on stock market volatility. Moreover, Haroon and Rizvi [50] suggested that labor market disruption caused by this pandemic has been the quickest and most severe in recent U.S. history, implying an increase in market volatility and heightened uncertainty, causing panic and unusual behaviors in the local markets.
Alam et al. [51] also posited that the COVID crisis had affected the global financial sectors in a never-before-seen fashion. Employing FX equity, Bitcoin, national debt, crude oil and gold local market, they suggested that the markets in the former focus and origin China has steadied. At the same time, the rest of the international entities suffered destabilization as the infection spread, including the relatively secured commodities in the United States. This uncommon and novel occurrence has forced governments across the world to set emergency protocols such as vaccinations, social distancing rules, quarantine and testing rules, community awareness platforms, and stimulus checks.
Czech et al. [52] also investigated the effect of the recent outbreak on the Visegrad Four (Czech Republic, Hungary, Poland, and Slovakia) in Europe. They opined that based on the T-GARCH model, there was significant depreciation in the V4's exchange rates because of the pandemic. Furthermore, Shehzad et al. [53] demonstrated that health checks and lockdowns have peremptorily diminished the financial system based on U.K. stock markets, inferring that governments should apportion more funds to conquer any future health crisis.
In general, Wei and Han [54] revealed the financial assessment of 37 sample countries with severe COVID cases, including 17 of the G20, was negatively impacted. Their study showed that equity, FX rate, government bonds, and credit default swaps were weakened and that strong fiscal policies will be needed to stimulate the local markets. Albulescu [55] and Bakas and Triantafyllou [56] empirically analyzed the crisis and stated that the decline in the U.S. real sector (tourism and travel, manufacturing, etc.) was caused by the sanitary crisis, and there is also damage done on the volatility of commodity markets.
Some studies [57–60] also found the positive impact of the COVID-19 pandemic on agricultural commodities, gold, and cryptocurrencies. For instance, the price of Bitcoin, Ethereum, soft commodities, and gold remains relatively stable during the COVID-19 pandemic due to their inelastic demand and because of their safe haven properties. Yousef and Shehadeh [61] reported that an upward trend will continue in the gold market until a vaccine or other viral therapies are produced to stabilize the global economic picture because the spread and events of the COVID-19 pandemic are somewhat connected to the economies of the countries of the world at large. In general, from reports of events that ensued because of the COVID-19 crisis on the financial markets globally, only gold and soft commodity markets seemed to fare better and experience an upward turn because of their increased demand as these have served as leverage assets for investors.
Finally, some studies [4, 9, 21] investigated the impact of the COVID-19 crisis on the volatility of debt and equity markets in the GCC region. For example, government interventions may result in higher uncertainty in the bond market, which can negatively affect the value of sovereign bonds. Therefore, policymakers should consider the stabilization effects of the policies; otherwise, excessive restrictions may result in increased volatility. So, studying COVID-19 and sovereign bond market volatility is important to untangle the unforeseen effects of COVID-19 on the bond market. We contribute to the literature by studying the time-varying volatility spillovers of equity and bond markets in the GCC region before and during the COVID-19 pandemic. So far, studies have not examined the time-varying behavior of GCC financial equity and debt markets using the TVP-VAR connectedness approach. Hence, this study will help the academic community and portfolio managers by giving insights into how the infection has affected the volatility spillovers in the local financial market based on equity and bond markets in GCC countries.
Methodology
Data
To analyze and study the impact of the COVID-19 pandemic on equity and bond market returns, daily data on GCC equity index closing price and GCC sovereign bond index closing price before COVID-19 (1 January 2019 to 31 December 2019) and during the pandemic (1 January 2020 to 30 August 2021) were collected. These equity and sovereign bond markets are essential for stability of the global financial system due to the volatility spillover effects of these markets on other sectors/markets. Moreover, our dataset includes the data on the first, second, and third waves of COVID-19, which are useful to observe variations in volatility across different waves of the COVID-19 pandemic. Moreover, our dataset includes the data of the first, second, and third waves of COVID-19, which are useful to observe variations in volatility across different waves of the COVID-19 pandemic.
The raw prices time series of GCC stock indices, GCC regional equity index, and GCC bond and Sukuk indices are shown in Figure 1. Overall, Figure 1 shows that the prices of equity and bond market indices exhibited a sharp reduction during the initial wave of the COVID-19 pandemic, and the prices recovered sharply from the pre-pandemic level and showed an increasing trend during the second and third waves of the COVID-19 pandemic.
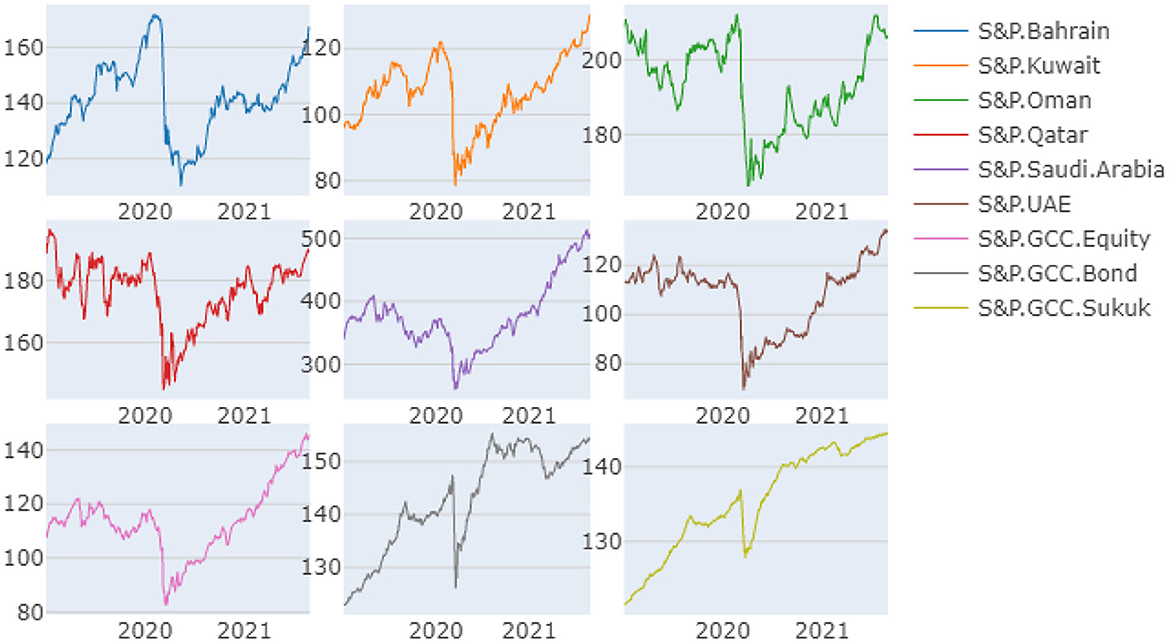
Figure 1. The S&P equity, bond and Sukuk indices prices.
However, the GCC equity and bond market prices follow non-stationary and unit root test processes. For implementing the dynamic connectedness approach, we transformed the data using the first log-difference of series:
The transformed series are shown in Figure 2. Figure 2 also shows the log-return increase around the first wave of the COVID-19 outbreak.
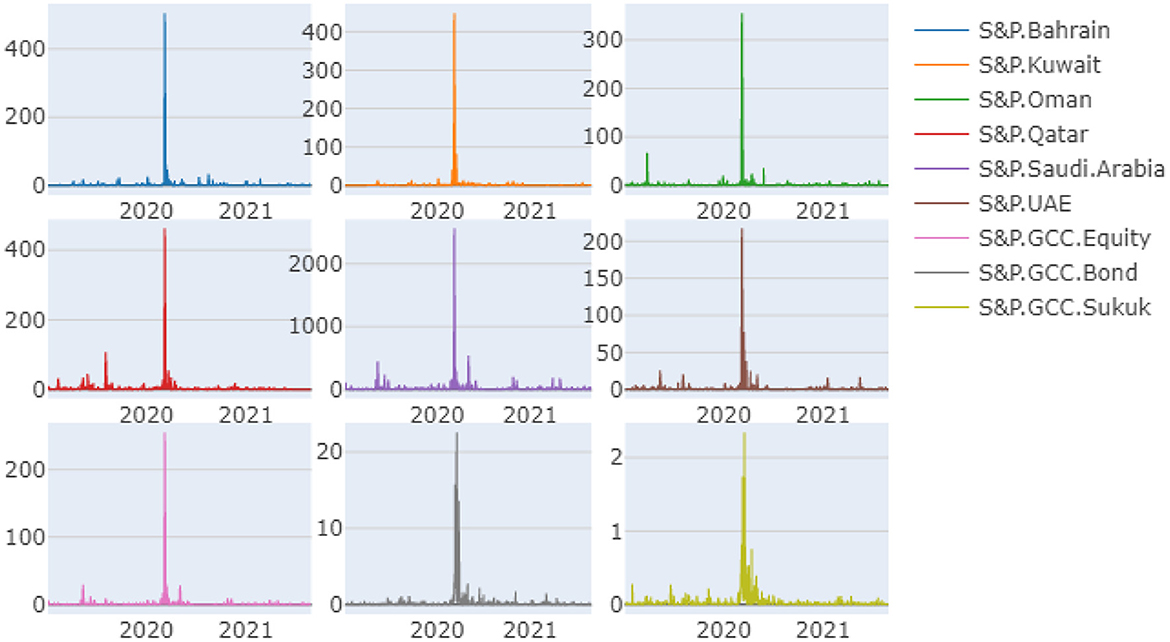
Figure 2. The S&P equity, bond and Sukuk indices returns.
Selection of estimation technique and research hypothesis
In this study, we investigated the impact of COVID-19 on volatility in the equity and debt markets in GCC to observe changes in volatility before and during the COVID-19 pandemic and test whether volatility spillover can be predicted using the TVP-VAR dynamic connectedness approach.
For time series model selection to measure risk, we followed the existing studies in which different measures for checking the risk/volatility are used, for instance, standard deviation, kurtosis, and skewness. However, standard deviation requires normally distributed returns of the data; skewness considers extreme values in the data, instead of average returns of the time series [62, 63]. On the contrary, kurtosis is used in the time series data with extreme values [63, 64]. Skewness is used in various studies in developing and developed markets for measuring volatility.
However, during the financial crisis, the distribution of returns changes abruptly, and the skewness and kurtosis cannot measure the volatility of returns. Existing studies on measuring the volatility spillovers [65–68] have measured volatility transmission using the two-step procedure.
Engle [69] proposed the autoregressive conditional heteroscedasticity (ARCH) process to integrate the time-varying volatility, and Bollerslev [70] developed the generalized autoregressive conditional heteroscedasticity (GARCH) model to cater few inadequacies of ARCH models.
A number of studies using the GARCH family of models have proven to yield accurate results, and the GARCH system has essentially become the initial and important method for modeling volatility in financial time series data [71].
However, recent studies applied the dynamic connectedness approach by Diebold and Yilmaz [67, 72] and Diebold and Yilmaz [73] to study the volatility transmission across financial markets. This approach considers the volatility transmission of large networks by using the VAR estimation toolkits, for example, impulse response function (IRF) and generalized forecast error variance (FEVDs). This approach provides information about the relative impact of shock in one variable to another variable forecast error variance by considering feedback loops across the network. However, the original connectedness approach has some shortcomings. For instance, in the original method by Diebold and Yilmaz [67, 72, 73], the rolling-window size is randomly selected. The use of the optimal window size estimated by the mean squared prediction error is suggested in a recent study by Antonakakis et al. [74]. They also suggested the use of the TVP-VAR approach, which is based on multivariate Kalman filters [75, 76], and it provides better estimates in the presence of outliers, which are most prominent during the crisis times.
Furthermore, according to Caloia et al. [77], the original dynamic connectedness approach is also based on normalization techniques and may provide suboptimal results. They suggested that scalar-based normalization of generalized forecast error variance is preferable for reducing the sign and rank errors.
Therefore, by following the studies by Balcilar et al. [78] and Gabauer and Gupta [79], and Samitas et al. [80], we applied the time-varying parameter vector autoregression (TVP-VAR) approach to study the time-varying volatility spillovers across equity and debt markets. This approach is helpful in monitoring spillovers across financial markets. The health-based COVID-19 crisis and strength of shocks are accurately investigated using this approach, which is useful for governments and policymakers to mitigate the adverse impacts of volatility spillovers.
Therefore, based on the aforementioned discussion of volatility spillovers and their estimation, we examine the following hypothesis using the TVP-VAR model:
(H0): COVID-19 pandemic had a significant impact on the volatility spillovers between equity (S&P GCC individual countries and regional equity indices) and debt market (bonds and Sukuk) of the GCC countries.
Research methods
Time-varying parameter vector autoregression
The TVP-VAR dynamic connectedness approach of Antonakakis et al. [74] is applied, based on the study by Diebold and Yilmaz [72] and Koop and Korobilis [76]. The TVP-VAR model with the lag length of order one is selected by applying the Bayesian information criterion (BIC):
where k, k = 1, K, are N × N parameter matrices; e yt, yt−1 and ϵt are K × 1 dimensional vectors; and Bt and Σt are K × K dimensional matrices. vec(Bt) and vt are K2 × 1 dimensional vectors, whereas Rt is a K2 × K2 dimensional matrix. The TVP-VAR model allows all parameters (Bt). Hence, the relationship across time series varies over time. Furthermore, it also provides the time-varying variance–covariance matrices, Σt and Rt.
The Wold decomposition or Wold representation theorem can be used to transform the TVP-VAR model into the TVP-VMA model:
Here, A0 = IK and ϵt is a vector of white noise shocks (symmetric and not orthogonal) with the K × K time-varying covariance matrix of Thus, the estimated H-step forecast error can be written as follows:
with a forecast error covariance matrix equal to:
Dynamic connectedness approach
The relationship between equity and bond markets during the COVID-19 pandemic lacks economic justifications supporting the order of selection of variables. Therefore, we choose the generalized connectedness approach by Diebold and Yilmaz [72]; Diebold and Yilmaz [73] following the study by Wiesen et al. [81].
The generalized dynamic connected framework is based on the H-step ahead generalized forecast error variance decomposition (GFEVD). The (scaled) GFEVD, gSOTij,t, can be interpreted as the effect a shock in the variable j has on the variable i and can be presented as follows:
where ei is a K × 1 zero selection vector with unity on its i-th position and is the proportional reduction of the H-step forecast error variance of the variable i owing to conditioning on future shocks of the variable j. , and Diebold and Yilmaz [67, 72, 73] proposed to normalize it to unity by the row sum estimated in generalized spillover table, gSOTij,t.
The fundamental of multiple spillover summary measures is the generalized dynamic spillover average table like the total directional connectedness from others to the variable i and total directional connectedness to others from a shock in the variable i. This shows how a variable i is impacted by the network and the influence of the variable i on the whole network.
These connectedness metrics can be written as follows:
Another dominant metric of the dynamic connectedness approach is known as the net total directional connectedness of the variable i, which explains whether the variable i influences the network more than being influenced by it:
If , the variable i is a net transmitter (receiver) of shocks, indicating that the variable i is driving (driven by) the network.
The total connectedness index (TCI) demonstrates network interconnectedness. In other words, market risk is a crucial indicator for managers and investors in equity and debt markets.
The TCI is defined as the average total directional connectedness from (to) others and can be expressed by the following equation:
whereas, a high value of TCI shows the increased risk in the market and a high degree of network spillovers. If it has a low value, it shows that there is a low risk, and shocks in one variable are driven by its future values and not transmitted to other variables.
Finally, the dynamic connectedness approach also delivers the information about the net pairwise spillover relationship between two variables, which are defined as follows:
If , the variable i has a higher impact on the variable j than vice versa, implying that the variable i dominates the variable j.
Dynamic conditional correlation GARCH
In order to validate the results, the dynamic conditional correlation (DCC-GARCH) model is used. The model can be viewed as a generalization of the Bollerslev [82] constant conditional correlation (CCC) estimator. The model involves the following two steps: The conditional heteroskedasticity is calculated in the first step, which is Bollerslev's constant conditional correlation (CCC) estimator [82]. In the next step, the generalization of Bollerslev's CCC captures dynamics in the correlation. Hence, the model is known as dynamic conditional correlation (DCC). The transmission of economic shocks can be evaluated by an alternative methodology by Gabauer [83], who examined the volatility shock transmission mechanism through a DCC-GARCH-based connectedness framework, which is used in this study. Volatility impulse response functions (VIRF) for DCC-GARCH can be estimated and incorporated using the dynamic connectedness approach by Diebold and Yilmaz [72].
Empirical results
In this section, we present the results of the descriptive statistics and dynamic connectedness approach.
Descriptive statistics
First, Table 1 shows the descriptive statistics of daily returns of equity indices in the GCC countries, bond, and Sukuk indices. For the construction of descriptive statistics, the descriptive statistics of the whole sample (1 January 2019 to 30 August 2021), as shown in Table 1, and descriptive statistics during the pandemic (1 January 2020 to 30 August 2021) were used, as shown in Table 1.
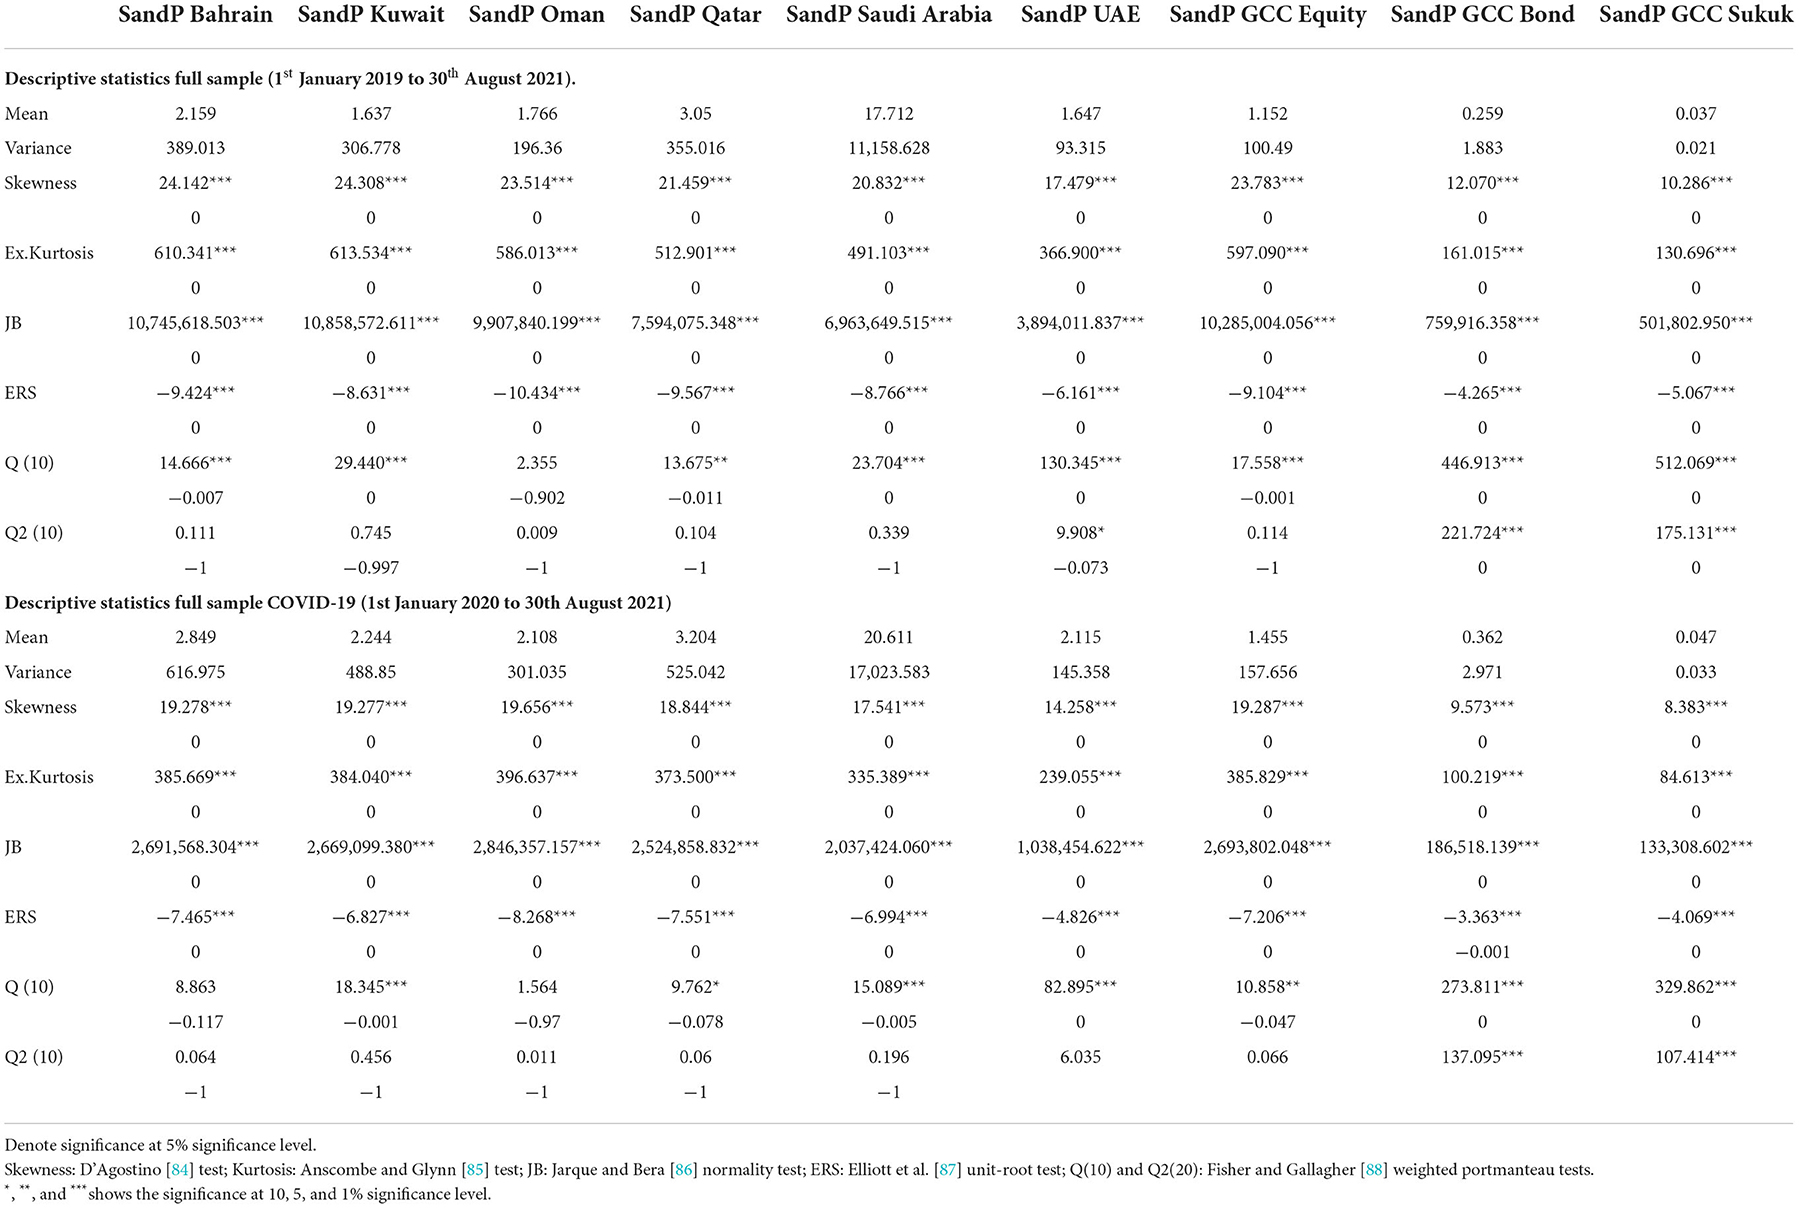
Table 1. Descriptive statistics.
Furthermore, Table 1 shows that most of the series exhibit positive average returns in the whole sample and during the COVID-19 pandemic. For instance, the GCC equity market returns are 1.15 and 1.45% in the whole sample and during the COVID-19 pandemic. Furthermore, the bond and Sukuk average returns are 0.25 and 0.037% in the whole sample, respectively. On the other hand, the bond and Sukuk returns are 0.46 and 0.047%, respectively. These results suggest that the debt market of the GCC region recovered quickly and provided better returns to investors during the COVID-19 pandemic.
Furthermore, the higher variance of the S&P equity market is highest at the regional level, with 100.49 and 157.87 in the whole sample and during the COVID-19 pandemic, respectively. Moreover, the variance of the S&P index of Saudi Arabia is very high compared with other indices; hence, the S&P Saudi Arabia index is a riskier asset during the study period. All the return series are significantly right-skewed in the study period, showing the median is smaller than the means. Moreover, the Jarque–Bera normality test shows that all-time series exhibit the leptokurtic distribution and have fat tails compared with the normal distribution. These results are in line with Jarque and Bera [86], who showed that all financial assets are not normally distributed.
Furthermore, the Elliott et al. [87] ERS unit root test results show that all returns series are stationary at a 1% significance level.
Furthermore, the goodness of fit of the time series is tested using Fisher and Gallagher's [88] weighted portmanteau test, which shows that the returns and squared returns are autocorrelated. The test endorses our decision of modeling the interconnectedness of the series using a TVP-VAR approach.
Averaged dynamic connectedness
The average dynamic connectedness results of the TVP-VAR approach are given in Table 2.
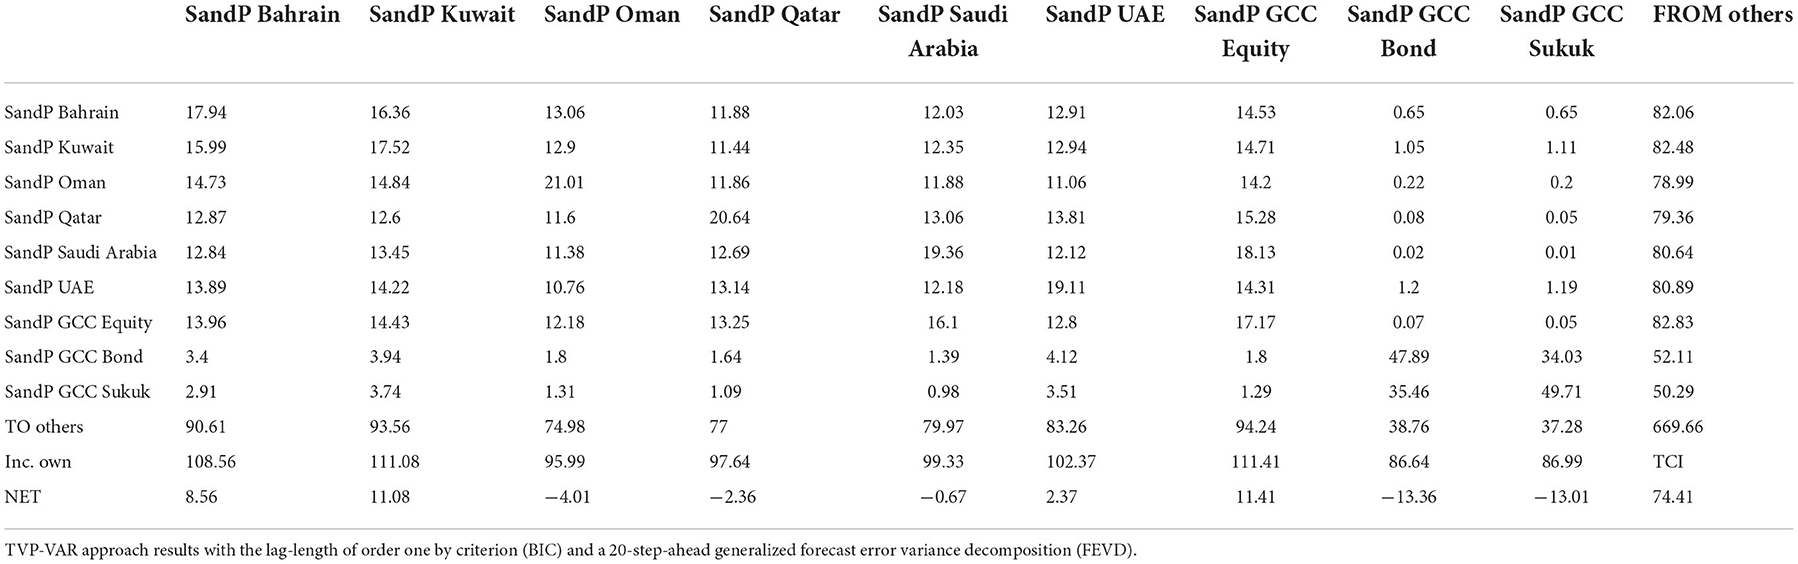
Table 2. Average dynamic connectedness table.
In Table 2, the diagonal elements link to their own contribution to volatility spillover, whereas off-diagonal elements refer to contribution “from” or “to” others. Furthermore, rows in Table 2 link the contribution of each equity and bond market index to forecast error variance of that specific asset in the system, and columns, on the other hand, relate one particular financial asset to all other assets separately.
The dynamic network of equity and bond markets can determine the internal connectedness of the system, with an average TCI value of 74.41%. The estimated forecast error variance of 74.41% within the dynamic connectedness network shows higher cross-market correlations. Furthermore, the GCC equity market transmits shocks in the system to the bond and Sukuk markets, with a higher forecast error variance value of 94.24%. This finding shows that the equity market transmits shocks to other financial markets, and the connectedness is higher between equity and debt markets. The individual equity and bond market indices receive shocks from equity markets.
Dynamic total connectedness
However, the average dynamic correlation table did not provide the information across time to not segregate connectedness during financial crisis and other macroeconomic events. For this purpose, we also checked the dynamic total connectedness (TCI) across time to check its time-varying impact on volatility transmission across equity and debt markets. Furthermore, this approach enables us to investigate the role of variables as net receivers or net transmitters. Figure 3 shows the dynamic total connectedness results.
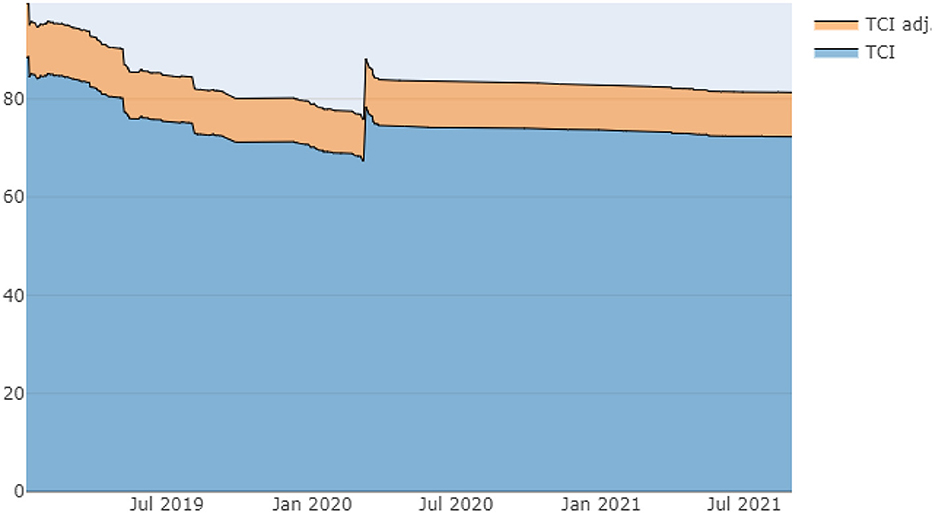
Figure 3. Dynamic total connectedness. The of TVP-VAR approach with lag-length of order one by (BIC) criterion and a 20-step-ahead generalized forecast error variance decomposition (FEVD) are provided in this figure. The blue area represents the total connectedness (TCI) and brown area shows the adjusted TCI.
As shown in Figure 3, total connectedness is within the range of 75 to 85% over the study's sample period. The TCI and adjusted TCI are reduced in pre-COVID-19, and the TCI increased during the first wave of COVID-19 (March–April 2020). Overall, the TCI remains stable after the first wave of COVID-19. The highest peak of TCI is around 95% at the start of 2019. Overall, TCI values above 80% indicate that higher spillovers exist between equity and bond markets in the GCC region. These indices are responsive to the health-based COVID-19 crisis due to higher uncertainties.
Net total directional connectedness
We also investigated the net total directional connectedness, as shown in Figure 4. This analysis is used to classify the equity and debt market indices into net receiving or net transmitting indices. Furthermore, we can also identify the role of any index as a net receiver or net transmitter of shocks over time. In the first step, we can check whether the function of indices varies or remains stable across the study period.
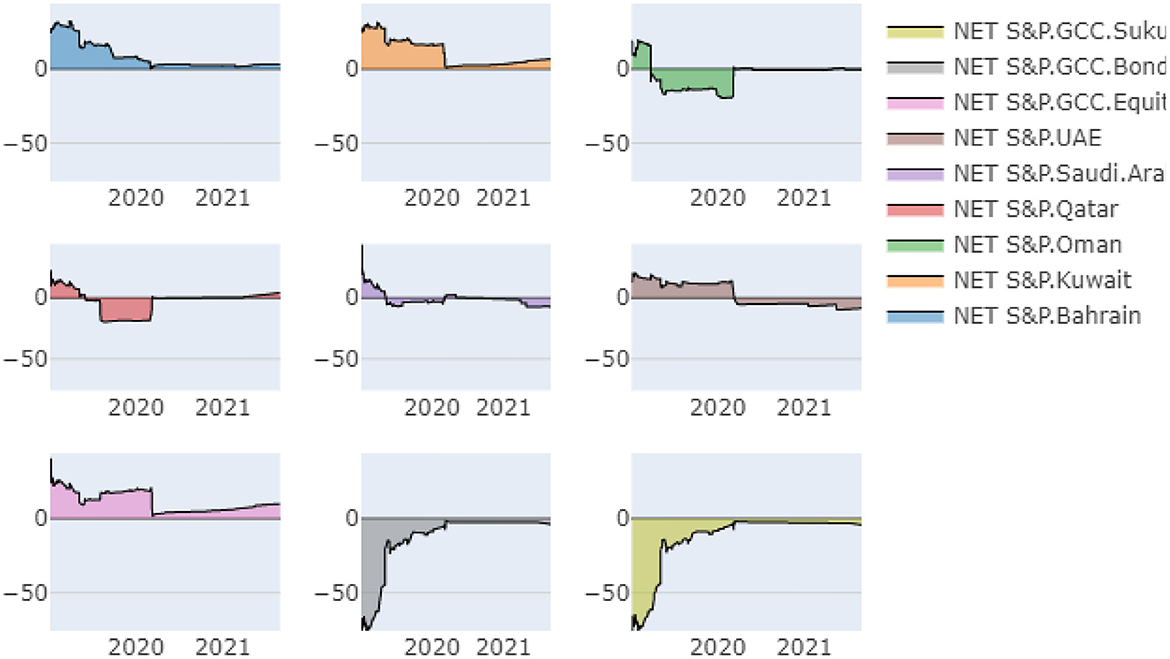
Figure 4. Dynamic net total directional connectedness. The of TVP-VAR approach with lag-length of order one by (BIC) criterion and a 20-step-ahead generalized forecast error variance decomposition (FEVD) are provided in this figure. The colored area represents the net total directional connectedness, and its positive values indicates the net transmitter role and negative values indicate the net receiving role of financial market indices.
Figure 4 shows the positive values relating the net transmitting role and negative values to the net receiving role of equity and debt market indices. As shown in Figure 4, the S&P Bahrain, S&P Kuwait, and S&P GCC regional equity market indices are persistent transmitters of shocks to other markets. Furthermore, the S&P GCC bond and Sukuk indices are the persistent net receivers of shocks from the equity markets in the GCC region. Throughout the study, the other individual equity market indices assume both net receiver and transmitter roles. The S&P Oman, Qatar, Saudi Arabia, and UAE indices become the net receiver of shocks from the net transmitter role before the COVID-19 pandemic. Overall, our findings suggest that equity markets in the GCC region transmit shocks to bond and Sukuk markets in the GCC region.
Net pairwise directional connectedness
In the next step, we investigated the net pairwise connectedness between equity and debt market indices to determine how their roles evolved over time. As shown in Figure 5, the GCC Sukuk and GCC equity markets are the net receiver of shocks and GCC bond, and GCC equity markets are also net receivers of shocks, and GCC Sukuk and GCC bond markets are both net receiver and transmitter of shocks during the study period. Overall, we found that these equity and bond markets are highly connected. For portfolio diversification, portfolio managers should invest in bond markets to hedge against risk in the equity markets.
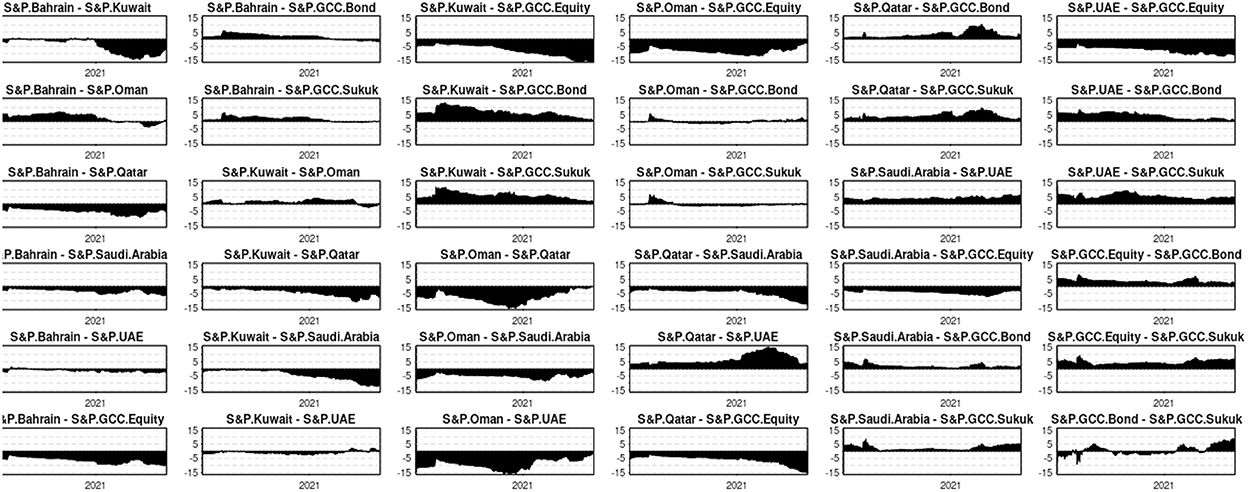
Figure 5. Dynamic net pairwise total directional connectedness. The of TVP-VAR approach with lag-length of order one by (BIC) criterion and a 20-step-ahead generalized forecast error variance decomposition (FEVD) are provided in the this figure. The filled area represents the net total directional connectedness. The positive values indicate the net transmitter role and negative values indicate the net receiving role of financial market indices.
Dynamic connectedness network plot
Figure 6 shows the network plot of the return connectedness between equity and bond market indices. The GCC regional equity market is the net transmitter of shocks to the equity markets of GCC countries, and it also transmits shocks to the bond and Sukuk markets of the GCC region. The S&P GCC, Kuwait, and Bahrain markets send shocks to bond and Sukuk markets. The S&P Oman and Qatar equity indices are also net receivers of shocks. These results show that equity market investors should consider spillovers from equity to debt markets.
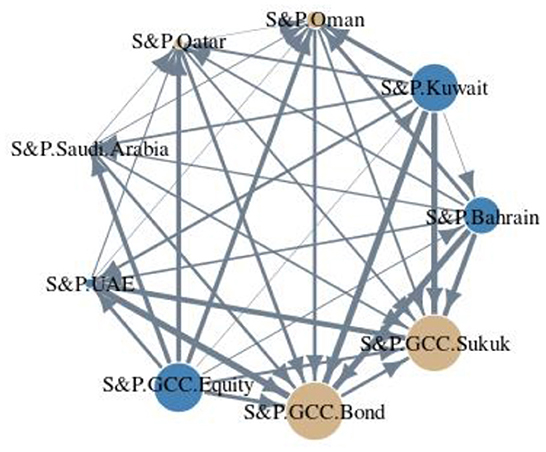
Figure 6. Dynamic connectedness network plot. The of TVP-VAR approach network plot is displayed in this figure. The Blue nodes exhibit the net transmitter role of bond and equity market indices and yellow nodes illustrate the net receiver of the shocks. Vertices are the measures of weighted average net pairwise directional connectedness. The nodes size shows the weighted average net total directional connectedness.
DCC-GARCH results
The results of TVP-VAR estimation are validated and compared with DCC-GARCH results to the forecast error variance decomposition method. The results of the dynamic connectedness network plot by DCC-GARCH are shown in Figure 7.
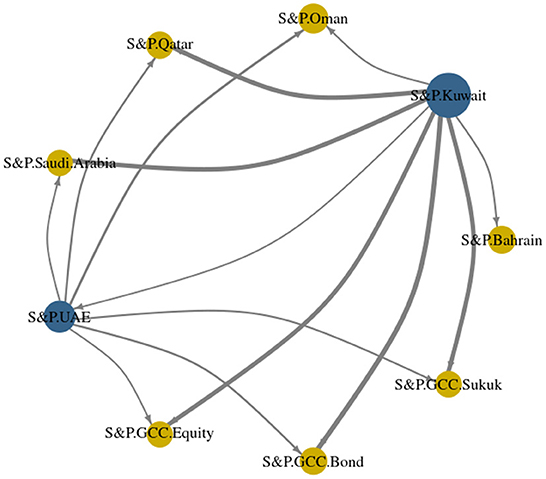
Figure 7. Dynamic connectedness network plot by DCC. The of TVP-VAR approach network plot is displayed in the Figure 6. The Blue nodes exhibit the net transmitter role of bond and equity market indices and yellow nodes illustrate the net receiver of the shocks. Vertices are the measures of weighted average net pairwise directional connectedness. The nodes size shows the weighted average net total directional connectedness.
The results showed that S&P Kuwait and UAE equity markets send shocks to the bond and Sukuk markets. The S&P Oman, Qatar, Saudi Arabia, and Bahrain equity indices are also net receivers of shocks. The results are similar to the TVP-VAR model, and Sukuk and bond markets are receiver of shocks and spillover, while the equity markets of GCC are net transmitter of shocks. This method shows the difference between Bahrain and Saudi Arabia equity markets, which are the net receiver of shock, while they are the transmitter of shocks in the TVP-VAR approach. Overall, our results validate the TVP-VAR approach used in our research.
Conclusion and final discussion
The rapid growth of investments in debt markets due to higher uncertainties in equity markets over the past decade gained the attention of academics and portfolio managers to optimize and diversify their portfolios during times of financial or health-based crisis. We investigated the dynamic connectedness and volatility spillovers between S&P equity indices of individual countries, regional GCC equity indices, and S&P bond and Sukuk market indices before and during the COVID-19 pandemic. The TVP-VAR approach was applied in this study, which is the extension of the dynamic connectedness approach by Diebold and Yilmaz [72] and Diebold and Yilmaz [73] to solving the outliers, rolling window size, and parameter normalization issues.
The empirical results were also evaluated using the DCC-GARCH model by Gabauer [83] to investigate spillovers across various GCC markets. The empirical results validate the results obtained by TAP-VAR method. The difference in results lies in Bahrain and Saudi Arabia equity markets, which are the net receivers of shock in the DCC-GARCH model as well as transmitters of shock in the TVP-VAR approach, while other results are similar to those obtained using the two approaches.
Overall, we found that the S&P equity markets are persistent transmitters of shocks to bond and equity markets. The higher connectedness in the GCC equity and debt market indicates the lower diversification potential of bond and Sukuk markets for investors of equity during the COVID-19 pandemic. Overall, our analysis confirms an existence of a definite and significant level of interconnectedness within GCC markets, and a well-diversified portfolio could be the best solution to respond to this interconnectedness. The study findings could be helpful for portfolio managers in GCC equity markets regarding diversification opportunities in the debt markets of the GCC region.
Data availability statement
The raw data supporting the conclusions of this article will be made available by the authors, without undue reservation.
Author contributions
The author confirms being the sole contributor of this work and has approved it for publication.
Conflict of interest
The author declares that the research was conducted in the absence of any commercial or financial relationships that could be construed as a potential conflict of interest.
Publisher's note
All claims expressed in this article are solely those of the authors and do not necessarily represent those of their affiliated organizations, or those of the publisher, the editors and the reviewers. Any product that may be evaluated in this article, or claim that may be made by its manufacturer, is not guaranteed or endorsed by the publisher.
References
1. Rubbaniy G, Khalid AA, Tessema A, Baqrain A. Do stock market fear and economic policy uncertainty co-move with COVID-19 fear? Evidence from the US and UK. Stud Econom Finan. (2022). doi: 10.1108/SEF-10-2021-0408. [Epub ahead of print].
2. Bel G, Gasulla Ó, Mazaira-Font FA. The effect of health and economic costs on governments' policy responses to COVID– 19 crisis under incomplete information. Public Adm Rev. (2021) 81:1131–46. doi: 10.1111/puar.13394
3. Chaudhary R, Bakhshi P, Gupta H. Volatility in international stock markets: An empirical study during COVID-19. J Risk Fin Manag. (2020) 13:208. doi: 10.3390/jrfm13090208
4. Salman A, Ali Q. Covid-19 and its impact on the stock market in GCC. J Sustain Fin Invest. (2021) 1–17. doi: 10.1080/20430795.2021.1944036
5. Iqbal N, Fareed Z, Wan G, Shahzad F. Asymmetric nexus between COVID-19 outbreak in the world and cryptocurrency market. Int Rev Fin Anal. (2020) 73:101613. doi: 10.1016/j.irfa.2020.101613
6. Just M, Echaust K. Stock market returns, volatility, correlation and liquidity during the COVID-19 crisis: Evidence from the Markov switching approach. Fin Res Lett. (2020) 37:1–8. doi: 10.1016/j.frl.2020.101775
7. Mazur M, Dang M, Vega M. COVID-19 and the march 2020 stock market crash. Evidence from SandP1500. Fin Res Lett. (2021) 38:101690. doi: 10.1016/j.frl.2020.101690
8. Umar Z, Gubareva M, TeplovaT. The impact of Covid-19 on commodity markets volatility: analyzing time-frequency relations between commodity prices and coronavirus panic levels. Res Policy. (2021) 73:102164. doi: 10.1016/j.resourpol.2021.102164
9. Zaremba A, Kizys R, Aharon DY. Volatility in international sovereign bond markets: the role of government policy responses to the COVID-19 pandemic. Fin Res Lett. (2021) 43:102011. doi: 10.1016/j.frl.2021.102011
10. Andersen TG, Bollerslev T, Diebold FX. Roughing it up: Including jump components in the measurement, modeling, and forecasting of return volatility. Rev Econ Stat. (2007) 89:701–20. doi: 10.1162/rest.89.4.701
11. Dorn D, Huberman G. Preferred risk habitat of individual investors. J Financ Econ. (2010) 97:155–73. doi: 10.1016/j.jfineco.2010.03.013
12. Wang W, Su C, Duxbury D. Investor sentiment and stock returns: global evidence. J Empir Fin. (2021) 63:365–91. doi: 10.1016/j.jempfin.2021.07.010
13. Zi-long L, Su-sheng W, Ming-zhu H. International investor sentiment and stock returns: Evidence from China. Invest Anal J. (2021) 50:60–76. doi: 10.1080/10293523.2021.1876968
14. Al-Awadhi AM, Alsaifi K, Al-Awadhi A, Alhammadi S. Death and contagious infectious diseases: Impact of the COVID-19 virus on stock market returns. J Behav Exp Fin. (2020) 27:100326. doi: 10.1016/j.jbef.2020.100326
15. Contessi S, De Pace P. The international spread of COVID-19 stock market collapses. Fin Res Lett. (2021) 42:101894. doi: 10.1016/j.frl.2020.101894
16. Sun Y, Wu M, Zeng X, Peng Z. The impact of COVID-19 on the Chinese stock market: Sentimental or substantial? Fin Res Lett. (2021) 38:101838. doi: 10.1016/j.frl.2020.101838
17. Liu H, Manzoor A, Wang C, Zhang L, Manzoor Z. The COVID-19 outbreak and affected countries stock markets response. Int J Environ Res Public Health. (2020) 17:2800. doi: 10.3390/ijerph17082800
18. Yarovaya L, Matkovskyy R, Jalan A. The COVID-19 black swan crisis: Reaction and recovery of various financial markets. Res Int Bus Fin. (2022) 59:101521. doi: 10.1016/j.ribaf.2021.101521
19. Andries AM, Ongena S, Sprincean N. The COVID-19 pandemic and sovereign bond risk. North Am J Econom Finan. (2021) 58:101527. doi: 10.1016/j.najef.2021.101527
20. Cevik S, Öztürkkal B. Contagion of fear: is the impact of COVID-19 on sovereign risk really indiscriminate? Int Fin. (2021) 24:134–54. doi: 10.1111/infi.12397
21. Paule-Vianez J, Orden-Cruz C, Escamilla-Solano S. Influence of COVID-induced fear on sovereign bond yield. Econ Res-Ekonomska IstraŽivanja. (2022) 35:1–18. doi: 10.1080/1331677X.2021.1934509
22. Bi H, Marsh WB. Flight to Liquidity or Safety? Recent Evidence From the Municipal Bond Market. Recent Evidence from the Municipal Bond Market (December 7, 2020). Federal Reserve Bank of Kansas City Working Paper, Kansas City. (2020). p. 20–9.
23. Bordo MD, Duca JV. How the New Fed Municipal Bond Facility Capped Muni-Treasury Yield Spreads in the COVID-19 Recession. New York, NY: National Bureau of Economic Research (2021).
24. Cipriani M, Haughwout AF, Hyman B, Kovner A, La Spada GLieber M, et al. Municipal Debt Markets and the COVID-19 Pandemic. (2020).
25. Abuzayed B, Al-Fayoumi N. Risk spillover from crude oil prices to GCC stock market returns: New evidence during the COVID-19 outbreak. N Am J Econ Fin. (2021) 58:101476. doi: 10.1016/j.najef.2021.101476
26. Al Refai H, Zeitun R, Eissa MA-A. Impact of global health crisis and oil price shocks on stock markets in the GCC. Fin Res Lett. (2021) 45:102130. doi: 10.1016/j.frl.2021.102130
27. Arezki R, Fan RY, Nguyen H. Coping With a Dual Shock: A Perspective From the Middle East and North Africa. COVID-19 in Developing Economies. London: The London School of Economics and Political Science (2020). p. 69.
28. McKibbin W, Fernando R. The Economic Impact of COVID-19. Economics in the Time of COVID-19. (2020). p. 45.
29. McKibbin W, Fernando R. The global macroeconomic impacts of COVID-19: Seven scenarios. Asian Econ Papers. (2021) 20:1–30. doi: 10.1162/asep_a_00796
30. Alrababa'a A, Alomari M, McMillan D. Multiscale stock-bond correlation: Implications for portfolio diversification and risk management. Res Int Bus Fin. (2021) 58:101435. doi: 10.1016/j.ribaf.2021.101435
31. Anjorin AA. The coronavirus disease 2019 (COVID-19) pandemic: A review and an update on cases in Africa. Asian Pac J Trop Med. (2020) 13:199. doi: 10.4103/1995-7645.281612
32. Ayittey FK, Ayittey MK, Chiwero NB, Kamasah JS, Dzuvor C. Economic impacts of Wuhan 2019-nCoV on China and the world. J Med Virol. (2020) 92:473. doi: 10.1002/jmv.25706
33. Gourinchas P-O. Flattening the pandemic and recession curves. Mitigat COVID Econ Crisis Act Fast Do Whatever. (2020) 31:57–62.
34. Abbas G, Wang S. Does macroeconomic uncertainty really matter in predicting stock market behavior? A comparative study on China and USA. China Fin Rev Int. (2020) 10:393–427. doi: 10.1108/CFRI-06-2019-0077
35. Bhuiyan EM, Chowdhury M. Macroeconomic variables and stock market indices: Asymmetric dynamics in the US and Canada. Q Rev Econ Fin. (2020) 77:62–74. doi: 10.1016/j.qref.2019.10.005
36. Engle RF, Ghysels E, Sohn B. Stock market volatility and macroeconomic fundamentals. Rev Econ Stat. (2013) 95:776–97. doi: 10.1162/REST_a_00300
37. Ehm C, Kaufmann C, Weber M. Volatility inadaptability: Investors care about risk, but cannot cope with volatility. Rev Fin. (2014) 18:1387–423. doi: 10.1093/rof/rft032
38. He M, Huang J, Zhu H. Heterogeneous beliefs and idiosyncratic volatility puzzle: evidence from China. China Fin Rev Int. (2020) 11:124–41. doi: 10.1108/CFRI-07-2019-0128
39. Baker SR, Bloom N, Davis SJ, Kost K, Sammon M, Viratyosin T. The unprecedented stock market reaction to COVID-19. Rev Asset Pricing Stud. (2020) 10:742–58. doi: 10.1093/rapstu/raaa008
40. Onali E. Covid-19 Stock Market Volatility. (2020). Available online at: https://ssrn.com/abstract=3571453 (accessed November 29, 2022).
41. Yousfi M, Zaied YB, Cheikh NB, Lahouel BB, Bouzgarrou H. Effects of the COVID-19 pandemic on the US stock market and uncertainty: A comparative assessment between the first and second waves. Technol Forecast Soc Change. (2021) 167:120710. doi: 10.1016/j.techfore.2021.120710
42. Corbet S, Hou Y, Hu Y, Lucey B, Oxley LL. Aye Corona! The contagion effects of being named Corona during the COVID-19 pandemic. Finan Res Lett. (2021) 38:101591. doi: 10.1016/j.frl.2020.101591
43. Zhang D, Hu M, Ji Q. Financial markets under the global pandemic of COVID-19. Fin Res Lett. (2020) 36:101528. doi: 10.1016/j.frl.2020.101528
44. Narayan PK, Phan DHB, Liu G. COVID-19 lockdowns, stimulus packages, travel bans, and stock returns. Fin Res Lett. (2020) 38:101732. doi: 10.1016/j.frl.2020.101732
45. Phan DHB, Narayan PK. Country responses and the reaction of the stock market to COVID-19—a preliminary exposition. Emerg Markets Fin Trade. (2020) 56:2138–50. doi: 10.1080/1540496X.2020.1784719
46. Ashraf BN. Stock markets' reaction to COVID-19: cases or fatalities? Res Int Bus Fin. (2020) 54:101249. doi: 10.1016/j.ribaf.2020.101249
47. Choi S-Y. Industry volatility and economic uncertainty due to the COVID-19 pandemic: evidence from wavelet coherence analysis. Fin Res Lett. (2020) 37:101783. doi: 10.1016/j.frl.2020.101783
48. Sharif A, Aloui C, Yarovaya L. COVID-19 pandemic, oil prices, stock market, geopolitical risk and policy uncertainty nexus in the US economy: Fresh evidence from the wavelet-based approach. Int Rev Fin Anal. (2020) 70:101496. doi: 10.1016/j.irfa.2020.101496
49. Rubbaniy G, Khalid AA, Tessema A. Do stock market fear and economic policy uncertainty co-move with COVID-19 fear? Evidence from the US and UK. SSRN. (2021) 3843666. doi: 10.2139/ssrn.3843666. [Epub ahead of print].
50. Haroon O, Rizvi SAR. COVID-19: Media coverage and financial markets behavior—a sectoral inquiry. J Behav Exp Fin. (2020) 27:100343. doi: 10.1016/j.jbef.2020.100343
51. Alam MN, Alam MS, Chavali K. Stock market response during COVID-19 lockdown period in India: an event study. J Asian Fin Econ Bus. (2020) 7:131–7. doi: 10.13106/jafeb.2020.vol7.no7.131
52. Czech K, Wielechowski M, Kotyza P, Benešová I, Laputková A. Shaking stability: COVID-19 impact on the Visegrad Group countries' financial markets. Sustainability. (2020) 12:6282. doi: 10.3390/su12156282
53. Shehzad K, Xiaoxing L, Arif M, Rehman KU, Ilyas M. Investigating the psychology of financial markets during covid-19 era: a case study of the us and european markets. Front Psychol. (2020) 11:1924. doi: 10.3389/fpsyg.2020.01924
54. Wei X, Han L. The impact of COVID-19 pandemic on transmission of monetary policy to financial markets. Int Rev Fin Anal. (2021) 74:101705. doi: 10.1016/j.irfa.2021.101705
55. Albulescu CT. COVID-19 and the United States financial markets' volatility. Fin Res Lett. (2021) 38:101699. doi: 10.1016/j.frl.2020.101699
56. Bakas D, Triantafyllou A. Commodity price volatility and the economic uncertainty of pandemics. Econ Lett. (2020) 109283. doi: 10.1016/j.econlet.2020.109283
57. Demir E, Bilgin MH, Karabulut G, Doker AC. The relationship between cryptocurrencies and COVID-19 pandemic. Eurasian Econ Rev. (2020) 10:349–60. doi: 10.1007/s40822-020-00154-1
58. Manohar JM, Guntur AR. Does gold retain its hedge and safe haven role for energy sector indices during COVID-19 Pandemic? A Crossquantilogram Approach. Int J Energy Econ Policy. (2021) 11:233. doi: 10.32479/ijeep.10294
59. Rubbaniy G, Khalid AA, Siriopoulos C, Samitas A. Safe-Haven properties of soft commodities during times of COVID-19. J Commodity Mark. (2020) 27. doi: 10.2139/ssrn.3740588
60. Rubbaniy G, Khalid AA, Samitas A. Are cryptos safe-haven assets during Covid-19? Evidence from wavelet coherence analysis. Emerg Markets Fin Trade. (2021)57:1741–56. doi: 10.1080/1540496X.2021.1897004
61. Yousef I, Shehadeh E. The impact of the COVID-19 on gold price volatility. Int J Econ Bus Adm. (2020) 8:353–64. doi: 10.35808/ijeba/592
62. Chang BY, Christoffersen P, Jacobs K. Market skewness risk and the cross section of stock returns. J financ econ. (2013) 107:46–68. doi: 10.1016/j.jfineco.2012.07.002
63. Conrad J, Dittmar RF, Ghysels E. Ex ante skewness and expected stock returns. J Finance. (2013) 68:85–124. doi: 10.1111/j.1540-6261.2012.01795.x
64. Ayadi MA, Cao X, Lazrak S, Wang Y. Do idiosyncratic skewness and kurtosis really matter? N Am J Econ Fin. (2019) 50:101008. doi: 10.1016/j.najef.2019.101008
65. Antonakakis N, Cunado J, Filis G, Gabauer D, de Gracia FP. Oil and asset classes implied volatilities: Investment strategies and hedging effectiveness. Energy Econ. (2020) 91:104762. doi: 10.1016/j.eneco.2020.104762
66. Arouri MEH, Jouini J, Nguyen DK. Volatility spillovers between oil prices and stock sector returns: Implications for portfolio management. J Int Money Fin. (2011) 30:1387–405. doi: 10.1016/j.jimonfin.2011.07.008
67. Diebold FX, Yilmaz K. Measuring financial asset return and volatility spillovers, with application to global equity markets. Econ J. (2009) 119:158–71. doi: 10.1111/j.1468-0297.2008.02208.x
68. Dutta A. A note on the implied volatility spillovers between gold and silver markets. Res Policy. (2018) 55:192–5. doi: 10.1016/j.resourpol.2017.11.017
69. Engle RF. Autoregressive conditional heteroscedasticity with estimates of the variance of United Kingdom inflation. Econ J Econ Soc. (1982) 987:1007. doi: 10.2307/1912773
70. Bollerslev T. Generalized autoregressive conditional heteroskedasticity. J Econom. (1986) 31:307–27. doi: 10.1016/0304-4076(86)90063-1
71. Engle RF, Bollerslev T. Modelling the persistence of conditional variances. Econ Rev. (1986) 5:1–50. doi: 10.1080/07474938608800095
72. Diebold FX, Yilmaz K. Better to give than to receive: predictive directional measurement of volatility spillovers. Int J Forecast. (2012) 28:57–66. doi: 10.1016/j.ijforecast.2011.02.006
73. Diebold FX, Yilmaz K. On the network topology of variance decompositions: measuring the connectedness of financial firms. J Econom. (2014) 182:119–34. doi: 10.1016/j.jeconom.2014.04.012
74. Antonakakis N, Chatziantoniou I, Gabauer D. Refined measures of dynamic connectedness based on time-varying parameter vector autoregressions. J Risk Fin Manag. (2020) 13:84. doi: 10.3390/jrfm13040084
75. Koop G, Korobilis D. Large time-varying parameter VARs. J Econom. (2013) 177:185–98. doi: 10.1016/j.jeconom.2013.04.007
76. Koop G, Korobilis D. A new index of financial conditions. Eur Econ Rev. (2014) 71:101–16. doi: 10.1016/j.euroecorev.2014.07.002
77. Caloia FG, Cipollini A, Muzzioli S. How do normalization schemes affect net spillovers? A replication of the Diebold and Yilmaz (2012) study. Energy Econ. (2019) 84:104536. doi: 10.1016/j.eneco.2019.104536
78. Balcilar M, Gabauer D, Umar Z. Crude Oil futures contracts and commodity markets: new evidence from a TVP-VAR extended joint connectedness approach. Res Policy. (2021) 73:102219. doi: 10.1016/j.resourpol.2021.102219
79. Gabauer D, Gupta R. On the transmission mechanism of country-specific and international economic uncertainty spillovers: evidence from a TVP-VAR connectedness decomposition approach. Econ Lett. (2018) 171:63–71. doi: 10.1016/j.econlet.2018.07.007
80. Samitas A, Papathanasiou S, Koutsokostas D. The connectedness between Sukuk and conventional bond markets and the implications for investors. Int J Islamic Middle Eastern Fin Manag. (2021) 14:928–49. doi: 10.1108/IMEFM-04-2020-0161
81. Wiesen TF, Beaumont PM, Norrbin SC, Srivastava A. Are generalized spillover indices overstating connectedness? Econ Lett. (2018) 173:131–4. doi: 10.1016/j.econlet.2018.10.007
82. Bollerslev T. Modelling the coherence in short-run nominal exchange rates: a multivariate generalized ARCH model. Rev Econ Stat. (1990) 72:498–505. doi: 10.2307/2109358
83. Gabauer D. Volatility impulse response analysis for DCC-GARCH models: the role of volatility transmission mechanisms. J Forecast. (2020) 39:788–96. doi: 10.1002/for.2648
85. Anscombe FJ, Glynn WJJB. Distribution of the kurtosis statistic b 2 for normal samples. Biometrica. (1983) 70:227–34.
86. Jarque CM, Bera AK. Efficient tests for normality, homoscedasticity and serial independence of regression residuals. Econ Lett. (1980) 6:255–9. doi: 10.1016/0165-1765(80)90024-5
87. Elliott G, Rothenberg TJ, Stock JH. Efficient tests for an autoregressive unit root. Econometrica. (1996) 64:813–36. doi: 10.2307/2171846
Keywords: equity market, Sukuk, bonds, COVID-19, dynamic connectedness, TVP-VAR
Citation: Syed AM (2022) The impact of COVID-19 on GCC equity and debt markets: Evidence from TVP-VAR estimation. Front. Appl. Math. Stat. 8:1032123. doi: 10.3389/fams.2022.1032123
Received: 31 August 2022; Accepted: 21 November 2022;
Published: 15 December 2022.
Edited by:
Ionut Florescu, Stevens Institute of Technology, United StatesReviewed by:
Dan Wang, Moody's Corporation, United StatesFernando Perez De Gracia Hidalgo, University of Navarra, Spain
Copyright © 2022 Syed. This is an open-access article distributed under the terms of the Creative Commons Attribution License (CC BY). The use, distribution or reproduction in other forums is permitted, provided the original author(s) and the copyright owner(s) are credited and that the original publication in this journal is cited, in accordance with accepted academic practice. No use, distribution or reproduction is permitted which does not comply with these terms.
*Correspondence: Ali Murad Syed, YW11cmFkc3llZEBnbWFpbC5jb20=