 Adji Achmad Rinaldo Fernandes*
 Solimun Solimun
- Faculty of Mathematics and Natural Sciences, University of Brawijaya, Malang, Indonesia
This study aims to compare integrated clusters on various linkages (Ward, Complete, and Average linkage) with path analysis to classify the behavior of subservient to pay for mortgages. The data used are primary data from questionnaires filled out by Bank X customers, using purposive sampling. The measurement method used is the average score method. Liu et al. with the title “Enhanced path-based Clustering Algorithm” shows the results that path analysis with cluster integration gives results that outperform other cluster algorithms. So, this study uses the cluster integration with path analysis method by comparing the linkage. The results showed that cluster integration in the Ward linkage method with path analysis was the best method, by comparing the coefficient of determination. The variables of attitude, subjective norms, behavioral control, and intention to comply with paying explained the behavior of Bank X customers to comply with paying mortgages by 88.32%, while the remaining 11.68% was explained by variables outside the model.
Introduction
The role of data at this time is very important; it is used to support risk assessment, make decisions, and can even be used to predict an event. Statistics is one of the sciences used to manage data and is middle needed in various fields. One field that requires statistical knowledge is Bank Financial Institutions or often called Banks. According to the Law of the Republic of Indonesia Number 10 of 1998 concerning Banking, a bank is a business entity that collects funds from the public in the form of savings and distributes them back to the community in the form of credit and or other forms to improve people's living standards.
The existence of a bank is very important for the community, one of which is shown by the continued increase in the number of customers. In the banking business, there are several service products and one of them is Home Ownership Credit that can be called KPR Purchases [1].
According to Kuswati [2], Home Ownership Credit (KPR) is one of the credit services provided by banks to customers who apply for special loans to meet the need for a residence. Before the bank gives credit to the debtor, it is necessary to have an assessment from the bank to measure whether the debtor is able to pay its obligations in credit or not. One of the problems in mortgages is the existence of debtors who are not smooth in paying their obligations. This causes losses to the bank. Therefore, there is a need for supervision in customer credit services, namely by grouping which is used to determine the characteristics of debtors who are able to fulfill credit obligations or not. Statistical methods that can be used to deal with these problems are using cluster integration and path analysis [3].
According to Solimun [4], cluster analysis is used to group homogeneous objects into one and the characteristics between groups are heterogeneous. By using Cluster analysis, it will get the best number of Clusters from several linkages. Then, one of the best clusters is selected for further analysis. In Cluster analysis, there are several linkages that can be used to form Clusters. According to Supranto [5], the linkage method consists of Ward linkage, Complete linkage, and Average linkage. This study examines the application of integrated clusters in path analysis with three different linkage methods, namely Ward linkage, Complete linkage, and Average linkage. The measurement of the distance of each linkage in this study uses the Euclidean distance. The results of determining many clusters with different linkages will certainly give different results. In this study, we want to examine the effect of using linkage on the integrated Cluster path analysis approach. From this research, we want to get the best linkage to be used in the integrated Cluster path analysis approach to classify the behavior of compliant to pay for the type of KPR Purchase.
In addition to using cluster analysis, this study also uses path analysis. According to Sudaryono [6] path analysis is a method that examines the direct and indirect effects of the hypothesized variables. Path analysis is a method that can be applied to causal models formulated on the basis of knowledge and theories developed by researchers.
Research related to cluster integration with path analysis by Liu et al. with the title “An improved path-based Clustering algorithm” shows the results that path analysis with Cluster integration gives results that outperform other Cluster algorithms. Research related to the variables of attitude, subjective norms, behavioral control, intention to pay on obedient behavior to pay at Bank X which is used to assess the creditworthiness of providing credit by Suryani and Yushita [7] with the title “The Influence of Attitudes, Subjective Norms, and Controls.” Perceived Behavior of Individual Taxpayer Compliance in the Special Region of Yogyakarta with Intentions to Comply with Taxes as Moderating Variables “shows the results that attitudes, subjective norms, behavior control, Based on the description above, this study has the aim of classifying the behavior of complying with buying mortgages at Bank X by integrating Cluster analysis with path analysis. Next, we compare various methods in Cluster analysis to find out the best Cluster integration with certain (linkage) methods. The data used in this study is primary data from the variables of attitude, subjective norms, behavioral control, and intention to pay toward obedient behavior in paying at Bank X which is used to assess the feasibility of granting credit to classify compliant behavior in paying for mortgages.
Literature Review
Hierarchical Method
According to Johnson and Wichern [8] in the hierarchical method of forming groups, there are two approaches, namely agglomerative hierarchical methods (Agglomerative Hierarchical Methods) and divisive hierarchical methods (Device Hierarchical Methods). The agglomerative method starts by assuming that each object is a cluster. Then the two objects that have the closest distance are combined into one cluster. The process continues so that in the end it will form a cluster consisting of all objects [9].
Agglomerative methods start with individual objects. Initially, there are as many clusters as objects. The most similar objects are grouped and then these initial groups are combined according to their similarities [10]. When similarity decreases, all subgroups are combined into one group. While divisive hierarchical clustering reverses the process of agglomerative hierarchical clustering, by starting with all objects in one cluster, and successively dividing each cluster into smaller ones [11]. The method that is often used is the agglomerative hierarchical method. The agglomerative hierarchical method algorithms used in group formation include:
a) Ward linkage method
In Ward clustering method, at every step, every possible union of cluster is considered, and those two clusters are combined together whose merger results in minimum increase in information loss. The Ward method is a method of forming clusters based on the loss of information due to merging objects into clusters.
where:
εij: value for the i-th object on Cluster j
p: number of variables
n: the number of respondents in Cluster formed
Steps to solve the Ward method:
a) Start with paying attention to N Clusters which have one respondent per Cluster (all respondents are considered as Clusters). In this first stage, the SSE is zero.
b) Cluster The first is formed by choosing two of the N Clusters that have the lowest SSE value.
c) The N-1 cluster of clusters is then examined again to determine which two of these clusters can minimize heterogeneity. Thus, N Clusters are systematically reduced by N-1.
d) Repeat steps (c) and (d), until one cluster is obtained or all respondents join into one cluster.
b) Complete linkage method
In the Complete linkage method, the distance between clusters is determined by the furthest distance between two objects in different clusters [8]. First start with all the points as individual clusters then merge two points that have the minimum distance between them.
where:
d(ij)k: distances between sub-samples (ij) and Cluster k
sis: distance of sub-sample i and cluster k
djk: distance of sub-sample j and cluster k
c) Average linkage method
In the Average linkage method, the distance between two Clusters is considered as the average distance between all members in one Cluster and all other Cluster members. The distance formula can be written in equation (3).
where
d(ij)k: distances between sub-samples (ij) and Cluster k
sis: distance of sub-sample i and cluster k
djk: distance of sub-sample j and cluster k
Cluster Analysis Distance
In this study, the number of clusters uses Euclidean distance. The distance between two points is calculated using the formula (4)
where:
d(xi, xj) : Euclidean distance between object i and object j
xki : object value to-i on variable k
xkj : object value to-j on variable k
z : variable to z, z = 1, 2, 3, …, p
Dendrogram
Dendrograms are mathematical and visual representations of the clustering procedure performed using hierarchical cluster analysis. The shape of a dendrogram is identical to that of a tree diagram. The points on the dendrogram represent Clusters, while the bar length represents the distance at which objects are combined in the Cluster. The dendrogram will be cut to find out the number of clusters formed from the longest difference. An example of a dendrogram shape is presented in Figure 1.
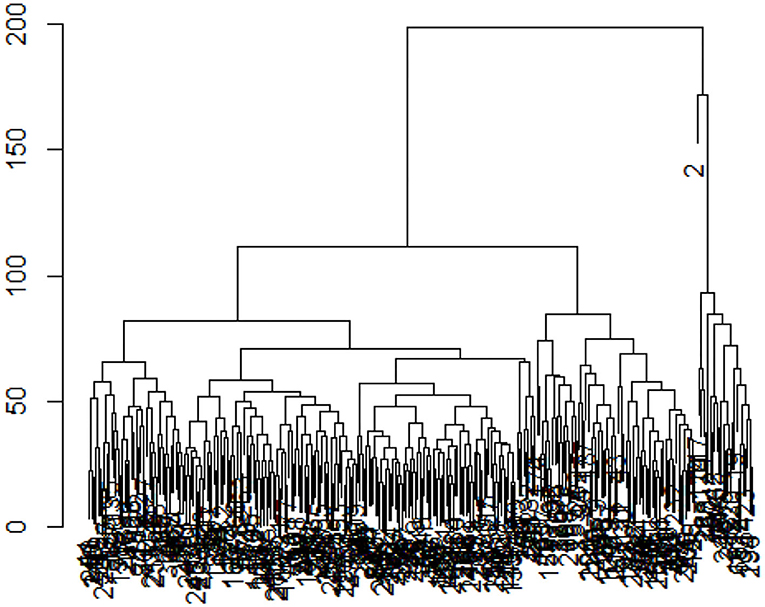
Figure 1. Dendrogram.
Path Analysis
The analysis used to overcome the direct, indirect, or total influence of the predictor variables on the response variables in a model is called a path analysis. The method in path analysis is a development that requires the input of correlation coefficients between variables that have been previously analyzed [12]. To formulate hypothesis testing applied form of multiple regression analysis of the relationship between complex variables is one of them with path analysis. In path analysis, correlations between variables are related to the parameters of the model which are represented by path diagrams. The path analysis technique is a development of the correlation technique developed by Sewall Right. Path analysis is used if theoretically,
Path Analysis Assumptions
Solimun [13] describes five assumptions that underlie path analysis, namely:
1) The relationship between variables is linear and additive. The assumption of linearity can be checked with a scatter plot, but the results will be subjective. Another way of checking the assumption of linearity is with the Regression Specification Error Test (RESET) introduced by Ramsey in 1969.
2) The remainder is normally distributed.
3) The pattern of relationship between variables is recursive (one-way causal flow system). The characteristics of the recursive model are:
(a) Free each other.εi
(b) Between and each Xi are independent of each other.εi
4) Minimum endogenous variable in interval measuring scale.
5) Research variables were measured without error (valid and reliable research instrument).
6) The analyzed model is specified based on the relevant theories and concepts.
Cluster Integration With Path Analysis
Cluster analysis aims to group objects so that between groups are heterogeneous and between objects in each group are homogeneous. Next, path analysis is performed by testing the path analysis assumptions. Furthermore, the estimation of the cluster integration model with path analysis is carried out. Cluster integration with path analysis is used to determine how much influence a group has directly, indirectly, or the total number of predictor variables (exogenous) on response variables (endogenous) in a model.
The Cluster integration model in path analysis is written in equations (5) and (6), if there are many Clusters 3:
Normality Test
The tests of normality can be sub-divided into two categories which are descriptive statistics and theory driven methods [14]. Skewness and kurtosis coefficients are categorized as descriptive statistics whereas theory-driven methods include the normality tests, such as Shapiro Wilk (SW), Kolmogorov-Smirnov (KS), and Anderson-Darling (AD) tests. The Kolmogorov-Smirnov test is arguably the most well-known test for normality.
Suppose that the sample consist of n ordered data points, x1 < x2 < … < xn. The cumulative distribution of the data is a step function where the step is between and at each xk. Drezner et al., [15] defined Kolmogorov test statistics as
with is the cumulative normal distribution at xk with given mean μ and variance σ2
Attitude
Attitude is a person's personality that can influence the choice and action of something. According to Mar'at [16], attitudes are actions and behaviors that are determined by one element of personality toward an object with good or bad feelings. Individual perceptions of the attitude object will be influenced by two factors, namely internal factors or individual factors and external factors or external factors. Internal factors are physiological and psychological while external factors can be in the form of experience, knowledge, teaching, and learning process situations faced by individuals, norms that exist in society, obstacles, or drivers in society.
Subjective Norms
According to Ajzen [17], subjective norms are a person's beliefs about the approval of others for action. The other person is called a referent and can be a parent, friend, or someone who is considered important to someone. According to Fishbein and Azjen in Triastity and Saputro, subjective norms generally have the following two components:
a. Normative beliefs
Perceptions or beliefs about other people's expectations of themselves become a reference for displaying behavior or not. Beliefs are related to the opinion of a character or other person who is important and influential for the individual or the role model whether the subject should or should not perform a certain behavior.
b. Motivation to comply
Individual motivation to meet these expectations. Subjective norms can be seen as dynamics between the impulses perceived by individuals from the people around them and the motivation to follow their views (motivation to comply) in doing or not doing the behavior.
Behavior Control
Goleman [18], Self-control is a careful and intelligent attitude in managing life, balance, and controlled policies, and the goal is to balance emotions, not suppress emotions, because every feeling has value and meaning. According to Calhoun and Acocella [19], there are three aspects of self-control, namely:
1) Behavior control (Behavior Control).
2) It is a person's readiness or ability to modify an unpleasant situation. The ability to control behavior, in this case, is the ability to determine who is in control of the situation, himself, others, or something outside himself.
3) Cognitive control (Cognitive control).
4) The individual's ability to manage unwanted information by interpreting, assessing, or integrating an event in a cognitive framework as a psychological adaptation or to reduce stress.
5) Control in making decisions (Decision-making).
6) The ability to choose an action based on something believed or agreed upon.
Obedient Intention to Pay
The compliance in question relates to the taxpayer correctly calculating the tax payable, paying taxes on time, and reporting all information on time. Jamin in Anisa reveals that the level of compliance of corporate taxpayers is better than individual taxpayers. This can happen because most of the corporate taxpayers use the services of a consultant in dealing with corporate tax problems, while the individual taxpayers take care of their own tax problems. The indicators used in this study which replicates from Bambang & Widi [20] are:
1. Tendency to behave obediently and pay
2. The decision to obey and pay
Obedient Paying Behavior
According to Budiono [21] behavior is a reaction or human action caused by an impulse that is seen from values, habits, driving forces, motives, and restraining forces as a person's response or reaction that appears. This is due to the experience of the process of stimulation and learning from the environment. According to Sulistiyono [22], obedience is an attitude that is willing to do whatever it is based on self-awareness or coercion that causes behavior according to what is expected or not. Obedient behavior is the interaction of individual, organizational, and group behavior. Obedience to pay is defined as a person's actions caused by self-awareness and coercion to pay their obligations.
Research Methods
The data used in this study is primary data. The variables used in this study are as follows: attitude, subjective norm, behavioral control, intention to comply with paying, and obedient behavior to pay at Bank X. The data were obtained through a questionnaire with a Likert scale. The variables in primary data were measured using the average score of each item. The sampling technique used is purposive sampling. The object of observation is the customer, as many as 100 respondents. The sample selection of 100 customers is because it follows the central limit theory which says that the sampling distribution curve (for a sample size of 30 or more) will center on the population parameter values and will have all the properties of a normal distribution.
This study uses 3 exogenous variables, namely the attitude variable (x1), subjective norm (x2), behavioral control (x3), and uses 2 endogenous variables, namely the obedient paying behavior variable (y1) and the obedient paying intention variable (y2). The path diagram for this research is presented in Figure 2.
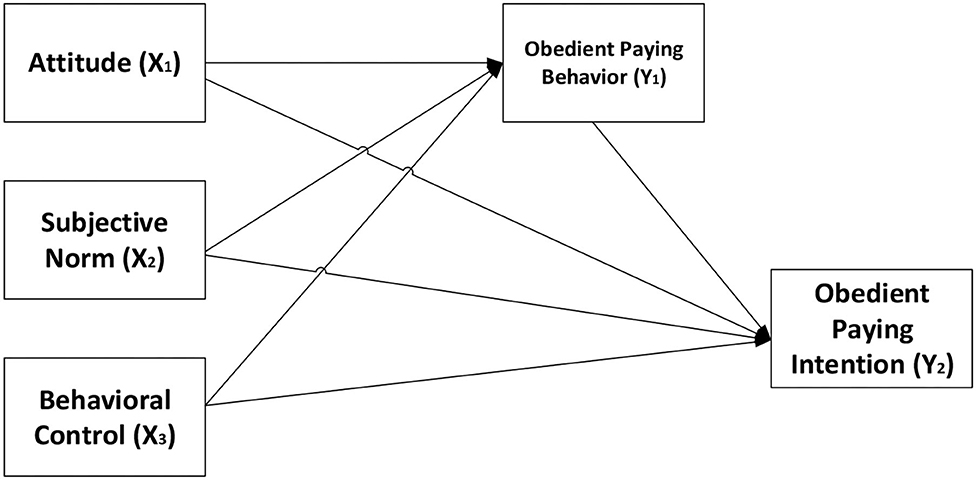
Figure 2. Research path diagram.
Results and Discussion
Cluster Analysis
Linkages used in this study are Ward, Average, and Complete linkages. The distance between clusters were measured using Euclidean distance. The best number of clusters were determined using a dendrogram. The following are the results of the cluster on each method.
a) Ward linkage method
From Table 1, it can be seen that there are 44 members in Cluster 1, 30 in Cluster 2, and 26 in Cluster 3.
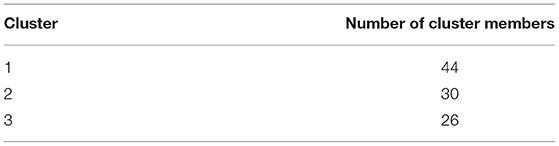
Table 1. Number of members in each cluster of the ward linkage method.
Ward linkage method obtained as many as 2 dummy variables, where the dummy variable 1 will be worth 1 when the data set is in Cluster 2 and 0 for the other Clusters. The dummy variable 2 will be 1 when the data set is in Cluster 3 and 0 for the other Clusters.
b) Complete linkage method
From Table 2, it can be seen that there are 13 members in Cluster 1, 80 in Cluster 2, and 7 in Cluster 3.
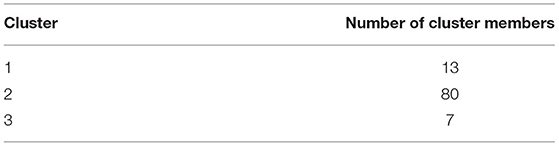
Table 2. Number of members in each cluster of the complete linkage method.
Complete linkage method obtained as many as 2 dummy variables, where the dummy variable 1 will be worth 1 when the data set is in Cluster 2 and 0 for other Clusters. The dummy variable 2 will be 1 when the data set is in Cluster 3 and 0 for other Clusters.
c) Average linkage method
Based on the resulting dendrogram, the clusters formed by the Average linkage method are 2 clusters. The table of the number of members in each cluster is presented in Table 3.
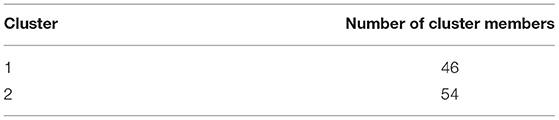
Table 3. Number of members in each cluster of average linkage method.
From Table 3 it can be seen that there are 46 members in Cluster 1 and 54 in Cluster 2. From the Average linkage method, it can be seen that the dummy variable is 1, where the dummy variable will be worth 1 when the data set is in Cluster 2 and 0 for the Cluster.
Assumption Test
Linearity Assumption Test
The results of the linearity assumption test can be seen briefly in Table 4.
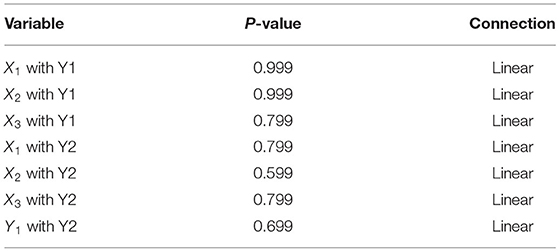
Table 4. Linearity test results.
Based on Table 4, it can be seen that the relationship between exogenous and endogenous variables produces a p-value = 0.05 so that the decision to accept H0 means that the relationship between variables is linear 0.> α
Residual Normality Assumption Test
The results of testing the normality assumption can briefly be seen in Table 5.
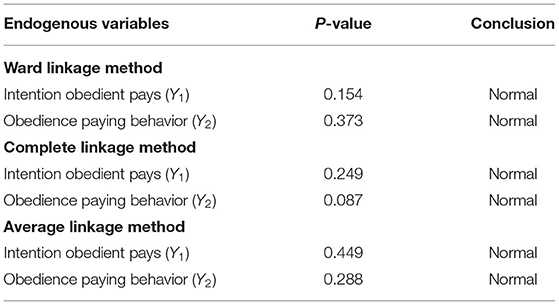
Table 5. Remaining normality assumption test results.
Based on Table 5, it can be seen that the statistical normality test with Kolmogorov-Smirnov test of the remainder of the equation and in all methods produces an α value more than = 0.05 so that it can be said that the remainder is normally distributed.
Testing the Assumption of Homogeneity of Residual Variety
The variance of the remainder of an equation must be constant or homogeneous. The test results can be seen in Table 6.
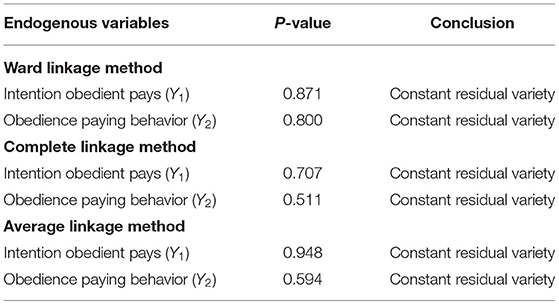
Table 6. Result of homogeneity test of residual variety.
Cluster Integration With Dummy Variables With Path Analysis Approach
The integrated cluster model in the path analysis obtained is then separated according to each cluster.
Integrated Cluster Model in Ward Linkage Method Path Analysis
Ward linkage method produces 3 clusters that separate each data set optimally. Then the model formed is like Equations (8) and (9) as follows.
Cluster low (D1 = 0 and D2 = 0) can be seen in Equations (10) and (11).
Cluster moderate (D1 = 1 and D2 = 0) can be seen in Equations (12) and (13).
Cluster height (D1 = 0 and D2 = 1) can be seen in Equations (14) and (15).
Integrated Cluster Model in Path Analysis Complete Linkage Method
The complete linkage method produces 3 clusters that separate each data set optimally. Then the model formed is like Equations (16) and (17) as follows.
Cluster low (D1 = 0 and D2 = 0) can be seen in (18) and (19).
Cluster medium (D1 = 1 and D2 = 0) can be seen in Equations (20) and (21).
Cluster height (D1 = 0 and D2 = 1) can be seen in Equations (22) and (23).
Integrated Cluster Model on Path Analysis Average Linkage Method
The Average linkage method produces 2 clusters that separate each data set optimally. Then the model formed is like Equations (24) and (25) as follows.
Cluster low (Di = 0) can be seen in Equations (26) and (27).
Cluster height (Di = 1) can be seen in Equations (28) and (29).
Selection of the Best Linkage From Model Validity
The selection of the best linkage and model validity is by choosing the model that has the largest R2 total, as in the equation, which can be briefly seen in Table 7 as follows.
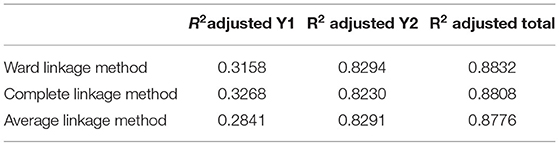
Table 7. Score R2adjusted on each model.
By Table 7 The R2 adjusted value of the Cluster integration path analysis with the Ward linkage method produces an adjusted value of 0.3158, meaning that the variables of attitude, subjective norms, and behavioral control, are able to explain the diversity of the variable intention to comply with paying by 31.58%, while the other 68.42% are influenced by variables outside the model. The R2 adjusted value of the Cluster integration path analysis with the Ward linkage method produces an adjusted value of 0.8294, meaning that the variables of attitude, subjective norms, behavior control, and intention to comply with paying are able to explain the diversity of variables of obedient paying behavior by 82.94%, while the other 17.06% are influenced by variables outside the model. The coefficient of R2 total determination of the Cluster integration path analysis model with the Ward linkage method is 0.8832.
The R2 adjusted value of the Cluster integration path analysis with the Complete linkage method produces an adjusted value of 0.3268, meaning that the variables of attitude, subjective norms, and behavior control, are able to explain the diversity of the variable intention to comply with paying by 32.68%, while the other 67.32% are influenced by variables outside the model. The R2 adjusted value of the Cluster integration path analysis with the Complete linkage method produces an R2 adjusted value of 0.8230, which means that the variables of attitude, subjective norms, behavioral control, and intention to comply with paying are able to explain the diversity of variables of obedient paying behavior by 82.30%, while the other 17.70% are influenced by variables outside the model. The coefficient of R2 total determination of the Cluster integration path analysis model with the Complete linkage method is 0.8808.
The R2 adjusted value of the Cluster integration path analysis with the Average linkage method produces an adjusted value of 0.2841 meaning that the variables of attitude, subjective norms, and behavior control are able to explain the diversity of the variable intention to comply with paying by 28.41%, while the other 71.59% is influenced by the variable outside the model. The R2 adjusted value of the Cluster integration path analysis with the Average linkage method produces an adjusted value of 0.8291, meaning that the variables of attitude, subjective norms, behavior control, and intention to comply with paying are able to explain the diversity of variables of obedient paying behavior of 82.41%, while the other 17.59% influenced by variables outside the model. The R2 coefficient of total determination of the Cluster integration path analysis model with the Average linkage method is 0.8776.
Based on Table 7, the path analysis model with Cluster integration with the Ward linkage method has the greatest total determination value so that the path analysis with Cluster integration with the Ward linkage method is the best model. The total determination value of 88.32% is considered very good to describe the model.
Best Model
From the results of the R2 adjusted integrated cluster on path analysis with the Ward method, it has the highest R2 adjusted value, where the Ward method consists of 3 clusters. For the Ward linkage method with 44 Cluster 1, 30 Cluster 2, and 26 Cluster 3. If the average variables for each Cluster are compared, it is found that most of Cluster 3 has the highest average value compared to other Clusters, so that Cluster 3 is a high Cluster. While Cluster 1 has the lowest average value compared to other Clusters, so Cluster 1 is a low Cluster. The mean value and standard deviation for each cluster are presented in Table 8.
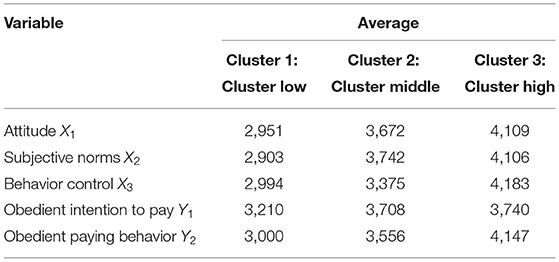
Table 8. Average score of each cluster.
Based on Table 8, it can be seen that most of the customers have a good attitude in the high and medium clusters, but in the low cluster, most of the customers have a fairly good attitude. For the subjective norm variable, most customers have good subjective norms in the high and medium clusters, but in the low cluster, most customers have fairly good subjective norms. For behavioral control variables, most customers have good behavioral control in high and medium clusters, but in low clusters, most customers have fairly good behavioral control. For the variable of intention to comply with paying, most of the customers have good intention to comply with paying in high and medium clusters, but in the low Cluster, most of the customers have a fairly good intention to pay compliance. For the obedient paying behavior variable, most of the customers have good paying obedient behavior in the high and medium clusters, but in the low cluster, most of the customers have good paying obedient behavior.
Parameter Linear Function Hypothesis
Testing the path coefficients simultaneously through the Testing of the Parameter Linear Function Hypothesis (HFLP) as described in section 8 with the following hypotheses:
a) Direct influence
1) H0 : β11 + β14 = 0 vs. H1 : β11 + β14 ≠ 0
2) H0 : β11 + β15 = 0 vs. H1 : β11 + β15 ≠ 0
3) H0 : β12 + β16 = 0 vs. H1 : β12 + β16 ≠ 0
4) H0 : β12 + β17 = 0 vs. H1 : β12 + β17 ≠ 0
5) H0 : β13 + β18 = 0 vs. H1 : β13 + β18 ≠ 0
6) H0 : β13 + β19 = 0 vs. H1 : β13 + β19 ≠ 0
b) Indirect influence
1) H0 : β21 + β25 = 0 vs. H1 : β21 + β25 ≠ 0
2) H0 : β21 + β26 = 0 vs. H1 : β21 + β26 ≠ 0
3) H0 : β22 + β27 = 0 vs. H1 : β22 + β27 ≠ 0
4) H0 : β22 + β28 = 0 vs. H1 : β22 + β28 ≠ 0
5) H0 : β23 + β29 = 0 vs. H1 : β23 + β29 ≠ 0
6) H0 : β23 + β210 = 0 vs. H1 : β23 + β210 ≠ 0
7) H0 : β24 + β211 = 0 vs. H1 : β24 + β211 ≠ 0
8) H0 : β24 + β212 = 0 vs. H1 : β24 + β212 ≠ 0
Based on Tables 9, 10, it can be seen that the calculated F-value > F(0.05;2;98)(3.089) resulted in the rejection of H0 so that it can be concluded that there is an influence on the path. There is a non-significant path on the intention to comply with paying and obedient behavior to pay with a dummy or not with a dummy.
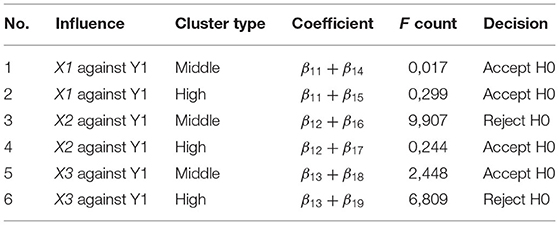
Table 9. Parameter linear function hypothesis (HFLP) direct influence.
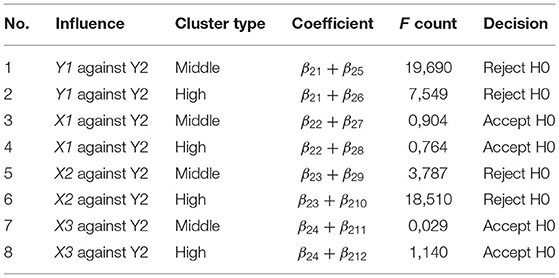
Table 10. HFLP indirect effect.
Conclusion and Suggestions
The conclusion that can be given based on the results of the analysis is that the application of integrated clusters in path analysis with various linkage methods results in many clusters and different cluster members causing the dummy variables formed to be different, thus affecting the value of R2. The best result of the R2 value is the integrated Cluster model with the Ward linkage method.
Some suggestions that can be given are based on the results of the integrated cluster in this path analysis, namely, for further research, it is expected to use integrated clusters with simulations, to obtain maximum R2 results and produce significantly different R2 values. The results of this study can be used by Bank 'X' in determining the category of customer credit by grouping customers into Clusters that have been obtained and then conducting path analysis.
Data Availability Statement
The original contributions presented in the study are included in the article/supplementary material, further inquiries can be directed to the corresponding author/s.
Ethics Statement
Ethical review and approval was not required for this study in accordance with the local legislation and institutional requirements. The participants provided their written informed consent to participate in this study.
Author Contributions
All authors listed have made a substantial, direct, and intellectual contribution to the work and approved it for publication.
Conflict of Interest
The authors declare that the research was conducted in the absence of any commercial or financial relationships that could be construed as a potential conflict of interest.
Publisher's Note
All claims expressed in this article are solely those of the authors and do not necessarily represent those of their affiliated organizations, or those of the publisher, the editors and the reviewers. Any product that may be evaluated in this article, or claim that may be made by its manufacturer, is not guaranteed or endorsed by the publisher.
References
1. Fernandes AAR. Moderating effects orientation and innovation strategy on the effect of uncertainty on the performance of business environment. Int J Law Manag. (2017) 59: 1211–9. doi: 10.1108/IJLMA-10-2016-0088
3. Fernandes AAR, Budiantara INI, Otok BW, Suhartono S. Reproducing Kernel Hilbert space for penalized regression multi-predictors: Case in longitudinal data. Int J Math Anal. (2014) 8:1951–61. doi: 10.12988/ijma.2014.47212
4. The University Information Technology Services (UITS) Center for Statistical and Mathematical Computing, Indiana University Solimun. Multivariate Analysis – Structural Equation Modelling (SEM) Lisrel dan Amo. Malang (2002).
6. Sudaryono S. Aplikasi analisis (Path Analysis) berdasarkan urutan penempatan variabel dalam penelitian. Jurnal Pend Kebud. (2011) 17:391–403. doi: 10.24832/jpnk.v17i4.36
7. Suryani L, Yushita AN. The Influence of Attitudes, Subjective Norms, and Perceived Behavioral Controls on Individual Taxpayer Compliance in the Special Region of Yogyakarta with Intentions to Comply with Taxes as Moderating Variables. Profita Journal: Study of Accounting Science, (2017) 5:40–41. Available online at: http://repository.stie-mce.ac.id/id/eprint/206
8. Johnson RA, dan Wichern DW. Applied Multivariate. Analysis. Upper Saddle River, NJ: Prentice Hall (2007).
9. Fernandes S, Rinaldo AARAA. The mediating effect of service quality and organizational commitment on the effect of management process alignment on higher education performance in Makassar, Indonesia. J Organ Chang Manag. (2018) 31:410–25. doi: 10.1108/JOCM-11-2016-0247
10. Purbawangsa IBA, Solimun S, Fernandes AAR, Rahayu SM. Corporate governance, corporate profitability toward corporate social responsibility disclosure and corporate value (comparative study in Indonesia, China and India stock exchange in 2013-2016). Soc. Respon. J. (2019) 16:983–99. doi: 10.1108/SRJ-08-2017-0160
11. Chavent M, Lechevallier Y, Briant O. DIVCLUS-T: a monothetic divisive hierarchical clustering method. Comp Stat Data Anal. (2007) 52:687–701. doi: 10.1016/j.csda.2007.03.013
12. Nurkuntari Y, Fauzi F, Darsyah MY. Path Analysis of Factors Affecting Human Development Index. Value Added. Economics And Business Magazine (2016) 12. Available online at: https://jurnal.unimus.ac.id/index.php/vadded/article/view/3373
13. Solimun. Analisis Multivariat Pemodelan Struktural Metode Partial Least Square –PLS. Malang, CV: Citra Malang (2010).
14. Park HM. Univariate Analysis and Normality Test Using SAS, Stata, and SPSS. Bloomington, IN: Technical Working Paper (2008).
15. Drezner Z, Turel O, Zerom D. A modified kolmogorov–smirnov test for normality. Commun Stat Simul Comput. (2010) 39:693–704. doi: 10.1080/03610911003615816
18. Daniel G. Emotional Intelligence. Jakarta: PT Gramedia Pustaka. Utama. Hurlock, Elizabeth B (2001).
19. Calhoun JF, Acocella JR. Psikologi Tentang Penyesuaian Dan Hubungan Kemanusiaan. Semarang: IKIP Press (1990).
20. Bambang and Widi. Pengaruh Sikap, Norma Subjektif, Kontrol Perilaku yang dipersepsikan dan Sunset Policy Terhadap Kepatuhan Wajib Pajak dengan Niat Sebagai Variabel Intervening (2010).
21. Budiono D. Perilaku Wajib Pajak Badan Dalam Memenuhi Kewajiban. Perpajakan: Perspektif Teori Humanistik (2016).
Keywords: cluster, integration, linkage, path analysis, paying, behavior
Citation: Fernandes AAR and Solimun S (2022) Comparison of the Use of Linkage in Cluster Integration With Path Analysis Approach. Front. Appl. Math. Stat. 8:790010. doi: 10.3389/fams.2022.790010
Received: 05 October 2021; Accepted: 02 May 2022;
Published: 23 August 2022.
Edited by:
Ron S. Kenett, Samuel Neaman Institute for National Policy Research, IsraelReviewed by:
Kazuharu Bamba, Fukushima University, JapanSemere Gebresilasie, Wentworth Institute of Technology, United States
Copyright © 2022 Fernandes and Solimun. This is an open-access article distributed under the terms of the Creative Commons Attribution License (CC BY). The use, distribution or reproduction in other forums is permitted, provided the original author(s) and the copyright owner(s) are credited and that the original publication in this journal is cited, in accordance with accepted academic practice. No use, distribution or reproduction is permitted which does not comply with these terms.
*Correspondence: Adji Achmad Rinaldo Fernandes, ZmVybmFuZGVzQHN0YWZmLnViLmFjLmlk