 Rendani Netshikweta
 Winston Garira
- Modelling Health and Environmental Linkages Research Group, Department of Mathematics and Applied Mathematics, University of Venda, Thohoyandou, South Africa
In this study, we present a nested multiscale model that integrates the within-host scale and the between-host scale disease dynamics for Paratuberculosis in ruminants (e.g., cattle, goats, and sheep), with the aim of ascertaining the influence of initial infective inoculum dose on its dynamics. Ruminant paratuberculosis is often characterized as an environmentally-transmitted disease and it is caused by bacteria called Mycobacterium avium subspecies paratuberculosis that can survive in the physical environment for a considerable period of time. In the context of nested multiscale models developed at host level, a key feature is that the within-host scale and the between-host scale disease dynamics influence each other in a reciprocal way, with the between-host scale influencing the within-host scale through initial infective inoculum dose which susceptible ruminants may consume from the environment. The numerical results of the nested multiscale model presented in this study demonstrate that once the minimum infectious dose is consumed, then the infection at the within-host scale is sustained more by pathogen replication than by super-infection. From these results we conclude that super-infection might have an insignificant effect on the dynamics of PTB in ruminants. However, at this stage we cannot precisely conclude if super-infection does not effect on the dynamics of the disease. This would be investigated further using an embedded multiscale model, which is more appropriate in giving us conclusive results. We further demonstrate the need to use nested multiscale models over single-scale modeling approach by estimating a key parameter for pathogen replication that cannot be estimated using single-scale models.
1. Introduction
Paratuberculosis (PTB) infection, also known as Johne's disease, is an important disease in ruminants such as cattle, goats, and sheep [see [1–3] and references therein] that cannot be easily ignored as its cases continue to be reported throughout the world, more especially in countries with temperate climates. Ruminant Paratuberculosis is often characterized as an environmentally-transmitted disease. PTB is caused by bacteria called Mycobacterium avium subspecies paratuberculosis (MAP) which infects the intestine of ruminants [4]. This organism is most commonly widespread in dairy cattle and can lead to serious economic burdens in livestock industries due to the reduction of milk production and the productive life of cattle as well [5]. The main clinical outcomes of PTB infection in cattle are failure of growth, increase in weight loss, and chronic diarrhea. Although PTB has not been classified as a zoonotic disease, clinical studies show that most human patients with Crohn's disease are found with MAP [6]. Crohn's disease is an inflammatory bowel disease characterized by a persisting, painful, and diarrheal inflammatory disease of the intestinal tract in humans [6]. Ruminants usually acquire PTB infection through ingestion of the infective bacteria in colostrum, and from the faeces of infected ruminants contaminating food and surface water/water troughs. The disease can also be transmitted vertically from an infected pregnant ruminant to its foetus. However, following the ingestion of MAP bacteria contained in faecal material, and reaching the gut of an infected ruminant, MAP are engulfed by macrophages in the submucosal of the ruminant, and the submucosal macrophages become infected [2]. In general, the dynamics of MAP among submucosal macrophages within an infected ruminant can be controlled by the ruminant immune response (such as T-helper immune response cells). Yet, currently there is no meaningful treatment that has been made available for PTB in ruminants, and control programs implemented in many countries have had limited success [7]. It is important to note that at the ruminant host level both the two PTB disease processes: (i) the infection of a ruminant by free-living MAP in the environment and (ii) the shedding of MAP into the environment by an infected ruminant interlink the transmission process of MAP among the ruminants which often happens at a slow time scale and the replication process of MAP within an infected ruminant which often occur at a fast time scale to close the complete multiscale cycle (i.e., the replication-transmission cycle) dynamics of PTB [25].
Multiscale models that characterize infectious disease processes across different scales at different levels of organization of an infectious disease have been developed recently to study disease dynamics [3, 8–14, 21–24]. Some of these multiscale models have further been used to evaluate the comparative effectiveness of different preventive and treatment health interventions that operate at different scales against infections [13, 14]. Based on the categorization in [15, 16], there are five main different categories of multiscale models of infectious disease systems that can be developed at different levels of organization of an infectious disease system (the cell level, the tissue level, the host level, etc.) which are: (i) individual-based multiscale models (IMSMs), (ii) nested multiscale models (NMSMs), (iii) embedded multiscale models (EMSMs), (iv) hybrid multiscale models (HMSMs), and (v) coupled multiscale models (CMSMs). In multiscale modeling of infectious disease systems, knowledge of the different categories of multiscale models is important to understand which multiscale model is most suitable for characterizing disease dynamics at particular levels of organization of an infectious disease system. It is also important for the description of the structure of the multiscale model. It enables authors to describe the structure of the multiscale model in brief by referring to the generic description of the structure of the category of the multiscale model concerned without the need to repeatedly discuss its structure whenever a multiscale model of an infectious disease system is being developed and focus instead on issues peculiar to that multiscale model [16]. In this study we develop a nested multiscale model to study the multiscale dynamics of PTB in ruminants and further use it to enhance a single-scale model that can be developed at host/population/herd level. Nested multiscale models of infectious diseases are mathematical models in which the macroscale sub-model influences the microscale sub-model through the initial value of the inoculum of the infective pathogen. In these nested multiscale models, the microscale also influences the macroscale through pathogen excretion. Further, the macroscale sub-model and the microscale sub-model must be described by the same formalism or mathematical representation for this category of multiscale models. We can identify three main classes in the category of nested multiscale models which are [15, 16]:
(a) Class 1 - Transformation based nested multiscale models (TRAN-NMSMs): Here the microscale scale submodel is formally transformed into a macroscale model. They are formulated through developing microscale structured macroscale submodels. At host level this task is accomplished by subdividing the entire host population into various sub-classes corresponding to the different levels of microscale traits: naive or completely susceptible, completely or partially immune, vaccinated, immune compromised or protected from infection due to certain genetic factors.
(b) Class 2 - Unidirectional coupling based nested multiscale models (UNID-NMSMs): The nature of the multiscale model in this class is such that there is strictly one-way inter-scale information flow among the two submodels (from the microscale submodel to the macroscale submodel).
(c) Class 3 - Simplification based nested multiscale models (SIMP-NMSMs): These are multiscale models of infectious disease systems which are formulated by simplifying or reducing the order/dimensions of UNID-MSMs in class 2 of this category. The simplification or reduction of order is sometimes achieved by using methods such as slow and fast time scale analysis [12] or dynamical systems based methods such as centre manifold theory [17].
In this article, we first develop a class 2 nested multiscale model of PTB disease dynamics in ruminants at host level, and then derive a class 3 nested multiscale model through fast-and-slow time scale analysis of the class 2 nested multiscale model. For the host level of organization of an infectious disease system, the within-host scale (the microscale) sub-model and the between-host scale (the macroscale) sub-model serve as building blocks in the development of the complete nested multiscale model [16]. For PTB infection in ruminants, the within-host scale on one hand is associated with the interaction of MAP with ruminant macrophages (target cells) and other immune response cells that happens inside an infected ruminant. It is at this scale where the outcomes of infection within a single infected ruminant determine if, when and how much the ruminant will further transmit the bacteria into the environment, and in turn affecting the spread of the disease for the ruminant at between-host scale. The processes of PTB infection at the within-ruminant-host can be modified by the within-host conditions and medical interventions. The between-host scale disease processes on the other hand, however, are associated with the transmission dynamics of MAP bacteria that typically occurs between ruminants and their environment. This takes place when ruminants feed from contaminated pasture with fecal material containing infective MAP, or drink from contaminated surface water/water troughs with the bacteria. The processes of disease transmission at the between-ruminant-host scale can be modified by control measures such as reducing fecal contamination of food, water and pasture (which can be achieved by raising feed and water troughs, strip grazing, or use of mains/piped water rather than surface/pond water); avoid spreading yard manure on pasture; and maintain proper hygiene practices particularly in buildings/yards and calving boxes [18].
To date, most of PTB disease dynamics models in the literature have been devoted to study the dynamics of PTB infection in ruminants and evaluating the effect of control measures aimed at controlling, eliminating, and even eradicating this disease using a single-scale modeling approach [1, 19, 20]. This is despite the fact that PTB infection is a complex and multiscale disease system. However, we have to date, witnessed the development of few models in the literature that consider the complexity and multiscale nature of PTB infection in attempting to study its dynamics [3, 21–23]. The multiscale models in [3, 21] use the time-since-infection approach to link the within-host sub-model with the between-host sub-model for PTB infection as well as the dependence of some epidemiological parameters on the within-host MAP bacteria load. This coupling principle employed in [3, 21] was suggested for the first time by Gilchrist and Sasaki [24]. In addition, it is also worthy to note that the multiscale models in [3, 21] are categorized as hybrid multiscale models [15, 16]. Although the multiscale models in [3, 21] and the multiscale model developed in this study all characterize the reciprocal influence between the within-host scale and the between-host scale disease dynamics, there are important differences between these multiscale models. Specifically, in the current nested multiscale model, both the within-host scale and the between-host scale sub-models are all described by the same formalism or mathematical representation (i.e., a system of ODEs). However, the multiscale models in [3, 21] are hybrid multiscale models, where only the within-host scale sub-models are represented by ODEs, while their between-host sub-models are represented by partial differential equations (PDEs). The hybrid multiscale models in [3, 21] are more difficult to analyze than nested multiscale models because apart from the fact they incorporate different time scales for the within-host scale and the between-host scale, they also do not use a common metric of disease transmission across scales. At within-host scale, pathogen load is used as the metric for disease transmission while at between-host scale, disease class (i.e., infected class) is used as the metric for disease transmission.
The rest of this paper is organized as follows. In Section 2, we derive and analyze the nested multiscale model for PTB multiscale dynamics. It is in this section where we evaluate the influence of initial infective inoculum on the dynamics of PTB. In Section 3, we estimate a parameter of pathogen replication that cannot be estimated using single-scale models. In Section 4, we analyze the simplified multiscale model of PTB and show that the model is mathematically and epidemiologically well-posed. We also perform a sensitivity analysis of the two ruminant population health measures derived from the simplified multiscale model. The paper ends up with discussion and conclusions in Section 5.
2. Derivation of nested multiscale model for the dynamics of ruminant paratuberculosis (PTB)
For infectious disease systems at host level, the between-host scale sub-model and the within-host scale sub-model are the building blocks upon which multiscale models are developed. In this case, we derive a nested multiscale model that integrates the between-host sub-model associated with the transmission dynamics of PTB disease and the within-host sub-model associated with the replication dynamics of MAP bacteria within an infected ruminant at the site of infection. In the following sections, we begin by presenting two independent sub-models for PTB disease dynamics at two distinct scales, one at the between-host scale and other at the within-host scale and then integrate them into a single multiscale model.
2.1. The between-host scale submodel for the PTB multiscale model dynamics
The between-host scale submodel for the multiscale dynamics of PTB in ruminants is described by a susceptible-infected-susceptible-infected, SIS, model coupled with the compartment of the MAP environmental dynamics, BC, that depicts the evolution of bacteria in the environment. The description of model variables associated with the transmission cycle of PTB at the between-host scale are tabulated in Table 1. We make the following assumptions for this sub-model:
(a) The transmission of the infection is only through contact with MAP bacterial load (BC) in the physical environment. However, if there is any direct transmission, it can be estimated by indirect transmission in terms of environmental MAP bacterial load (BC).
(b) The dynamics of SC, IC, and BC are assumed to occur at slow time scale, t, compared to the within-host scale PTB transmission dynamics variables that occur at fast time scale, τ, so that SC = SC(t), IC = IC(t), and BC = BC(t).
(c) The different classes that the infected ruminant progresses through (e.g., the exposed class, the chronically infected class, etc.) are accounted for by the within-host scale sub-model.
(d) The average extracellular MAP bacteria in each infected ruminant is modeled phenomenologically by , which is a proxy for individual ruminant infectiousness.
(e) The environmental MAP bacterial (BC) do not replicate in the environment (outside-host environment).
(f) ruminant with MAP can recover from PTB infection.
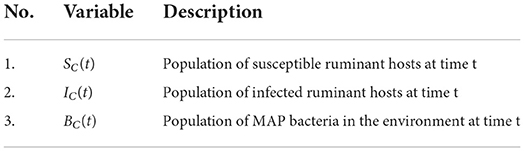
Table 1. A summary of the variables associated with the transmission cycle of PTB at the between-host scale.
Based on these assumptions the sub-model for the PTB transmission dynamics at the between-host scale becomes:
The between-host scale submodel given by Equation (2.1) is based on monitoring the dynamics of three populations which are susceptible ruminants (SC), infected ruminants (IC), and MAP bacterial load (BC) in the physical environment. The first equation of the model system (2.1) describes the dynamics of susceptible ruminants. At any time t, new recruits of susceptible ruminants enter the ruminant population through birth and incoming ruminants from different farms/geographical regions at a constant rate ΛC and is also increased through recovery of infected individuals at a rate , with Bc being the population of the within-ruminant-host MAP bacteria at time τ. This population losses individuals due to natural death at a constant rate μC. The susceptible population also decreases through infection at a rate βCBC(t)/(B0+BC(t)) with βC being the exposure rate to infective MAP bacterial load (BC) in the environment and B0 is the saturation parameter of the bacteria that yield 50 percent chance of a ruminant getting infected with PTB infection after ingesting the bacteria. The infection happens when susceptible ruminants feed from contaminated pasture with faecal material containing infective MAP, or drink from contaminated surface water/water troughs with the bacteria. The second equation in the model system (2.1) describes the dynamics of PTB infected ruminants. This population increases through infection of susceptible ruminants and decreases through natural death at a constant rate μC as well as through recovery at a rate . There is additional death at a rate in the population of infected ruminants due to disease, so that an average lifespan of PTB infected ruminant in the population is . We assume that infected ruminants spread the disease through contaminating the environment at a rate , where models phenomenologically the average number of the within-host scale MAP bacterial load available for excretion into the environment by each infected ruminants at a rate αc. Therefore, the population dynamics of MAP bacilli in the environment, described by the last equation of the model system (2.1), increases following excretion of MAP bacteria by infected ruminant hosts in faecal material into the environment at a rate . This population of MAP bacilli in the environment is assumed to decrease due to natural death at a rate αC. However, from the single model system (2.1), we note that is treated as a single value parameter. But in reality is a composite parameter that summaries the bacterial dynamics within an infected individual ruminant, and this makes the single-scale model system (2.1) to be unrealistic. We also note that it is not easy to estimate using a single-scale models. However, an alternative approach for estimating is to use a nested multiscale model. In the next section, we derive a within-host scale submodel for estimating . The description of model variables associated with the transmission cycle of PTB at the between-host scale are tabulated in Table 1.
2.2. The within-host scale submodel for the PTB multiscale model dynamics
For the derivation of the current nested multiscale model for PTB in ruminants considered in this study, the within-host submodel dynamics is adopted from a more elaborative single-scale model framework from the work by Magombedze et al. [2] with minor modifications which are based on multiscale considerations. However, the main multiscale consideration incorporated into the model in [2] is the excretion/shedding rate αc, which is an important multiscle consideration since in general the within-host scale sub-model is linked to the between-host scale sub-model through pathogen shedding/excretion [15]. The resulting within-host model describes the interactions of six populations: susceptible macrophages (Mϕ) which are target cells, infected macrophages (Im) which are macrophages which have internalized extracellular MAP bacteria cells, MAP bacterial load (Bc) at the extracellular environment, naive CD4+ T cells (T0), Th1 immune response cells (T1), and Th2 phenotype immune response cells (T2) [see the work in [2]]. We also modify the model in [2] by making the following assumptions:
(a) Transmission of the infection between cells is only through contact with the extracellular MAP bacterial load Bc in the extracellular environment at the site of infection.
(b) The within-host scale disease processes happen at fast time scale, τ, compared to the between-host scale PTB submodel variables so that Mϕ = Mϕ(τ), Im = Im(τ), Bc = Bc(τ), T0 = T0(τ), T1 = T1(τ), and T2 = T2(τ).
(c) The extracellular MAP bacterial load modeled mechanistically by Bc = Bc(τ) is a proxy for individual ruminant infectiousness.
(d) The extracellular MAP bacteria does not replicate outside the macrophage cells of an individual ruminant.
(e) The depletion of MAP bacteria in the extracellular environment through engulfment by macrophages is negligible.
These assumptions lead to the following submodel of ordinary differential equations for the within-host scale PTB transmission dynamics:
In the within-host scale sub-model (2.2), the first two equations describe the dynamics of the within-ruminant-host macrophage population which is divided into two groups. The first group is of susceptible macrophage cells Mϕ(τ) (these are macrophages which are healthy and are susceptible to the Paratuberculosis at the site of infection). The second group is of infected macrophage cells Im(t) (these are macrophages which are infected by the MAP bacteria). We assume that, at any time τ, new macrophage recruits enter the population of susceptible macrophages through the supply of macrophage cells from progenitor monocytes that are recruited from the blood to the site of infection at a constant rate Λϕ and this population loses individuals due to natural death at a constant rate μϕ. Susceptible macrophages acquire infection through engulfing extracellular MAP bacilli bacteria at a rate βϕ. We assume that in the population of infected macrophages experiences additional death due to bursting of infected cells at a rate km and due to cell removal by T1 immune response at a rate γm. In addition, when infected macrophages burst at constant rate km, they are assumed to release an average number of intracellular MAP bacilli Nm into the extracellular environment, so that the total number of intracellular bacteria released into the extracellular environment is NmkmIm. The third equation of the model system (2.2) describes the changes in time of the population size of MAP bacteria in the extracellular environment which is generated following the release of the intracellular MAP bacilli into the extracellular environment when each infected macrophage bursts. We assume that the population of MAP bacteria in the extracellular environment decays naturally at a constant rate μc and are excreted out of the body of infected ruminant into the physical environment through feces at a constant rate αc. The last three equations of the model system (2.2) describe the evolution in time of the population of ruminant immune response cells at the site of infection in the gut which are naive CD4+ T cells (T0), and the two subsets of the MAP specific immune response, Th1 (T1) and Th2 (T2) cells [see [2] and reference therein]. The population of naive CD4+ T cells (T0) for MAP bacilli are produced at a constant rate Λ0 from the thymus. We assume that these naive CD4+ T cells decay naturally at a rate μ0. Following the work in [2], we assume that T0 cells become T1 or T2 immune response cells at per capita rates δm and δb, respectively. Thus, the population of T1 and T2 immune response cells are proliferated at a rate θ1δmImT0 and θ1δbBmT0, respectively. We assume that both the population of T1 and T2 immune response cells decay naturally at rates μ1 and μ2, respectively. The description of model variables associated with the replication cycle of PTB at the within-host scale are tabulated in Table 2.
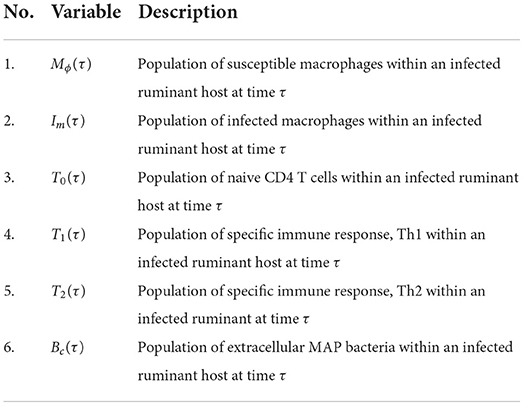
Table 2. A summary of the variables associated with the replication cycle of PTB at the within-host scale.
2.3. Integration of the between-host and within-host submodels of PTB dynamics into a nested multiscale model
In the previous two subsections we presented the two submodels for the dynamics of PTB infection [between-host submodel (2.1) and within-host submodel (2.2)] that separately describe the two key processes of PTB disease dynamics (transmission and replication of MAP bacteria processes) which occur at two distinct scales (within-host scale and between-host scale). We now integrate them into a single multiscale model as shown in flow diagram in Figure 1. We achieve this by replacing the parameter which phenomenologically models within-host scale pathogen replication by a variable Bc(τ) which mechanistically models the within-host scale pathogen replication to get:
Based on the categorization of multiscale models of infectious disease systems presented in [15, 16], the multiscale model for PTB disease dynamics given by (2.3) falls in the category of nested multiscale models of class 2.
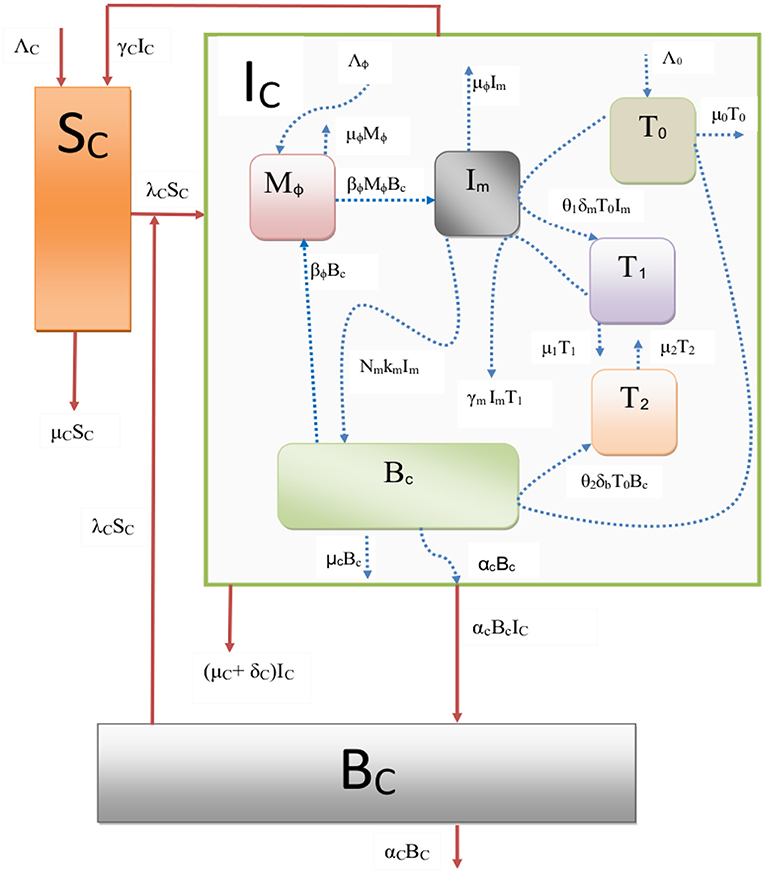
Figure 1. A schematic representation of the nested multiscale model of paratuberculosis disease in ruminants, with λC = βCBC/(B0+BC).
2.4. Analysis of the multiscale model using fast-low time-scale analysis
We note from the full nested multiscale model system given by (2.3) has two different time scales involved which are the between-host time scale (t) associated with the transmission dynamics of PTB at the population level and the within-host time scale (τ) associated with the replication dynamics of PTB infectious agent at an individual ruminant level. This makes the analysis of the full nested multiscale model system (2.3) more difficult to perform. However, the analysis of the multiscale model system (2.3) can be simplified by expressing the slow time-scale and the fast time-scale in terms of each other by using the relationship t = ϵτ, where 0 < ϵ ≪ 1 and ϵ being a constant highlighting the fast time-scale dynamics of the within-host model compared to the slow time-scale of the between-host scale dynamics. We further assume the constant rate of recovery and constant disease-induced death rate of infected ruminants so that and , so that the full nested multiscale model system (2.3) becomes:
In the next two sub-sections, we assess through numerical simulations the full nested multiscale model system given by equation (2.4) to ascertain the reciprocal influence between the between-host scale and the within-host scale dynamics of PTB infection. We achieve this by demonstrating (i) the influence of the between-host scale on the within-host scale through the initial infective inoculum that susceptible ruminants may acquire by interacting with MAP bacteria in contaminated environment, and (ii) the influence of the within-host scale parameters on the between-host disease dynamics. The parameter values used for simulations are tabulated in Table 3. In addition, initial values used for simulations for the full nested multiscale model system (2.4) are as follows: SC(0) = 2, 000, IC(0) = 5, Bc(0) = 10, Mϕ(0) = 500, Im(0) = 0, T0(0) = 0, T1(0) = 0, T2(0) = 0, BC(0) = 1, 000.
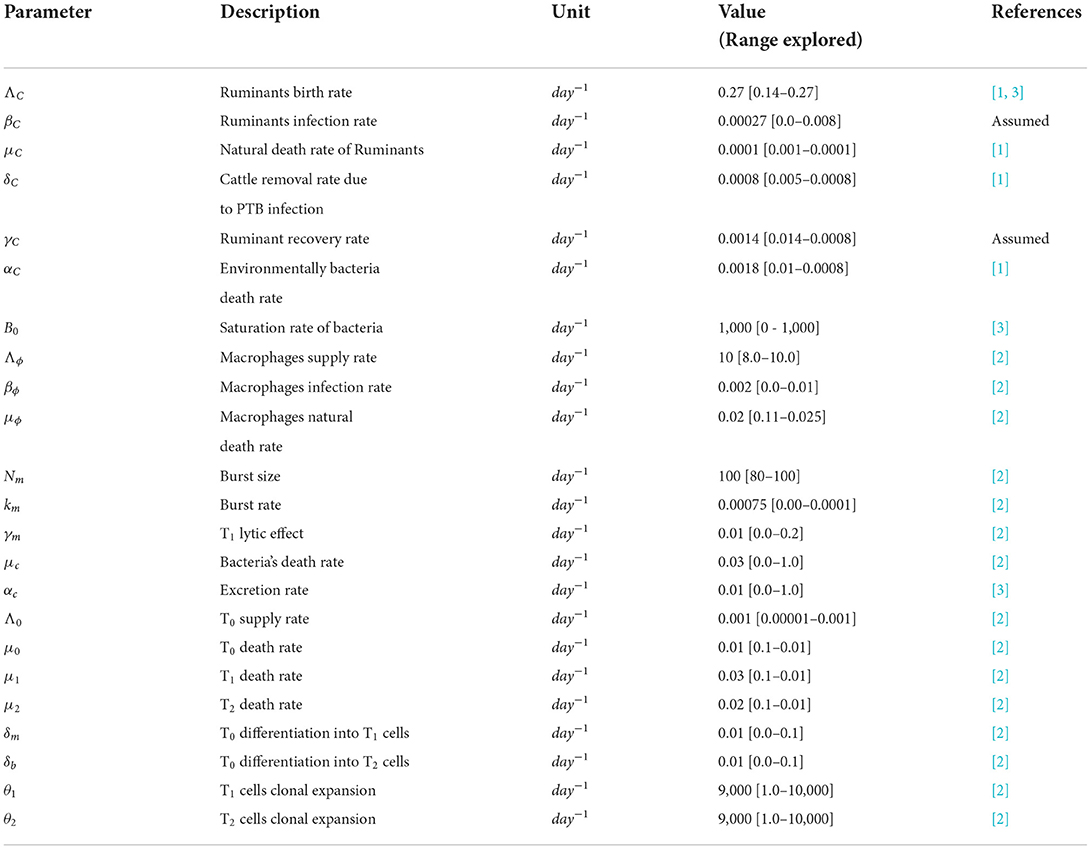
Table 3. Model parameter values used for simulations.
2.4.1. The influence of initial inoculum on the within-host scale of PTB infection dynamics
In this subsection, we demonstrate through numerical simulations of the full nested multiscale model system (2.4) the influence of between-host scale dynamics on within-host scale variables for PTB infection dynamics. This is achieved by varying the initial value condition of the infective inoculum Bc(0) that susceptible ruminants may acquire by interacting with MAP bacteria in contaminated environment for different values and assess its impact on the dynamics of four selected key within-host variables, Im, Bc, T1, and T2. Figure 2 shows the effect of varying Bc(0) for different values on the within-host variables (Im, Bc, T1, T2). Bc(0): Bc(0) = 10, Bc(0) = 1, 000, and Bc(0) = 1, 000, 000. The used values are plausible largely because of the scarcity of multiscale empirical data for PTB. We used the multiscale model as an experimental tool to investigate a range of model variables initial inoculum. From the numerical results in Figure 2, we notice that as the initial infective inoculum Bc(0) increases beyond the minimum infectious dose (MID), there is a noticeable but minimal changes in the dynamics of the within-host scale variables Im, Bc, T1, T2. This is because, once the host is infected, the replication of the MAP bacteria at the within-host scale sustains the disease dynamics at this scale.
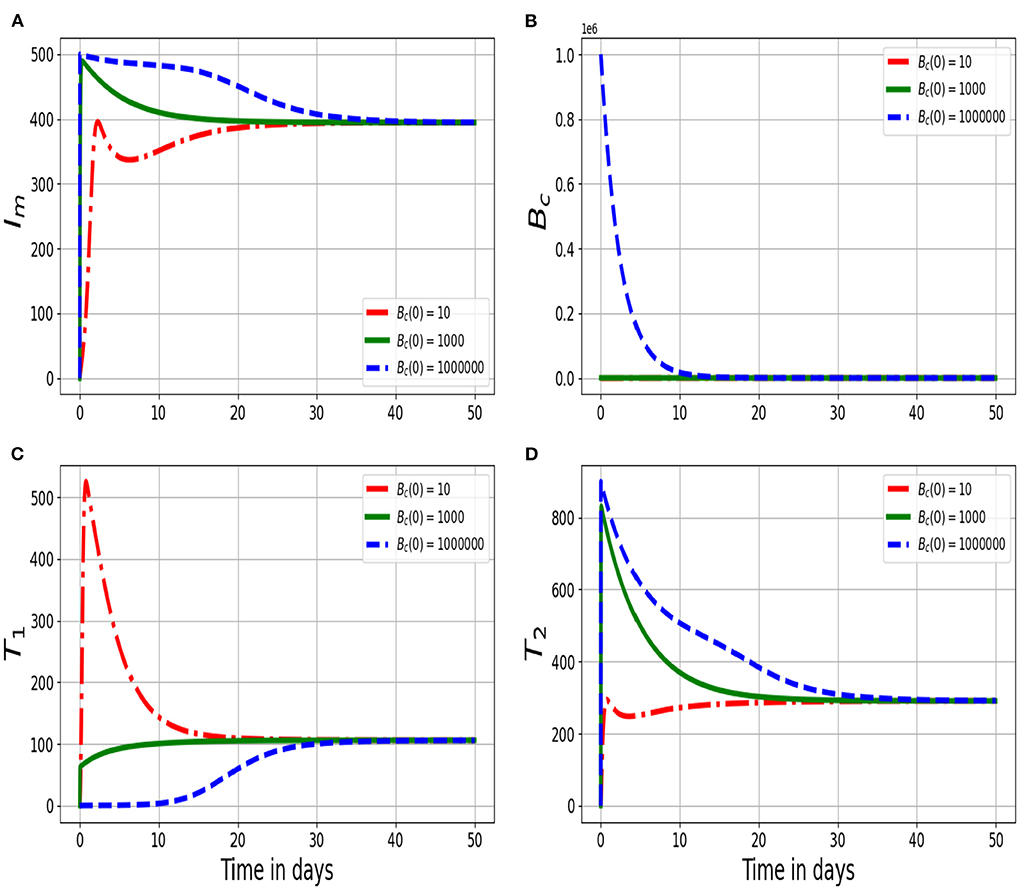
Figure 2. Graphs of numerical solutions of the multiscale model system (2.4) showing changes of (A) infected macrophage population (Im), (B) within-host MAP bacteria population (Bc), (C) MAP-Specific Th1 response cells (T1), and (D) MAP-Specific Th2 response cells (T2) for different values of initial value condition of the within-host MAP bacterial load Bc(0): Bc(0) = 10, Bc(0) = 1, 000, and Bc(0) = 1, 000, 000.
Figure 2 shows the solution profiles of the population of (Figure 2A) infected macrophage population (Im), (Figure 2B) within-host MAP bacteria population (Bc), (Figure 2C) MAP-Specific Th1 response cells (T1), and (Figure 2D) MAP-Specific Th2 response cells for different values of initial inoculum of MAP bacterial load Bc(0): Bc(0) = 10, Bc(0) = 1, 000, and Bc(0) = 1, 000, 000 at within-host scale. The results in Figure 2 illustrate that the variation in the initial inoculum influence the dynamics of the disease at the within-host scale only within a period of 50 days. But, after that the dynamics of the disease reach an endemic level. Therefore, this implies that different initial inoculum values converge to the same endemic state after a period of about 50 days. Overall, this confirms that once the minimum infectious dose is consumed, the long term disease dynamics is independent of the initial inoculum. And also confirms that as the initial inoculum increases, the time to reach the endemic state also increases.
2.4.2. The influence of within-host scale parameters on the between-host scale PTB infection dynamics
In this subsection, we illustrate through numerical simulations of the full nested multiscale model system (2.4) the influence of within-host scale parameters on between-host scale variables for PTB infection dynamics. We vary the within-host scale parameters, αc, μc, and Nm and assess their impact on the dynamics of the between-host scale variables SC, IC, and BC.
Figure 3 shows graphs of numerical solutions of the model system (2.4) showing dynamics of (Figure 3A) population of susceptible ruminants (SC), (Figure 3B) population of infected ruminants (IC), and (Figure 3C) environmental MAP bacteria load (BC) for different values of excretion rate of the within-host scale MAP bacilli into the environment αc: αc = 0.1, αc = 0.01, and αc = 0.001. The results show that an increase in the excretion rate of the within-host scale bacterial load into the physical environment by each infected ruminant individual has important ruminant population health effects at the between-host scale dynamics of PTB infection as there is a noticeable increase in the population of environmental MAP bacteria BC and the population of infected ruminants IC as well as a decrease in the population of susceptible ruminants SC.
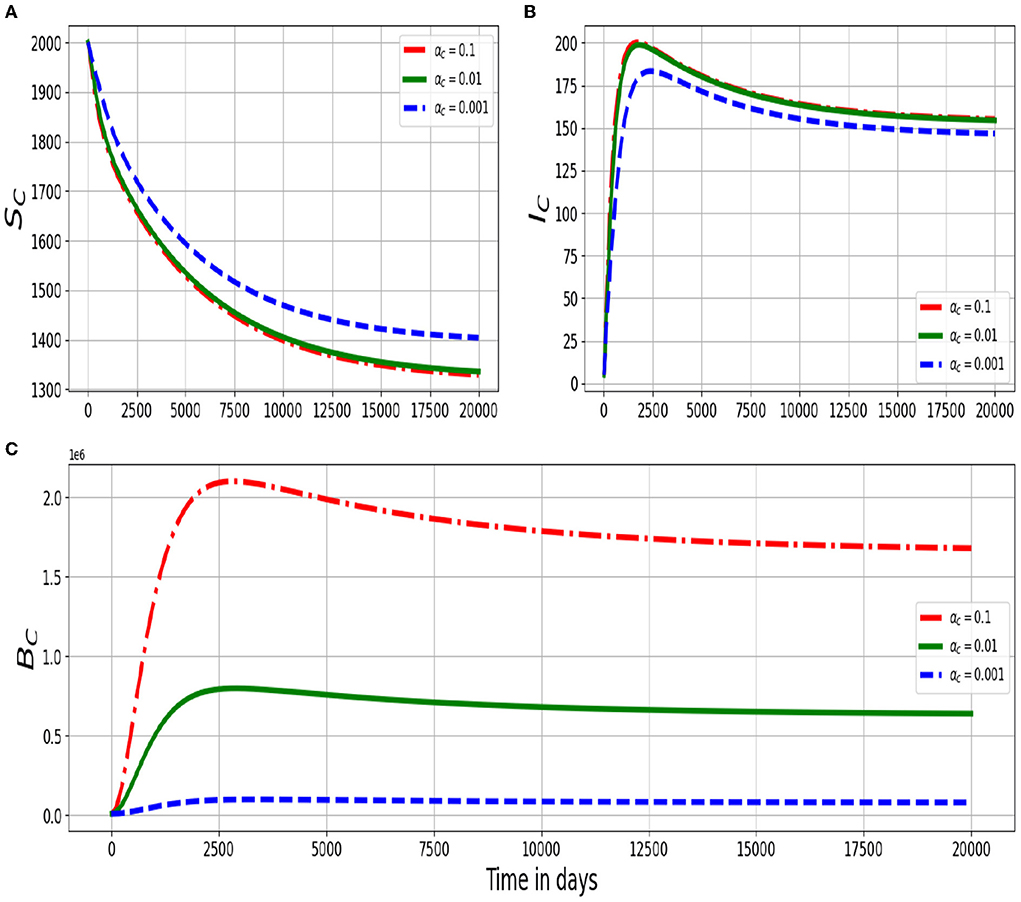
Figure 3. Graphs of numerical solutions of the multiscale model system (2.4) showing the evolution in time of (A) population of susceptible ruminants (SC), (B) population of infected ruminants (IC), and (C) between-host MAP bacterial load (BC) for different values of excretion rate of the within-host MAP bacterial load into the environment αc: αc = 0.1, αc = 0.01, and αc = 0.001.
Figure 4 shows changes in (Figure 4A) population of susceptible ruminants (SC), (Figure 4B) population of infected ruminants (IC), and (Figure 4C) population of environmental MAP bacteria load (BC) for different values of natural decay rate of the within-host scale MAP bacteria cells: μc: μc = 0.3, μc = 0.03, and μc = 0.003. The results in Figure 4 show that as the death rate of the within-host scale bacterial load increases, there is also a noticeable reduction in the population of environmental MAP bacteria BC and the population of infected ruminants IC as well as an increase in the population of susceptible ruminants SC at between-host scale. Therefore, development of any treatment measures that target MAP bacteria at within-host scale such as antibiotics [28] are equally good for both the individual ruminant and the population because a single infected ruminant will no longer pose a threat for transmitting infection in the population/herd which consequently reduces the transmission risk of the disease among the ruminants in the population/herd.
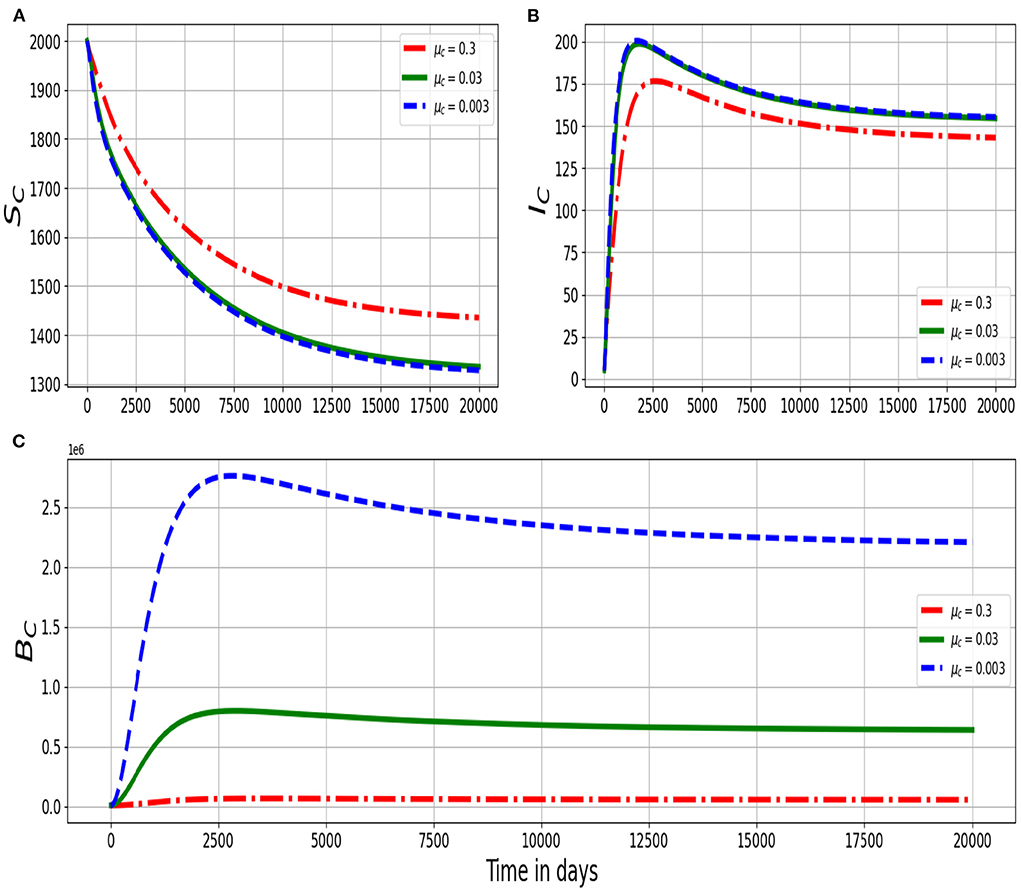
Figure 4. Graphs of numerical solutions of the multiscale model system(2.4) showing changes in (A) population of susceptible ruminants (SC), (B) population of infected ruminants (IC), and (C) population of environmental MAP bacterial load (BC) for different values of death rate of the within-host MAP bacterial load μc: μc = 0.3, μc = 0.03, and μc = 0.003.
Figure 5 shows the dynamics in the (Figure 5A) population of susceptible ruminants (SC), (Figure 5B) population of infected ruminants (IC), and (Figure 5C) population of environmental MAP bacterial load (BC) for different values of within-host scale bursting size of each infected macrophage cell Nm: Nm = 100, Nm = 1, 000, Nm = 10, 000. The numerical results in Figure 5 show that as the average replication rate of the within-host MAP bacteria within infected macrophage cells at the site of infection increases, transmission of PTB infection at the population/herd level of ruminants also increases. Therefore, these results demonstrate the benefit of treatment that can restrict the replication of MAP bacteria at individual ruminant level on the transmission of the disease at the population/herd level of ruminants. Collectively, we note from the results in Figures 3–5, that the between-host scale variables (SC, IC, BC) are significantly sensitive to the variation of the three selected within-host scale parameters (αc, μc, and Nm), particularly the decay rate μc of the within-host scale MAP bacteria.
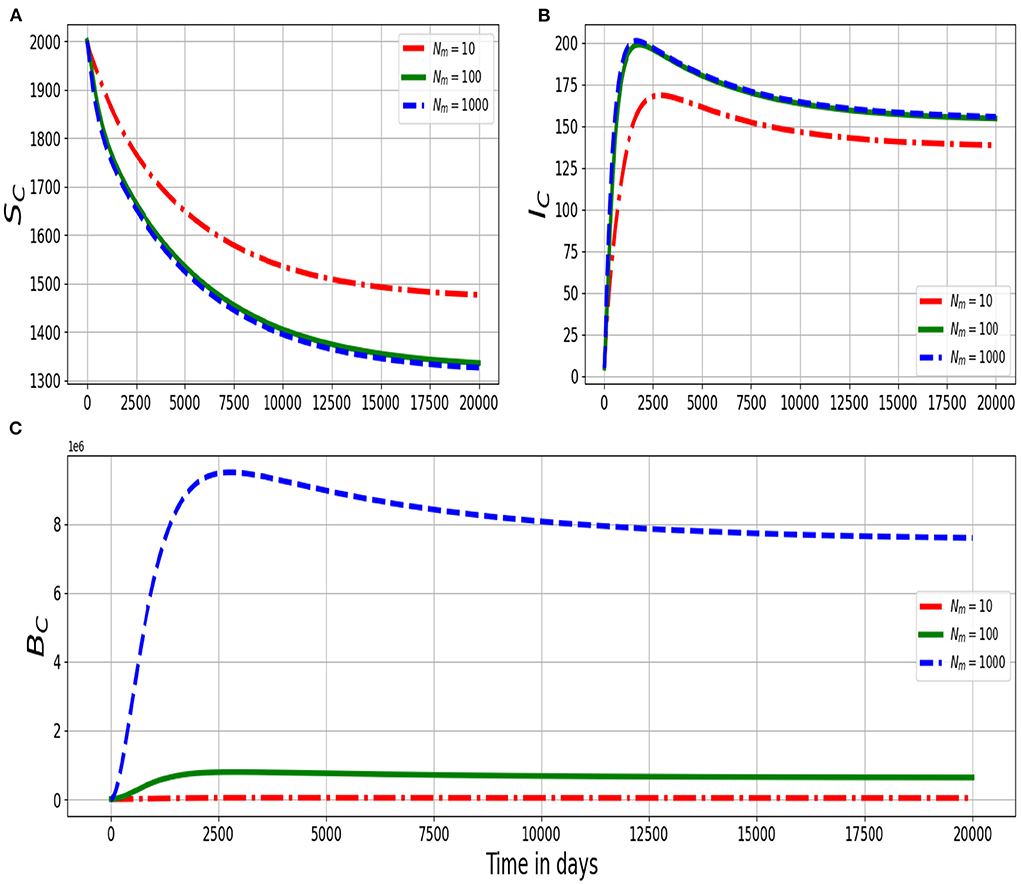
Figure 5. Graphs of numerical solutions of the multiscale model system (2.4) showing dynamics in (A) population of susceptible ruminants (SC), (B) population of infected ruminants (IC), and (C) population of environmental MAP bacterial load (BC) for different values of within-host scale MAP bacteria produced per bursting infected macrophage cell Nm: Nm = 100, Nm = 1, 000, Nm = 10, 000.
Overall, the results in Figures 2–5 show that:
(a) The between-host scale influences the within-host scale through the initial inoculum of the infectious agent.
(b) Once the initial inoculum has been introduced from the between-host scale, then the infection at within-host scale is sustained by pathogen replication.
(c) As the initial inoculum acquired from the between-host scale increases beyond the MID, the time taken for the infection at within-host scale to reach equilibrium increases.
(d) The between-host scale variables (SC, IC, BC) are significantly sensitive to the variation of the three selected within-host scale parameters (αc, μc, and Nm), particularly the decay rate μc of the within-host scale MAP bacteria.
This indeed indicates that during the dynamics for PTB infection in ruminants once the infection has successfully established at the within-host scale, the contribution of initial infective inoculum to the total pathogen load becomes negligible compared to the contribution of the replication of the pathogen. Further, the results in Figures 3–5 seem to have a threshold effect. This is because there no significant differences between SC and IC for low values of α, μ, and Nm and yet these quantities are significantly different for higher values of these parameters. It may be just the values of parameters used, but further work to be reported elsewhere will investigate this as it could be utilized for control measures.
3. Estimation of from the full nested multiscale model
In this section, we estimate parameter in the single scale model for the dynamics of PTB infection using the nested multiscale model system (2.4). This is achieved by assuming that 0 < ϵ ≪ 1, so that to reasonable approximation we can set ϵ = 0 in the full nested multiscale model system (2.4). Thus, we consider the last six equations of the PTB full nested multiscale model system (2.4) re-written here as a quick reference
Since 0 < ϵ < <1, we can set ϵ to zero so that the within-host scale PTB replication dynamics submodel becomes independent of time and we obtain:
From (3.6) we get
In the expression (3.7),
with
Further, in the expression (3.9) the quantity
is the within-host scale basic reproductive number. Therefore, the fast-slow analysis reduces the within-host scale submodel system (2.2) to the algebraic equations given in (3.7) which can be fed into the parameters of the between-host scale submodel and become
We note that from the model system given by (3.10) that the total number of extracellular MAP bacilli excreted by each infected ruminant into the physical environment BcIC is now approximated by . Using the notation that , a composite parameter which can be interpreted as the average number of the within-host scale MAP bacterial load (Bc) at the endemic equilibrium that is available for excretion into the environment by each infected ruminant, the full multiscale model (2.4) of PTB transmission dynamics is simplified to become
where the composite parameter Nc which estimates is given by
In the expression for Nc given by equation (3.12), the expressions ϕ1 and ϕ2 are defined by (3.8) and (3.9). Based on the categorization of the multiscale models of infectious disease systems in [15, 16], the multiscale model system given by (3.11) is a nested multiscale model of class 3. After estimating Nc as well as establishing the simplified nested multiscale model system given by (3.11), we now analyze the behavior of this nested multiscale model system (3.11). In the next section, we present some results from mathematical analysis and numerical simulations of the behavior of the simplified nested multiscale model (3.11).
4. Mathematical analysis of the simplified nested multiscale model for PTB infection in ruminants
The PTB dynamics multiscale model system (3.11) can be analyzed in a region of biological interest, which is given by
where the constant S1 and S2 are such that
It can be easily shown that all solutions for the simplified multiscale model system (3.11) with positive initial conditions remain bounded within the invariant region Γ given by (4.13). Therefore, it is sufficient to consider the dynamics of the flow generated by the simplified nested model system (3.11) in Γ.
In the following three subsections, we evaluate global stability of both the disease-free and endemic equilibrium states for the PTB dynamics multiscale model system (3.11) as well as evaluating sensitivity of the two main between-host transmission metrics which are the basic reproductive number (R0) and the endemic value of the nested multiscale model (3.11) MAP bacteria ().
4.1. Disease-free equilibrium and reproductive number of the simplified nested multiscale model
The disease-free equilibrium of the nested multiscale model system (3.11) was obtained by setting the left-hand side of the model to zero and further assume that IC = BC = 0 to get
where denotes the disease-free equilibrium of the simplified nested multiscale model system (3.11).
4.1.1. Derivation of the reproductive number of the simplified multiscale model
The basic reproduction number denoted by R0, is a threshold value that is often used as a public health measure to determine whether a disease will persist or die out. In this study, we computed the basic reproductive number of the simplified multiscale model system (3.11) by using the next generation operator approach in [26] to obtain
Details of the derivation of the basic reproductive number given by expression (4.16) are given in Appendix A. This expression of the basic reproductive number can be re-written as
where the quantity R0a is explained as follows:
a. Consider a single newly infected ruminant entering a contaminated-free environment at an equilibrium point. The expected number of bacteria cells produced by this ruminant and contaminate the environment is approximately
From the expression (4.18) we deduce that the quantity R0a depends on the average MAP bacterial load within an infected ruminant Nc which is excreted into the physical environment at a rate αc, where it becomes infectious to other ruminants during feeding from contaminated food or water with MAP bacterial load. In this study, we consider Nc as a composite parameter which is interpreted as the endemic value of the within-host scale MAP bacterial load which we have already determined from the within-host PTB disease dynamics sub-model as given in equation (3.12). Therefore, the quantity R0a quantifies how much an infected ruminant can contribute to the spread of the disease in the herd during its entire period of infectiousness, with 1/(μC + δC + γC) describes the average life span of an infected ruminant.
b. Similarly, consider a newly bacterial infectious dose of MAP bacilli cells entering a disease-free population of a ruminant population at an equilibrium point. The expected number of ruminants infected by this dose of bacteria cells is approximately
We can also deduce that the quantity R0b in (4.19) depends on the supply rate of susceptible ruminants ΛC, the rate at which susceptible ruminants contract MAP bacteria in the physical environment domains during feeding βC, the average life span of each susceptible ruminant host 1/μC, the average life span of MAP bacteria load in the physical environment domains and the susceptibility coefficient to PTB infection in the ruminant community/herd, where B0 is the bacterial load that results in 50% chance of ruminants being infected.
Collectively, based on the two expressions R0a and R0b, we conclude that the epidemiological (between-host scale) transmission parameters and the immunological (within-host scale) parameters all contribute to the transmission of ruminant paratuberculosis disease.
4.1.2. Global stability of the disease-free equilibrium
In this subsection, we determine the global stability of DFE of the simplified multiscale model system (3.11) by further using a next generation operator [26]. Thus the model system (3.11) can be re-written in the form
where
• X = SC represents a compartment of uninfected ruminants, and
• Z = (IC, BC) represents compartments of infected ruminants and Infective MAP bacteria in the physical environment.
We let
denote the disease-free equilibrium (DFE) of the model system (3.11). For X* to be globally asymptotically stable, the following conditions (H1) and (H2) must be satisfied.
H1. = F(X, 0) is globally asymptotically stable (GAS),
H2. G(X, Z) = AZ−Ĝ(X, Z), Ĝ((X, Z) ≥ 0 for where is an M-matrix and is the region where the model makes biological sense.
In this case,
and the matrix A is given by
and
Since =, it is clear that Ĝ(X, Z) ≥ 0 for all . It is also clear that A is a M-matrix, since the off diagonal elements of A are non-negative.
We state a theorem which summarizes the above results:
Theorem 1. The fixed point
of the multiscale model system (3.11) is globally asymptotically stable (GAS) if R0 ≤ 1 and the assumptions (H1) and (H2) are satisfied.
4.2. Endemic equilibrium and its global stability
In the subsection, we determine the endemic equilibrium state of the simplified nested multiscale model system (3.11) by setting the left-hand side of the simplified nested multiscale model system (3.11) to zero but assuming that IC and BC are non-zero, so that
where
We deduce that only a single positive endemic equilibrium point exists whenever R0 > 1. To this effect, we conclude that there exists only one unique endemic equilibrium point for model system (3.11) whenever R0 > 1. We can then further determine the global stability of the endemic equilibrium for the simplified multiscale model system (3.11) since we have established the existence of E* without providing any information about its stability. The global stability of the endemic equilibrium E* of the multiscale model system (3.11) is summarized in the following theorem:
Theorem 2. Endemic Equilibrium E* of the model system (3.11) is global asymptotically stable (GAS) whenever R0 > 1.
Proof : Let's consider a Volterra-type Lyapunov function given by
and further taking advantage of the properties of the function
which is positive in (0, ∞) except at x = 1 where it vanishes. We note that L1 is non-negative in the interior of Γ and attain zero at E*. We now need to show that is negative definite. Differentiating L1 along the trajectories of the model system (2.1), we obtain
Since E* is an equilibrium point, the following relations hold
Using the relations in (4.30), becomes
By direct calculations from equation (4.31), we have that the first term at the right hand side of Equation (4.31) is as follows
The second term at the right hand side of Equation (4.31) is
and the third term at the right hand side of Equation (4.31) is as follows
Therefore,
By using the function g(x) defined in (4.28), we get
From (4.36), we have that the largest invariant subset, where , is E*. Therefore, we conclude from the LaSelle's Invariance Principle that E* is globally asymptotically stable (GAS) when R0>1.
4.3. Sensitivity analysis
In this sub-section, we conduct a sensitivity analysis of the two PTB transmission metrics derived from the simplified nested multiscale model given by (3.11) to the parameters of the model variation. As mentioned previously, the two PTB transmission metrics derived from the baseline PTB multiscale model system (3.11) are: the reproductive number, R0, which generally describes the dynamics of a disease at the beginning of an infection and the endemic value of the environmental bacteria load, , which generally describes the dynamics of a disease at the endemic level. For any epidemic model that describes the dynamics of any diseases in a population, a sensitivity analysis study is an essential to perform as it helps to identify model's parameters which can be targeted for disease control, elimination, or even eradication, and also be monitored and controlled during an outbreak of the disease. In this case, sensitivity analysis of both the PTB multiscale transmission metrics (R0 and ), with respect to the variation of the baseline PTB multiscale model system (3.11)'s parameters is conducted using Latin Hypercube Sampling and partial rank correlation coefficients (PRCCs). We used 1,000 simulations per run to investigate the impact of each model parameter on both the basic reproduction numbers (R0) and the endemic value of the environmental bacteria load (). The sensitivity results of R0 and to the model parameters are given in the Tornado plots, Figures 6, 7, respectively.
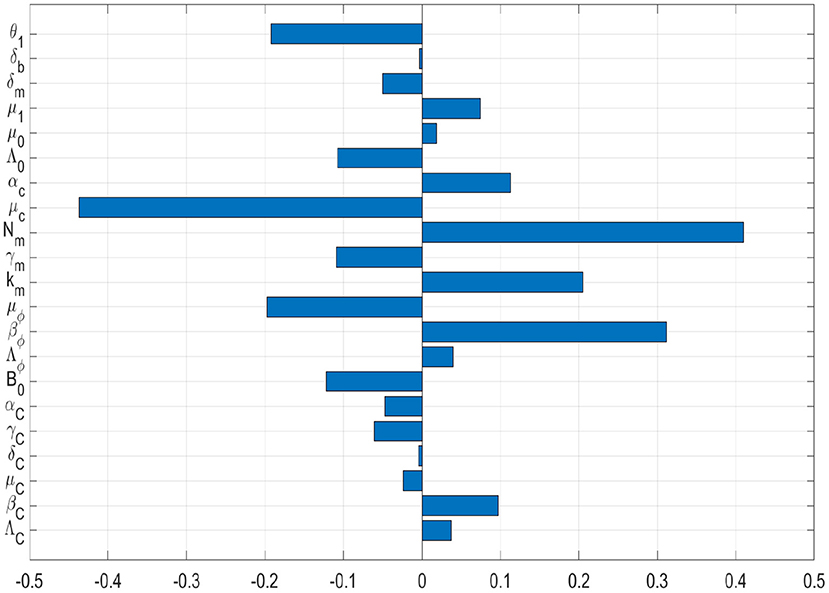
Figure 6. Tornado plot of partial rank correlation coefficients (PRCCs) of the model parameters that influence the PTB transmission metric R0.
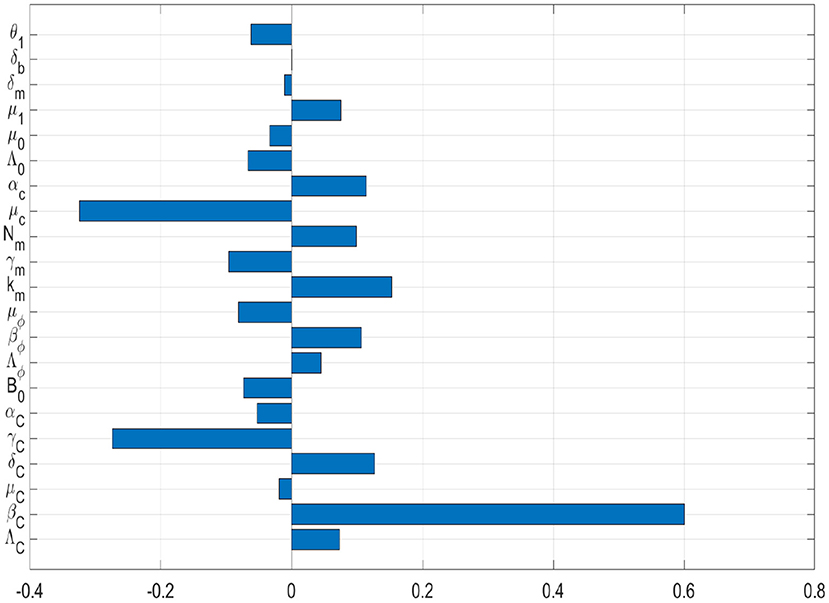
Figure 7. Tornado plot of partial rank correlation coefficients (PRCCs) of the model parameters that influence the PTB transmission metric .
Figures 6, 7 show the results of the evaluation of the sensitivity of the two PTB transmission metrics derived from the PTB simplified multiscale model (3.11) which are the basic reproductive number R0 and the value of MAP environmental bacteria at the endemic level . From the sensitivity analysis results of both R0 and to baseline PTB multiscale model (3.11)'s parameters in Figures 6, 7, we deduce that some of the baseline PTB multiscale model (3.11)'s parameters have positive PRCCs and some have negative PRCCs. This indicates that, parameters with positive PRCCs will increase the value of both R0 and when they are increased, while parameters with negative PRCCs will decrease the value of R0 and when they are increased. For instance, increasing a parameter like bacteria transmission rate βC at the between-host scale eventually increases the value of R0 and , and also increasing parameters like μc will lead to a reduction in the value of both R0 and . Therefore, since R0 characterizes transmission of PTB infection at the start of the epidemic while characterizes transmission of PTB when the disease is now endemic in a herd, we make the following conclusions regarding the sensitivity of both R0 and :
(a) On one hand, the PTB transmission metric R0 is highly sensitive to the variation of the within-host scale parameters of the multiscale model system (3.11), in particular to the three within-host scale parameters (μc, Nm, βϕ). From the results of the sensitivity analysis of R0, we can easily notice that the influence of the between-host scale parameters on the changes of R0 is negligible.
(b) On the other hand, the PTB transmission metric is highly sensitive to the variation of two of the between-host scale parameters (βC, γC) and only one within-host scale parameter (μc) of the multiscale model system (3.11).
Overall, since R0 describes the dynamics of the disease at the start of the infection, this means that at the start of PTB, pharmaceutical interventions such as drugs that target the killing of the within-host bacteria as well as restricting the replication of bacteria within an infected macrophage cells are required to be highly considered as they are likely to have the highest benefits in reducing the transmission of PTB among ruminants in the herd. Moreover, since describes the dynamics of the disease when it has already reached an endemic level when PTB is at the endemic level, this means that the combination of non-pharmaceutical interventions such as environmental hygiene management that reduces the risk of a ruminant to interact with environmental MAP bacterial cells in the environment and the pharmaceutical interventions such as drugs that target the killing of the within-host bacteria need to be highly considered as they are likely to have the highest benefits in reducing the transmission of PTB among ruminants in the herd.
5. Discussion and conclusions
Paratuberculosis disease in ruminants, like other environmentally transmitted diseases which threaten our food security urgently needs renewed attention and sustainable interventions. Paratuberculosis infection has been and continues to be a public health concern in ruminants, impacting on the development of many ruminant industries, especially those that are in the developing world. More efforts have been put in place in order to completely eradicate this disease, yet few countries in the developing world are on track to eliminate PTB. However, some countries in the developing world, particularly EU countries have nearly eliminated PTB [27]. To date, many mathematical models have been developed and used as an important tool for studying the dynamics of a number of infectious diseases. Some of these mathematical models have further been used to evaluate the effectiveness of various intervention strategies intended to control, eliminate, or even eradicate most of these infectious diseases including environmental transmitted diseases. However, the major innovation in this paper to scientific knowledge is the use of a nested multiscale model to investigate if the initial infective inoculum increases beyond the minimum infectious dose (MID) has an impact on the dynamics of an infectious disease system in which the pathogen replication-cycle occurs only at the microscale. The numerical results in this study demonstrate that once the minimum infectious dose is consumed, then the infection at the within-host scale is sustained by pathogen replication. These results also show that as the initial inoculum increases, the time to reach the endemic state also increases at this scale domain. From these results it seems likely super-infection (i.e., repeated infection of the host before it recovers from the initial infectious episode) might have an insignificant effect on the dynamics of PTB in ruminants. However, at this stage we cannot precisely conclude if super-infection does not effect on the dynamics of the disease. This could only be investigated using an embedded multiscale model. Furthermore, the reduction of the dimensions of full nested multiscale model enabled us to estimate a composite parameter, Nc, that is difficult to estimate using single-scale models. The estimation of Nc facilitate in enhancing single-scale model framework that can be developed at host level to predict the dynamics of paratuberculosis in ruminants at within-host scale. This is largely because single-scale models consider pathogen transmission as the only major disease process, while multiscale models consider both pathogen transmission and pathogen replication as the two major disease processes [25]. We also perform a sensitivity analysis to the two main disease dynamics metrics of the simplified nested multiscale model, namely the basic reproductive number and the endemic value of the MAP bacteria in the environment to determine important parameters of paratuberculosis disease dynamics. The sensitive analysis results show that at the start of PTB infection and when it has reach at the endemic level, the key within-host parameters μc is relatively sensitive to PTB disease dynamics. This would be hard to obtain from a single-scale modeling approach, which would only provide a general indication about the influential of the within-host dynamics on spread of the PTB disease at the population level, but not specifically indicating parameters that have potential influence on the disease dynamics.
Data availability statement
The original contributions presented in the study are included in the article/supplementary material, further inquiries can be directed to the corresponding authors.
Author contributions
All authors listed have made a substantial, direct, and intellectual contribution to the work and approved it for publication.
Funding
We would like to thank the South Africa National Research Foundation (NRF) for its financial support, Grant No. IPRR (UID 81235). The work was also supported financially by the Global Infectious Disease Research Training (GIDRT), Award #D43 TW006578 from the Fogarty International Center of the NIH.
Acknowledgments
We would like to thank Prof. Gesham Magombedze for sharing some of his insights on paratuberculosis and reading one the earlier versions of this manuscript.
Conflict of interest
The authors declare that the research was conducted in the absence of any commercial or financial relationships that could be construed as a potential conflict of interest.
Publisher's note
All claims expressed in this article are solely those of the authors and do not necessarily represent those of their affiliated organizations, or those of the publisher, the editors and the reviewers. Any product that may be evaluated in this article, or claim that may be made by its manufacturer, is not guaranteed or endorsed by the publisher.
References
1. Magombedze G, Ngonghala CN, Lanzas C. Evalution of the “iceberg phenomenon” in Johne's disease through mathematical modelling. PLoS ONE. (2013) 8:e76636. doi: 10.1371/journal.pone.0076636
2. Magombedze G, Eda S, Ganusov VV. Competition for antigen between th1 and th2 responses determines the timing of the immune response switch during Mycobaterium avium subspecies paratuberulosis infection in ruminants. PLoS Comput Biol. (2014) 10:e1003414. doi: 10.1371/journal.pcbi.1003414
3. Martcheva M, Lenhart S, Eda S, Klinkenberg D, Momotani E, Stabel J. An immuno-epidemiological model for Johne's disease in cattle. Vet Res. (2015) 46:69. doi: 10.1186/s13567-015-0190-3
4. Chacon O, Bermudez L, Barletta R. Johne's disease, inflammatory bowel disease, Mycobacterium paratuberculosis. Annu Rev Microbiol. (2004) 58:329–63. doi: 10.1146/annurev.micro.58.030603.123726
5. Ott S, Wells S, Wagner B. Herd-level economic losses associated with Johne's disease on US dairy operations. Prev Vet Med. (1999) 40:179–92. doi: 10.1016/S0167-5877(99)00037-9
6. Chiodini RJ, Chamberlin WM, Sarosiek J, McCallum RW. Crohn's disease and the mycobacterioses: a quarter century later. Causation or simple association? Crit Rev Microbiol. (2012) 38:52–93. doi: 10.3109/1040841X.2011.638273
7. koets AP, Grohn YT. Within- and between-host mathematical modeling of Mycobacterium avium subspecies paratuberculosis (MAP) infections as a tool to study the dynamics of host-pathogen interactions in bovine paratuberculosis. Vet Res. (2015). 46:60. doi: 10.1186/s13567-015-0205-0
8. Wang X, Wang J. Disease dynamics in a coupled cholera model linking within-host and between-host interactions. J Biol Dyn. (2017) 11(Suppl 1):238–62. doi: 10.1080/17513758.2016.1231850
9. Netshikweta R, Garira W. A multiscale model for the world's first parasitic disease targeted for eradication: guinea worm disease. Comput Math Methods Med. (2017) 2017:1473287. doi: 10.1155/2017/1473287
10. Garira W, Mathebula D, Netshikweta R. A Mathematical modelling framework for linked within-host and between-host dynamics for infections with free-living pathogens in the environment. Math Biosci. (2014) 256:58–78. doi: 10.1016/j.mbs.2014.08.004
11. Feng Z, Velasco-Hernandez J, Tapia-Santo B. A mathematical model for coupling with-host and between-host dynamics in an environmental-driven infectious disease. Math Biosci. (2013) 241:49–55. doi: 10.1016/j.mbs.2012.09.004
12. Feng Z, Cen X, Zhao Y, Velasco-Hernandez JX. Coupled within-host and between-host dynamics and evolution of virulence. Math Biosci. (2015) 270:204–12. doi: 10.1016/j.mbs.2015.02.012
13. Garira W, Mathebula D. A coupled multiscale model to guide malaria control and elimination. J Theret Biol. (2019) 475:34–59. doi: 10.1016/j.jtbi.2019.05.011
14. Garira W, Mafunda MC. From individual health to community health: towards multiscale modelling of directly transmitted infectious disease systems. J Biol Syst. (2019) 27:131–66. doi: 10.1142/S0218339019500074
15. Garira W. A primer on multiscale modelling of infectious disease systems. Infect Dis Modell. (2018) 3:176–91. doi: 10.1016/j.idm.2018.09.005
16. Garira W. A complete categorization of multiscale models of infectious disease systems. J Biol Dyn. (2017) 11:378–435. doi: 10.1080/17513758.2017.1367849
17. Carr J. Applications of Centre Manifold Theory. vol. 35. New York, NY: Springer Science & Business Media (2012).
18. Bastida F, Juste RA. Paratuberculosis control: a review with a focus on vaccination. J Immune Based Therap Vaccines. (2011) 9:8. doi: 10.1186/1476-8518-9-8
19. Marce C, Ezanno P, Weber MF, Seegers H, Pfeiffer DU, Fourichon C. Invited review: modeling within-herd transmission of Mycobacterium avium subspecies paratuberculosis in dairy cattle: a review. J Dairy Sci. (2010) 93:4455–90. doi: 10.3168/jds.2010-3139
20. Mitchell R, Whitlock R, Stehman S, Benedictus A, Chapagain P, Grohn YT, et al. Simulation modeling to evaluate the persistence of Mycobacterium avium subsp. paratuberculosis (MAP) on commercial dairy farms in the United States. Prev Vet Med. (2008) 83:360–80. doi: 10.1016/j.prevetmed.2007.09.006
21. Martcheva M. An Immuno-Epidemiological Model of Paratuberculosis. (2011). Available online at: https://pdfs.semanticscholar.org/0090/c48945aedb167a146f32ab80bf6dd2c1e260.pdf
22. Robins J, Bogen S, Francis A, Westhoek A, Kanarek A, Lenhart S, et al. Agent-based model for Johne's disease dynamics in a dairy herd. Vet Res. (2015) 46:68 doi: 10.1186/s13567-015-0195-y
23. Konboon M, Bani-Yaghoub MM, Pithua PO, Rhee N, Aly SS. A nested compartmental model to assess the efficacy of paratuberculosis control measures on U.S. dairy farms. PLoS ONE. (2018) 13:e0203190. doi: 10.1371/journal.pone.0203190
24. Gilchrist MA, Sasaki A. Modeling host-parasite co-evolution: a nested approach based on mechanistic models. J Theor Biol. (2002) 218:289–308. doi: 10.1006/jtbi.2002.3076
25. Garira W. The Replication-transmission relativity theory for multiscale modelling of infectious disease systems. Sci Rep. (2019) 9:1–17. doi: 10.1038/s41598-019-52820-3
26. Castillo-Chavez C, Feng Z., Huang W. On the computation of R0 and its role in global stability. In: Castillo-Chavez C, Blower S, van den Driessche P, Kirschner D, editors. Mathematical Approaches for Emerging and Re-emerging Infectious Diseases Part 1: An Introduction to Models, Methods Theory. The IMA Volumes in Mathematics Its Applications. vol. 125. Berlin: Springer-Verlag (2002). p. 229–50. doi: 10.1007/978-1-4613-0065-6
27. Fanelli A, Buonavoglia D, Pleite CMC, Tizzani P. Paratuberculosis at European scale: an overview from 2010 to 2017. Vet Ital. (2020) 56:13–21. doi: 10.12834/VetIt.1829.9692.3
28. Kuenstner JT, Naser S, Chamberlin W, Borody T, Graham DY, McNees A, et al. The consensus from the Mycobacterium avium ssp. paratuberculosis (MAP) conference 2017. Front Public Health. (2017) 5:208. doi: 10.3389/fpubh.2017.00208
Appendix A
6. Derivation of the reproductive number of the PTB simplified multiscale model
To determine the reproduction number of the equations (3.11), we use the next generation operator approach in [26]. Thus the equations (3.11) can be written in this form
• X = SC represents the population of uninfected cattle.
• Y = IC represents the population of infected cattle.
• Z = BC represents the population of infected MAP bacilli in the environment.
Let
denote the disease free-equilibrium state and further assume
A matrix
can be presented in the form A = M−D, where
Therefore, the basic reproduction number of the model system (3.11) is expressed by the following quantity,
Keywords: multiscale modeling of disease, nested multiscale models, environmentally-transmitted diseases, multiscale modeling of paratuberculosis, infectious disease systems
Citation: Netshikweta R and Garira W (2022) A nested multiscale model to study paratuberculosis in ruminants. Front. Appl. Math. Stat. 8:817060. doi: 10.3389/fams.2022.817060
Received: 17 November 2021; Accepted: 20 July 2022;
Published: 15 August 2022.
Edited by:
Guillermo Huerta Cuellar, University of Guadalajara, MexicoReviewed by:
Anthony O'Hare, University of Stirling, United KingdomGustavo Machado, North Carolina State University, United States
Copyright © 2022 Netshikweta and Garira. This is an open-access article distributed under the terms of the Creative Commons Attribution License (CC BY). The use, distribution or reproduction in other forums is permitted, provided the original author(s) and the copyright owner(s) are credited and that the original publication in this journal is cited, in accordance with accepted academic practice. No use, distribution or reproduction is permitted which does not comply with these terms.
*Correspondence: Winston Garira, d2dhcmlyYUBnbWFpbC5jb20=