 Sohyla Reshadat1
 Alireza Zangeneh1*
 Arash Ziapour2Naser Farahmandmoghadam3
 Fatemeh Khosravi Shadmani4
 Raziyeh Teimouri5
 Shirin Zardui Golanbari6
 Samira Rostami6
- 1Social Development and Health Promotion Research Center, Health Institute, Kermanshah University of Medical Sciences, Kermanshah, Iran
- 2Cardiovascular Research Center, Health Institute, Kermanshah University of Medical Sciences, Kermanshah, Iran
- 3Clinical Research Development Center, Imam Khomeini and Mohammad Kermanshahi Hospitals, Kermanshah University of Medical Sciences, Kermanshah, Iran
- 4Research Center for Environmental Determinants of Health (RCEDH), Health Institute, Kermanshah University of Medical Sciences, Kermanshah, Iran
- 5UniSA Creative, University of South Australia, Adelaide, SA, Australia
- 6Kermanshah University of Medical Sciences, Kermanshah, Iran
Background: Access to medical care is one of the major issues affecting human health. This study aims to investigate inequality in access to medical care in the townships in Kermanshah, Iran.
Methods: Methodology approach includes a descriptive-analytic study followed by determining the degree of development of the townships calculated in terms of access to medical care through the hierarchical cluster analysis and the combined model of human development index. Additionally, the mean center and standard distance tests are handled in a geographic information system software to identify the deployment pattern of the status of access to medical care indexes.
Results: As for the ratio of physicians, nursing staff, paramedical staff, administrative staff of health care, dentists, pharmacists, hospitals, general and specialized clinics, radiology, rehabilitation centers and laboratories to a population of 10,000, the results of analyzing the findings were indicative of unequal distribution of facilities at the level of townships. This is based on The results of comparing the mean centers of population and health facilities showed that the centers of both data categories were located in Kermanshah. The two standard distances (i.e., population and health facilities) demonstrated that the health facilities witnessed more dispersion in the northwestern regions than the concentration of population in the central and southeastern regions of the province.
Conclusions: The results indicated that the indexes of development of facilities and healthcare resources were not distributed equitably and with a balance between the townships of the Kermanshah Province.
Introduction
Health systems are always faced with key challenges in relation to primary healthcare. These include developing and retaining workforce, information management, financing the health sector and fair provision [1], distribution of infrastructure and resource allocation management [2, 3], affordability, availability and accessibility of health services [4–6], and matching services to the needs of the public [7, 8]. Based on researches access to health services is a multi factorial issue and dependent on many differ determinate factors including: presence of facilities, personnel population density, socio-economic status, payments required, transport, willingness of health services to accept cultural minorities, physical accessibility for people with disabilities, gender considerations, and cultural attitudes and beliefs about health services and their usefulness. Besides, higher access and use of health services is more needed for some at risk groups such as: mothers, babies, older people or others in the population whose health is relatively more at risk- for example those with chronic health conditions [9–14]. In a situation where the provision of services is traditionally measured by indexes such as the number of physicians and hospital beds per unit of population [15], the fair distribution of health services has always been one of the major concerns of health systems worldwide [8, 16]. Not to mention, despite the growing rate of economic growth and dramatic advances in the health sector in the last century, there are still huge inequalities in this respect [17–19], and this has even been one of the main challenges in developed countries [20], especially in Iran [21].
Access to healthcare services is a prerequisite for creating equity in the health of societies, and the right to healthcare will create equal opportunities in societies [22]. Furthermore, laying the groundwork for the equitable enjoyment of health-related interventions is the most significant work that the health system can take to achieve social justice in terms of health. It should be noted that wellbeing is not something that can be distributed directly among people. From the perspective of health, ‘social justice' denotes justice in the distribution of health in society, which is why the health policymakers and stake holders based their strategies on the fair distribution of the determinants of health [23, 24]. Since unbalanced distribution of services leads to the inefficiency and inappropriate service provision [17, 24] (e.g., imbalances in health workforce in terms of quantity, quality, and distribution), will have consequences for health [25]. In 2008, the world health organization (WHO) announced that all people should have access to healthcare in accordance with their needs, regardless of their payment power [26]. The lack of proper access to medical care in societies has resulted in negative consequences, such as social inequity, increased disease, growing mortality from illnesses, accidents and unbalanced distribution of services [17, 24, 27].
Research indicates that inappropriate concentration of facilities and medical care is seen as a major problem in many countries [8, 24, 28–32]. This problem has also been observed in Iran [25]. Similarly, in Iran, Shahabi et al. [33] reported that the privileged provinces were three times better than the underprivileged ones in terms of the ratio of physicians, hospital beds, laboratories and radiology services to the population. In another similar study conducted by Mehrjardi et al. [34], the status of development and ranking of Iranian provinces were addressed in terms of access to the indexes of the health sector. The results of their research revealed that among 30 provinces of Iran, 12 were developed, nine were semi-developed, and nine were underdeveloped, in their categorization, Kermanshah Province was among the semi-developed provinces [34]. Studies conducted in Kermanshah the high significant rates for HIV/AIDS [35], cancer [36], cardiovascular diseases [37], accidents [38], high total fertility rates [39], and inadequate access to health centers [11]. Such evidences revealed the need for assessing healthcare resources and surviving the access to these cares.
Since increasing the level of health and easy access to medical care are among the most prominent needs in development plans and considering the fact that the Kermanshah Province is one of the deprived provinces of Iran and given the prevalence of the above mentioned challenges in Kermanshah, this paper aimed to investigate the inequality in access to medical care in the townships based in Kermanshah, Iran according to population density.
Materials and methods
Study design
The study was a descriptive-analytic study, and the required statistics and information were collected from the population and housing census conducted by the main referral Statistical Center of Iran (SCI) in 2011 and the Vice Chancellery for the Department of Treatment at Kermanshah University of Medical Sciences. In Kermanshah province, 14 townships located they are including: Kermanshah, Islamabad, Dalahu, SarpulZahab, Qasr-e Shirin, Gilan-e-Gharb, Javanrood, Paveh, Salas-e Babajani, Ravansar, Harsin, Sahneh, Kangavar, and Songhor. It should be noted that the borders of these townships were determined according to the administrative-political divisions of the year 2015. In this study these 14 townships were investigated in terms of access to standardized medical care indexes according to population density and based on covered population included: the nursing staff, paramedical staff—the non-physicians working in the field of health—(such as physiotherapy, occupational therapy, speech therapy and radiography, anesthesia, laboratory sciences, and radiology), the administrative personnel of health and treatment, doctors (general practitioners and specialists), dentists, pharmacists, hospitals, active beds in hospitals, clinics (general and specialized), radiology, rehabilitation centers, and finally laboratories.
In this study, the coefficient of variation of the ratio of access indexes to the medical care to a population of 10,000 residing in townships was employed as an index for showing the lack of uniformity [40]. More to the point, the higher this index, the greater the dispersion of the above-mentioned variable would be. This index is calculated as follows [41]:
CV = Coefficient of variation
Standard deviation = σ
Mean = μ
The degree of development of the townships was calculated in terms of access to medical care using the hierarchical cluster analysis (HCA) through the Ward Algorithm [42], and the combined model of human development index (HDI) [43]. In this regard, the townships were classified according to these indices into 3 groups as deprived, developing and privileged groups, respectively.
The overall structure of the HDI Model is shown as follows in Formulae 2.
WhereXirepresents the indexes used in the HDI model [43].
The second stepwise the definition of the mean index for each of the townships for achieving this aim Formulae 3 was applied.
In this formulae Xj represents the average index for each township, and Xi represents the indexes used in the HDI Model.
The third step of this method was to calculate the human development which its value is between zero and one (the closer the obtained value to one, the more developed it will be) [43]. This was assessed by Formulae 4.
The tests were employed to identify the deployment pattern of the status of accessing to medical care indexes across the Kermanshah-based townships were including: Mean Center and Standard Distance.
(A) Mean Center: It is the mean of geographical latitude and longitude coordinates of all features within the scope of the study, and its calculation is appropriate for both tracking the changes in the spatial distribution of terrains and their comparisons. It is calculated as follows [11]:
Where Xi and yi are the coordinates for feature i, and n is equal to the total number of features.
(B) Standard Distance (SD): It is a method for examining the level of concentration or dispersion of geographic features around the mean center and is calculated as follows [11]:
Where xi and yi are the coordinates of feature i, {}represents the mean center for the features, and n is equal to the total number of features.
Not to mention, all spatial processing was performed using the Arc GIS 9.3 Software.
Results
The findings showed that there were 16.55 nursing staff, 6.73 paramedics, 11.97 health care personnel, 2.48 general practitioners, 2.51 specialists, 1.29 dentists and 0.16 pharmacists per 10,000 people in Kermanshah Province in 2011. There were also (0.11) hospitals, (13.24) active hospital beds, (0.20) clinics, (0.02) specialized clinics, (0.15) general clinics, (0.30) radiology wards, (0.31) rehabilitation centers and (0.66) labs per 10,000 people (Table 1).
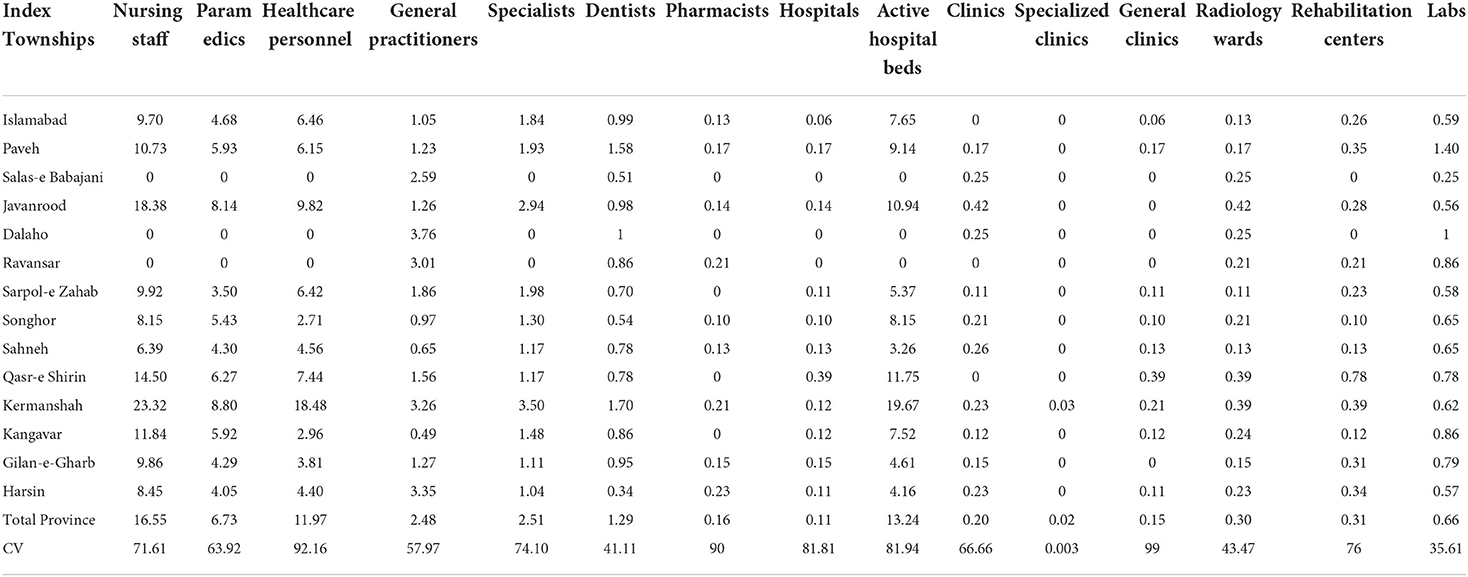
Table 1. The distribution of health professionals and treatment facilities per 10,000 people in the townships of Kermanshah Province.
In terms of the ratio of nursing workforce to a population of 10,000 in townships, it was found out that the largest number of nursing staff belonged to Kermanshah Township (23.22) and the smallest numbers belonged to the townships of Salas-e Babajani, Dalahu and Ravansar. The largest number of paramedics per 10,000 people belonged to Kermanshah (8/80), whereas Salas-e Babajani, Dalaho and Ravansar had the fewest paramedics. Furthermore, Kermanshah held the highest number of administrative personnel in healthcare per 10,000 people (18.48), as opposed to the lowest numbers in the townships of Salas-e Babajani, Dalaho and Ravansar (Table 1).
In terms of the ratio of general practitioners in different townships, Dalaho and Kangavar had the highest and lowsest ratios (3.76 and 0.49, respectively). Moreover, the largest number of specialists were in Kermanshah (3.50), whereas Dalaho, Salas-e Babajani and Ravansar had the fewest specialists (Table 1).
The ratio of dentists to a population of 10,000 in each townshipwas another index that shows the distribution of dental workforce across townships. More to the point, Kermanshah and Harsin had the highest and lowest numbers of dentists (1.7 and 0.34, respectively) (Table 1).
The highest number of pharmacists per 10,000 people was in Harsin (0.23), as opposed to the lowest numbers in the townships of Salas-e Babajani, Dalaho, SarpulZahab, Qasr-e Shirin and Kangavar (Table 1).
Paveh had the highest ratio of hospitals to ten thousand people (0.39), whereas Salas-e Babajani, Dalaho and Ravansar had the lowest ratios. However, in terms of active hospital beds, Kermanshah had the highest level (19.67), as opposed to Salas-e Babajani, Dalaho and Ravansar where there were no active hospital beds (Table 1).
The ratio of specialized clinics to 10,000 people measured 0.03 in the township of Kermanshah, whereas other townships lacked the necessary services. However, in terms of public hospitals, Qasr-e-Shirin had the highest ratio, as opposed to the lowest ratios in Salas-e Babajani, Javanrood, Dalaho, Ravansar, and Gilan-e-Gharb (Table 1).
In addition, in terms of the ratio of radiology centers to a population of 10,000, Javanrood (0.42) and in Sarpol-e Zahab (0.11) had the highest and lowest ratios, respectively (Table 1).
In terms of the ratio of rehabilitation centers to a population of 10,000, Qasr-e-Shirin had the highest ratio (0.78), as opposed to the lowest ratios in Salas-e Babajani and Dalaho Townships (Table 1).
In addition, in terms of the ratio of laboratories to a population of 10,000, Paveh and Salas-e Babajani had the highest and lowest ratios (1.40 and 0.25, respectively) (Table 1).
Furthermore, the coefficient of variation (CV) revealed that the indices under study were unequally distributed across the townships of Kermanshah (Table 1).
Hierarchical cluster analysis with ward algorithm
According to the results of cluster analysis, the Kermanshah townships were divided into three categories (deprived, developing and privileged) in terms of access to health services. The deprived townships included Ravansar, Dalaho and Salas-eBabajani, and the developing townships included Gilan-e-Gharb, Harsin, Sarpol-e Zahab, Sahneh, Islamabad, Paveh, Songhor, and Kangavar. While Kermanshah, Qasr-e Shirin and Javanrood were among the privileged areas (Figure 1).
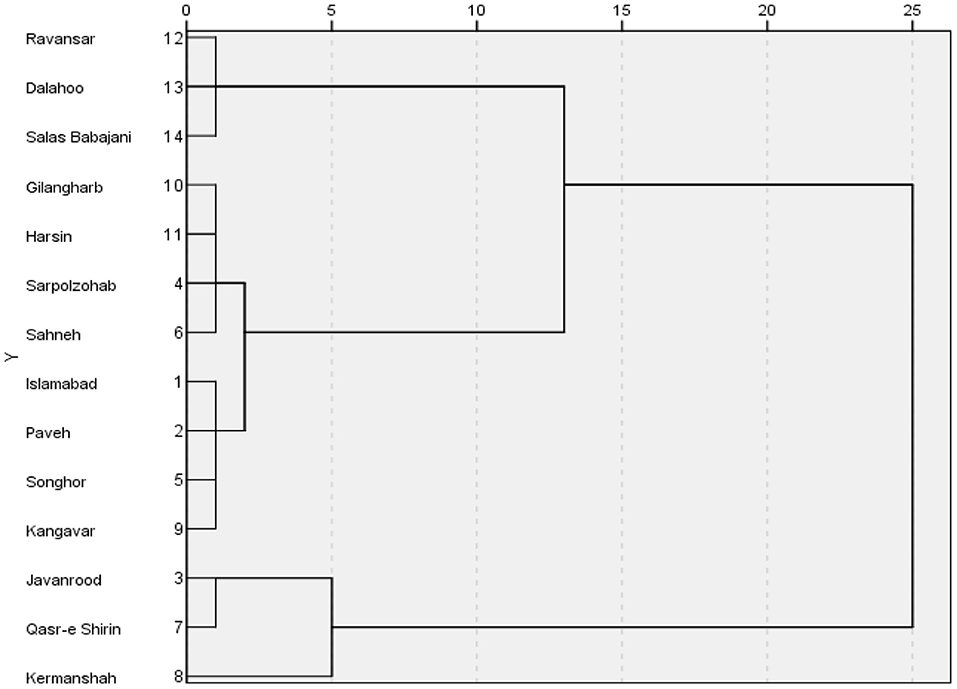
Figure 1. Cluster diagram of the indexes of access to medical care at the townships.
Based on the combined model of HDI, the findings of the present study indicated that Ravansar, Dalaho and Salas-eBabajani were the most deprived townships in terms of access to medical care (Table 2; Figure 2).
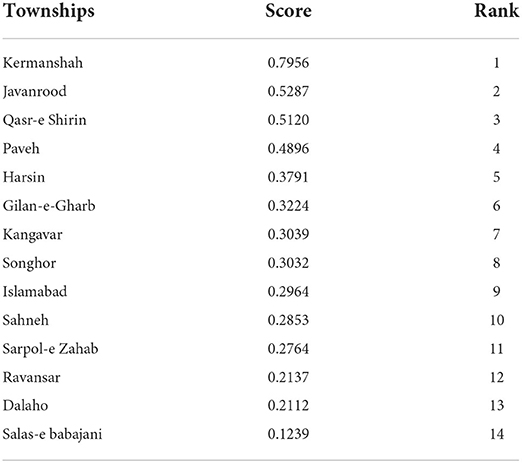
Table 2. Status of townships in terms of access to medical services based on the combined model of HDI.
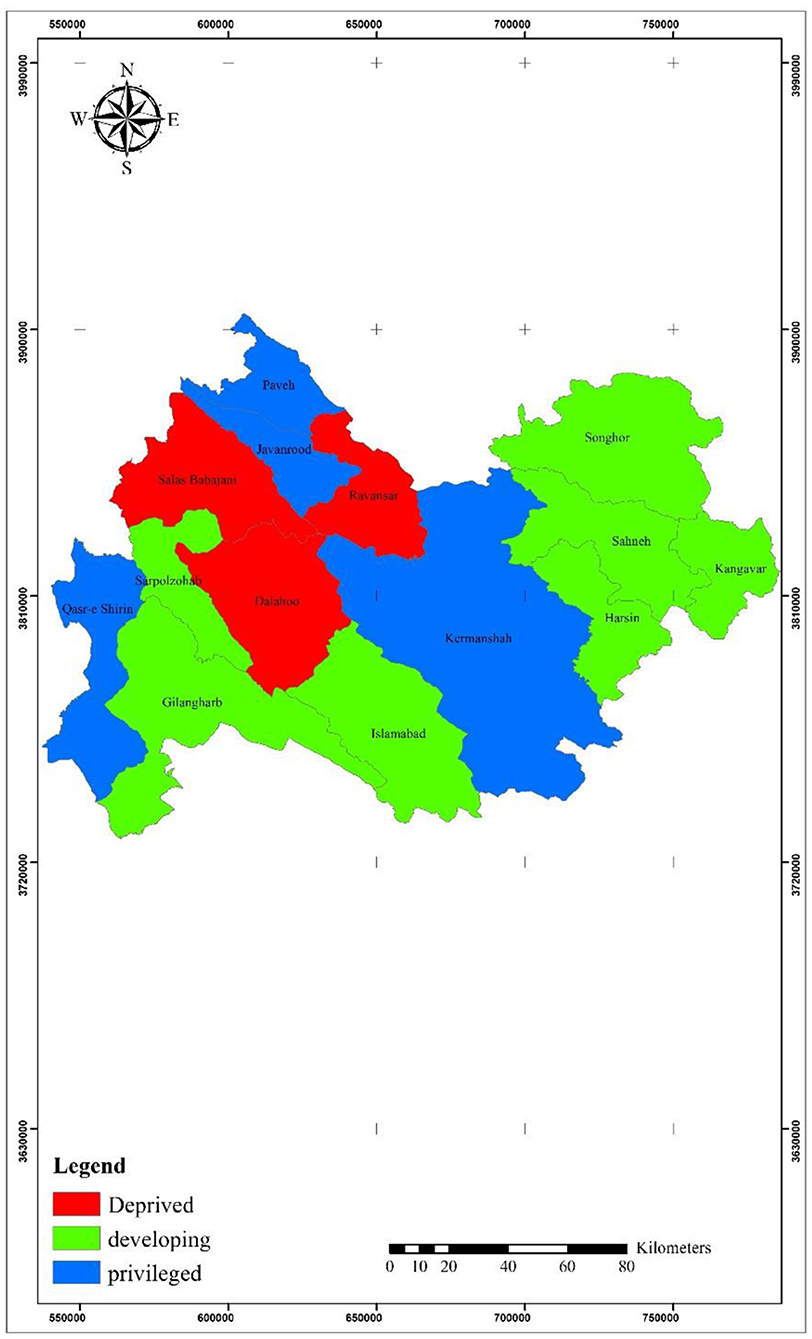
Figure 2. The status of townships in terms of access to medical care based on the combined model of HDI.
Mean center and standard distance
The results of measures of central tendency showed that the center of the establishment of health indexes was located in the Kermanshah Township. The standard distance of the distribution pattern of health services showed a high concentration in the central areas. The elongation of the standard distance of health services was indicative of the fact that their accumulation was in certain places of the province.
The results of comparing the mean centers of population and health facilities indicated that the centers of both data categories were located in Kermanshah. However, the results of observing the standard distance (population and health facilities) showed that the standard distance of health centers was larger. In other words, geographically, the health facilities witnessed more dispersion in the northwestern regions than the concentration of population in the central and southeastern regions of the province (Figure 3).
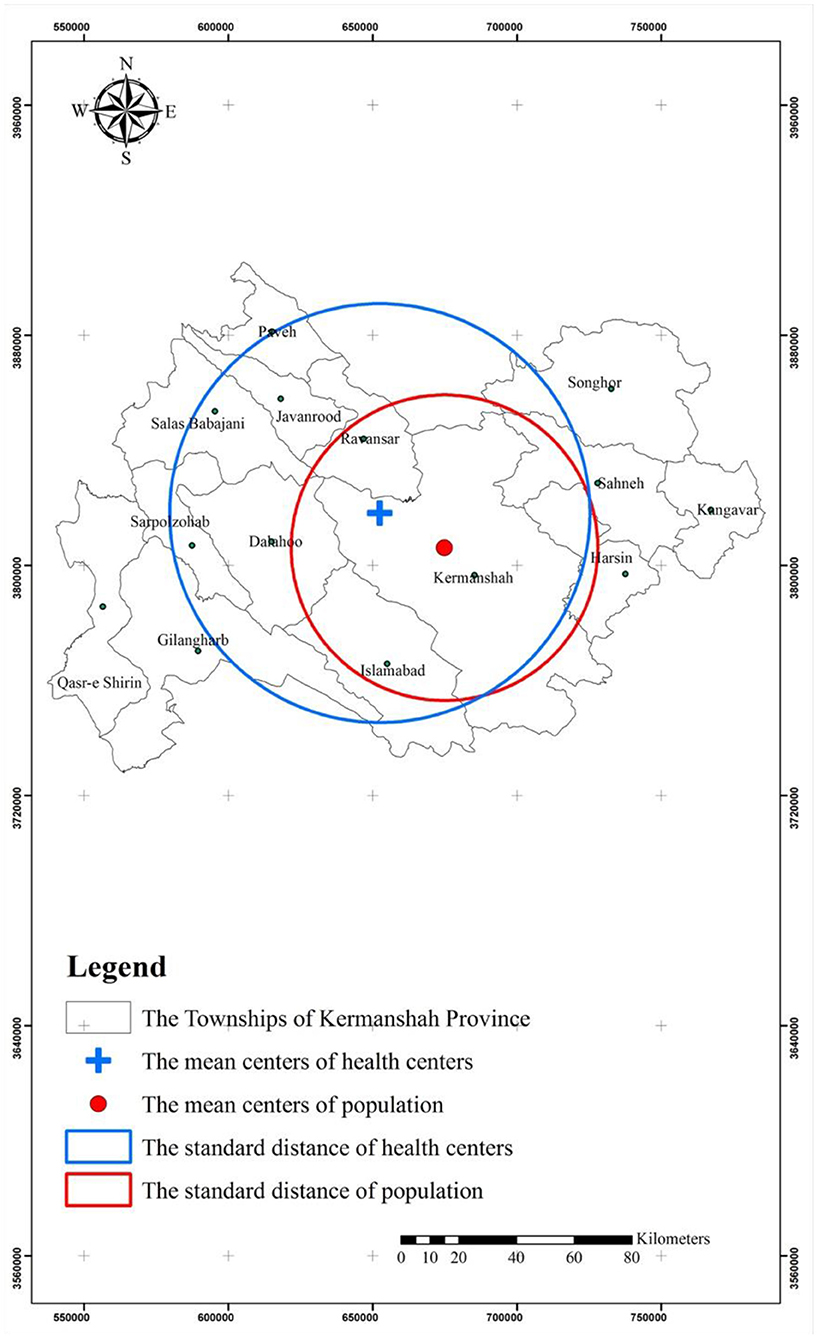
Figure 3. Spatial and standard distance of health services and population in the townships.
Discussion
Access to medical care is one of the major issues affecting the human health from different aspects. One way to achieve this goal in societies is the equal access to the facilities of the health sector. Therefore, the present study aimed to investigate inequality in access to medical care in the townships based in Kermanshah, Iran.
The results of studying the status quo of the distribution of health resources in Kermanshah showed that there was heterogeneity in this regard, which was consistent with the results of studies stating that there were large gaps between different regions in Iran in terms of this factor [9, 11, 33, 40, 44, 45]. In a study performed by Reshadat et al. [9], it was concluded that the factors such as lack of planning, wrong policymaking in terms of the distribution of health services, unfair distribution of financial resources and structural problems accounted for this situation. In addition, the consequences of the 8-year war between Iran and Iraq, economic sanctions, political-economic weaknesses, excessive population growth, and excessive migration of villagers to cities might account for this situation in Iran [46]. Besides, the health status of people in various health issues, including diseases and other cases in Kermanshah will be negated by the lack of proper access to healthcare supplies [36, 47].
In terms of the ratio of specialists to a population of 10,000 people, the results of the present study were indicative of an unequal distribution of facilities across the townships of Kermanshah Province. Moreover, the townships of Salas-e Babajani, Dalahu and Ravansar had the lowest ratios, as opposed to Kermanshah with the highest ratio. This finding was similar to those conducted in other studies in Iran [9, 33]. Not to mention, it seems that the Ministry of Health has done poorly in terms of the distribution of specialists among regions, thereby leading to a shortage of specialized and experienced physicians throughout many areas of the country. Since according to the World Health Organization, the ratio of physicians (general and specialist) to 10,000 people in the world is 15.55, whereas this index has been 4.30 and 26.80 in developing and developed countries, respectively [48]. This index measured 11.9 and 2.49 in Kermanshah Province and Iran, respectively (see Table 1) [49]. In addition, the results of the present study were indicative of the fair distribution of general practitioners. In this regard, according to the findings of studies conducted in Iran, the geographical, demographic and economic, social and political factors such as economic growth, culture and beliefs and factors associated with individual and motivational characteristics of physicians, such as age, gender, and payment system, have been found effective in this regard [50].
In our study, the ratio of general practitionersto 10,000 people was 2.48. However, a rate of 10.2 was reported for Iran by Haghdoost et al. [51]. The highest ratios of general practitioners to 10,000 people were in Tehran (18.7), Yazd (13.9) and Isfahan (12.20), respectively. While, the lowest ratios were observed in North Khorasan (3.4%), Sistan and Baluchestan (3.7) and South Khorasan (3.8), respectively [51].
The results of the study showed that there was an inadequacy of medical personnel in the Kermanshah Province. Hence, it is necessary for healthcare policymakers totake some measures in this respect. Therefore, it is recommended that the greater consideration be given to deprived areas and fair distribution of healthcare resources. It is also essential that the challenges and barriers to this access be investigated in further studies because, as stated in other studies, access to health services for all people is considered one of the major criteria of healthy societies, and there will be no sustainable development in the case of continuance of the status quo. Besides, the health of communities will not continue to improve without creating a healthy environment and without provision of healthcare services [52].
In our study, the ratio of active beds to 10,000 people in Kermanshah Province was 13.24. In a study conducted by Shahabi et al. [33], this index measured 15, 14.1 and 15.7 in Semnan, Yazd, ChaharmahalBakhtiari Provinces with the most active beds, as opposed to Lorestan (5.40), Qom (5.40), Gilan (4.70) and Qazvin (6.10) with the fewest active beds, respectively [33].
The ratio of active beds to a population of 10,000 in each township is one of the important indicators of health. In this study, the results demonstrated that the unequal distribution of active beds at township levels has been similar to the results of other studies performed in Iran [33, 53]. It is believed that the inappropriate distribution of health resources in Kermanshah may have been due to the need for services and the lack of adequate equipment and human resources. Other studies have shown that specific geographical conditions and lack of welfare facilities might account for the lack of hospitals with appropriate beds in townships [54]. In another study, it was concluded that the policies and plans leading to the concentration of activities and services in large cities accounted for this unequal distribution [55, 56].
The results of the study demonstrated that the distribution of nurses to 10,000 people across the townships in Kermanshah witnessed an inequality distribution. The results of a study conducted in public hospitals of Iran indicated that the Semnan Province had the highest ratio of nurses to the population [21, 33], and Sistan and Baluchestan Provinces had the lowest ratio with 2.40 nurses, which was due to the location and area of each province, the dispersion of the population, and the number of nurses [48].
In addition, the results of the present study showed that the distribution of dentists to 10,000 people in the Kermanshah Province measured 1.29. In a study conducted in Iran in 2010, the distribution of dentists was 2.90. Moreover, the results indicated that the ratios of dentists to 10,000 people measured seven in Tehran, 3.2 in Isfahan and three in Yazd, which were the largest. However, this ratio measured 0.9 in Sistan and Baluchestan, 0.9 in Ardebil, and one in North and South Khorasan and Hormozgan, which were the smallest [51].
Additionally, the results of the present study demonstrated that the distribution of pharmacists to 10,000 people in the Kermanshah Province measured 0.16. In a study conducted in Iran in 2010, this figure was 2.10. The highest number of pharmacists in 10,000 people was in Tehran (4.6), Isfahan (2.2) and East Azarbayejan (2.1), respectively. However, the lowest ratio of pharmacists to the population existed in Hormozgan (0.5) Sistan and Baluchestan (0.7), Kurdistan and South Khorasan (0.8), respectively [51].
In addition, the results of the present study demonstrated that most nursing staff, paramedics, general practitioners and specialists belonged to Kermanshah per 10,000 people, as opposed to the fewest that belonged to the townships of Salas-e Babajani, Dalaho, and Ravansar. Shahabi et al. [33] also showed that there was an inequality in the distribution of these indexes among Iran's provinces over 2001–2006 [33]. This was probably due to the location and area of each township, the distribution of the population and the number of medical personnel in township [55, 57]. Another possible reason might be the healthcare staff's lack of willingness to serve in deprived areas [58, 59]. It should be noted that, according to Alla-Eddini et al. [58], in the case of providing physicians with certain conditions such as the amount of income and type of employment status, they will be ready to serve in deprived areas.
The results of cluster analysis demonstrated that the townships of Kermanshah Province fall into three categories in terms of the development in healthcare: Kermanshah, Qasar-e Shirin and Javanrood fit into the developed category. While the undeveloped category included Ravansar, Dalaho and Salas-e BabajaniTownships (see Figure 1). The results of studies conducted in Kermanshah were indicative of the fact that the townships of Qasr-eShirin, Kermanshah and Paveh were privileged, whereas the townships of Sahneh, Dalaho and Salas-e Babajani were deprived. This finding was not concurrent with the results of studies performed by Rezai et al. [60]. Moreover, the results of studies, conducted at country and provincial levels, on the status of access to and proper distribution of health resources have emphasized the existence of a vacuum and unequal and imbalanced distribution in healthcare services and resources in Iran [55, 61, 62]. The development indexes of healthcare services have not been distributed equitably on a par with other development indexes among the geographical regions in developing countries [57, 63, 64]. Accordingly, there is a gap in the development of these indexes, which is clearly seen in the townships of Kermanshah Province. This situation, as emphasized in other studies, results in regional inequalities in health in addition to inequalities in access to healthcare services [55, 61, 62], which are mainly due to differences in the levels of economic development and differences in access to various health and medical facilities [17], thereby making residents of the disadvantaged areas temporarily migrate to large cities for the benefit of facilities and services, which require a great deal of time and expenses [65]. Research has shown that promoting healthcare systems and appropriate access to medical care will lead to eradicating poverty, educating women, empowering women, reducing child mortality rates, promoting maternal health, combating AIDS, Malaria and other diseases, thereby providing people with sustainable health [66]. Therefore, the health policymakers should consider the adjustment of this situation in Kermanshah.
The results also indicated that geographically, the health facilities were more dispersed in the northwestern regions. However, the concentration of population was in the central and southeastern areas of the province, thereby leading to inequality in access to healthcare, which is an indication of the lack of coordination between the healthcare sector and equality policies in this area. This situation, as expressed in other studies, has been influenced by the willingness of governments and local authorities to give some regions more access to medical care due to their natural features or their influence in planning and political centers [67]. So, given Kermanshah's large population (1,900,831 people) and its high HIV [35], unemployment and poverty [68] statistics as well as the distribution of gastrointestinal cancer in Kermanshah [36] and the prevalence of accidents [69] in this province, it is essential to pay attention to the equitable access of medical care provided by the health policymakers in the province.
Given that GIS is useful for assessing various spatial disparities [63] including healthcare needs as well as analyzing access to health services and understanding inequalities among different locations, and the fact that it is a good tool for evaluating health policies which bring about reductions in health costs and result in development of health at the community level [70], it is recommended that this tool be used in management and promotion of health in the Kermanshah Province.
Limitations
In this paper, the reasons for this lack of access were not covered. Instead, the indexes were addressed that explained the quantitative dimensions of health development, and given that the qualitative dimensions of health development, which represent the quality of service delivery, are also important aspects of access to medical care, it is, therefore, suggested that the qualitative aspects of access to health services should be addressed in future studies, too. Furthermore, the dimensions of inequality were studied at the levels of townships since the inequality dimensions remain unknown largely at lower levels (rural and urban) of country divisions. Hence, it is suggested that the inequalities at the levels of villages and cities be investigated in order to both explain the differences between regions (townships) and clarify the inter-regional differences. We did not have access to the statistics of the community health workers at the local health centers located in rural. Also, the study reported in this paper has some limitations. For example, socio-economic payments required, transport, willingness of health services to accept cultural minorities, physical accessibility for people with disabilities, gender considerations, and cultural attitudes and beliefs about health services and their usefulness.
We were unable to access groups that require relatively higher access and use of health services than others—for example, mothers and babies and older people or others in the population whose health is relatively more at risk- for example those with chronic health conditions.
Conclusions
Easy access to medical care is one of the essential requirements in development programs. Developing countries have allocated a smaller share of their resources to medical care as a result of various reasons including the lack of national health planning, inadequate health care system, and the inadequate considerations in the health sector. In this regard, we are seeing a deep gap in the inequality of access to medical care in developing countries. The province of Kermanshah was investigated as evidence of this claim.
The indices of development of facilities and healthcare resources in the Kermanshah province have not been distributed equitably and delicately balanced among the townships and different geographical regions, and their distribution was not proportional to the population. Besides, despite improvements in health, many residents of the Kermanshah Province suffer from inequality and poor access to health services. Accordingly, it is suggested that the health policymakers of the Kermanshah Province reconsider the policies on the equitable distribution of healthcare services throughout the province. It is also recommended that priority be given to underdeveloped townships toward provision of equal access for the deprived population to services.
Data availability statement
The datasets used in the study are available from the corresponding author on reasonable request.
Ethics statement
The studies involving human participants were reviewed and approved by Kermanshah University of Medical Sciences. The patients/participants provided their written informed consent to participate in this study. Written informed consent was obtained from the individual(s) for the publication of any potentially identifiable images or data included in this article.
Author contributions
SR and AZ were in charge of the research (i.e., conceptualization and writing). AZa and AZi did the literature review and contributed to the composition of the paper. AZ and RT carried out the analysis, assisted in data interpretation, and wrote the paper. NF, FK, and AZ supported the analysis of the findings and the development of programming implications. SG and SR were in charge of data collection and study coordination. AZ co-led the conceptualization, monitored all elements of the paper's development, and offered considerable feedback on the text. The study was carried out by all of the authors. The final document has been read and approved by all of the writers.
Funding
This work was supported by the colleagues in the Kermanshah University of Medical Sciences, as well as the financial and spiritual supports of the Deputy Head of Research and Technology Department of the Kermanshah University of Medical Sciences are sincerely appreciated under Grant Number 92446.
Conflict of interest
The authors declare that the research was conducted in the absence of any commercial or financial relationships that could be construed as a potential conflict of interest.
Publisher's note
All claims expressed in this article are solely those of the authors and do not necessarily represent those of their affiliated organizations, or those of the publisher, the editors and the reviewers. Any product that may be evaluated in this article, or claim that may be made by its manufacturer, is not guaranteed or endorsed by the publisher.
References
3. Van Minh H, Giang KB, Hoat LN, Chung LH, Huong TTG, Phuong NTK, et al. Analysis of selected social determinants of health and their relationships with maternal health service coverage and child mortality in Vietnam. Glob Health Action. (2016) 9:1–9. doi: 10.3402/gha.v9.28836
4. Gudes O, Kendall E, Yigitcanlar T, Pathak V, Baum S. Rethinking health planning: a framework for organising information to underpin collaborative health planning. Health Inform Manag J. (2010) 39:18–29. doi: 10.1177/183335831003900204
5. Baum S, Kendall E, Muenchberger H, Gudes O, Yigitcanlar T. Geographical information systems: an effective planning and decision-making platform for community health coalitions in Australia. Health Inform Manag J. (2010) 39:28–33. doi: 10.1177/183335831003900305
6. Teimouri R, Yigitcanlar T. An approach towards effective ecological planning: quantitative analysis of urban green space characteristics. Glob J Environ Sci Manag. (2018) 4:195–206.
7. Leon Wyszewianski L, McLaughlin C. Access to care: remembering old lessons. Health Serv Res. (2002) 37:1441–43. doi: 10.1111/1475-6773.12171
8. Orueta JF, García-Álvarez A, Alonso-Morán E, Vallejo-Torres L, Nuño-Solinis R. Socioeconomic variation in the burden of chronic conditions and health care provision-analyzing administrative individual level data from the Basque Country, Spain. BMC Public Health. (2013) 13:870–6. doi: 10.1186/1471-2458-13-870
9. Reshadat S, Zangeneh A, Saeidi S, Teimouri R, Yigitcanlar T. Measures of spatial accessibility to health centers: investigating urban and rural disparities in Kermanshah, Iran. J Public Health. (2019) 27:519–29. doi: 10.1007/s10389-018-0966-9
10. Reshadat S, Zangeneh A, Saeidi S, Ghasemi SR, Rajabi-Gilan N, Zakiei A. Inequalities in access to hospitals: a case study in the Islamic Republic of Iran 1997–2012. Eastern Mediterranean Health J. (2018) 25:119–23. doi: 10.26719/emhj.18.061
11. Reshadat S, Saedi S, Zangeneh A, Ghasemi S, Gilan N, Karbasi A, et al. Spatial accessibility of the population to urban health centres in Kermanshah, Islamic Republic of Iran: a geographic information systems analysis. Eastern Mediterranean Health J. (2015) 21:389. doi: 10.26719/2015.21.6.389
12. Carey G, Malbon E, Reeders D, Kavanagh A, Llewellyn G. Redressing or entrenching social and health inequities through policy implementation? Examining personalised budgets through the Australian National Disability Insurance Scheme. Int J Equity Health. (2017) 16:192. doi: 10.1186/s12939-017-0682-z
13. Wisk LE, Sharma N. Inequalities in adolescent and young adult health insurance coverage and access to health care post-federal health reform. J Adolt Health. (2018) 62:S19. doi: 10.1016/j.jadohealth.2017.11.038
14. Janković J, Šiljak S, Erić M, Marinković J, Janković S. Inequalities in the utilization of health care services in a transition European country: results from the national population health survey. Int J Public Health. (2018) 63:261–72. doi: 10.1007/s00038-017-1009-y
16. Park JM. Equity in the utilization of physician and inpatient hospital services: evidence from Korean health panel survey. Int J Equity Health. (2016) 15:159–69. doi: 10.1186/s12939-016-0452-3
17. Fang P, Dong S, Xiao J, Liu C, Feng X, Wang Y. Regional inequality in health and its determinants: evidence from China. Health Policy. (2010) 94:14–25. doi: 10.1016/j.healthpol.2009.08.002
18. Rosen-Reynoso M, Porche MV, Kwan N, Bethell C, Thomas V, Robertson J, et al. Disparities in access to easy-to-use services for children with special health care needs. Maternal Child Health J. (2016) 20:1041–53. doi: 10.1007/s10995-015-1890-z
19. Liang D, Zhang D, Huang J, Schweitzer S. Does rapid and sustained economic growth lead to convergence in health resources the case of China From 1980 to 2010. J Health Care Organ Prov Financ. (2016) 53:1–20. doi: 10.1177/0046958016631699
20. Doorslaer Ev, Koolman X, Jones AM. Explaining income-related inequalities in doctor utilisation in Europe. Health Econom. (2004) 13:629–47. doi: 10.1002/hec.919
21. Ardelan A, Fatemi R, Alaedini F editors. The comprehensive study of the effective factors to estimate the required number of general physician in Iran. In: Proceed Health Economic Congress Evaluation, Iran (2002).
22. Gulliford M, Morgan M. Access to Health Care. London: Routledge (2013). doi: 10.4324/9780203867952
23. Abolhasani F, Jamshidbeygi E, Mardfard N, Moghimi D, Maleki F. Report of Study the Rates of Represent the Health and Rehabilitation Services and Determination of Structural Characteristics and Geographical Distribution of Providing These Services Centers in 2002 and 2003. Tehran, Iran: Tandis Publication (2009).
24. Mason T, Lau Y-S, Sutton M. Is the distribution of care quality provided under pay-for-performance equitable? Evidence from the Advancing Quality programme in England. Int J Equity Health. (2016) 15:156. doi: 10.1186/s12939-016-0434-5
25. Iranian Council for Graduate Medical Education. The Report in Connection With Requires Specialist Number in Iran. Tehran: Ministry of Health and Medical Education (1999).
26. WHO. The World Health Report 2008: Primary Health Care (Now More Than Ever). Geneva : World Health Organization (2014). p. 1–14. doi: 10.4102/phcfm.v1i1.112
27. Swanson JW, Yao CA, Auslander A, Wipfli H, Hatcher K, Vanderburg R, et al. Patient barriers to accessing surgical cleft care in Vietnam: a multi-site, cross-sectional outcomes study. World J Surgery. (2017) 41:1–12. doi: 10.1007/s00268-017-3896-8
28. Inoue K, Matsumoto M, Toyokawa S, Kobayashi Y. Transition of physician distribution (1980-2002) in Japan and factors predicting future rural practice. Rural Remote Health. (2009) 9:1070–5. doi: 10.22605/RRH1070
29. Moscovice I. Policy Approaches for improving the distribution of physicians. Health Serv Res. (1983) 18:270.
30. Rivo ML, Kindig DA. A report card on the physician work force in the United States. New England J Med. (1996) 334:892–6. doi: 10.1056/NEJM199604043341405
31. Carter R. The relation between personal characteristics of physicians and practice location in Manitoba. CMAJ Canadian Med Associat J. (1987) 136:366–8.
32. Farzadfar F, Naghavi M, Sepanlou SG, Moghaddam SS, Dangel WJ, Weaver ND, et al. Health system performance in Iran: a systematic analysis for the Global Burden of Disease Study 2019. Lancet. (2022) 399:1625–45. doi: 10.1016/S0140-6736(21)02751-3
33. Shahabi M, Tofighi S, Maleki M. The nurse and specialist physicians manpower distribution by population and its relationship with the number of beds at public hospitals in Iran's 2001–2006. J Health Administr. (2010) 13:7–14.
34. Mehrjardi MHT, Mybodi HB, Sharifabadi AM. Investigation and ranking of Iranian provinces in terms of access to health sector indicators. Director General. (2012) 9:356–65.
35. Khademi N, Reshadat S, Zangeneh A, Saeidi S, Ghasemi S, Rajabi-Gilan N, et al. A comparative study of the spatial distribution of HIV prevalence in the metropolis of < city>Kermanshah < /city>, Iran, in 1996–2014 using geographical information systems. HIV Med. (2016) 18:137–42. doi: 10.1111/hiv.12416
36. Reshadat S, Saeidi S, Zangeneh AR, Khademi N, Khasi K, Ghasemi S, et al. Spatiotemporal Distribution of Gastrointestinal Tract Cancer through GIS over 2007–2012 in Kermanshah-Iran. Asian Pacific J Cancer Prev. (2015) 16:7737–42. doi: 10.7314/APJCP.2015.16.17.7737
37. Assa A, Frenkel-Nir Y, Tzur D, Katz LH, Shamir R. Cardiovascular risk factors in adolescents with celiac disease: a cross sectional population based study. J Pediatr Gastroenterology Nutr. (2017) 64:1487. doi: 10.1097/MPG.0000000000001487
38. Yadollahi M, Ghiassee A, Anvar M, Ghaem H, Farahmand M. Analysis of Shahid Rajaee hospital administrative data on injuries resulting from car accidents in Shiraz, Iran: 2011–2014 data. Chinese J Traumatol. (2017) 20:27–33. doi: 10.1016/j.cjtee.2015.10.006
39. Reshadat S, Zangeneh A, Saeidi S, Ghasemi SR, Rajabi Gilan N, Abbasi S. Investigating the economic, social and cultural factors influencing total fertility rate in Kermanshah. J Mazandaran Univ Med Sci. (2015) 25:108–12.
40. Sepehrdoust H. Health care analysis and regional disparities in different provinces of Iran. Iran Economic Rev. (2009) 14:113–34. doi: 10.1186/s12954-020-00392-1
41. Teoh WL, Khoo MB, Castagliola P, Yeong WC, Teh S. Run-sum control charts for monitoring the coefficient of variation. European J Operat Res. (2017) 257:144–58. doi: 10.1016/j.ejor.2016.08.067
42. Köhn HF, Hubert LJ. Hierarchical cluster analysis. Wiley StatsRef: Statistics Reference Online. (2006).
43. McGillivray M. The human development index: yet another redundant composite development indicator? World Develop. (1991) 19:1461–8. doi: 10.1016/0305-750X(91)90088-Y
44. Shojaei P, Ghanbarzadegan A, Najibi M, Bastani P. Ranking of Iranian provinces based on healthcare infrastructures: before and after implementation of Health Transformation Plan. Cost Eff Resour Alloc. (2020) 18:1–3. doi: 10.1186/s12962-020-0204-5
45. Nobakht S, Shirdel A, Molavi-Taleghani Y, Doustmohammadi MM, Sheikhbardsiri H. Human resources for health: A narrative review of adequacy and distribution of clinical and nonclinical human resources in hospitals of Iran. Int J of Health Plann and Manage. (2018) 33:560–72. doi: 10.1002/hpm.2510
46. Ziari K, Saeedi Rezvani N, Salehpour L. Measuring the degree of development of the Eastern Azerbaijan province city (HDI). Product Manag. (2010) 3:75–95.
47. Reshadat S, Zangeneh A, Saeidi S, Khademi N, Izadi N, Ghasemi SR, et al. The spatial clustering analysis of HIV and poverty through gis in the metropolis of Kermansha, Western Iran. Acta Med Mediterranea. (2016) 32:1995–9.
48. World Health Statistics. Global Health Indicators. Geneva: World Health Organization (2015). p. 40–160.
49. Karimi I, Salarian A, Anbari Z. A comparative study on equity in access to health services in developed countries and designing a model for Iran. Arak Medical Univ J. (2010) 12:92–104.
50. Nasiripour AA, Maleki MR, Tabibi SJ, Chimeh EE. Factors influence on geographic distribution of physicians in selected countries: a review article. J Kermanshah Univ Med Sci. (2013) 17:600–10.
51. Haghdoost AA, Kamyabi A, Sgrabad Ahad A, Sadeghirad B, Shafieyan H. Geographical distribution of different groups of the medical community in the country and regional inequalities. J Med Council Islamic Republic Iran. (2010) 28:411–9.
52. Von Schirnding Y. Health and sustainable development: can we rise to the challenge? Lancet. (2002) 360:632–7. doi: 10.1016/S0140-6736(02)09777-5
54. Mostafavi H, Aghlmand S, Zandiyan H, Alipoori Sakha M, Bayati M, Mostafavi S. Inequitable distribution of specialists and hospital beds in West Azerbaijan Province. J Payavard Salamat. (2015) 9:55–66.
55. Taghvaei M, Shahivandi A. Spatial distribution of health services in Iranian cities. Soc Welfare. (2011) 10:33–54.
56. Mohammadi M, Ziapoor A, Mahboubi M, Faroukhi A, Amani N, Hydarpour F, et al. Performance evaluation of hospitals under supervision of Kermanshah medical sciences using pabonlasoty diagram of a five-year period (2008–2012). Life Sci J. (2014) 11:77–81.
57. Zarabi A, Mohammadi J. Spatial analysis of development indicators of health care. J Soci Welfare. (2008) 7:213–34.
58. Alla-Eddini F, Fatemi R, Ranjbaran Jahromi H, Asghari E, Eskandari S, Ardalan A, et al. Iranian physicians' willingness to work in underserved areas and related factors in 2001. Razi J Med Sci. (2004) 11:247–55.
59. Rabinowitz HK, Diamond JJ, Markham FW, Hazelwood CE. A program to increase the number of family physicians in rural and underserved areas: impact after 22 years. JAMA. (1999) 281:255–60. doi: 10.1001/jama.281.3.255
60. Rezaei S, Ghazanfari S, Kazemi Z, Karyani AK. Access to healthcare facilities: case study of Kermanshah province. J Kermanshah Univ Med Sci. (2014) 18:416–25.
61. Sulaimany A, Masum MG, Riahi V. The development level of health indicators in Kermanshah province from the perspective of social justice in 2010. J Kermanshah Univ Med Sci. (2014) 17:647–56.
62. Bahadori M, Shams L, Sadeghifar J, Hamouzadeh P, Nejati M. Classification of health structural indicators using scalogram model in Golestan province, Northern Iran. Iran J Public Health. (2012) 41:58–65.
63. Dummer TJ, Cook IG. Health in China and India: a cross-country comparison in a context of rapid globalisation. Soc Sci Med. (2008) 67:590–605. doi: 10.1016/j.socscimed.2008.04.019
64. Gauri V. Social rights and economics: claims to health care and education in developing countries. World Develop. (2004) 32:465–77. doi: 10.1016/j.worlddev.2003.07.009
65. Zarrabi A, Shaykh Baygloo R. Classification of Provinces of Iran by health indicators. Soc Welfare. (2011) 11:107–28.
66. Baldacci E, Clements B, Gupta S, Cui Q. Social spending, human capital, and growth in developing countries. World Develop. (2008) 36:1317–41. doi: 10.1016/j.worlddev.2007.08.003
67. Kazemi A, Rezapoor A, Faradonbeh S, Nakhaei M, Ghazanfari S. Study the development level of provinces in Iran: a focus on health indicators. J Health Administrat. (2015) 18:59.
68. Rostaei S, Ahadnejad Reveshty M, Asghari Zamani A, Zangenh A. Assessment of Urban Poverty Spatial Distribution in Kermanshah City. Soc Welfare. (2012) 12:77–101.
69. Izadi N, Khoramdad M, Jamshidi P, Shafiei J, Firouzi A. Epidemiological pattern and mortality rate trend of road traffic injuries in Kermanshah Province (2009–2014). J Community Health Res. (2016) 5:158–68. doi: 10.5812/traumamon.39880
Keywords: healthcare, medical care inequality, human development index, spatial analysis, cluster analysis, Kermanshah, Iran
Citation: Reshadat S, Zangeneh A, Ziapour A, Farahmandmoghadam N, Khosravi Shadmani F, Teimouri R, Golanbari SZ and Rostami S (2022) A survey of statistical methods for inequalities in access to healthcare—Kermanshah in West Iran. Front. Appl. Math. Stat. 8:976930. doi: 10.3389/fams.2022.976930
Received: 23 June 2022; Accepted: 08 July 2022;
Published: 27 July 2022.
Edited by:
Valentina De Simone, University of Campania Luigi Vanvitelli, ItalyReviewed by:
Ali Sahebi, Medical University of Ilam, IranSalvatore Scognamiglio, University of Naples Parthenope, Italy
Copyright © 2022 Reshadat, Zangeneh, Ziapour, Farahmandmoghadam, Khosravi Shadmani, Teimouri, Golanbari and Rostami. This is an open-access article distributed under the terms of the Creative Commons Attribution License (CC BY). The use, distribution or reproduction in other forums is permitted, provided the original author(s) and the copyright owner(s) are credited and that the original publication in this journal is cited, in accordance with accepted academic practice. No use, distribution or reproduction is permitted which does not comply with these terms.
*Correspondence: Alireza Zangeneh, YWxpLnphbmdlbmVoODhAZ21haWwuY29t