 Meitner Cadena*†
 Marco Méndez†
- DECE, Universidad de las Fuerzas Armadas - ESPE, Sangolqui, Ecuador
Here we assess countries' management of the coronavirus 2019 (COVID-19) pandemic using the reliability measure P(X ≤ Y). In this management, all kind of strategies as interventions deployed by governments as well individuals' initiatives to prevent, mitigate, and reduce the contagion of this disease are taken into account. Also, typical customs practiced locally and influencing contagion are included. Regarding a number of countries and rates associated to deaths and incidence, orderings of countries about such management are established, by using the measure of reliability indicated above. In this way, countries are distinguished from each other depending on how they managed this pandemic. This kind of analysis may be extended to the management of other diseases.
1. Introduction
The outbreak of the disease called COVID-19 that appeared in 2019 and was caused by the severe acute respiratory syndrome coronavirus 2 (SARS-CoV-2) has challenged the world's health systems by increasing demand for care of their patients. As of the third year of the pandemic, there have been over 400 million confirmed cases and almost 6 million deaths. Thus, this new disease has triggered the rapid development of a number of measures to detect, prevent, mitigate, and reduce its impacts. Among these measures, non-pharmaceutical interventions like those applied during the Spanish Flu were again applied [1]. However, the efficacy of these initiatives was limited since the disease was previously unknown. Alternatively, vaccines were considered as essential to fight against COVID-19, but their rapid evaluation processes due to the urgency of using them may have limited their popularity [2, 3]. In addition to these issues, vaccine availability and access were constraining factors. In practice, countries adopted diverse mixtures of protection measures to overcome risks of this disease like contagions, hospitalizations, and deaths. These mixtures were mainly proposed by governments and built on the available protection options [4–7]. However, all these conditions led countries to experience complex situations in a number of sectors other than health, as food security, local and global economy, education, tourism, and environmental air pollution [8, 9]. Such difficult situations also involved concerns experienced by individuals about sports and leisure, gender relations, domestic violence/abuse, and mental health [9].
Despite the highly complex and ever-evolving situations caused by COVID-19, it is of interest to identify good practices learned from successful managements of COVID-19. In fact, these lessons may suggest recommended practices to better protect populations from COVID-19 and other similar diseases. Different types of analyzes have been performed to identify and assess impacts of protection measures put in place. The case fatality rate (CFR), computed as the ratio of deaths among all patients confirmed with a disease causing an epidemic, is considered usually a benchmark for assessing and comparing the severity of this epidemic between countries. Variations in this rate during peaks and outbreaks would evidence response impacts against the disease [10]. However, it is hard to get the numbers for computing this rate [11, 12]. Deaths are right-censored because of a time delay between the appearance of symptoms and death, whereas confirmed patients are not entirely determined, leading to biased numbers. Alternatively, some scholars have studied the effects of a single category of interventions, such as travel restrictions [13, 14], social distancing [15, 16], and personal protective measures [17]. More recently, [6] analyzed the effects of multiple interventions, but only the non-pharmaceutical ones implemented by governments were considered. In this paper, we propose a method to assess crucial effects for any set of interventions, including both pharmaceutical and non-pharmaceutical ones. Furthermore, temporality of interventions is also taken into account, as they may vary due to epidemic evolution. This is the case of variants of this disease that eventually appeared as those called Alpha, Delta, and Omicron.
To compare the management of COVID-19 between countries, we use the notion of reliability given by P(X ≤ Y), which is the probability of being in a success state without having entered a failure state, see e.g., Singh and Billinton [18]. The reliability is typically applied when relations stress-strength are analyzed, which are frequent in fields like medicine, quality control, and engineering [19]. However, this measure can also be used in other contexts. For example, [20] compared mortality rates from populations with unequal incomes in order to get lost life years of compensation since human beings can be seen as systems exposed to failures. To the best of our knowledge, this is the first application of reliability to analyze the management of COVID-19. Considering countries as systems, this measure allows assigning a probability to each country X when it is compared to a reference system. Then, adopting another country Y as a reference system, we obtain a set of probabilities R = P(X ≤ Y) for each couple of countries (X, Y). These probabilities thus allow the establishment of orderings among countries, as R numbers define a stochastic order [21, 22]. In this case, such orderings can be easily deduced because relations among countries can be organized into simple schemes.
Our approach to stochastically order countries is a new deep learning method, as it reveals previously unknown order relations among countries [23].
Under our proposed method, the management of COVID-19 in 67 countries during 2021 and the first months of 2022 is analyzed by considering COVID-19 deaths per million (DPM) and COVID-19 cases per million (CPM), which are commonly used rates for comparing countries [24–26]. This means that the effects of Delta and Omicron, two of the main variants of COVID-19 classified as variants of concern by the World Health Organization, are included in this study [27,28].
The rest of the paper is structured as follows. In the next section, the data used and their main features are presented. Section 3 presents the methodology to be applied. It concerns the description of the computation of reliability and the establishment of orderings. Section 4 shows results for each of the variables to be studied. The last section presents concluding remarks.
2. Data
Daily data on mortality and cases due to COVID-19 from 67 countries were obtained from https://covid19.who.int/WHO-COVID-19-global-data.csv, with the exception of Ecuador, whose information was obtained from https://www.salud.gob.ec. The period of analysis was from January 1st, 2021 to February 19th, 2022, which is related to COVID-19 vaccine availability for most of the analyzed countries. These data were downloaded on February 22th, 2022. To avoid some unusual values resulting from data released with delay, daily data were transformed into epidemiological weeks. This kind of week is commonly referred to as an epi week or a CDC week, i.e., a seven-day period starting on Sunday. Furthermore, two-letter country codes defined in ISO 3166-1, called alpha-2 codes, were used instead of the full names of countries.
The total number of individuals from the examined countries was obtained from https://population.un.org. Because the period of analysis is short, such total numbers were assumed to be constant over the studied time interval.
Next, the DPM and CPM variables for a country i and a given epidemiological week j are built using the following expressions.
3. Method
Let us see how to build country orderings by using the notion of reliability given by R = P(X ≤ Y), where X and Y are random variables representing failures of two systems [18]. Note that 0 ≤ R ≤ 1. If R < 0.5 (>0.5), the system represented by X (Y) would be more resistant to failures than the system represented by Y (X), whereas if R = 0.5, both systems behave equally. Since the relations between X and Y are unknown, we propose using the nonparametric R estimate given by the classical Wilcoxon-Mann-Whitney statistic, see [29]. Given samples x1, …, xn of X and y1, …, ym of Y, this nonparametric statistic is expressed by
where I(x, y) = 0 if x ≥ y and I(x, y) = 1 if x ≤ y. This is an unbiased and consistent estimate of R.
Let A and B be two countries and let VA and VB be their corresponding random variables when we focus on a variable V of interest. Then, we define RA, B, V = P(VA ≤ VB) and its estimate is denoted by rA, B, V. This means that RA, B, V < 0.5 (>0.5) implies that VA (VB) would present more frequently higher values than the ones of VB (VA), whereas if RA, B, V = 0.5, both VA and VB behave equally. In the case RA, B, V ≥ 0.5, it is said that VA stochastically precedes VB Based on this inequality, we define a strict version as follows. VA strictly stochastically precedes VB if RA, B, V > 0.5. Using this strict stochastic precedence order, we have that country B performs worse than country A with respect to the variable V if RA, B, V > 0.5.
Let Ai, i = 1, …, s, be a set of countries. When considering the ordering introduced above, a matrix MV of order s × s is built to represent the outputs R between any couple of countries. The element (i, j) of MV is 1 if VAi stochastically precedes VAj; otherwise, this element is 0.
Now, we will deduce a causal diagram associated with MV, i.e., a directed acyclic graph representing probabilistic causal domains [31] Further, directed cycles are included in this diagram, if needed. This directed graph will exclude redundant edges, i.e., edges that do not block all existing paths between the two most extreme vertexes of such a graph.
To this aim, denoting by the directed edge Aj → Ai if the element (i, j) of MV is 1, we propose to apply Algorithm 1. Steps 1 and 2 of this algorithm arrange the matrix MV in such a way that countries with a few 1s by row are placed on top and left of the matrix, whereas those with more 1s are placed on the bottom of the matrix. For each row of this matrix, more 1s means the country's management is relatively better. Step 3 renames countries according to their new positions in MV, calling them Bi, i = 1, …, s. In this way, Bi has less or the same number of 1s than Bj if i < j. These three steps are key because they allow an easy deduction of a causal diagram in some cases. For instance, if under the diagonal of MV there are only 1s, we have B1 → B2 → ⋯ → Bs because some of those 1s evidently represent all the relations Bi−1 → Bi for i = 2, …, s. This ideal ordering would be expected, but variations may arise. Precisely, starting with this ideal relation in Step 4, Steps 5 and 6 modify it if any of the following three situations occurs. First, when there are 0s in positions (i, i−1). Although the corresponding relation has been previously included as Bi−1 → Bi, it must be changed by Bi → Bi−1. Second, when there are 1s located over the diagonal of MV, say the position (i, j) with i < j. This means that their corresponding 0s are located in the position (j, i), i.e., under that diagonal. Thus, the relation Bi → Bj holds and must be added to the causal diagram. Third, once the first situation has happened, the change from Bi−1 → Bi to Bi → Bi−1 breaks the causal diagram in Step 4. Hence, it is necessary to design the “right bridges” to reconnect that diagram. Assuming that the diagram is interrupted in the vertex i and MV has value 1 in the position (i, j) for some j > i, then the relation Bi−1 → Bj is added to the diagram. Proposition 1 guarantees Algorithm 1 works.
Remarks 1. 1. Step 6-b) of Algorithm 1 gives multiple options to choose j. In this paper, we take the minimum of T = {k:i < k ≤ s satisfying Bi−1 → Bk} as j. In this way, the shortest path between B1 and Bs, i.e., the path with the shortest distance from B1 to Bs [32], includes as many countries as possible. Note that selecting a member of T other than its minimum produces a different directed graph.
2. Algorithm 1 does not provide preceding directed edges to vertexes related to Step 6-a). This is not developed because it is not crucial in our analysis.
3. Proposition 1-iii) and Step 6 of Algorithm 1 take into account interruptions due to only one vertex at a time. In case of lack of connection due to several consecutive vertexes, such statements can still be applied by regarding all those consecutive vertexes as if they were only one.
4. The resulting directed graph may include directed cycles.
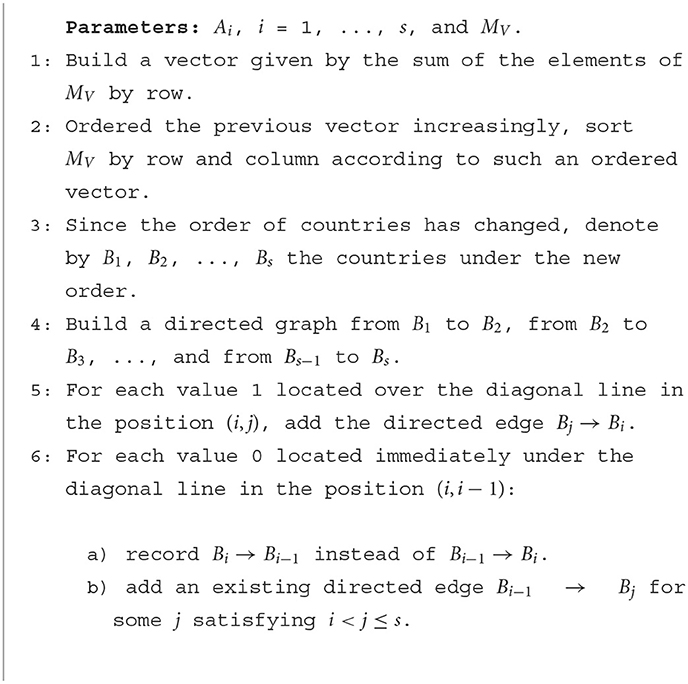
Algorithm 1. Building of a partial ordering from MV.
Proposition 1. Let V be a variable to be analyzed. Let Ai, i = 1, …, s, be a set of countries and MV their associated matrix as defined above. Let , i = 1, …, s. We have:
i) Ai, i = 1, …, s, can be ordered by considering nAi, V, i = 1, …, s.
Assume that there is a country that manages better than the other analyzed countries, and another one that manages worse than the other analyzed countries. Rename Ai, i = 1, …, s, as Bi, i = 1, …, s, by considering an order defined in i). We have:
ii) Bs (B1) is unique and verifies nBs, V = s−1 (nB1, V = 0).
iii) If a directed graph is interrupted at vertex i, 2 ≤ i < s, there exists a vertex j satisfying i < j ≤ s and Bi−1 → Bj.
Proof.
Statement i) follows because nAi, V varies between 0 and s−1.
Assume that there is a country that manages better than the other analyzed countries, say without loss of generality Bs.
Let us prove ii). This assumption means that Bs strictly stochastically precedes Bi, i = 1, …, s−1. Therefore, RBs, Bi, V > 0.5, i = 1, …, s−1, and thus nBs, V = s−1. On the other hand, suppose that there is Bj, j ≠ s, which also manages better than the other analyzed countries. This fact implies that strictly stochastically precedes Bs, i.e., RBj, Bs, V > 0.5. Because of RBj, Bs, V = 1−RBs, Bj, V, we have RBs, Bj, V < 0.5, which contradicts the fact that Bs strictly stochastically precedes Bj. Thus, it is concluded that Bs is unique.
The claims about B1 follow similarly.
Let us prove iii). Consider the set T = {k:i < k ≤ s satisfying Bi−1 → Bk}. This set is not empty because of s ∈ T due to the assumption that there is a country that manages better than the other analyzed countries. The claim then follows.
4. Results
4.1. COVID-19 deaths per million
When considering the reliability of COVID-19 deaths by applying Algorithm 1, the orderings of countries show that some countries perform better than most. These results are presented in Figure 1, which shows a directed graph for all studied countries. In this plot, the directed graph starts in BG, the country with the worst management of COVID-19 deaths, and ends in NZ, representing the country with the best management of such deaths. This last result shows that the assumption enunciated in Proposition 1 is satisfied. Arrows in the graph indicate the relation of management of COVID-19 deaths between pairs of countries, following the ordering defined in Section 3. Paths following arrows indicate consecutive improvements in the management of COVID-19 deaths. Therefore, countries exhibiting the best management are NZ, KY, IS, and SG, while the worst management is observed in BG, HU, PE, and SK. Furthermore, the network of directed edges presents some directed cycles, such as the one established among RU, GR, BR, and PL, or the one among AW, CR, BO, ZA, and UY. However, these cyclical behaviors are experienced only occasionally, indicating that most relations among countries are hierarchical. Moreover, these directed cycles tend to occur more frequently among countries with poorer management. The highlighted shortest path in the directed graph reveals the main countries participating in relations that give a complete order. It should be noted that this path may vary since the directed graph developed by applying Algorithm 1 is not unique.
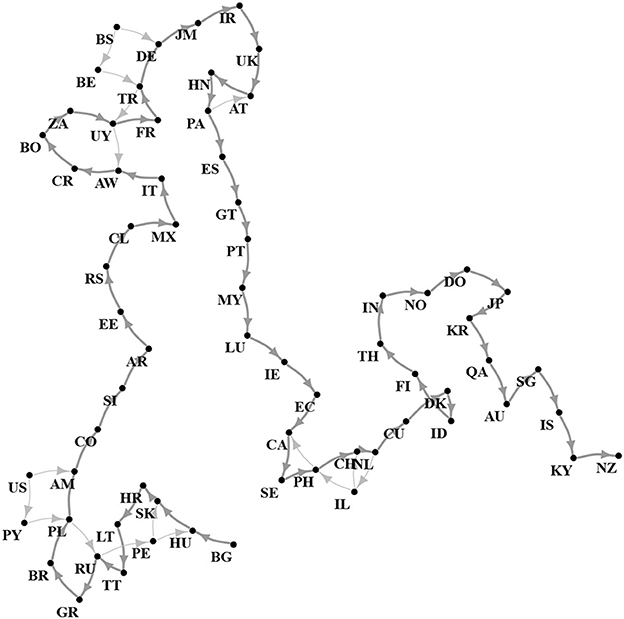
Figure 1. Reliability about COVID-19 deaths: Partial orderings among countries, starting in BG and ending in NZ.
4.2. COVID-19 cases per million
In this subsection, we consider COVID-19 cases per million. This variable differs from COVID-19 deaths per million as the latter depends on the specific protection provided to the population, whereas protection against cases is not necessarily related to the appareance of cases. While vaccines are a means to prevent deaths, contagion can still occur. When considering the reliability of COVID-19 cases, the ordering of countries appears much more complex than in the previous subsection, as shown in Figure 2. More directed cycles appear, indicating that fewer countries participate in the shortest path between the starting country, SI, and the finishing country, NZ. This last result shows that the assumption stated in Proposition 1 is satisfied too. Also, it is noted that directed cycles still occur more frequently among countries with poorer management of COVID-19.
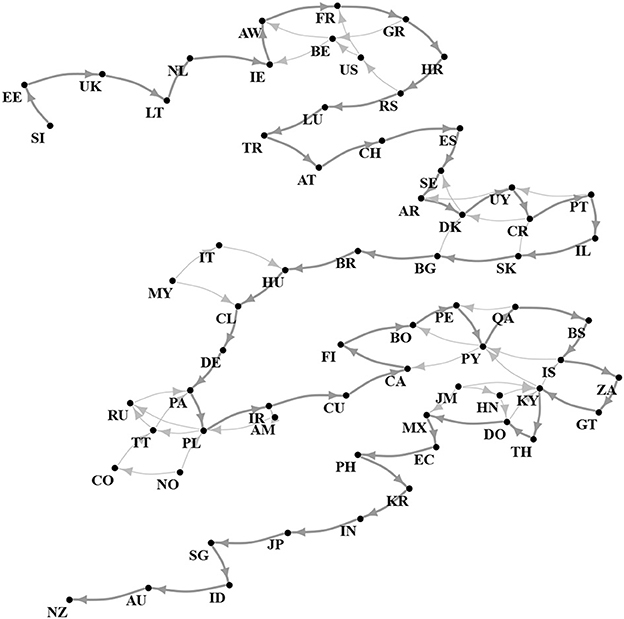
Figure 2. Reliability about COVID-19 cases: Partial orderings among countries, starting in SI and ending in NZ.
The configuration of the directed graph related to COVID-19 cases per million differs from that seen in the previous subsection. When examining the countries with the best COVID-19 management, five countries, NZ, AU, SG, JP, and KR, are among the top ten in both graphs. However, this consistency is lost when considering the ten countries with the worst COVID-19 management, as only one country, LT, is common between both graphs. This implies that most of the studied countries did not manage COVID-19 deaths and cases poorly.
5. Conclusion
In this paper, we proposed methods to order countries based on their management of COVID-19 and to cluster such countries by considering similar management behaviors. These methods consider the notion of reliability, P(X ≤ Y), by treating countries as systems exposed to failures. Our proposed methods are more general than typical methods that only assess the impacts of specific measures, as they consider not only interventions given by governments, but also any activities that people undertake to protect themselves.
The application of our proposed methods to 67 countries allowed us to identify the countries that performed better and worse in managing COVID-19 deaths and cases per million.
Notably, several countries demonstrated better management of COVID-19 for both COVID-19 deaths and cases. However, this consistency was almost lost when observing worse management of the disease. Moreover, most countries exhibiting better management of COVID-19 demonstrated complete orderings. These results are related to COVID-19 deaths and cases per million.
In practice, countries that exhibited better management of COVID-19 may recommend their protection strategies to others. We plan to deepen these results in a forthcoming paper by considering key protection measures as vaccination. Also, since the reliability measure R varies with the time interval considered, we plan to assess the management of COVID-19 in different time intervals, to understand how it evolves in each country.
These methods can also be applied to assess country's management of other diseases or sets of diseases.
Data availability statement
Publicly available datasets were analyzed in this study. This data can be found here: https://covid19.who.int/WHO-COVID-19-global-data.csv, https://www.salud.gob.ec, and https://population.un.org.
Author contributions
All authors listed have made a substantial, direct, and intellectual contribution to the work and approved it for publication.
Conflict of interest
The authors declare that the research was conducted in the absence of any commercial or financial relationships that could be construed as a potential conflict of interest.
Publisher's note
All claims expressed in this article are solely those of the authors and do not necessarily represent those of their affiliated organizations, or those of the publisher, the editors and the reviewers. Any product that may be evaluated in this article, or claim that may be made by its manufacturer, is not guaranteed or endorsed by the publisher.
References
1. Lyngdoh M. The parallels between COVID-19 and the Spanish flu of 1918. Int J Commun Med Public Health. (2020) 7:4687–9. doi: 10.18203/2394-6040.ijcmph20204776
2. Hodgson SH, Mansatta K, Mallett G, Harris V, Emary KRW, Pollard AJ. What defines an efficacious COVID-19 vaccine? A review of the challenges assessing the clinical efficacy of vaccines against SARS-CoV-2. The Lancet. (2021) 21:e26–35. doi: 10.1016/S1473-3099(20)30773-8
3. Lipworth W, Gentgall M, Kerridge I, Stewart C. Science at warp speed: medical research, publication, and translation during the COVID-19 pandemic. J Bioeth Inq. (2020) 17:555–61. doi: 10.1007/s11673-020-10013-y
4. Cameron J, Williams B, Ragonnet R, Marais B, Trauer J, Savulescu J. Ethics of selective restriction of liberty in a pandemic. J Med Ethics. (2021) 47:553–62. doi: 10.1136/medethics-2020-107104
5. Goyal N, Howlett M. “Measuring the Mix” of policy responses to COVID-19: comparative policy analysis using topic modelling. J Compar Policy Analy. (2021) 23:250–61. doi: 10.1080/13876988.2021.1880872
6. Haug N, Geyrhofer L, Londei A, Dervic E, Desvars-Larrive A, Loreto V, et al. Ranking the effectiveness of worldwide COVID-19 government interventions. Nat Human Behav. (2020) 4:1303–12. doi: 10.1038/s41562-020-01009-0
7. Marais BJ, Sorrell TC. Pathways to COVID-19 'community protection'. Int J Infect Dis. (2020) 96:496–9. doi: 10.1016/j.ijid.2020.05.058
8. Debata B, Patnaik P, Mishra A. COVID-19 pandemic! It's impact on people, economy, and environment. J Public Affairs. (2020) 20:1–5. doi: 10.1002/pa.2372
9. Onyeaka H, Anumudu CK, Al-Sharify ZT, Egele-Godswill E, Mbaegbu P. COVID-19 pandemic: A review of the global lockdown and its far-reaching effects. Sci Prog. (2021) 104:1–18. doi: 10.1177/00368504211019854
10. Oliveira ACSd, Morita LHM, Silva EBd, Zardo LAR, Fontes CJF, Granzotto DCT. Bayesian modeling of COVID-19 cases with a correction to account for under-reported cases. Infect Dis Modell. (2020) 5:699–713. doi: 10.1016/j.idm.2020.09.005
11. Ghani A, Donnelly C, Cox D, Griffin J, Fraser C, Lam T, et al. Methods for estimating the case fatality ratio for a novel, emerging infectious disease. Am J Epidemiol. (2005) 162:479–86. doi: 10.1093/aje/kwi230
12. Undurraga EA, Chowell G, Mizumoto K. COVID-19 case fatality risk by age and gender in a high testing setting in Latin America: Chile, March-August 2020. Infect Dis Poverty. (2021) 11:1–11. doi: 10.1186/s40249-020-00785-1
13. Tian H, Liu Y, Li Y, Wu CH, Chen B, Kraemer MUG, et al. An investigation of transmission control measures during the first 50 days of the COVID-19 epidemic in China. Science. (2020) 368:638–42. doi: 10.1126/science.abb6105
14. Chinazzi M, Davis JT, Ajelli M, Gioannini C, Litvinova M, Merler S, et al. The effect of travel restrictions on the spread of the 2019 novel coronavirus (COVID-19) outbreak. Science. (2020) 368:395–400. doi: 10.1126/science.aba9757
15. Arenas A, Cota W, Gómez-Garde nes J, Gómez S, Granell C, Matamalas JT, et al. Modeling the spatiotemporal epidemic spreading of COVID-19 and the impact of mobility and social distancing interventions. Phys Rev X. (2020) 10:41055. doi: 10.1103/PhysRevX.10.041055
16. Santamaria C, Sermi F, Spyratos S, Iacus SM, Annunziato A, Tarchi D, et al. Measuring the impact of COVID-19 confinement measures on human mobility using mobile positioning data. A European regional analysis. Safety Sci. (2020) 132:1–8. doi: 10.1016/j.ssci.2020.104925
17. Teslya A, Pham TM, Godijk NG, Kretzschmar ME, Bootsma MCJ, Rozhnova G. Impact of self-imposed prevention measures and short-term government-imposed social distancing on mitigating and delaying a COVID-19 epidemic: A modelling study. PLoS Med. (2020) 17:1–21. doi: 10.1101/2020.03.12.20034827
18. Singh C, Billinton R. System Reliability Modelling and Evaluation. London: Hutchinson Educational Publishers. (1977).
19. Kotz S, Lumelskii Y, Pensky M. The stress-strength model and its generalizations: theory and applications. Singapore: World scientific. (2003). doi: 10.1142/9789812564511
20. Cadena M, Denuit M. A new measure of mortality differentials based on precedence probability. Eur Actuar J. (2021) 2:717–24. doi: 10.1007/s13385-021-00280-3
21. Lehmann EL. Ordered families of distributions. Ann Mathem Statist. (1955) 26:399–419. doi: 10.1214/aoms/1177728487
22. Shaked M, Shanthikumar JG. Stochastic Orders. New York: Springer. (2007). doi: 10.1007/978-0-387-34675-5
24. Erdem O. Freedom and stock market performance during Covid-19 outbreak. Finance Res Lett. (2020) 36:1–6. doi: 10.1016/j.frl.2020.101671
25. Gelfand MJ, Jackson JC, Pan X, Nau D, Pieper D, Denison E, et al. The relationship between cultural tightness looseness and COVID-19 cases and deaths: a global analysis. Lancet Planet Health. (2021) 5:e135–44. doi: 10.1016/S2542-5196(20)30301-6
26. Wildman J. COVID-19 and income inequality in OECD countries. Eur J Health Econ. (2021) 22:455–62. doi: 10.1007/s10198-021-01266-4
27. Eyre DW, Taylor D, Purver M, Chapman D, Fowler T, Pouwels KB, et al. Effect of Covid-19 vaccination on transmission of alpha and delta variants. N Engl J Med. (2022) 386:744–56. doi: 10.1056/NEJMoa2116597
28. Hoffmann M, Kröger N, Schulz S, Cossmann A, Rocha C, Kempf A, et al. The Omicron variant is highly resistant against antibody-mediated neutralization: Implications for control of the COVID-19 pandemic. Cell. (2022) 185:447–56. doi: 10.1016/j.cell.2021.12.032
29. Mann HB, Whitney DR. On a test of whether one of two random variables is stochastically larger than the other. Ann Math Statist. (1947) 18:50–60. doi: 10.1214/aoms/1177730491
30. Arcones MA, Kvam PH, Samaniego FJ. Nonparametric estimation of a distribution subject to a stochastic precedence constraint. J Am Stat Assoc. (2002) 97:170–82. doi: 10.1198/016214502753479310
31. Shpitser I, VanderWeele T, Robins JM. On the validity of covariate adjustment for estimating causal effects. In: UAI'10: Proceedings of the Twenty-Sixth Conference on Uncertainty in Artificial Intelligence. New York, NY: ACM (2010). p. 527–536.
Keywords: COVID-19, reliability P(X ≤ Y), assessment, management, ordering
Citation: Cadena M and Méndez M (2023) Ordering countries when managing COVID-19. Front. Appl. Math. Stat. 9:1083410. doi: 10.3389/fams.2023.1083410
Received: 29 October 2022; Accepted: 14 March 2023;
Published: 30 March 2023.
Edited by:
Barbara Martinucci, University of Salerno, ItalyReviewed by:
Haitao Song, Shanxi University, ChinaHana Maria Dobrovolny, Texas Christian University, United States
Copyright © 2023 Cadena and Méndez. This is an open-access article distributed under the terms of the Creative Commons Attribution License (CC BY). The use, distribution or reproduction in other forums is permitted, provided the original author(s) and the copyright owner(s) are credited and that the original publication in this journal is cited, in accordance with accepted academic practice. No use, distribution or reproduction is permitted which does not comply with these terms.
*Correspondence: Meitner Cadena, bWVpdG5lci5jYWRlbmFAZ21haWwuY29t
†These authors have contributed equally to this work