 Hannah Faye C. Culaste1,2
 Noe Jay D. Torres1,2
 Zython Paul T. Lachica2†
 Honey Glenn P. Lorono2
 Ross Fievanni Inguillo2
 May Anne E. Mata2,3*
 Rhoda A. Namoco1,2
- 1Department of Applied Mathematics, University of Science and Technology of Southern Philippines – Cagayan de Oro, Lapasan, Cagayan de Oro City, Philippines
- 2Center for Applied Modeling, Data Analytics and Bioinformatics for Decision Support Systems in Health, University of the Philippines Mindanao, Mintal, Davao City, Philippines
- 3Department of Mathematics, Physics, and Computer Science, University of the Philippines Mindanao, Mintal, Davao City, Philippines
Introduction: In the Philippines, scheduling the COVID-19 vaccine rollout has been a challenging task. The local government units (LGUs) have to carefully work with limited resources to avoid underutilizing vaccines while considering prioritization schemes in the rollout. As the country continues to vaccinate its population to manage the spread of COVID-19, planning the prioritization of individuals becomes more apparent in the vaccination rollout with respect to the COVID-19 situation in their respective areas.
Methods: Our study develops a location-allocation model that aims to optimally schedule the COVID-19 vaccine rollout of a municipality. Here we applied the analytic hierarchy process (AHP) to determine the prioritization of communities (i.e., barangays) in the vaccine rollout based on the number of COVID-19 cases, the population density, and the proximity of the community to the available vaccine sites. Consequently, an integer programming (IP) model was formulated to determine the assignment of individuals to the vaccine stations with respect to the prioritization of their community in the rollout, as well as the minimum number of vaccine stations to open.
Results and discussion: The AHP-based IP model proposed in this study not only assigns individuals to vaccination centers, but is also capable of tailoring the vaccine rollout to prioritize individuals depending on the preferences of the LGUs, and the COVID-19 situation in their areas. Furthermore, the vaccine rollout framework in this work is applicable to other vaccine-preventable diseases (e.g., rabies, measles, etc.) should LGUs embark on adapting this approach.
1. Introduction
The Coronavirus Disease 2019 (COVID-19) has spread rapidly across the globe since its first identified case in Wuhan, Hubei Province, China [1]. The disease has affected millions of people and imposed an unprecedented burden on global healthcare systems and economies. As of June 2022, the World Health Organization [2] has confirmed over 541 million cases and 6.3 million deaths globally. The initial response to this pandemic involved strict implementation of repression strategies, such as case identification, quarantine and isolation, contact tracing, and social distancing [3]. Much research has been geared toward projecting the impact of COVID-19 to healthcare and the economy [4, 5], and how the pandemic situation would behave given the interventions that are currently available [6, 7]. Research does show that non-pharmaceutical strategies are effective in preventing the propagation of COVID-19. However, it still does not reduce the number of susceptible individuals [8, 9].
It has been proven that integrating vaccines with good adherence to non-pharmaceutical interventions lead to a significant decrease in disease outcome [10]. Over the years, vaccines have proven their efficacy in combating outbreaks including COVID-19 [11, 12]. Global production of COVID-19 vaccines reached 12 billion doses at the end of 2021 [13], Only 58 of the WHO's 194 Member States attained the 70% target as of June 2022, and just 37% of healthcare in low income countries achieved a complete course of primary vaccination [14]. With other areas having more supply than the others, inequitable access to vaccines is likely the single most important factor in the uneven recovery of COVID-19. Less than 10% of people in low-income countries have received at least one dose of vaccine [15] compared to about 80% in countries with high income [16].
The Philippines had its first vaccination against COVID-19 in March 2021 [17], and as of June 2022, ~69.52 million Filipinos were fully vaccinated against the COVID-19 virus [18]. Vaccines are delivered to the country by batches which are deployed to specific geographical areas based on the burden of COVID-19 cases. The Philippine government has established the Approved Prioritization Framework of the National COVID-19 Vaccine Deployment Plan to assure the public that all individuals are vaccinated. Moreover, in the identification of geographical areas, the National Immunization Technical Advisory Group (NITAG) set the indicators in determining the areas with a high burden of COVID-19 cases [19]. These indicators include: (1) the number of active cases and (2) the attack rate per 100,000 individuals in the recent 4 weeks. The country's Department of Health (DOH) calculates the attack rate using the total newly reported cases in the recent 4 weeks divided by the region's 2021 projected population and a multiplier of 100,000 population [19].
According to the Philippine National Deployment and Vaccination Plan for COVID-19 Vaccines, the manner of the distribution of vaccines will depend on the storage requirements specific to each vaccine [20]. The Centers for Health Development of DOH are set to deliver the vaccines to LGUs in coordination with logistics partners and other government agencies. Eligible populations for specific vaccines will be called from the main list and accessed by the appropriate personnel.
The current vaccine allocation strategy of the Philippine government may work well with the limited number of vaccines. However, in the event when the supply of COVID-19 vaccines is large to cater the targeted country's population for herd immunity (i.e., 50–70 million), there are logistical concerns and other factors that must be taken into consideration such as shortage of manpower administering the vaccines [21], underutilization of vaccines resulting in their wastage, and supply-demand gap due to an individual's vaccine brand preference. Furthermore, although both of NITAG's indicators are effective in determining the prioritization of Philippine regions in the vaccination rollout, the second indicator may not be effective for smaller communities inside municipalities whose population is <100,000. The schedule of vaccination can also affect the daily operations of the general public [22]. To incorporate the aforementioned logistical considerations, we developed a decision support system (DSS) that implements an Analytical Hierarchy Process (AHP)-based Integer Programming model decision tool in the context of the COVID-19 vaccine rollout of a municipality.
In this paper, we view the vaccine rollout situation as a location-allocation problem [23] where we determine the optimal assignment of target individuals of communities to these vaccine stations in order to meet their demands [24]. Since the problem has multiple objectives, we consider an integer programming approach for solving location-allocation models [25, 26].
It can be said that Integer Programming is a well-known approach for solving location-allocation problems [25, 27]. However, in the context of allocating COVID-19 vaccine vials to vaccination centers, we are faced with a problem where limited resources (vaccines) have to be distributed to multiple locations, and then to communities, each having a priority level in the vaccination rollout. While IP can accommodate limited resources to reach an optimum solution, in making decisions for the prioritization of individuals to be vaccinated and for specifying the ranks of the considered communities in terms of resource allocation, we employed the AHP decision tool [28], a widely-used multi-criteria decision model used to derive prioritization weights for alternatives in a hierarchy of criteria. The AHP reduces complex decisions to a series of pairwise comparisons, and by doing so, both subjective and objective aspects of a decision are captured. In addition, it incorporates a useful technique for checking the consistency of the decision maker's evaluations, thus reducing the bias in the decision-making process. This approach is suitable because it allows decision makers to model in a hierarchical manner the relationships among the decision makers with complex problems, the ultimate goal of the problem, criteria, subcriteria and the alternatives [29]. With this fact, it can be seen that the AHP can be easily implemented with other optimization methods, such as the mixed integer programming, to make optimal decisions.
We took a step further in this study by developing a decision support system (DSS) [30], with a user-friendly interface where the end-user, that is, the LGUs, may collect insights on the allocation of their residents to the vaccination centers in their area.
2. Materials and methods
2.1. Prioritizing communities using analytic hierarchy process (AHP)
To determine the prioritization among communities in the vaccination rollout, we first determine the selection criteria for prioritizing the communities since the LGUs of municipalities cannot vaccinate the entire population simultaneously due to limited resources and other constraints. We define communities as the smallest governing agencies for government function, and constitute the base of citizen participation. In the Philippines, we call these communities barangays [31].
The criteria considered in the prioritization of communities for vaccination rollout are labeled as Cases, Density and Distance. As the pandemic spreads, communities which are most vulnerable to the virus must be prioritized [32]. The Cases criterion refers to the number of COVID-19 positive cases in the community. The second criteria, Density, refers to the population density of the community, or the number of residents residing in the community. Lastly, Distance is considered in the aim of providing convenience to the individuals who are to be vaccinated [33, 34].
An AHP hierarchy structure for the decision problem is then developed. The overall goal is to determine which community is to be prioritized, with the three criterias in the second level of the hierarchy and the set of alternatives, the communities, in the lowest level of the hierarchy, as presented in Figure 1. With the determined criteria and alternatives, we performed pairwise comparisons between criteria and direct comparisons between each alternative with respect to each criterion.
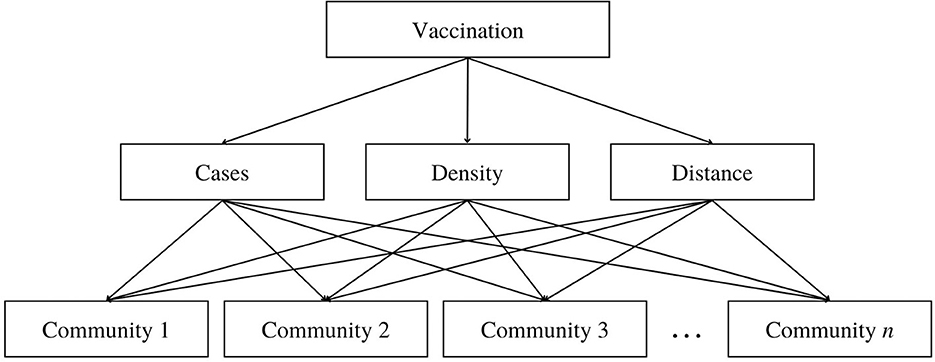
Figure 1. Hierarchy structure of the AHP model in determining the prioritization of communities in the vaccination roll-out where the top level is the goal, the second level represents the criteria, and the bottom level are the alternatives.
2.1.1. Pairwise comparison matrix between criteria
Using Saaty's fundamental scale of absolute numbers in Table 1, the decision maker is to score the pairwise comparison by expressing his preference between each pair of criteria. This fundamental scale enables the decision-maker to incorporate experience and knowledge intuitively and indicate how many times a criterion dominates another with respect to the criterion's importance to the consideration of communities for prioritization in the vaccination rollout such that for the pairwise comparison matrix of criteria, A = [aij], aij is defined by the pairwise comparison score of criterion i when compared criterion j.
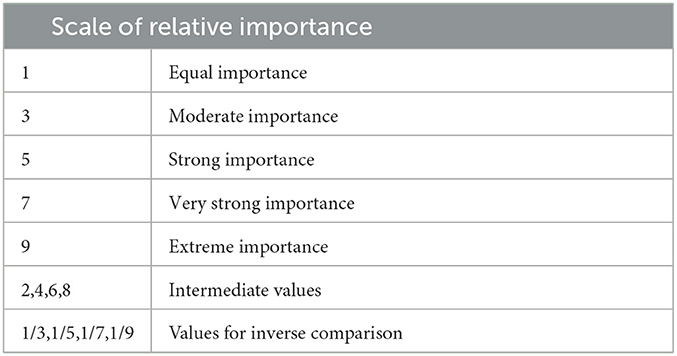
Table 1. The scale of relative importance in giving judgments for pairwise comparisons in AHP.
The numerical values 9, 7, 5, 3, 1 are translated into descriptive preferences respectively, with 2, 4, 6, and 8 as intermediate values for comparisons between two successive judgements. Reciprocals of these values are used for the corresponding transposed judgements [35]. After the normalization of the pairwise comparison matrix, the averages of the columns are taken to produce the preference vector.
That is, if A = [aij] is the pairwise comparison matrix between criteria,
is the normalized form. Then, the preference vector where m is the dimension of the matrix A. The vector, V, contains eigenvalues that correspond to the ranking (weights) of the criteria in terms of contribution to the decision of which community to vaccinate.
2.1.2. Direct comparison between alternatives per vaccination site
In AHP, the alternatives, i.e., communities, are compared with each other with respect to each criteria in order to determine the ranking of each community in terms of population density (Density), number of active COVID-19 cases (Cases) and the distance of the community to vaccination site k (Distance). The elements of the direct data matrix for the communities with respect to the alternatives, say Bij = [BiDensity, BiCases, BiDistance(k)], where i is the community and j is the criteria, is defined as follows:
Notice that biDistance(k) holds values that are reciprocal of the actual data. It should be noted that as the distance of community i to vaccination site k increases, the less likely community i is prioritized in the vaccine rollout of vaccination site k. Taking the reciprocal of the actual distance data is done to account for the indirectly proportional relationship of the “Distance” criteria to the prioritization of communities in the vaccine rollout.
2.1.3. The prioritization matrix of communities for vaccination
The prioritization matrix, , also called the prioritization vector, is a single column matrix whose elements correspond to the prioritization score of community i in the vaccination rollout of vaccination site k. That is, for a preference vector, V, and the normalized direct data matrix, ,
2.1.4. Consistency ratio
We take into consideration that comparisons made by the decision-maker may not be consistent. In order to verify the consistency of the pairwise comparison matrix, we utilize Saaty's [30] proposed consistency index (CI) and consistency ratio (CR) defined as follows:
where,
RI = the average consistency index for numerous random entries of same order reciprocal matrices,
λmax = principal eigenvalue of the pairwise comparison matrix,
m = order of the pairwise comparison matrix.
The value of λmax is obtained by first multiplying the pairwise comparison matrix, Aij, with the preference vector for the pairwise comparison matrix between criteria, V. By performing element-wise division between the resulting matrix and the preference vector, a single column vector is obtained and the average of the elements gives the value of λmax. For the inconsistency to be acceptable, the CR must be ≤ 10%. If the CR is >10%, revision of the pairwise comparison matrix is advised.
2.2. Integer programming model
With the purpose of maximizing the individuals to be vaccinated with respect to their prioritization, an integer programming model is formulated. We now define the following decision variables and parameters in the model as follows:
wij = AHP-derived prioritization weights of community i at vaccine station j,
xij = number of individuals to be vaccinated in community i at vaccine station j in day d of the vaccination period,
Cj = capacity of vaccine station j in a day,
V = total number of available vaccines of the vaccination period,
d = total number of days of the vaccination period,
Ti = total target number of individuals to be vaccinated in the vaccination period.
To formulate the vaccination rollout as an IP problem, we consider the objective function Z as the weighted sum of individuals to be vaccinated. Note that the AHP-derived weights wij ϵ [0, 1] describe the prioritization of community i in vaccination site j. The higher the value of wij, the more prioritized community i is in the vaccination rollout of vaccination site j. Thus, our objective function, Z, aims to maximize the allocation of people for vaccination according to priorities.
With the above model assumptions, we write below the IP model that maximizes the prioritization of individuals to be vaccinated given the set constraints.
subject to:
To control the number of individuals to be vaccinated from community i, the target individuals constraint (Equation 2.2) is constructed. As each community has a target number of individuals to be vaccinated (Ti), this constraint directs the model to assign individuals from community i in a manner where the total assigned individuals does not exceed Ti.
Every identified vaccination site has a declared daily capacity (Cj). This capacity describes how many individuals vaccination site j can accommodate in a day. The vaccine station capacity constraint (2.3) limits the total number of xijs assigned to vaccination site j at any given day so that it does not exceed the capacity of vaccination site j. Thus, the model can guarantee that the vaccine stations can accommodate all the individuals assigned.
On the other hand, the vaccine supply constraints against total number of individuals for vaccination (2.4) checks if the number of people to be vaccinated to be lesser than the vaccine supply. Additionally, this model addresses the underutilization of the vaccine supply leading to the wastage of vaccines. To ensure that the vaccine supply is exhausted by the end of the vaccination rollout, constraint (2.5) is formulated. The right hand side of this constraint is the total of the capacities of the vaccination sites throughout the number of days the rollout is scheduled. By constraint (2.2), this means that constraint (2.5) demands the vaccine supply for the entire vaccination rollout to not exceed the maximum number of individuals the vaccination rollout can accommodate.
In the context of vaccine distribution, it is only logical to impose into the model that the values assumed by the xijs be integers. As xij represents the number of people to be vaccinated, it is neither possible to vaccinate a negative number of people nor a fraction of a person.
Ultimately, the AHP-IP model is implemented in a website-based decision support system (DSS) designed to aid the LGUs in their allocation of COVID-19 vaccines in their respective areas of jurisdiction.
2.3. Model validation
To verify the accuracy of the AHP-IP model developed in this study, AHP calculations were also made in SuperDecisions while the IP model was implemented using Excel Solver. We conclude that the DSS is accurate when the results of the DSS and the tools used for model validation formulation are identical.
2.3.1. Validation of the AHP results
To validate the preference vector, V, the CR of the pairwise comparison matrix between criteria, and the prioritization matrix, , we make use of SuperDecisions (v3.2), a software developed by Adams and Saaty [36] which implements the AHP methodology for decision making. SuperDecisions enables users to establish clusters to represent a hierarchy level, and then in-cluster nodes, which are representatives of the items within the hierarchy level. The process of obtaining the V and the CR of the pairwise comparison matrix between criteria in SuperDecisions is as follows:
Step 1. In the Network tab, create “Goal,” “Criteria,” and “Alternatives” clusters. These clusters represent levels of the hierarchy.
Step 2. Inside each cluster, we add nodes. Nodes are representatives of the elements inside each level of hierarchy. For example, in the Goal cluster, add a node and name it “goal.” Nodes that correspond to the AHP criteria Density, Cases and Distance should also be created in the “Criteria” cluster. The “Alternatives” cluster should hold nodes that correspond to the communities considered in the vaccination rollout.
Step 3. We specify interactions between nodes by building connections. Thus, we connect every criteria to the goal, and then every alternative to each criterion. Connections inform SuperDecisions that Density, Cases, and Distance are the factors being ranked in terms of their contribution to the goal, and that the alternatives are the elements being ranked per criterion.
Step 4. In the Judgments tab, score the pairwise comparison matrix between criteria using the scores set by the decision-maker. Completing this step allows SuperDecisions to generate the preference vector, V, and the CR of the pairwise comparison matrix between criteria.
Step 5. To conduct direct comparisons, choose “Direct” on the judgment modes of the Judgment tab. Populate the tables for each criteria using the values of Bij.
Step 6. From the “Show Priorities” option in the Information Panel, the prioritization matrix, , is found.
It is important to note that while SuperDecisions is a powerful tool for the AHP, the software rounds off digits to five decimal places. Thus, the values obtained in SuperDecisions may slightly deviate from the values calculated by the DSS.
2.3.2. Validation of the IP model results
For the validation of the IP model, we utilize Solver, an analysis utility tool built in Microsoft Excel [37]. The data and formulas that comprise the parameters of the model are assembled in Excel Spreadsheets, while the objective function as well as the constraints that bound the model are set up using the Solver Parameters dialog box.
2.4. Decision support system
Decision Support Systems (DSSs) are designed to improve decision making effectiveness, especially on aiding complex tasks that require a high level of decision making [38]. In this study, a DSS was developed with the aim of providing LGUs a readily available tool for scheduling the vaccine rollout of their municipality. This Vaccination DSS is an online web application that implements this study's proposed AHP-IP model, and is designed to be user-friendly. This section introduces the general system architecture and flow chart of the Vaccination DSS.
2.4.1. General system architecture of the vaccination DSS
The General System Architecture of the Vaccination DSS involves three main components, i.e., LGU users, the Vaccination Rollout DSS, and Amazon Web Services (AWS) Data Lake, as shown in Figure 2.
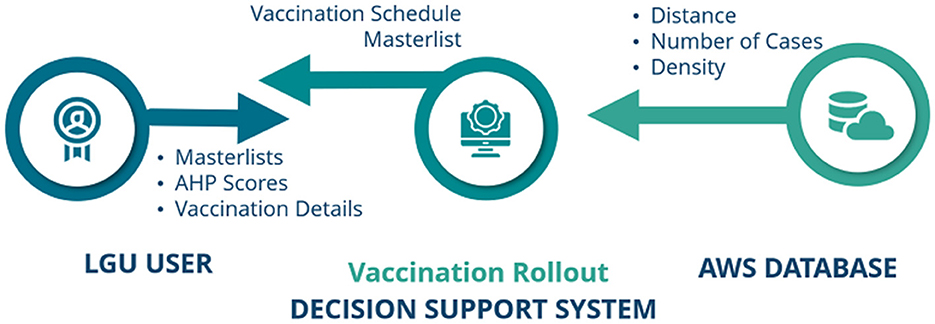
Figure 2. General system architecture of the decision support system.
The LGU user is in charge of the necessary inputs required by the Vaccination DSS in order to create a vaccine rollout schedule. These inputs are: vaccination rollout details, AHP pairwise comparison scores, and the individuals and vaccination site masterlists (see Supplementary Data Sheets 1, 2 for an example of the masterlists). When input requirements are successfully complied to, the Vaccination DSS processes the data and implements the AHP-IP model for optimization, and later on, submits a Portable Document Format (pdf) containing the generated vaccine rollout schedule.
In itself, the Vaccination DSS is composed of two parts: the Front-End/Graphical User Interface and the Back-end. The Front-End was developed using CodeIgniter Framework. Codeigniter is a PHP framework used to create a full-featured web application [39]. In order for the AHP-IP model to be integrated in the DSS, we created the Back-end of the DSS using Python, and utilized its PuLP library. PuLP is a Linear Programming modeler written in Python to solve linear problems [40].
Lastly, AWS Data Lake, a centralized repository created by Amazon, serves as the database repository and the virtual machine where the proposed system is hosted. Information pertaining to the communities' distance to all the identified vaccine stations, their number of active COVID-19 cases, and their population density are stored in our database.
2.4.2. Web application DSS flowchart
Based on the General System Architecture in Figure 2, the step-by-step flowchart of the system is divided into two parts: the Front-End flowchart and the Back-end flowchart as shown in Figures 3, 4 respectively.
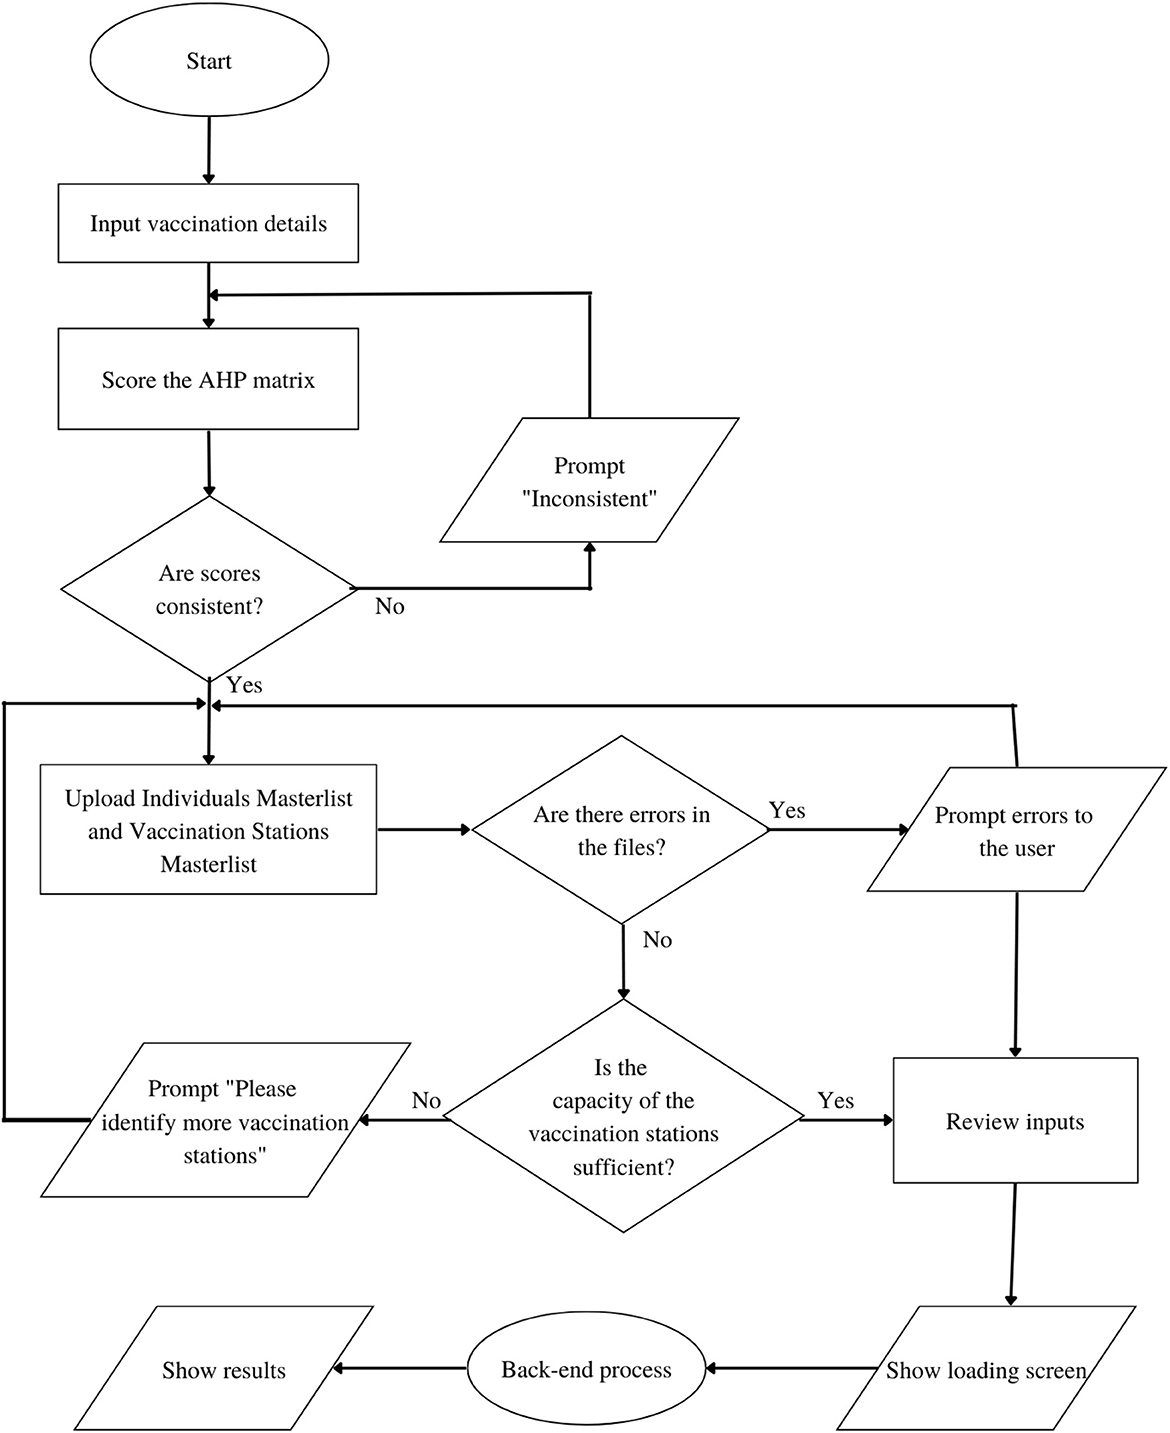
Figure 3. The front-end flow chart of the web application DSS.
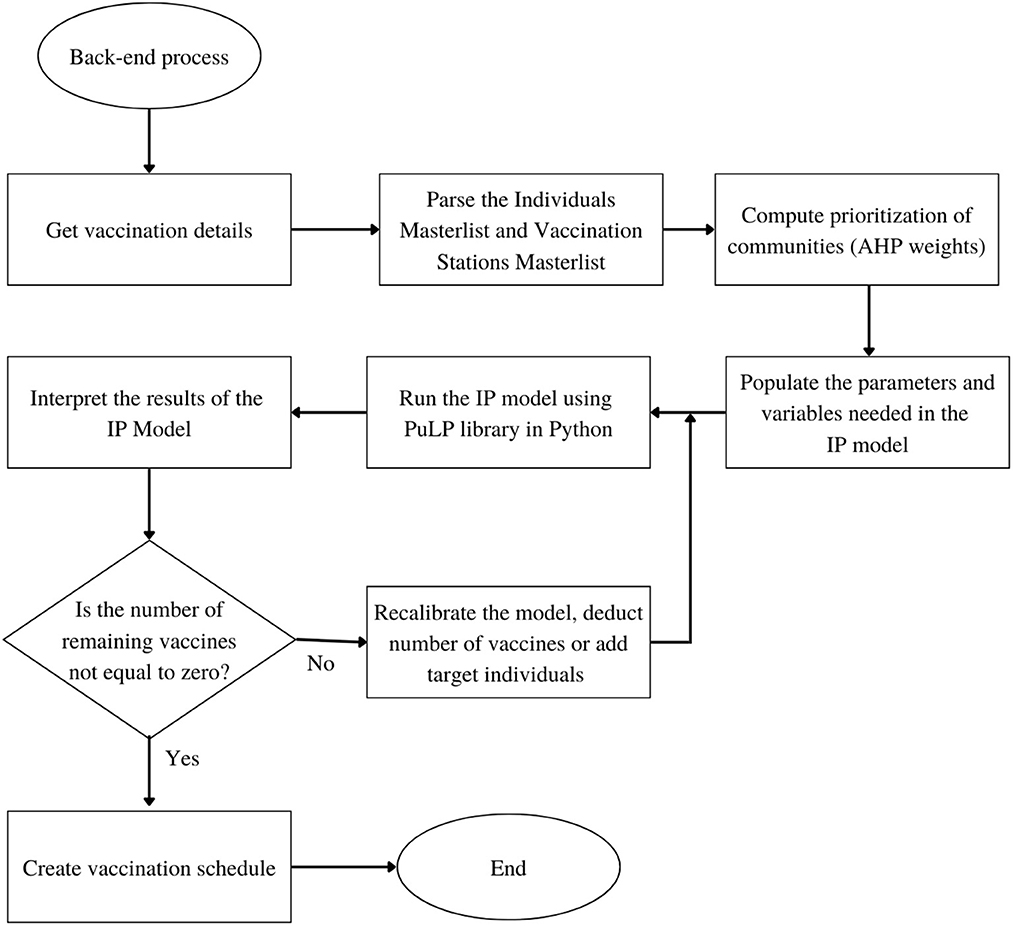
Figure 4. The back-end flow chart of the web application DSS.
The Web Application DSS starts from the input of the user in the first form page, where preliminary details including the vaccine brand, vaccination rollout start date, total number of vaccine vials available, number of doses per vial, and target number of days are required. The user will then score the AHP matrix of criterias to determine the prioritization of each community in the vaccination stations. While the user may score the AHP pairwise comparison matrix manually, we present four scenarios in the prioritization of communities as presets to aid in the judgments and for the convenience of the LGUs. The LGUs may choose to implement any of these presets depending on their preferences, and the COVID-19 situation in their areas. From these decisions, the values for wij of the IP model are derived.
Table 2 shows the preset pairwise scores of the 4 scenarios under consideration. Particularly, in the event that the LGU considers all criteria to be equally important, the LGU may choose Preset 1. Under the “All Equal” column of Table 2, all pairwise comparisons are scored one (1) as no criterion is favored over another. The second scenario considers the Cases criterion to have very strong importance, whose pairwise comparison score can be viewed under Preset 2. As it is highly favored over all the other criterias, a score of seven (7) is given to Cases and 1/7 for its inverse value. The third and fourth scenarios consider Density (Preset 3) and Distance (preset 4) to have strong importance respectively and follow the same scoring process as the second scenario.
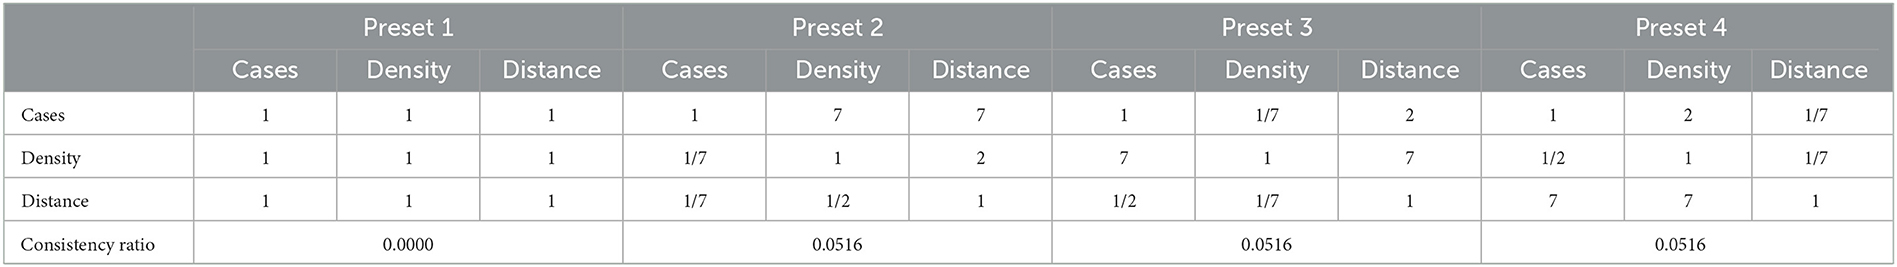
Table 2. Pairwise comparison matrices of the presets.
It is also worth noting that the option to proceed to the next page is only available when the Consistency Ratio (CR) is <10%. If, for instance, the decision-maker's manual scores are inconsistent, a text instructing the user to review the score is displayed. After successfully scoring the AHP matrix, the user will be asked to upload the Target Individuals Masterlist and Vaccine Stations Masterlist. The Target Individuals Masterlist contains all the names of the individuals to be vaccinated, including some of their personal information. The Vaccine Stations Masterlist, on the other hand, contains all the available vaccine stations in the vaccination rollout including their capacity per day and location coordinates. These masterlists are processed for file checking in a python script to check for errors in the data specially, on missing columns, format errors and blank cells. In the event that the algorithm detects errors in the masterlists, these errors are displayed and the option to proceed is disabled until such errors are addressed. Once clear of errors, the system examines the combined capacities of the vaccination sites to determine if it is sufficient to cover the vaccination of the target individuals within the expected timeframe. If it is insufficient, the system prompts the user to identify more vaccine stations. On the other hand, if the combined capacities of these vaccination sites is sufficient, the user is forwarded to a summary page where he is required to verify the accuracy of his inputs. Completing these steps redirects the user to a loading screen while the Vaccination DSS Back-end process generates the result.
In the Back-end, the Python Script of the system obtains the vaccination details via the HTTP POST request form sent by the Front-End and parses the Target Individuals Masterlist and Vaccine Sites Masterlist and stores the data in the pandas data type variable. The python package, pandas, is used in reading CSV files for real-world data analysis [41]. After storing the data from the masterlists, the prioritization of communities from the Target Individuals Masterlist is calculated based on the AHP weights provided by the user scores. Consequently, parameters and variables needed in the IP model are populated, based on the preliminary details provided by the user. When all the necessary parameters and variables are complete, the IP model is then run using the PuLP library in Python. The PuLP library generates results, and the system interprets these to determine if the remaining number of vaccines is equal to zero. Otherwise, the system will recalibrate the model and deduct the allotted vaccines from the recent result. After the deduction and recalibration, the system will then run another optimization process to produce the next day's result. When the number of vaccines reaches zero, the system will proceed to create the whole schedule masterlist based on the results given by the PuLP library.
2.5. Sensitivity analysis
Given that vaccine rollouts involve limited resources, it may be beneficial to understand how the model behaves and how the outcomes would vary if these limited resources were increased or decreased. We therefore inspect the sensitivity of the distribution of xij per community, and then per vaccination site to the percent changes in the number of target individuals, capacity of vaccination sites and total number of vaccine doses available. It should be noted that the upper and lower bounds of these percent changes are determined by the constraints of the model.
3. Results and discussions
To demonstrate the use of the DSS, we considered a sample small Municipality Z whose decision-maker aims to vaccinate 3,825 individuals from 10 of its communities. Municipality Z has four functioning vaccination stations which are labeled as VS A, VS B, VS C, and VS D. The population density of each community, its number of active laboratory-tested COVID-19 positive cases, and its distance from the four vaccine stations are uploaded to the database of the DSS and are presented in Table 3.
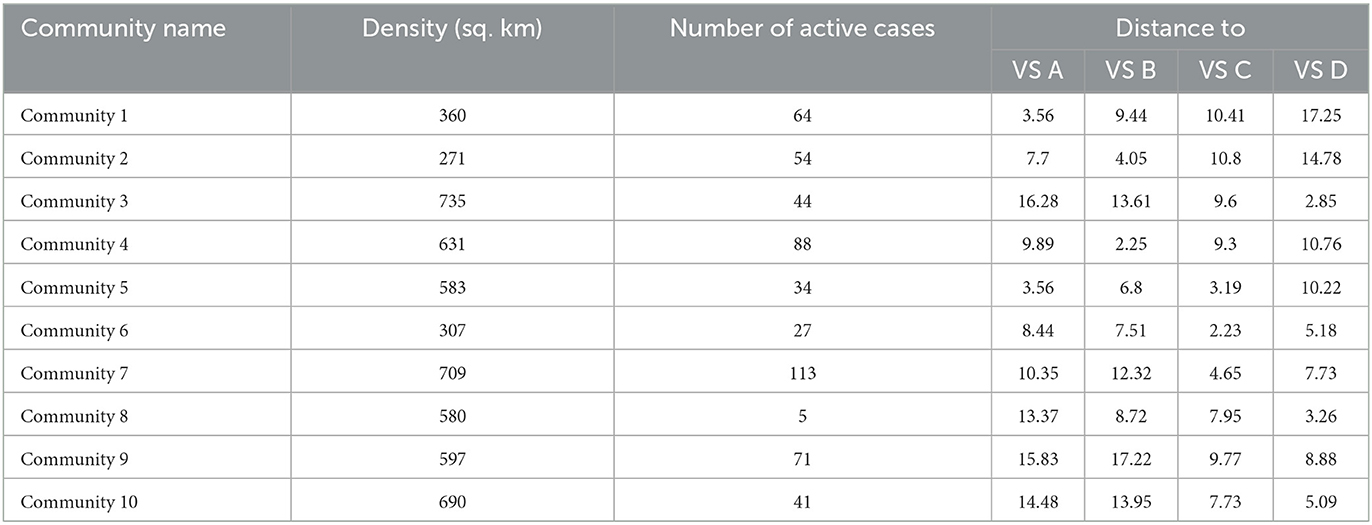
Table 3. Profile of communities in municipality Z with respect to the vaccination sites.
The DSS is hosted on a five-page website, the first four of which, as stated in Section 2.4 and as seen on Figure 5, are form pages that require decision-makers to input information and submit data in the form of Excel Spreadsheets. The last page, on the other hand, presents the generated optimum vaccine rollout schedule. On the second page, the decision-maker must then perform pairwise comparisons for the prioritization of communities using Saaty's fundamental scale of absolute numbers. In this example, the decision-maker considers Preset 4 (see Table 2) where Distance is deemed to have very strong importance. Note further that Preset 4, along with the remaining presets, has a consistency ratio below 10%, as indicated in Table 2.
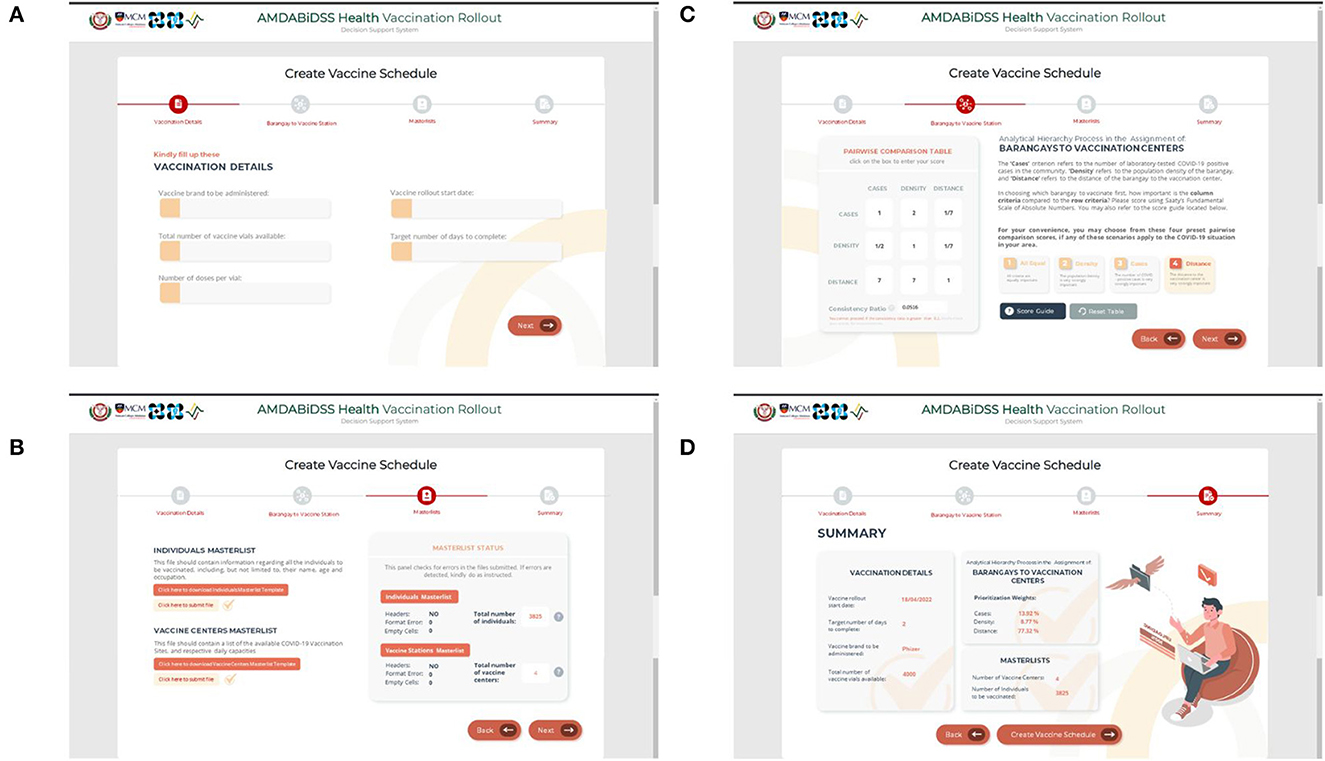
Figure 5. Screenshots of the form pages of the vaccination decision support system. (A) First page, (B) Second page, (C) Third page, and (D) Fourth page.
As for the Target Individuals Masterlist and the Vaccine Stations Masterlist required in the third page, the decision-maker may download the template files directly from the page and then upload them once all of the necessary information is entered. The Target Individuals Masterlist and the Vaccine Stations Masterlist of Municipality Z are shown in Supplementary Data Sheets 1, 2. Furthermore, the right side of the Masterlist Page displays a panel that features the error-checking functionality, and confirms that the information inputted by the decision-maker is consistent.
With all the parameters needed for the AHP-IP model to run set, the decision-maker is forwarded to the summary page where all the information submitted in the previous pages is compiled. The decision-maker may then select the “Create Vaccination Schedule” button at the bottom part of the page. This action prompts the DSS to generate the vaccine rollout schedule.
With reference to Figure 6, the Vaccine Rollout Schedule document generated by the DSS for Municipality Z has successfully assigned all individuals of the communities to the vaccination stations in a 2-day timeline, without violating any of the constraints set in the AHP-IP model. In both Day 1 and Day 2 of the vaccine rollout, the number of individuals assigned for vaccination in all vaccine stations did not exceed capacity and the target of each community in terms of vaccinated individuals has also been satisfied. Additionally, the number of individuals assigned for vaccination did not exceed the municipality's number of available vaccine doses.
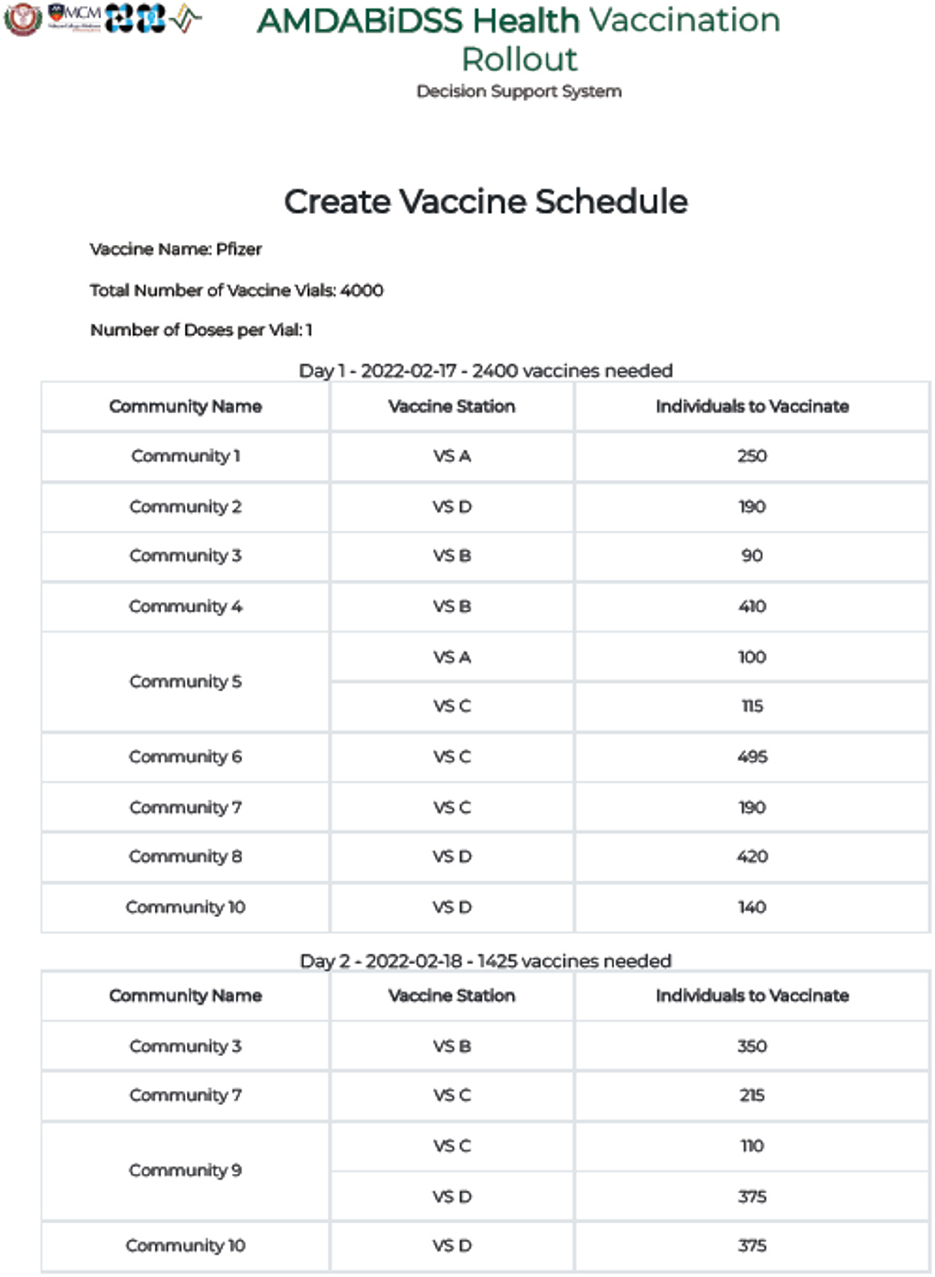
Figure 6. Screenshot of the vaccine rollout schedule generated by the vaccination decision support system for municipality Z.
Notice, however, that Communities 3, 7, 9, and 10 still have individuals scheduled for vaccination on the 2nd day. This can be explained by taking a closer look at Table 4.
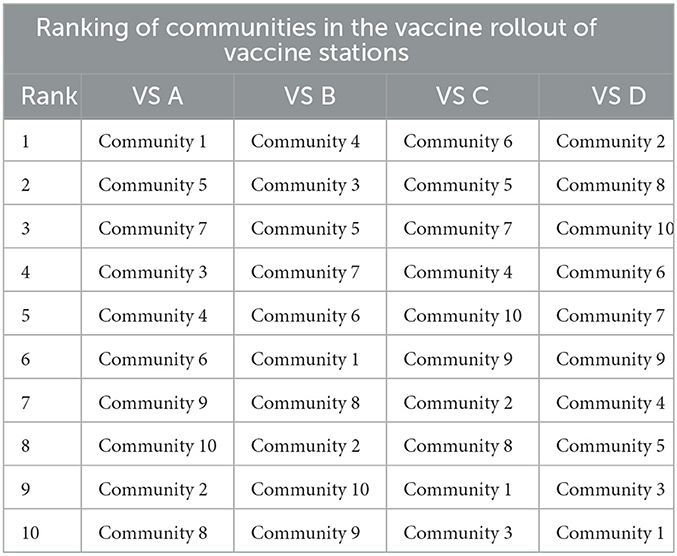
Table 4. Ranking communities based on their AHP-derived prioritization scores in the vaccination rollout of vaccine stations as derived from the back-end computations of the vaccination DSS.
As the DSS is running on the premise of AHP pairwise comparison Preset 4 where distance is considered to have very strong importance in choosing which community to prioritize in the vaccine rollout, this outcome is expected since Communities 3, 7, and 9 are all significantly farther from any of the vaccination sites compared to the other communities, and thus ranks low in the prioritization for vaccination. On the other hand, while Community 10 is considerably ranked higher in VS D, Communities 2 and 8 have already exhausted the vaccination site's capacity for the first day. It is for the same reason that the residents of Community 1 are assigned to be vaccinated at VS A. Table 3 shows that among the 10 communities, Community 1 is the closest community to VS A along with Community 5. It is not surprising that VS A is assigned to vaccinate the entire population of Community 1 and only some of the residents of Community 5 since (1) VS A has a limited capacity of 350 individuals per day, and (2) VS A is the closest vaccination site to Community 1 compared to the remaining 3 vaccination sites.
In contrast, while Community 7 is located close to VS C, only a small percentage of its residents are assigned to be vaccinated on the first day. This is the case because VS C only has a daily capacity of 800, and the 495 target individuals of Community 6 and the remaining 115 individuals of Community 5 were given higher priority than the target individuals of Community 7. As a result, the remaining residents of Community 7 who were not vaccinated on the first day are scheduled on the second day instead.
The Vaccination DSS was able to limit the number of people assigned at vaccine sites so that it does not exceed capacity by forwarding target individuals of less prioritized communities to the second day of vaccination. These results tell us that the Vaccination DSS proposed in this study was able to optimally schedule the vaccine rollout of a municipality by assigning individuals to vaccination sites without violating constraints, while also taking into account prioritization of communities as determined by the LGU.
It is also interesting to look into the results of the model when there are alterations to the initial values of some parameters. This is in view of the fact that in reality, a municipality may have multiple vaccination rollouts over the course of a pandemic. The LGU may opt to start and end a vaccination campaign depending on the extent of the COVID-19 pandemic in their area, the availability of the facility that will serve as their vaccination site, and the number of vaccines allocated by national authority to their municipality, Most of the time, the number of target individuals, the capacities of vaccination sites, and the number of available vaccine doses varies per vaccination rollout. Thus, the behavior of the model in response to changes to one of these parameters is covered in the following subsections.
3.1. Effects of changes in amount of target individuals
We first inspect the sensitivity of the distribution of xij per community, and then per vaccination site to the percent changes in the number of target individuals. In summary, when the total number of target individuals is greater than the combined capacities of the vaccination sites, the model focuses on vaccinating communities with higher priorities. For example, after Ti = −40% change in Figure 7A, the number of individuals scheduled for the first day of vaccination from community 9 decreases. This is because the total capacity of the vaccination sites is not enough to accommodate all the target individuals on the first day. This forces the model to impose prioritization, and determine which communities to vaccinate first according to the prioritization scores set by the AHP.
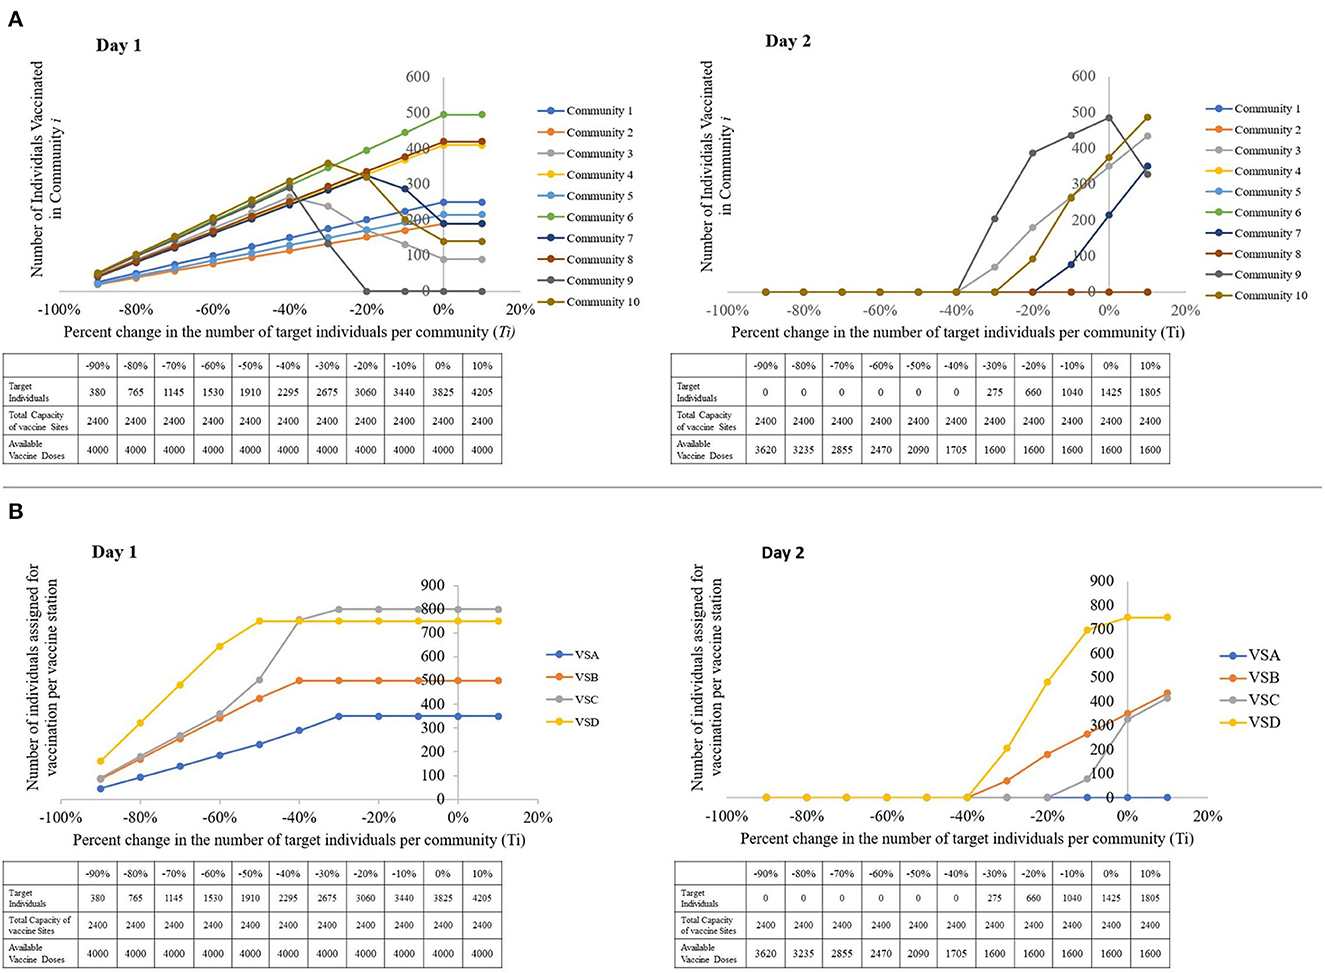
Figure 7. Visual representations of the sensitivity of the model to changes in the number of target individuals, with a table showing the parameters used per run. (A) The number of individuals vaccinated per community, per percent change in the number of target individuals. (B) The number of individuals assigned for vaccination per vaccine station, per percent change in the number of target individuals (left to right: Day 1, Day 2).
However, Day 1 results show that the number of individuals vaccinated in community i is directly proportional to Ti when target individuals are lesser than or equal to the capacity. This is expected since when all the target individuals can be catered to within a single day, the model does not have to enforce prioritization on the residents of the communities.
From Figure 7B, we notice that when the closest vaccination sites' capacities are exhausted, the model forwards the remaining target individuals to the closest available vaccination site. This explains the sudden increase in the number of assigned individuals for vaccination in VS C. When the capacities of VS D and VS B are completely occupied, some of the individuals that VS D and VS B can no longer cater to are forwarded to VS C.
3.2. Effects of changes in vaccination site capacity
In reality, vaccine station capacities may vary on a day-to-day basis depending on the availability of human resource and storage equipment, among others. It may be beneficial for decision-makers to understand how the target individuals are distributed when the capacity of the vaccination sites increase and decrease. When vaccination sites have low capacities, Figure 8A suggests that individuals of communities with low prioritization scores may not be vaccinated on the first day of the rollout, as indicated by the trend in the number of individuals for vaccination from communities 3, 7, 9, and 10.
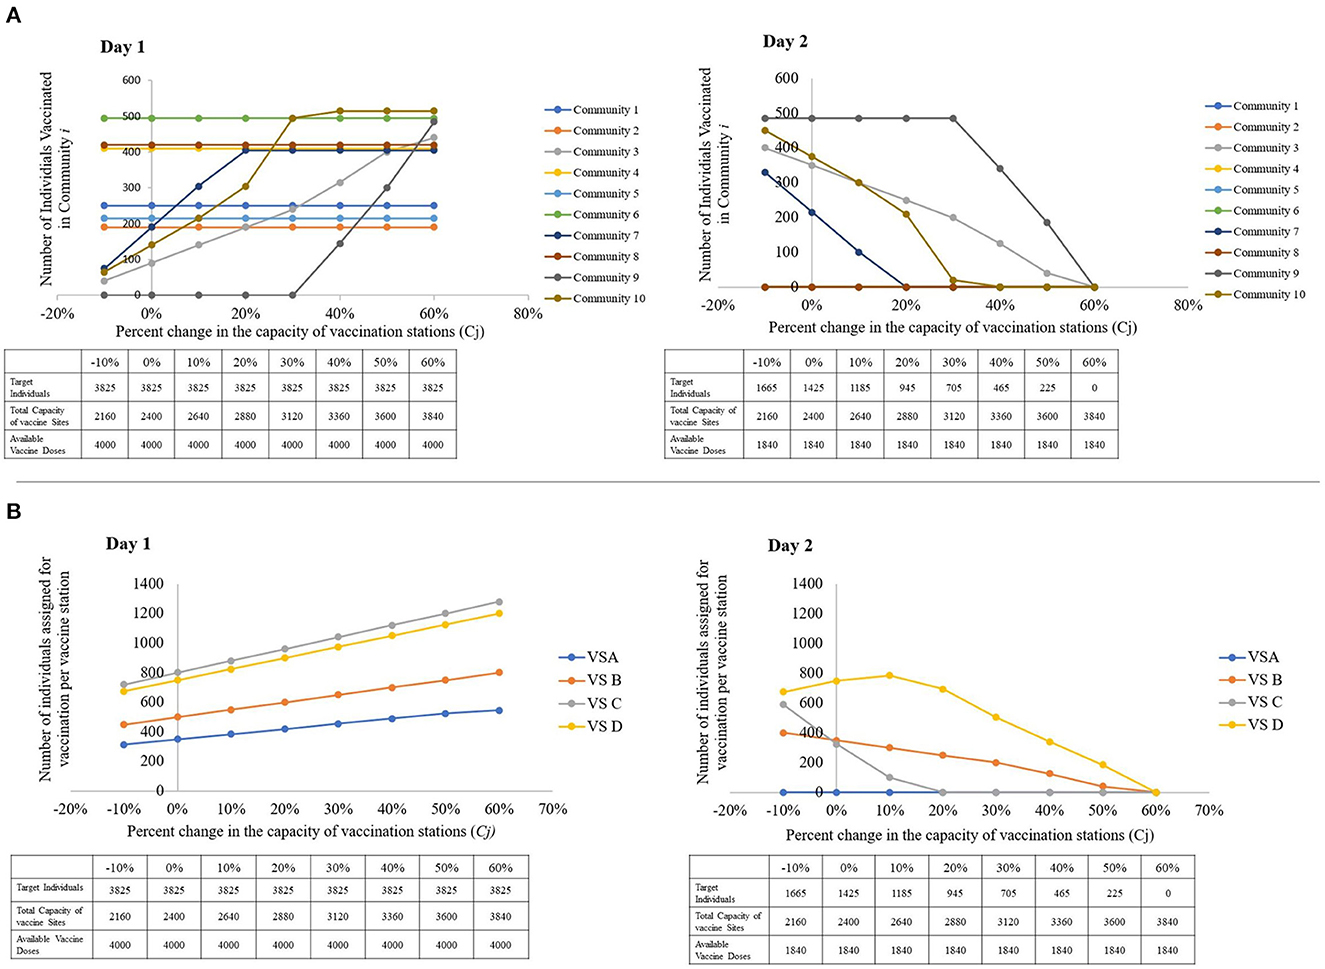
Figure 8. Visual representations of the sensitivity of the model to changes in the capacity of vaccine stations, with a table showing the parameters used per run. (A) The number of individuals vaccinated per community, per percent change in the capacities of vaccine stations. (B) The number of individuals assigned for vaccination per vaccine station, per percent change the capacities of vaccine stations (left to right: Day 1, Day 2).
In addition, decision-makers may also wish to accelerate the vaccination of persons from these low-priority communities at times. In Figure 8A, we notice that when a non-highly prioritized community's closest vaccination sites' capacities are exhausted, the model forwards its target individuals to the closest available vaccination site. This explains the sudden increase in the number of assigned individuals for vaccination in VS C. When the capacities of VS D and VS B are completely occupied, Figure 8B suggests that some of the individuals that VS D and VS B can no longer cater to are forwarded to VS C.
This shows that while the vaccination of individuals from highly-prioritized communities are not sensitive to changes in the capacities of the of the vaccination sites, the communities with lower priorities are only vaccinated on the first day of the rollout when highly prioritized communities are already catered to. For the vaccine rollout to reach low priority communities fast, we suggest that they either identify more vaccination sites that are close to these communities, or increase the capacity of the existing sites by increasing human resources and seating capacities.
3.3. Effects of changes in amount of vaccine doses available
When the total number of available vaccine doses surpasses the combined capacity of the vaccination sites, it is noteworthy that both the number of individuals vaccinated from each community and at the vaccination sites reaches a plateau, as demonstrated in Figures 9A, B, respectively. This means that if the decision-maker wishes to expedite vaccination of the target individuals in this rollout, increasing the vaccine supply is not enough to speed up the distribution. The LGU must also increase the total capacity of vaccine stations, either by increasing the capacity of already existing vaccine stations or by constructing or identifying additional vaccine stations.
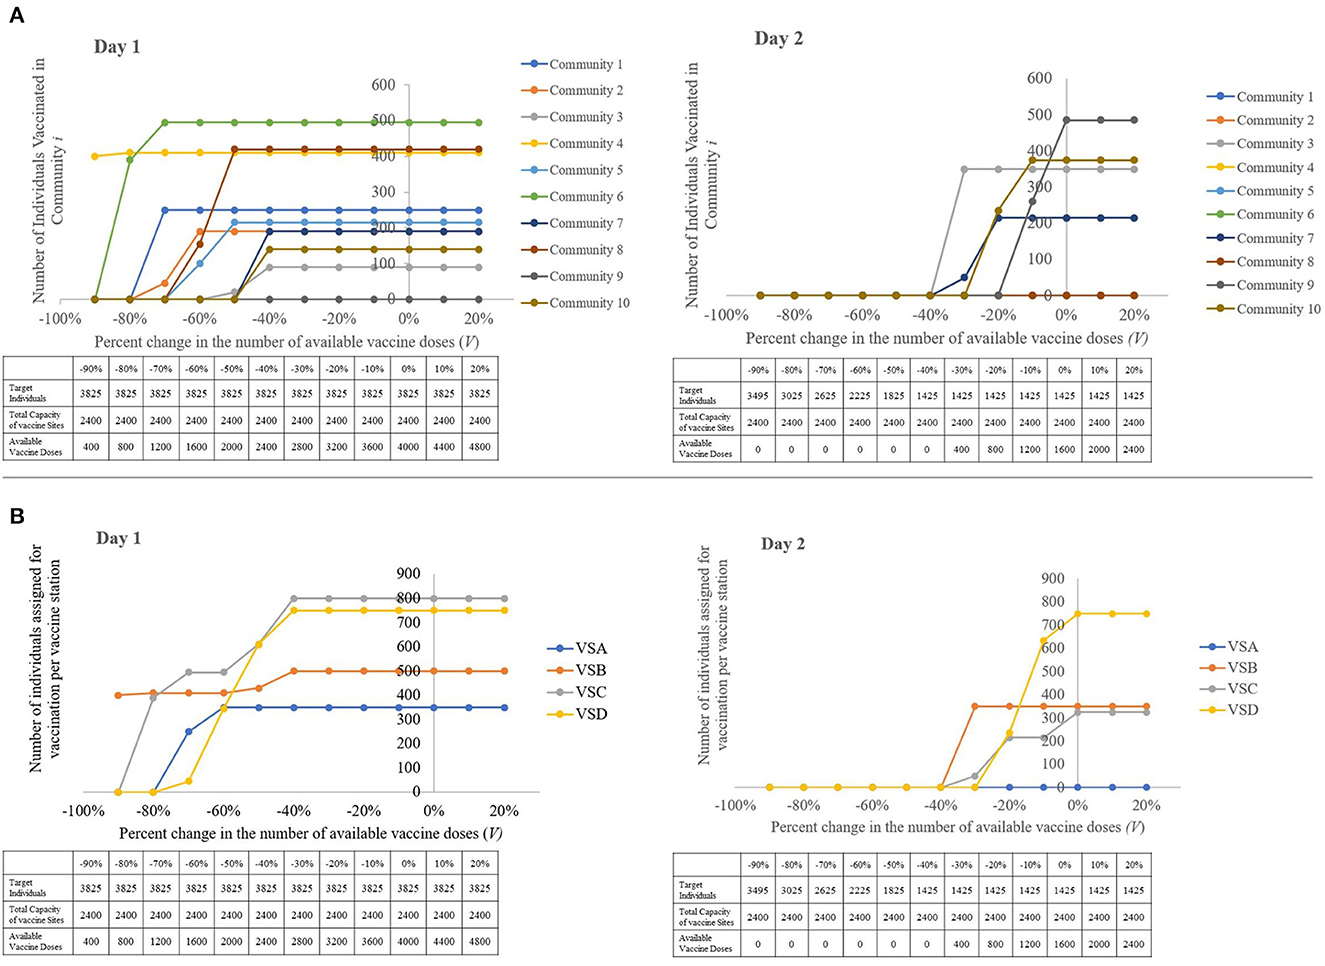
Figure 9. Visual representations of the sensitivity of the model to changes in the amount of available vaccine doses, with a table showing the parameters used per run. (A) The number of individuals vaccinated per community, per percent change in the total number of vaccine doses available. (B) The number of individuals assigned for vaccination per vaccine station, per percent change the total number of vaccine doses available (left to right: Day 1, Day 2).
The closer the values ∑ Ti, ∑Cj and V are to each other, the more likely it is to have a speedy and a more efficient vaccination rollout. While an excess in vaccine doses does not affect the speed of the vaccine rollout, this must be avoided so as to not underutilize this resource. Should this event be unavoidable, it is recommended that the decision-maker identify more target individuals or forward the excess to neighboring municipalities who are in need of additional vaccine doses for their own vaccination rollout.
3.4. Validation results
There is no significant difference in the results produced by the Vaccination DSS from those obtained through SuperDecisions and Excel Solver. With reference to Supplementary Table 1, the daily schedules of vaccination as well as allocation of target individuals to vaccination sites are identical. Supplementary Table 2 also shows that the difference between the prioritization scores computed by the DSS and SuperDecisions is <0.0010%. This outcome confirms the accuracy and reliability of the implemented AHP-IP model in the Vaccination DSS.
4. Conclusion
Scheduling the COVID-19 vaccine rollout involves subjective and objective information, as decision-makers must work with limited resources while also taking into account the particular COVID-19 scenario in their areas. In this paper, we presented a location-allocation model using the Analytic Hierarchy Process and Integer Programming that optimally schedules the COVID-19 vaccine rollout of a municipality. Through the domain expertise of the decision-maker, the prioritization of target individuals in the vaccine rollout are scored using AHP. These prioritization scores are interpreted as weights, and are incorporated into the IP model's objective function.
The methodology is implemented in a website-based decision support system that provides decision-makers of LGUs a straightforward and easily accessible tool for scheduling the COVID-19 vaccine rollout in their areas. It is also noteworthy that the methodology undertaken in this study may be modified to fit the vaccination rollout of other vaccine preventable and vaccine curable diseases. This DSS replaces conventional and time-consuming manual decision-making processes with a model based on operations research that is systematic and consistent even when confronted with the unique COVID-19 situation of a municipality.
While this study provides valuable insights, it is important to note that there are certain limitations that should be considered when interpreting the results. For one, the decision for choosing the criteria of the AHP model presented in this study came from consultations with LGUs of the Philippines who mostly oversee rural and urban areas in the Mindanao regions of the Philippines. Implementing this model to highly-urbanized areas may require consideration of other factors aside from the existing criteria mentioned. Likewise, the authors of this study recommend that future research endeavors in this area consider including in the model a shortest-path algorithm for determining the actual distance between the communities and vaccination sites, particularly if actual roads and paths are taken into account.
In addition, as this study only focuses on determining the prioritization of communities, it might be interesting to extend the AHP framework of the model to include individual-specific prioritization. Lastly, this study addresses vaccine deployment from vaccination sites. The overall success of the vaccination campaign is still dependent on other epidemiological contexts.
Data availability statement
The original contributions presented in the study are included in the article/Supplementary material, further inquiries can be directed to the corresponding author.
Author contributions
Conceptualization and methodology: RN, HC, NT, ZL, and MM. Software, resources, data curation, and writing—original draft preparation: HC and NT. Formal analysis: RN, HC, MM, and ZL. Writing—review and editing: HC, NT, HL, RN, MM, and ZL. Visualization: HC, NT, and ZL. Supervision, project administration, and funding acquisition: RN, MM, and ZL. All authors have read and agreed to the published version of the manuscript.
Funding
This work is supported by the Department of Science and Technology through the Predictive Modeling and Viral Phylodynamic Analysis on the Spatial and Temporal Patterns of Disease Outbreaks with considerations for Control and Logistics (PPASTOL) applied in Mindanao region research project under the Niche Center in the Regions for R&D (NICER) Program on Decision Support Systems in Health based in the University of the Philippines Mindanao and is monitored by Philippine Council for Health Research and Development (DOST-PCHRD).
Acknowledgments
In this work, we honor the life and memory of our beloved colleague, Raymond Pailagao, whose brilliant mind contributed to the formulation of the proposed AHP-IP Model.
Conflict of interest
The authors declare that the research was conducted in the absence of any commercial or financial relationships that could be construed as a potential conflict of interest.
Publisher's note
All claims expressed in this article are solely those of the authors and do not necessarily represent those of their affiliated organizations, or those of the publisher, the editors and the reviewers. Any product that may be evaluated in this article, or claim that may be made by its manufacturer, is not guaranteed or endorsed by the publisher.
Supplementary material
The Supplementary Material for this article can be found online at: https://www.frontiersin.org/articles/10.3389/fams.2023.1140434/full#supplementary-material
Supplementary Table 1. Results for the assignment of individuals for vaccination as obtained from the COVID-19 Vaccination DSS versus the results from the Excel Solver.
Supplementary Table 2. Comparison of prioritization scores of communities per vaccination site as generated by the COVID-19 vaccination DSS and the SuperDecisions (SD) software.
Supplementary Data Sheet 1. Target Individuals Masterlist of Municipality Z.
Supplementary Data Sheet 2. Vaccine Stations Masterlist of Municipality Z.
References
1. Jiang F, Deng L, Zhang L, Cai Y, Cheung CW, Xia Z. Review of the clinical characteristics of coronavirus disease 2019 (COVID-19). J Gen Intern Med. (2020) 35:1545–9. doi: 10.1007/s11606-020-05762-w
2. World Health Organization. COVID-19 Weekly Epidemiological Update. Geneva: World Health Organization (2022). Available online at: https://www.who.int/docs/default-source/coronaviruse/situation-reports/20220629_weekly_epi_update_98.pdf?sfvrsn=158c6adc_4&download=true (accessed August 02, 2022).
3. Kantor BN, Kantor J. Non-pharmaceutical interventions for pandemic COVID-19: a cross-sectional investigation of US general public beliefs, attitudes, and actions. Front Med. (2020) 7:384. doi: 10.3389/fmed.2020.00384
4. Kumar S, Viral R, Deep V, Sharma P, Kumar M, Mahmud M, et al. Forecasting major impacts of COVID-19 pandemic on country-driven sectors: challenges, lessons, and future roadmap. Person Ubiquit Comput. (2021) 26:1–24. doi: 10.1007/s00779-021-01530-7
5. Yap PA, Lachica ZP, Paras AL, Panogalinog IG, Tubay JM, Mata MA. An agent-based model of COVID-19 dynamics during enhanced community quarantine: exploring the role of food relief system in the presence of two SARS-CoV-2 variants. Front Appl Math Stat. (2023) 9:13. doi: 10.3389/fams.2023.1068180
6. Alzahrani SI, Aljamaan IA, Al-Fakih EA. Forecasting the spread of the COVID-19 pandemic in Saudi Arabia using ARIMA prediction model under current public health interventions. J Infect Public Health. (2020) 13:914–9. doi: 10.1016/j.jiph.2020.06.001
7. Arcede JP, Caga-anan RL, Mammeri Y, Namoco RA, Gonzales IC, Lachica ZP, et al. A modeling strategy for novel pandemics using monitoring data: The case of early COVID-19 pandemic in Northern Mindanao, Philippines. Sci Engg J. (2021) 15:35–46. Available online at: https://scienggj.org/2022/SciEnggJ%202022-vol15-no01-p35-46-Arcede%20et%20al.pdf
8. Kim MC, Park JH, Choi SH, Chung JW. Rhinovirus incidence rates indicate we are tired of non-pharmacological interventions against coronavirus disease 2019. J Korean Med Sci. (2022) 37:e15. doi: 10.3346/jkms.2022.37.e15
9. Davies NG, Kucharski AJ, Eggo RM, Gimma A, Edmunds WJ, Jombart T, et al. Effects of non-pharmaceutical interventions on COVID-19 cases, deaths, and demand for hospital services in the UK: a modelling study. Lancet Public Health. (2020) 5:e375–85. doi: 10.1101/2020.04.01.20049908
10. Love J, Keegan LT, Angulo FJ, McLaughlin JM, Shea KM, Swerdlow DL, et al. Continued need for non-pharmaceutical interventions after COVID-19 vaccination in long-term-care facilities. Sci Rep. (2021) 11:1–5. doi: 10.1038/s41598-021-97612-w
11. Espeland EM, Tsai CW, Larsen J, Disbrow GL. Safeguarding against Ebola: vaccines and therapeutics to be stockpiled for future outbreaks. PLoS Negl Trop Dis. (2018) 12:e0006275. doi: 10.1371/journal.pntd.0006275
12. Zheng D, Yi Y, Chen Z. Development of live-attenuated influenza vaccines against outbreaks of H5N1 influenza. Viruses. (2012) 4:3589–605. doi: 10.3390/v4123589
13. International Federation of Pharmaceuticals Manufacturers Associations. As COVID-19 Vaccine Output Estimated to Reach Over 12 Billion by Year End and 24 Billion by Mid-2022, Innovative Vaccine Manufacturers Renew Commitment to Support G20 Efforts to Address Remaining Barriers to Equitable Access. Geneva: International Federation of Pharmaceuticals Manufacturers and Associations (2021). Available online at: https://www.ifpma.org/resource-centre/as-covid-19-vaccine-output-estimated-to-reach-over-12-billion-by-year-end-and-24-billion-by-mid-2022-innovative-vaccine-manufacturers-renew-commitment-to-support-g20-efforts-to-address-remaining-barr/ (accessed April 13, 2022).
14. World Health Organization. Vaccine Equity. Geneva: World Health Organization (2022). Available online at: https://www.who.int/campaigns/vaccine-equity (accessed September 26, 2022).
15. United Nations. UN Analysis Shows Link Between Lack of Vaccine Equity Widening Poverty Gap. Washington, DC: United Nations (2022). Available online at: https://news.un.org/en/story/2022/03/1114762 (accessed April 13, 2022).
16. UNICEF. Immunization. New York, NY: UNICEF (2022). Available online at: https://data.unicef.org/topic/child-health/immunization/ (accessed August 02, 2022).
17. Department of Health. DOH, NTF Grateful To Hospitals And Vaccinees As Ph Inoculates 756 On First Day Of Covid-19 Vaccine Rollout. Lessburg: Department of Health (2021). Available online at: https://doh.gov.ph/doh-press-release/DOH-NTF-GRATEFUL-TO-HOSPITALS-AND-VACCINEES-AS-PH-INOCULATES-756-ON-FIRST-DAY-OF-COVID-19-VACCINE-ROLLOUT (accessed April 13, 2022).
18. Business World. 70M Filipinos Fully Vaccinated Against the Coronavirus. Little Rock: Business World (2022). Available online at: https://www.bworldonline.com/the-nation/2022/06/19/455995/70m-filipinos-fully-vaccinated-against-the-coronavirus/ (accessed July 29, 2022).
19. Department of Health. The Philippine National Deployment and Vaccination Plan for COVID-19 Vaccines. Lessburg: Department of Health (2021). Available online at: https://doh.gov.ph/sites/default/files/basic-page/The%20Philippine%20National%20COVID-19%20Vaccination%20Deployment%20Plan.pdf (accessed July 29, 2022).
20. Asian Development Bank. Country National Vaccination Prioritization Allocation Plan. Washington, DC: Asian Development Bank (2021). Available online at: https://www.adb.org/sites/default/files/linked-documents/54171-004-ld-03.pdf (accessed July 29, 2022).
21. Naguryen A. COVID-19 Vaccine Delays Reveal a Shortage of Healthcare Workers. New York, NY: Quartz (2021). Available online at: https://qz.com/1954675/covid-19-vaccine-delays-reveal-a-shortage-of-healthcare-workers/ (accessed July 29, 2022).
22. Zhang C, Li Y, Cao J, Wen X. On the mass COVID-19 vaccination scheduling problem. Comput Oper Res. (2022) 141:105704. doi: 10.1016/j.cor.2022.105704
23. Sprengholz P, Korn L, Eitze S, Betsch C. Allocation of COVID-19 vaccination: when public prioritisation preferences differ from official regulations. J Med Ethics. (2021) 47:452–5. doi: 10.1136/medethics-2021-107339
24. Rahman SU, Smith DK. Use of location-allocation models in health service development planning in developing nations. Euro J Operat Res. (2000) 123:437–52. doi: 10.1016/S0377-2217(99)00289-1
25. Namoco RA, Lago EM, Pailagao RO, Vallar JB. An integer programming approach for patrol police allocation in an Urban City in the Philippines. Indian J Sci Technol. (2017) 10:1–8. doi: 10.17485/ijst/2017/v10i40/119147
26. Mapa SM, da Silva Lima R. Combining geographic information systems for transportation and mixed integer linear programming in facility location-allocation problems. J Softw Eng Appl. (2014) 7:844. doi: 10.4236/jsea.2014.710076
27. Panjaitan DJ, Suwilo S, Opim SS. Optimization model for a location-allocation-routing in a periodic distribution network. J Phys Conf Ser. (2019) 1255:012050. doi: 10.1088/1742-6596/1255/1/012050
28. Saaty RW. The analytic hierarchy process—what it is and how it is used. Math Model. (1987) 9:161–76. doi: 10.1016/0270-0255(87)90473-8
29. Taskin E, Sarioglu S. The linguistic analysis of brand names with the analytic hierarchy process and an application in Turkish biscuit market. Innov Market. (2021) 7:108–14.
30. Eom SB. Decision support systems research: current state and trends. Ind Manag Data Syst. (1999) 99:213–21. doi: 10.1108/02635579910253751
32. World Health Organization. WHO sage roadmap for prioritizing uses of COVID-19 vaccines. In: The Context of Limited Supply an Approach to Inform Planning and Subsequent Recommendations Based Upon Epidemiologic Setting and Vaccine Supply Scenarios. Geneva: World Health Organization (2020). Available online at: https://www.who.int/docs/default-source/immunization/sage/covid/sage-prioritization-roadmap-covid19-vaccines.pdf (accessed August 02, 2022).
33. Leithäuser N, Schneider J, Johann S, Krumke SO, Schmidt E, Streicher M, et al. Quantifying COVID-19-vaccine location strategies for Germany. BMC Health Serv Res. (2021) 21:1–8. doi: 10.1186/s12913-021-06587-x
34. Krzysztofowicz S, Osińska-Skotak K. The use of GIS technology to optimize COVID-19 vaccine distribution: a case study of the city of Warsaw, Poland. Int J Environ Res Public Health. (2021) 18:5636. doi: 10.3390/ijerph18115636
35. Saaty TL. How to make a decision: the analytic hierarchy process. Eur J Oper Res. (1990) 48:9–26.
37. Ragsdale C. Spreadsheet Modeling and Decision Analysis: A Practical Introduction to Business Analytics. Cengage Learning (2021). 21:94.
38. Webby R, O'connor M. The effectiveness of decision support systems: the implications of task complexity and DSS sophistication. J Inform Technol. (1994) 9:19–28. doi: 10.1057/jit.1994.3
39. CodeIgniter. The Small Framework with Powerful Features. CodeIgniter (2022). Available online at: https://www.codeigniter.com/ (accessed March 18, 2022).
40. PYPI. Project Description. Beijing: PYPI (2021). Available online at: https://pypi.org/project/PuLP/ (accessed March 18, 2022).
41. Pandas. Package Overview. (2022). Available online at: https://pandas.pydata.org/docs/getting_started/overview.html (accessed March 18, 2022).
Keywords: Analytical Hierarchy Process, integer programming, local government units, optimal allocation, decision support system
Citation: Culaste HFC, Torres NJD, Lachica ZPT, Lorono HGP, Inguillo RF, Mata MAE and Namoco RA (2023) A decision support system for the optimal allocation and distribution of COVID-19 vaccines using analytic hierarchy process (AHP) and integer programming (IP) model. Front. Appl. Math. Stat. 9:1140434. doi: 10.3389/fams.2023.1140434
Received: 09 January 2023; Accepted: 31 March 2023;
Published: 24 May 2023.
Edited by:
Raluca Eftimie, University of Franche-Comté, FranceReviewed by:
Teddy Lazebnik, University College London, United KingdomAngelyn Lao, De La Salle University, Philippines
Copyright © 2023 Culaste, Torres, Lachica, Lorono, Inguillo, Mata and Namoco. This is an open-access article distributed under the terms of the Creative Commons Attribution License (CC BY). The use, distribution or reproduction in other forums is permitted, provided the original author(s) and the copyright owner(s) are credited and that the original publication in this journal is cited, in accordance with accepted academic practice. No use, distribution or reproduction is permitted which does not comply with these terms.
*Correspondence: May Anne E. Mata, bWVtYXRhQHVwLmVkdS5waA==
†Present address: Zython Paul T. Lachica, St. Cross College, Oxford, United Kingdom