 Nabeela Anwar
 Iftikhar Ahmad
 Adiqa Kausar Kiani
 Muhammad Shoaib
 Muhammad Asif Zahoor Raja
- 1Department of Mathematics, University of Gujrat, Gujrat, Pakistan
- 2Future Technology Research Center, National Yunlin University of Science and Technology, Yunlin, Taiwan
- 3Artificial Intelligence (AI) Center, Yuan Ze University, Taoyuan, Taiwan
The most important factor for increasing crop production is pest and pathogen resistance, which has a major impact on global food security. Pest management also emphasizes the need for farming awareness. A high crop yield is ultimately achieved by protecting crops from pests and raising public awareness of the devastation caused by pests. In this research, we aim to investigate the intricate impacts of nonlinear delayed systems for managing crop pest management (CPM) supervised by Ordinary Differential Equations (ODEs). Our focus will be on highlighting the intricate and often unpredictable relationships that occur over time among crops, pests, strategies for rehabilitation, and environmental factors. The nonlinear delayed CPM model incorporated the four compartments: crop biomass density [B(t)], susceptible pest density [S(t)], infected pest density [I(t)], and population awareness level [A(t)]. The approximate solutions for the four compartments B(t), S(t), I(t), and A(t) are determined by the implementation of sundry scenarios generated with the variation in crop biomass growth rate, rate of pest attacks, pest natural death rate, disease associated death rate and memory loss of aware people, by means of exploiting the strength of the Adams (ADS) and explicit Runge-Kutta (ERK) numerical solvers. Comparative analysis of the designed approach is carried out for the dynamic impacts of the nonlinear delayed CPM model in terms of numerical outcomes and simulations based on sundry scenarios.
1. Introduction
In recent years, researchers have paid more attention to integrated pest management, and its use in the crop field has increased. This strategy emphasizes the implication of biological control factors to minimize the credence of pesticides. In agriculture, forest management, and population health, microbiological pesticides play a significant role in incorporated pest management. In the case of crops, biopesticides provide noticeable pest management dependability as part of incorporated pest management [1]. In North America and Europe, viruses are used as pest control agents against insect pests [2–4]. Agricultural-related awareness programs on radio, TV, mobile and other media might aid in disseminating agricultural knowledge among farmers and ranchers about the hazards of pesticide use on human health as well as the other linked environmental concerns [5–9]. Pesticide overuse is significantly associated with farmers' lack of pesticide knowledge, the impact of pesticide retail outlets, and inaccessibility to non-synthetic pest control methods, while the tendency to overuse reduces higher levels of the learning process in Integrated Pest Management [10]. As a result, farming awareness is essential to prevent crop losses having the least amount of detrimental side effects [11, 12]. Pesticide communication campaigns made it easier for farmers to understand the substantial risks pesticides pose to public health and the ecosystem, and to limit harmful consequences. Farmers primarily learned about pesticide use and hazards through oral communication [13].
Time delay is a key feature in both natural and manmade systems. Kuang provided an example to demonstrate the significance of time delay [14]. He claimed that animals require time to digest their food before moving on to other activities and reflexes. As a result, any species model with no temporal delay is at best an approximation [15]. Many systems as well as industrial plants, including biological systems, machining, metal forming, thermal acoustic systems and many others experience time delays [16–19]. Furthermore, dynamical systems including time delay exhibit far more complex behaviors than those without delay in time [20]. There are two key reasons for the presence of temporal delays in prey-predator systems [21, 22]. The first is the gestation period, and the second is the maturation period. As a result, incorporating delays into predator-prey model is essential for ensuring the realistic nature of these models and demonstrating how well the population dynamics of such models are influenced by previous relevant information. In fact, time delays have a significant impact on the overall characteristics of dynamic systems. Many publications in the literature have described the theory-based analysis of the prey-predator model involving time delay, such as hunting delay [23], dispersal delay [24], predator gestation period [25], as well as intra-specific competitive pressure generated feedback delay [26].
There is a lack of mathematical modeling on agricultural awareness to limit plant pests as well as diseases. Daudi et al. [27] proposed a dynamic model using the fractional derivative operator for maize growth as well as interactions with fall armyworms. They described the basic reproductive number, which was the average amount of newborns generated by a single female moth over the course of a lifespan. The resilience of the trivial equilibria, as well as the positive equilibria of the dynamical system, were investigated by Li et al. [28] and the threshold requirements for pest destruction and system permanence were determined. Xiang et al. [29] explored the influence of MD controls on the dynamical behavior of the pest systems by adding the gestational delay and sex pheromones. First, the system's bounds, stability, as well as bifurcation were discussed. Second, by integrating the constraint violating function, an optimized control problem depending on sex pheromone and pesticides was reduced into an analogous optimized parameter decision issue. The bifurcation control of mosaic viruses fractional order infection models for Jatropha curcas with agricultural awareness and an executing delay was examined by Liu et al. [30] Hopf bifurcation generated by executing delay was explored for the unregulated system by examining the corresponding characteristic equation. They found that changing the fractional order had a considerable impact on bifurcation dynamics. Kumari et al. [31] employed the Integrated Pest Management (IPM) technique to create a mathematical model that used a combination of chemical and biological management. The feasibility of pest eradication and non-trivial equilibria state were examined, and the local stability of the pest eradication equilibria state was investigated further. Shi et al. [32] presented a unique population Smith framework with continual delay as well as impulsive phase adaptive control and examined how it may be used in pest management. The model's singularity was first qualitatively examined, and then the presence and uniqueness of order one periodical orbits were considered in order to calculate the frequency of chemical control implementation. A Filippov prey predator model incorporating time delay was introduced by Arafa et al. [33], where the delay time indicated the changes in the natural enemy's growth rate before discharging it to fatten up pests. The bifurcation parameter time delay was used to derive the threshold constraints for the stability of the equilibrium. Utilizing Hopf bifurcation, it was proven that whenever the time delay parameter crosses through specific critical levels, a periodical oscillation phenomenon arises. They also established the equation of slipping motion and addressed the sliding phase dynamics using the Filippov convex approach. Al Basir et al. [34] presented prey predator framework for assessing the impact of delay time in crop pest management utilizing agricultural awareness-based treatments. The authors indicated that the application of biological insecticides is proportionate to the pest population density on the plantation. The presence of steady states, as well as their stability, had been examined. Allen-Perkins and Estrada [35] constructed an epidemic model to explore disease transmission and control in planted agricultural farms as a long-term pest management strategy. In an epidemiological susceptible, infectious and removed model, the model includes the mobility of aphids carrying a virus in an agricultural farm, the spatial dispersion of plants in a planted field, and the existence of “trapped crops.” Abraha et al. [36] studied a mathematical model for crop pest control that took into account plant biomass, pests, and the impact of farmer awareness. The basic reproductive number and delays in time were used to determine the presence as well as stability of the equilibria. Whenever time delays approach critical values, stability transitions happen due to Hopf-bifurcation. The delayed system's cost-effectiveness was assessed using optimal control-theory. Rossini et al. [37] presented a mathematical framework for calculating the analytical solutions to the second variant of the distributed delay model. The researchers also investigated how the model behaved when it came to representing the population of insect pests in various environmental factors, particularly with respect to temperature. Al Basir et al. [38] proposed a mathematical model including delay to investigate the impact of public awareness on agricultural pest management using crop biomass, and pests. The basic reproductive number was used to determine the presence and stability conditions of the equilibria. The Hoph bifurcation analysis was performed at the epidemic equilibria with time delay as the bifurcation parameter.
Numerical approaches are frequently employed in science and engineering to solve mathematical problems for which exact solutions are difficult or impossible to grab. Only a limited number of differential equations can be solved analytically. There are several analytical methods to solve ordinary differential equations (ODEs). Although several ODEs have closed form solutions that can be obtained using renowned analytical methods, numerical methods must be evolved and applied to obtain numerical solutions of a differential equation under a predefined initial history. Many researchers used a variety of numerical methods to simulate the solution of mathematical models, acquiring results that were more accurate than those found in the literature, such as [39–43]. Researchers have recently focused their efforts on the numerical solutions of numerous mathematical models in the realm of epidemiology, such as the HIV model [44], COVID-19 [45], plant disease model [46], tuberculosis propagation model [47], computer virus transmission model [48]. Although the above mentioned techniques have high precision and consistency but they require considerable memory and long computational cost. Consequently, the procedures for this technique present noteworthy challenges that may be resolved in order to ensure that the solution is precise and consistent. Therefore, several efforts have been made by researchers to develop efficient techniques for solving linear and non-linear ODE systems [49–51]. The importance of numerical solutions is emphasized in the literature listed above. As a result of these considerations, the authors have decided to use the ADS (Adams) and ERK (explicit Runge–Kutta) numerical solvers to solve the delay differential system [52–56]. The Adams predictor-corrector approach [46, 57–60] is also a more efficient and straightforward numerical tool for solving delay differential systems.
In order to manage crop pests, insecticides or other preventative measures are frequently used. The emphasis is shifted to educating farmers about alternative techniques including rotation of crops, biological insect control, and cultural practices by incorporating agricultural knowledge into the pest management approach. Through integration, agricultural pest control may be approached holistically and sustainably [61]. To model and simulate the dynamics of agricultural pest populations while taking into account a variety of elements such as environmental conditions, insect life cycles, and farming practices, numerical analytic techniques such as the use of differential equations and optimization methods can be used. The model can offer insights to the population dynamic of pests, the effects of various management techniques, and the ideal time for putting control measures into place by using numerical analysis. By offering data-driven advice to farmers and decision-makers, this quantitative method improves the decision-making process [62]. In general, the notion is innovative since it addresses agricultural pest control by combining principles of farming awareness with numerical analytic methods. This multidisciplinary approach emphasizes eco-friendly and sustainable practices while also offering a quantitative foundation for analyzing and improving pest management tactics. Combining these factors helps researchers create agricultural pest management strategies that are both more practical and ecologically responsible. This research may help with the creation of efficient and long-lasting farming awareness campaigns, the adoption of integrated pest management techniques, and the alleviation of farmer difficulties brought on by crop pests. Time delay models really have the potential to increase complexity because of the intrinsic properties of temporal latencies and their impact on system dynamics. The implementation of numerical solutions for non-linear delayed systems may be challenging and computationally expensive. Researchers may require sophisticated software, outstanding durability computing devices, as well as expertise in both computational and mathematical modeling strategies. In this study, we used state-of-the-art numerical techniques like Adam (ADS) and explicit Runge–Kutta (ERK) to find the numerical solution of the non-linear delayed CPM model. The presented study has the following salient features:
• The dynamic impact of the non-linear delayed crop pest management (CPM) system supervised by ODEs is analyzed by incorporating awareness growth level.
• The approximate solutions for the four compartments B(t), S(t), I(t), and A(t) are determined by the implementation of sundry scenarios generated with the variation in crop biomass growth rate, rate of pest attacks, pest natural death rate, disease associated death rate and memory loss of aware people.
• The strength of the Adams and explicit Runge–Kutta numerical solvers are utilized to determine the approximate solutions for the non-linear delayed CPM model.
• Comparative analysis is carried out for the dynamic impact of the non-linear delayed CPM model in terms of numerical outcomes as well as graphical illustrations based on sundry scenarios.
The rest of the article's layout is as follows: In the second section, the non-linear delayed CPM model is formulated. The third section provides a detailed overview of the methodology. The fourth section provides the analysis, discussion, and graphical interpretation of approximate solutions. The fifth section presents the analysis-based conclusion.
2. Formulation of the mathematical model
The model [38] integrated agricultural biomass, pests, and the population's awareness. Crop biomass density, susceptible pest density, infected pest density, and aware people density are the four compartments incorporated in the model. Logistical evolution for the densities of crop biomass is assumed, since crop fields have a finite size (though it might be large), with a net growth rate a and N is carrying capacity. Pests that are susceptible to the crop are attacked, significantly reducing the crop. Let λ represent the pest attack rate on crops [38].
To take into consideration their interests as well, aware individuals may keep the crops under observation and, if properly trained, will squirt biopesticides or integrate them into fertilizer applications to manage the insect invasion. The massive term lA(t)S(t) can be used to introduce the awareness action rate l, which results from deliberate human activities and control actions like the application of biopesticides [38].
Pests that are infected can also harm the crop, ϕδ, although at a much lesser rate ϕ < 1. Here, c represents the pests' natural death rate, and the infection mortality rate β is a result of knowing human behavior, like the application of insecticides [38].
μ and μ1 represent the “conversion efficacy” of susceptible as well as infected pests, or how well the pests can use plant components. Since pests influenced by pesticides are less effective, μ > μ1. Because of media initiatives and increased public awareness, farmers now have a higher level of awareness, which is denoted by A. Additionally, it is expected that the exposure of the resilient pests influences the rate at which local information is increasing at a rate d. The loss of memory causes farmers' levels of consciousness to decline at a rate υ [38].
A delay in observing the number of pests or their activity might occur in a field. Typically, this prediction is produced by studying past incidences of pest prevalence. As a consequence, there are differences in the degree of awareness and the application of preventive countermeasures. Enforcement of such remedies is anticipated to be delayed. The number of pests present at time (t-τ) (or time τ > 0 in some cases) will determine how intense the awareness campaigns are at time t.
The following modified mathematical model results from the abovementioned assumptions [38].
and initial conditions are as:
Each parameter used in the mathematical model is described in the nomenclature. The parameters' descriptions and default values are listed in Table 1 as per in Al Basir et al. [38]. These default parameter values are used to generate each scenario. The non-linear delayed CPM model by using numerical values can be mathematically defined for one of the cases as:
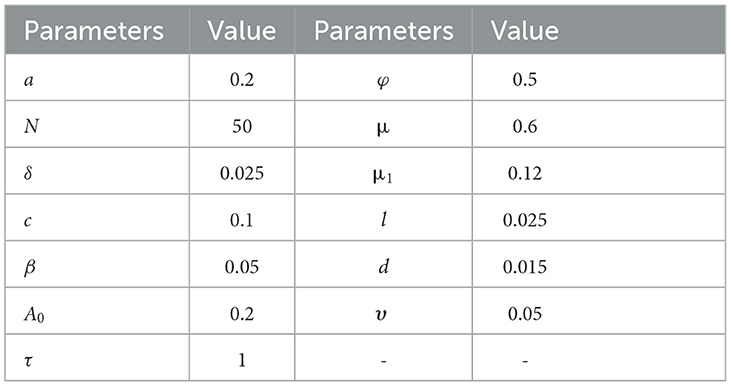
Table 1. Parameters default values used for non-linear delayed CPM model [38].
3. Methodology
This section includes a detailed presentation of the learning methodologies that are used to determine the approximate solutions of the non-linear delayed CPM model.
3.1. Adams method
A two-step process called the ADS numerical solver is used to solve an ODE [63, 64]. Initially, the predictive stage provides a rough approximation of the target outcome in order to utilize an explicit technique. The corrector step uses a different method, typically an implicit one, to speed up the previous approximation.
For the very first equation in set (7) of the non-linear delayed CPM model, use the following formula to produce a two-step prediction solution:
Once the very first equation in the non-linear delayed CPM model has been evaluated, the following two step corrector formula is obtained:
Adams techniques may be used to solve a variety of initial value problems, including those involving delay differential equations and ODEs. They are capable of handling stiff as well as non-stiff systems. When compared to other numerical approaches, such as implicit methods, these techniques are computationally efficient. They can lead to faster computations since they require fewer function evaluations each step. Adams techniques contain stability constraints on the step-size and the ratio of step-size to time delay, making them conditionally stable. The approach could result in unstable solutions if these requirements are not satisfied. Adams techniques need a sufficient number of starting values to begin the iteration process since they are multi-step approaches. When starting quantities are difficult to get or need further calculations, this might be difficult [65].
3.2. Runge–Kutta method
The explicit Runge–Kutta (ERK) numerical solver can be used efficiently and comprehensively to solve ODEs [66]. C. Runge and M. W. Kutta introduced the Runge–Kutta methods in the early 1900s. As time went on, this approach played a significant part in the research of iterative approaches based on explicit and implicit assumptions that were used to solve ODEs using time discretization.
The generic form of ODE is considered as:
A generic form of ERK method is defined as:
where the time interval is h = Δt, and yn approximates y(tn).
The stability characteristics of Runge–Kutta techniques are well established. They can manage a variety of concerns, which includes stiff systems, without running into stability problems. Numerical simulations can be resilient and trustworthy thanks to this stability. These methods are adaptable and effective for dealing with delayed differential equations as well as regular differential equations, partially differential equations, and other forms of differential equations. They have broad applications in several fields of science and engineering [67].
4. Analysis and discussion
The approximate numerical solutions for compartments B(t), S(t), I(t), and A(t) of the non-linear delayed CPM model are presented here in this section. The dynamics of the non-linear delayed CPM model are investigated for sundry scenarios each comprising of 1–5 cases by means of ADS and ERK numerical solvers with input points from 0 to 300 and step size 0.5. The approximate solutions for the sundry scenarios with 1–5 cases of the non-linear delayed CPM model are computed by varying the crop biomass growth rate, rate of pest attacks, pest natural death, disease associated mortality rate and memory loss of aware people.as listed in Table 2. Figure 1 presented the flowchart of the designed methodology.
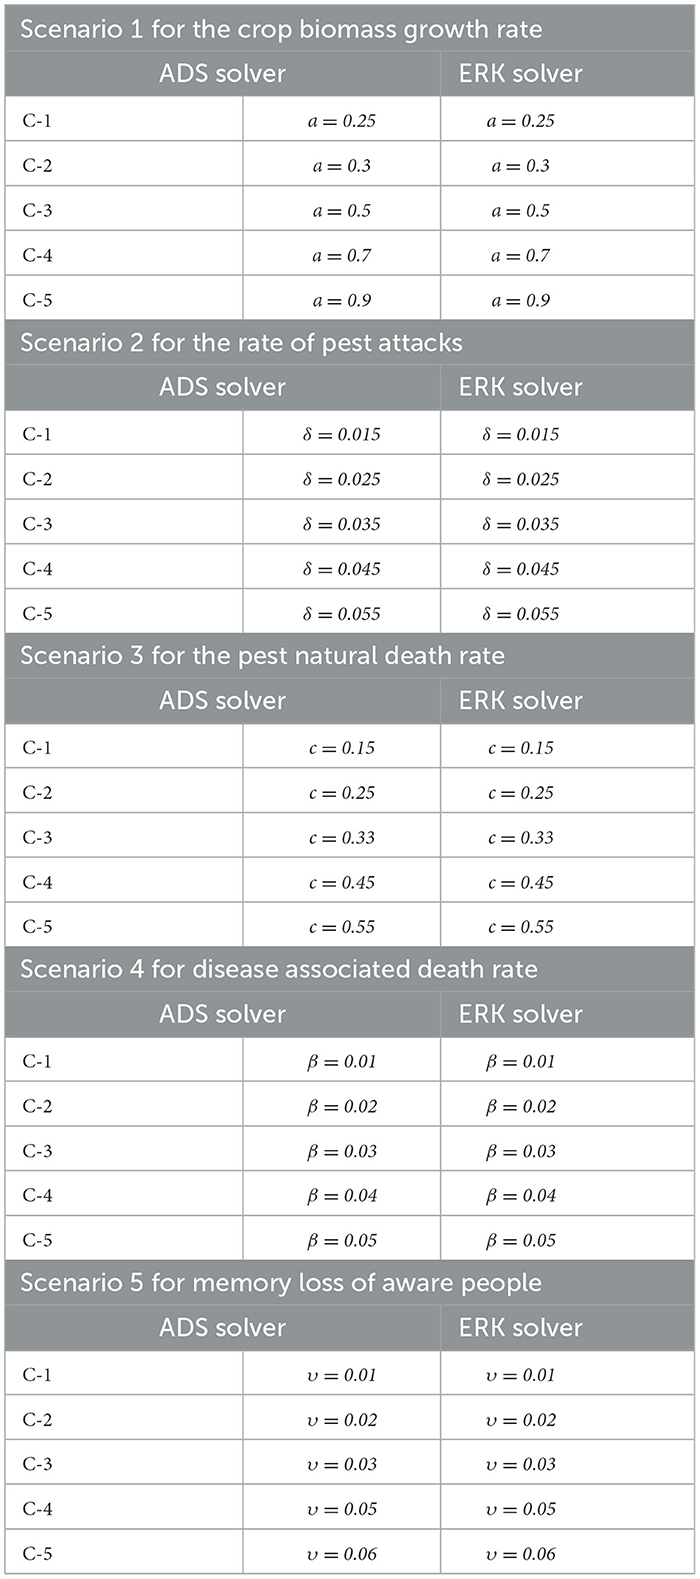
Table 2. Illustration of scenarios for the non-linear delayed CPM model.
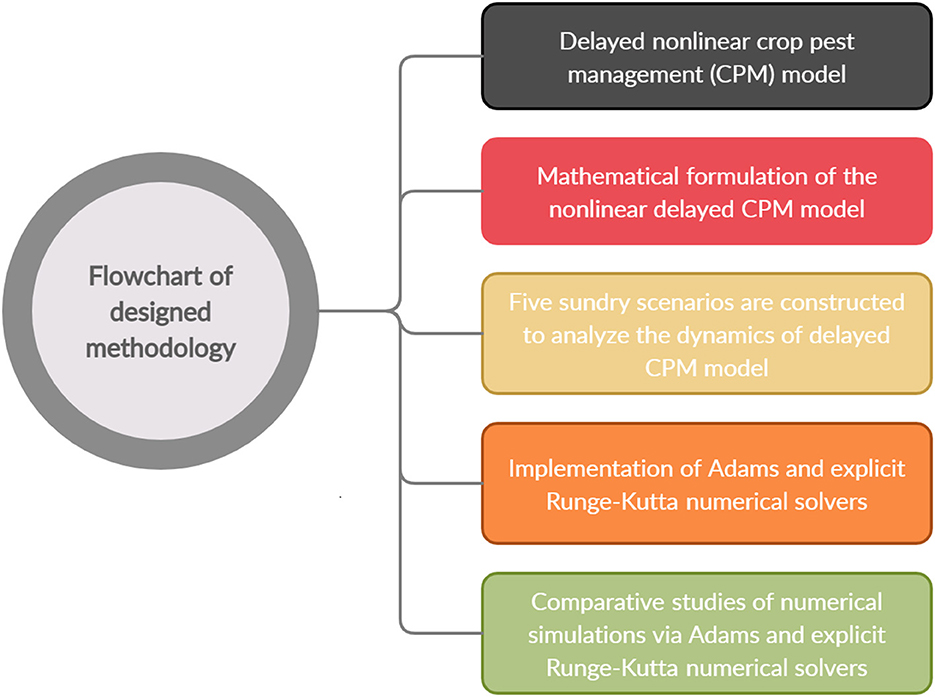
Figure 1. Flowchart of designed methodology for non-linear delayed CPM model.
The dynamics of crop biomass density are shown in Figures 2A, B, respectively, using the ADS and ERK numerical solvers for the variation in crop biomass growth rate, i.e., a for the non-linear delayed CPM model. The crop biomass density has been found to increase as the value of a increases. Figures 2C, D for various values of a illustrate the effects of susceptible pest density. The graph shows that as the value of a increases, so does the density of pests that are susceptible. Figures 3A, B show how infected pests' behavior varies as the value of a changes. There is an increase in the density of infected pests for larger values of a. The effects of people's level of awareness for various values of a are depicted in Figures 3C, D. The graph illustrates how increasing the value of a raises the level of awareness. Table 3 presents the numerical results for the classes B(t), S(t), I(t), and A(t) for scenario 1, case-1 of the non-linear delayed CPM model. Using the strength of ADS and ERK numerical solvers for cases 1 to 5 of scenario 2, the dynamics of the non-linear delayed CPM model for the rate of pest attacks, i.e., δ, is investigated for all four classes B(t), S(t), I(t), and A(t) and graphically shown in Figures 4, 5 respectively. The numerical outcomes for the classes B(t), S(t), I(t), and A(t) for scenario 2, case-1 of the non-linear delayed CPM model are shown in Table 3. Raising the value of δ increases the density of crop biomass, as presented in Figures 4A, B. For case-1 of pest attacks rate, the maximum value of B(t) is approximately between 5 to 45, oscillates from 0 to 150 days, and then maintains steady state behavior. The maximum value for case-2 is between 5–30 and it initially exhibits oscillating behavior in the range of 0 to 250 days before becoming stable in the range of 250 to 300 days. Cases 3 to 5, as depicted in Figures 4A, B, exhibit oscillations with varying amplitudes across the time interval. As the value of pest attacks i.e., δ expanded, the density of susceptible pests also increased, as seen in Figures 4C, D.
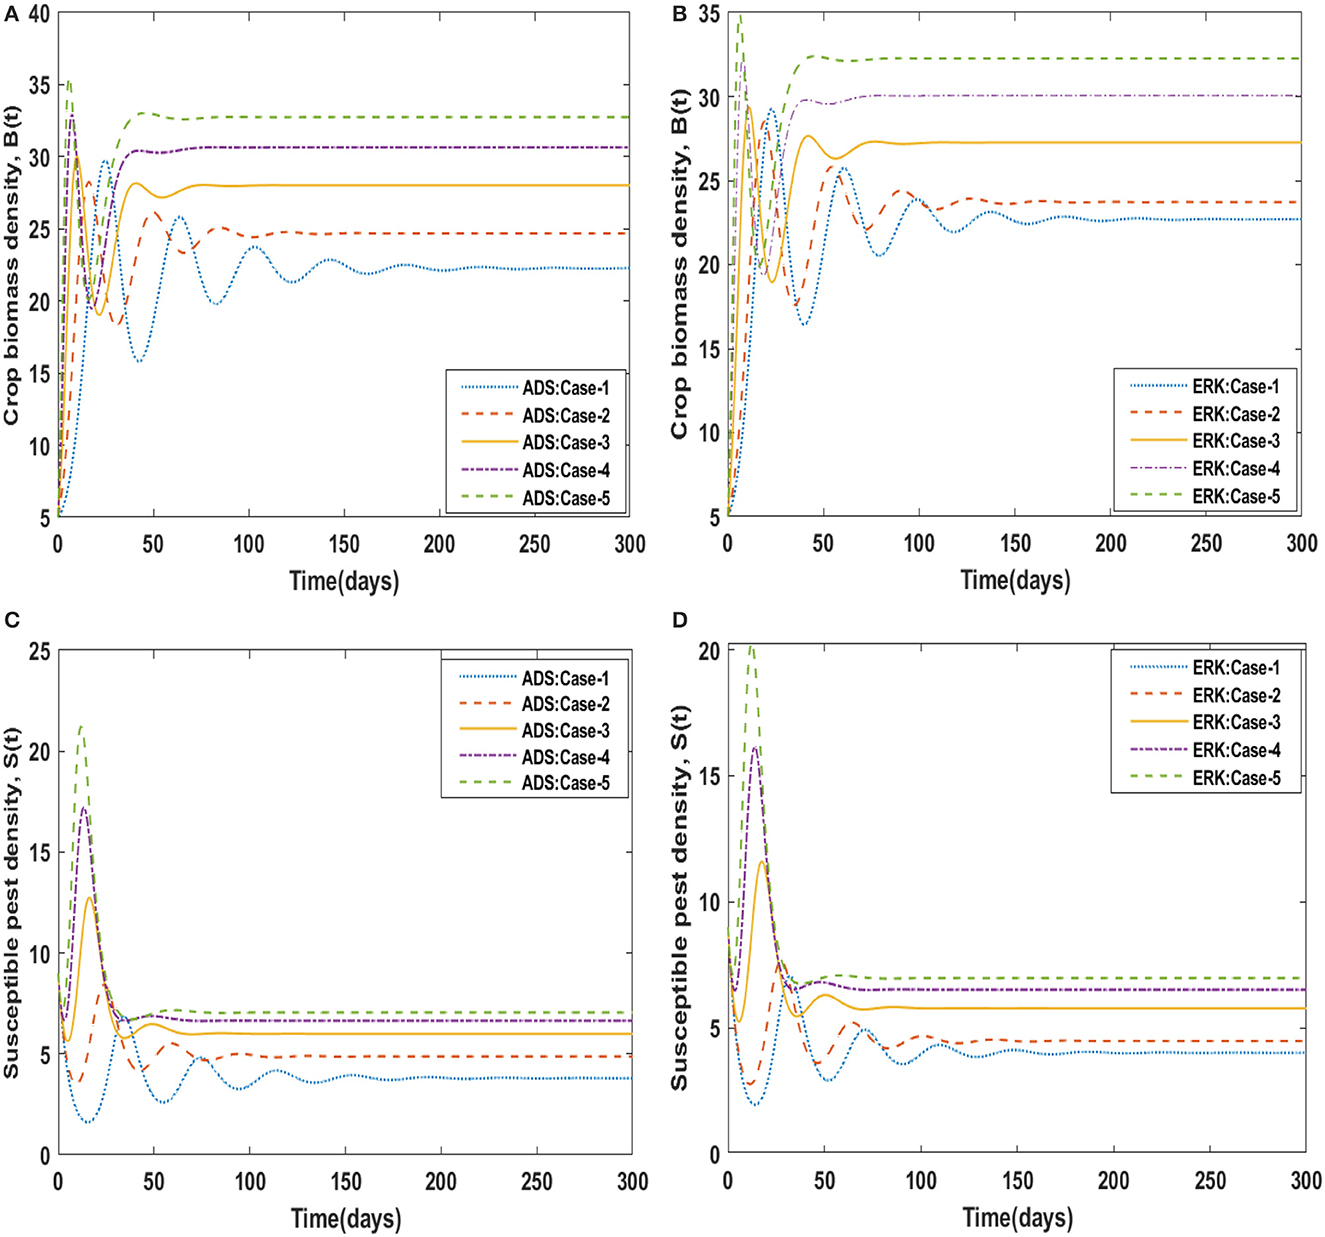
Figure 2. (A–D) Dynamics of B(t), S(t) for variation in α by ADS and ERK solvers.
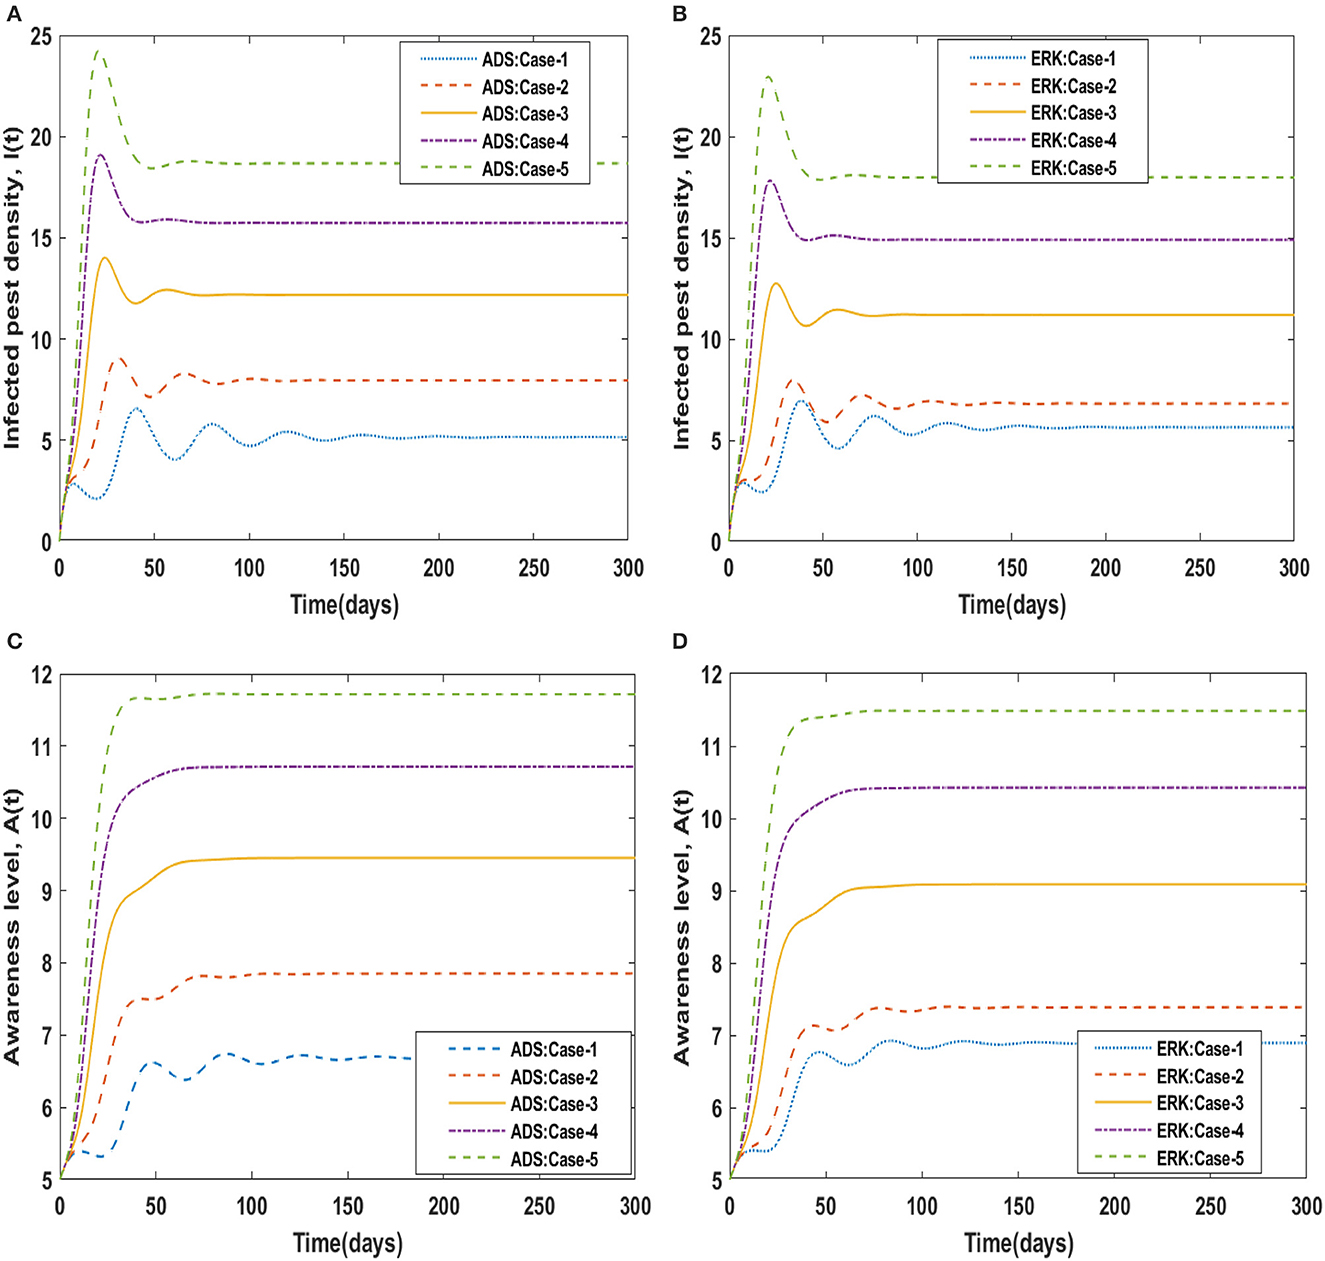
Figure 3. (A–D) Dynamics of I(t), A(t) for variation in α by ADS and ERK solvers.
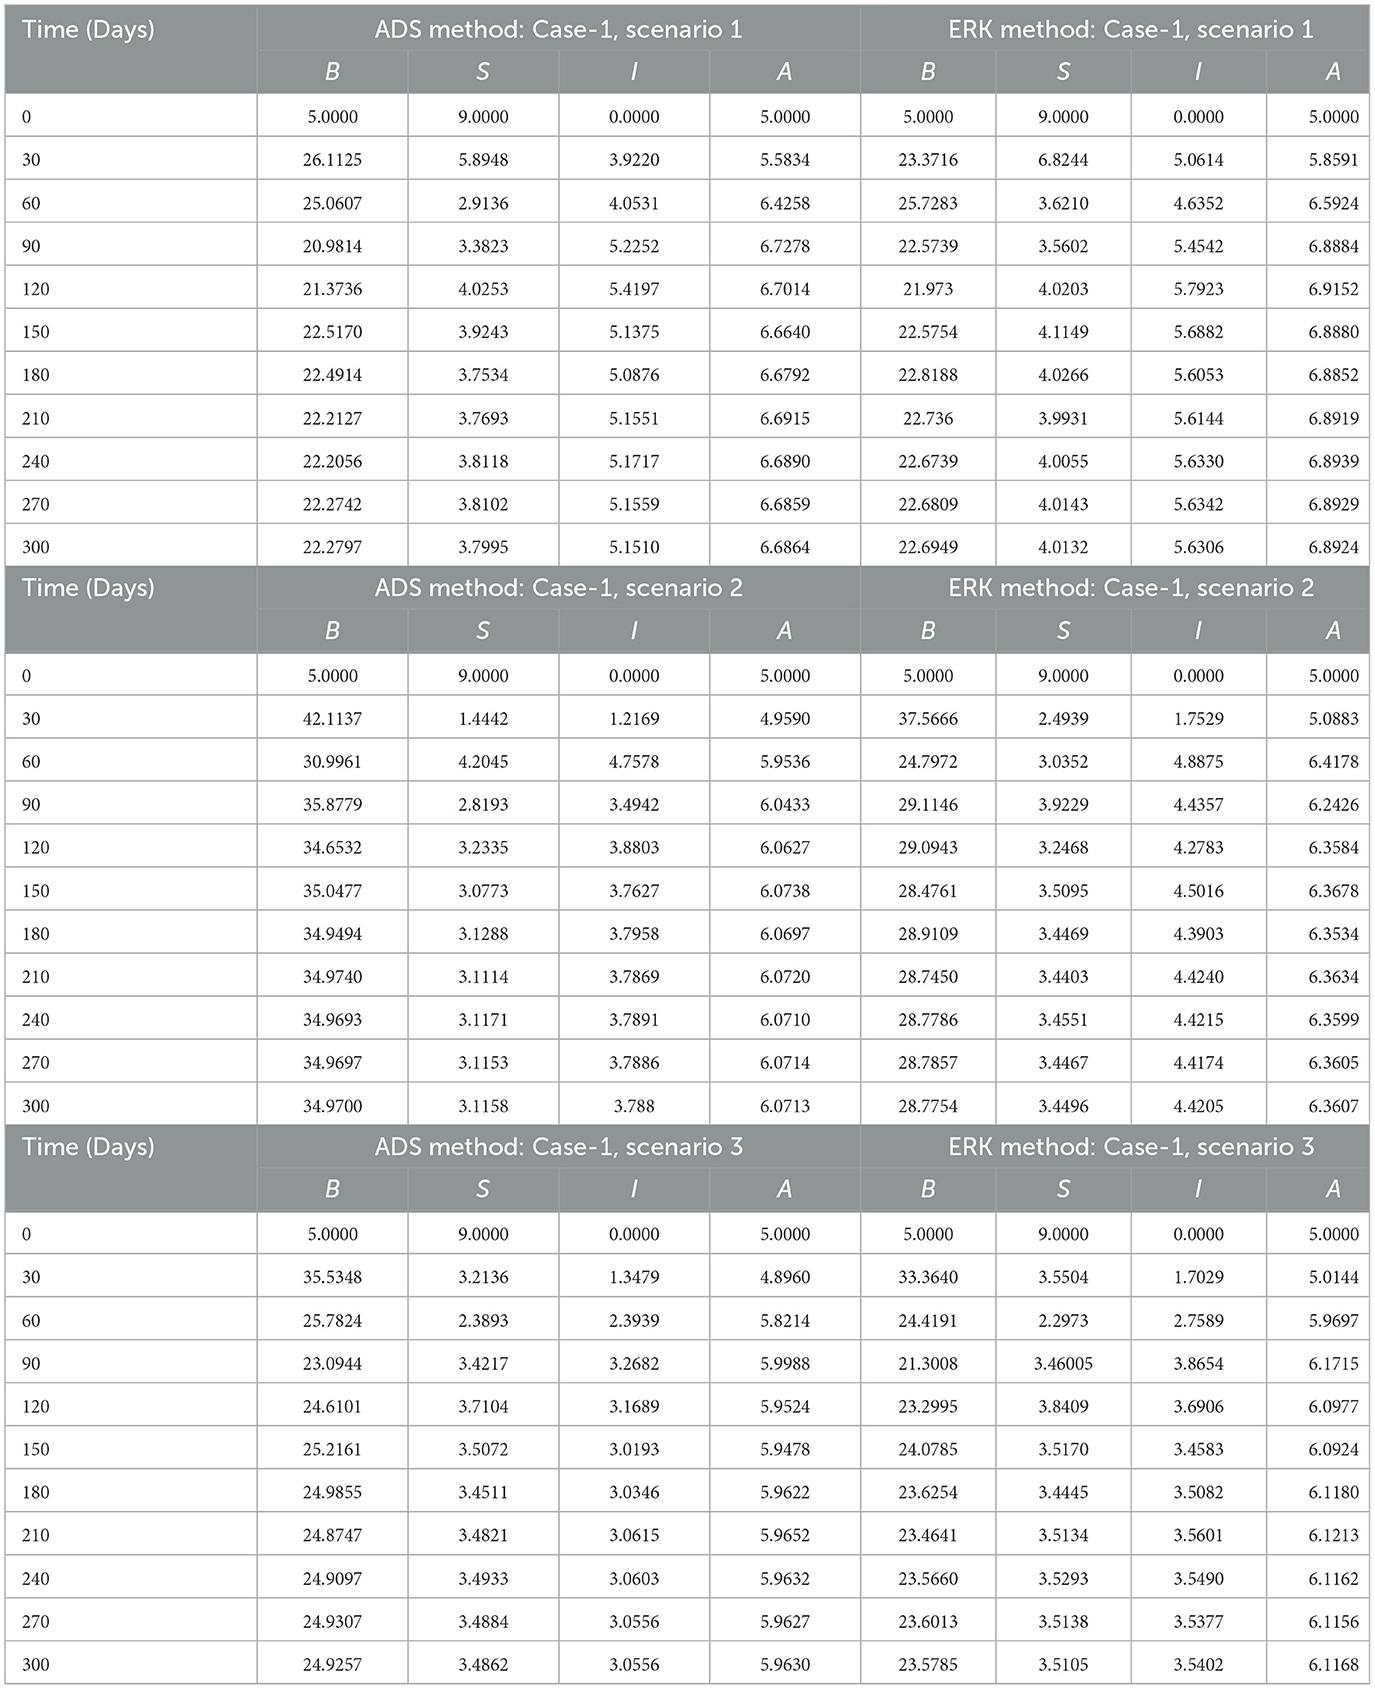
Table 3. Numerical solutions of non-linear delayed CPM model.
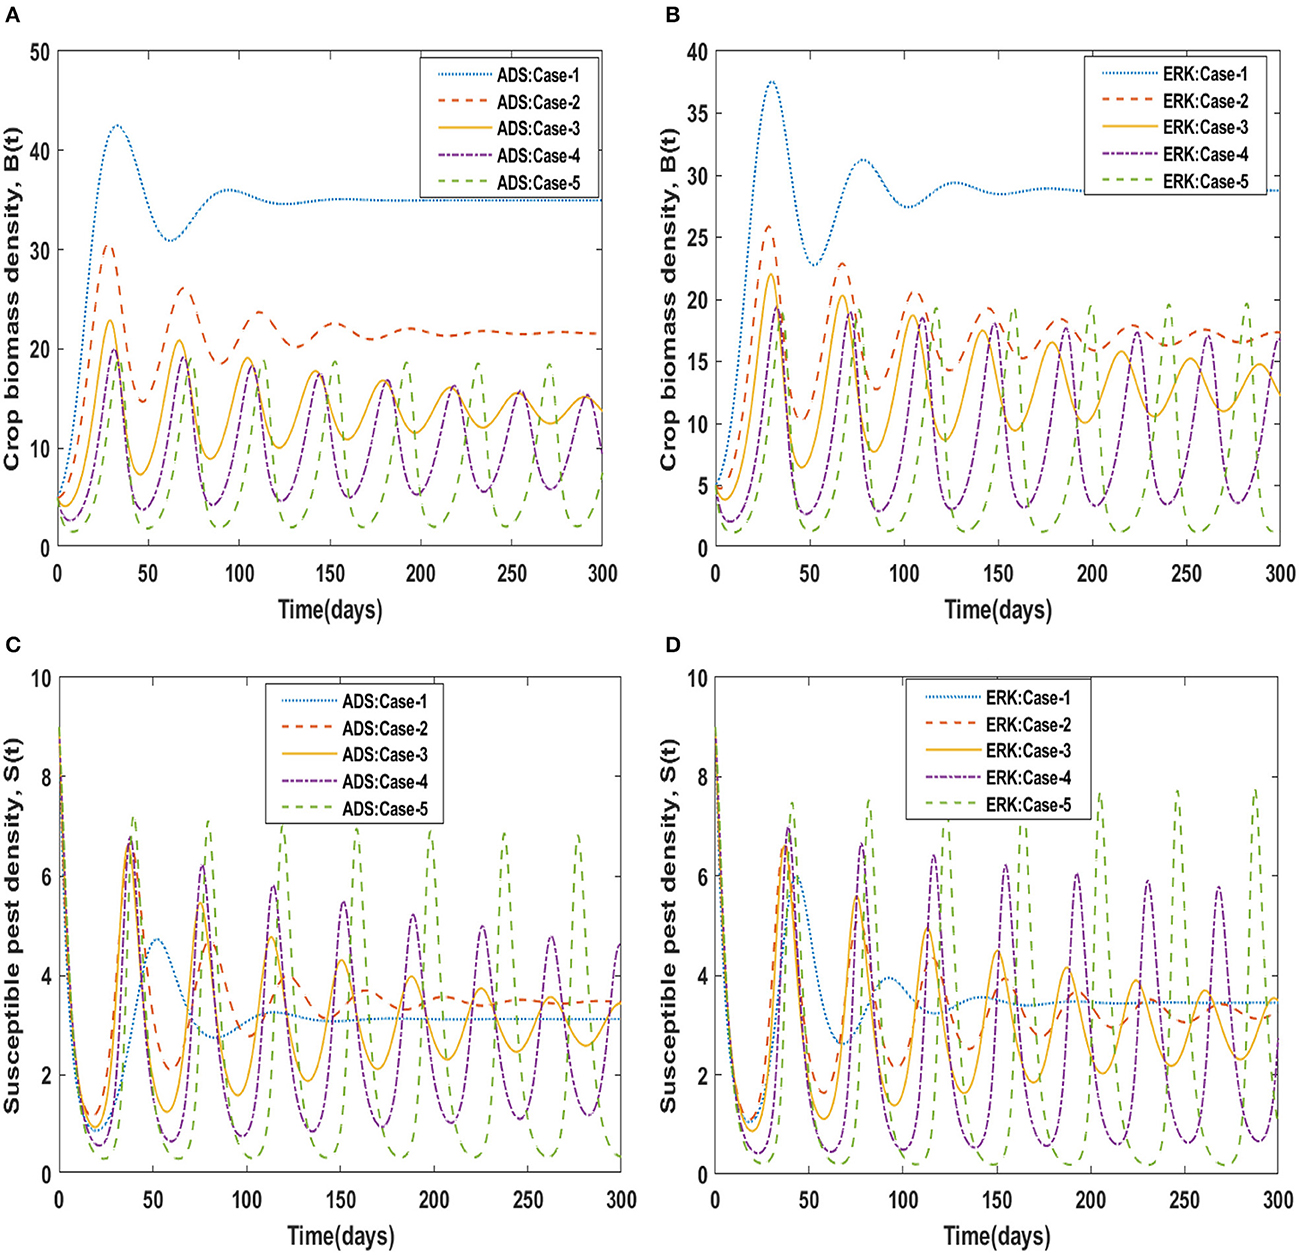
Figure 4. (A–D) Dynamics of B(t), S(t) for variation in δ by ADS and ERK solvers.
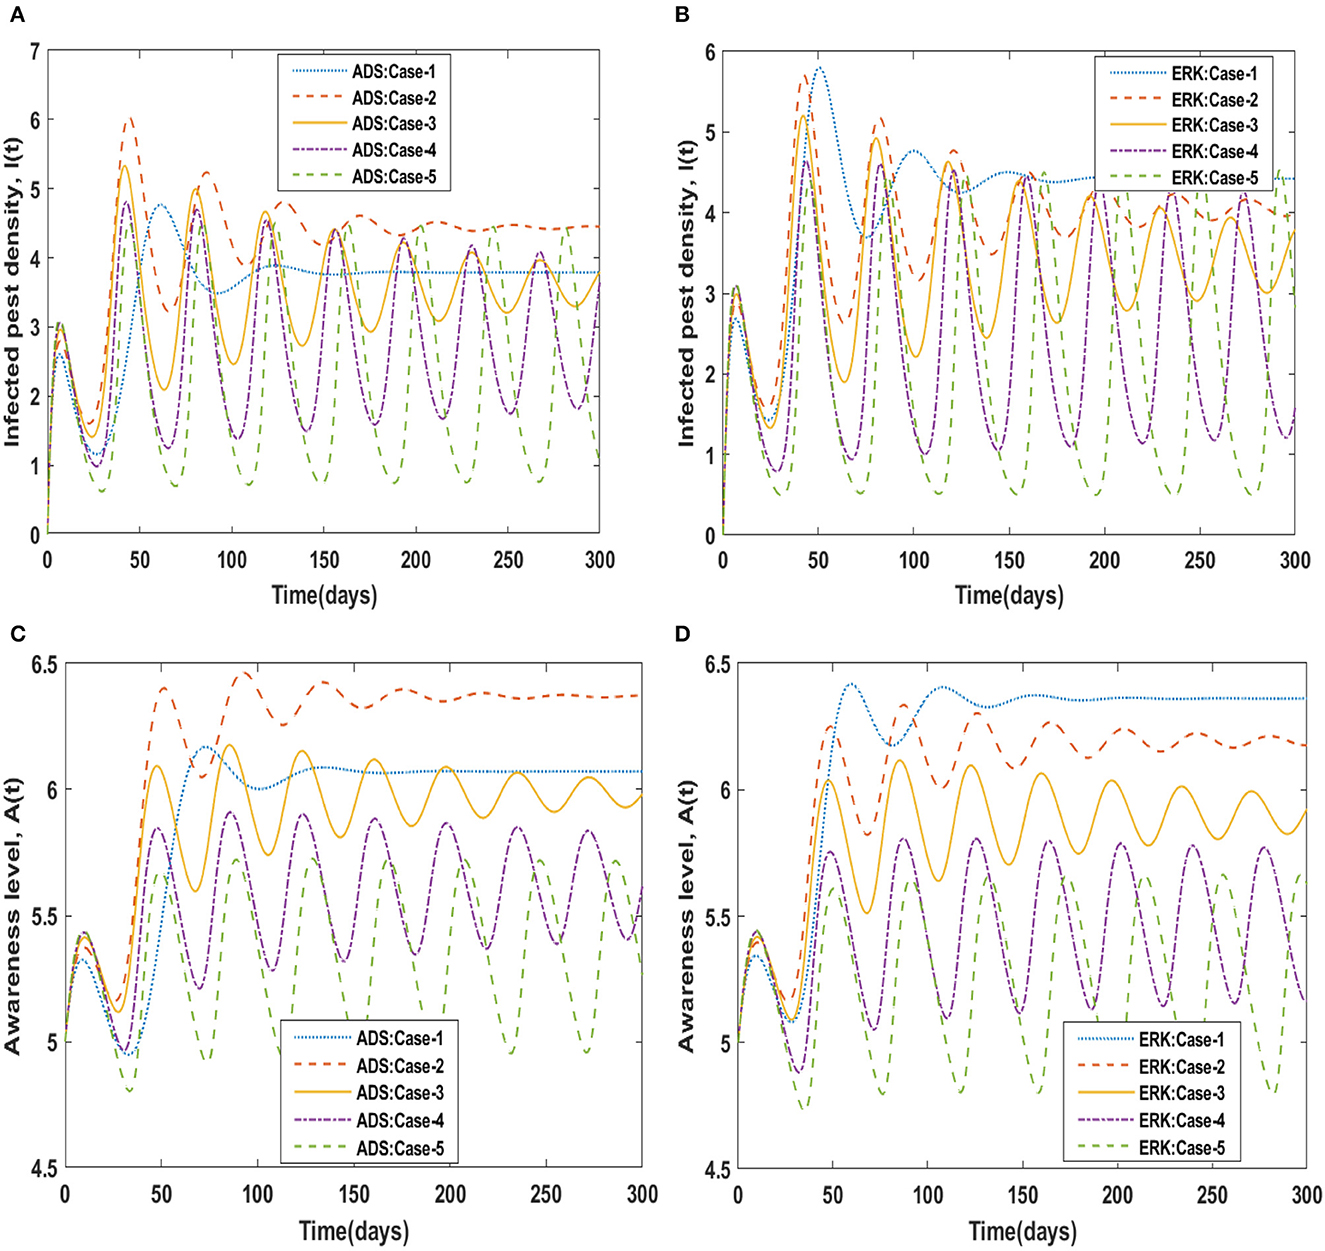
Figure 5. (A–D) Dynamics of I(t), A(t) for variation in δ by ADS and ERK solvers.
Susceptible pest density demonstrated oscillatory behavior from 0 to 150 days before returning to steady state behavior, whereas cases 2 to 5 exhibit oscillatory behavior with varying amplitudes from 0 to 300 days, as shown in Figures 4A, B. For compartment I(t) of the non-linear delayed CPM model, Figures 5A, B depict the effects of pest attacks rate. The graphs show that increasing the value of δ will result in decreasing the infected pest density. The impact of pest attacking rate, i.e., δ is also determined for compartment A(t) of the non-linear delayed CPM model. As seen in Figures 5C, D, the awareness level decreases as the value of pest attacks grow.
Similarly, for scenario 3 of non-linear delayed CPM model, the dynamics of the four compartments B(t), S(t), I(t), and A(t) are explored by varying the value of pest natural death rate i.e., c, which is represented by c and graphically portrayed in Figures 6, 7 respectively. The numerical solutions for compartments B(t), S(t), I(t), and A(t) for scenario 3, case-1 of the non-linear delayed model are computed and listed in Table 3. The influence of the pest's natural death rate on crop biomass density using the ADS and ERK numerical solvers respectively, is shown in Figures 6A, B. The effects of the pest natural death rate on the density of susceptible pests are shown in Figures 6C, D. It is noticed that the number of susceptible pests reduced as c increased. Figures 7A, B demonstrated how the density of infected pests decreases as the value of c rises. In Figures 7C, D, the level of people's awareness can be analyzed. It is worth noting that the larger value of the natural pest's death rate i.e., c, causes a decrease in people's awareness.
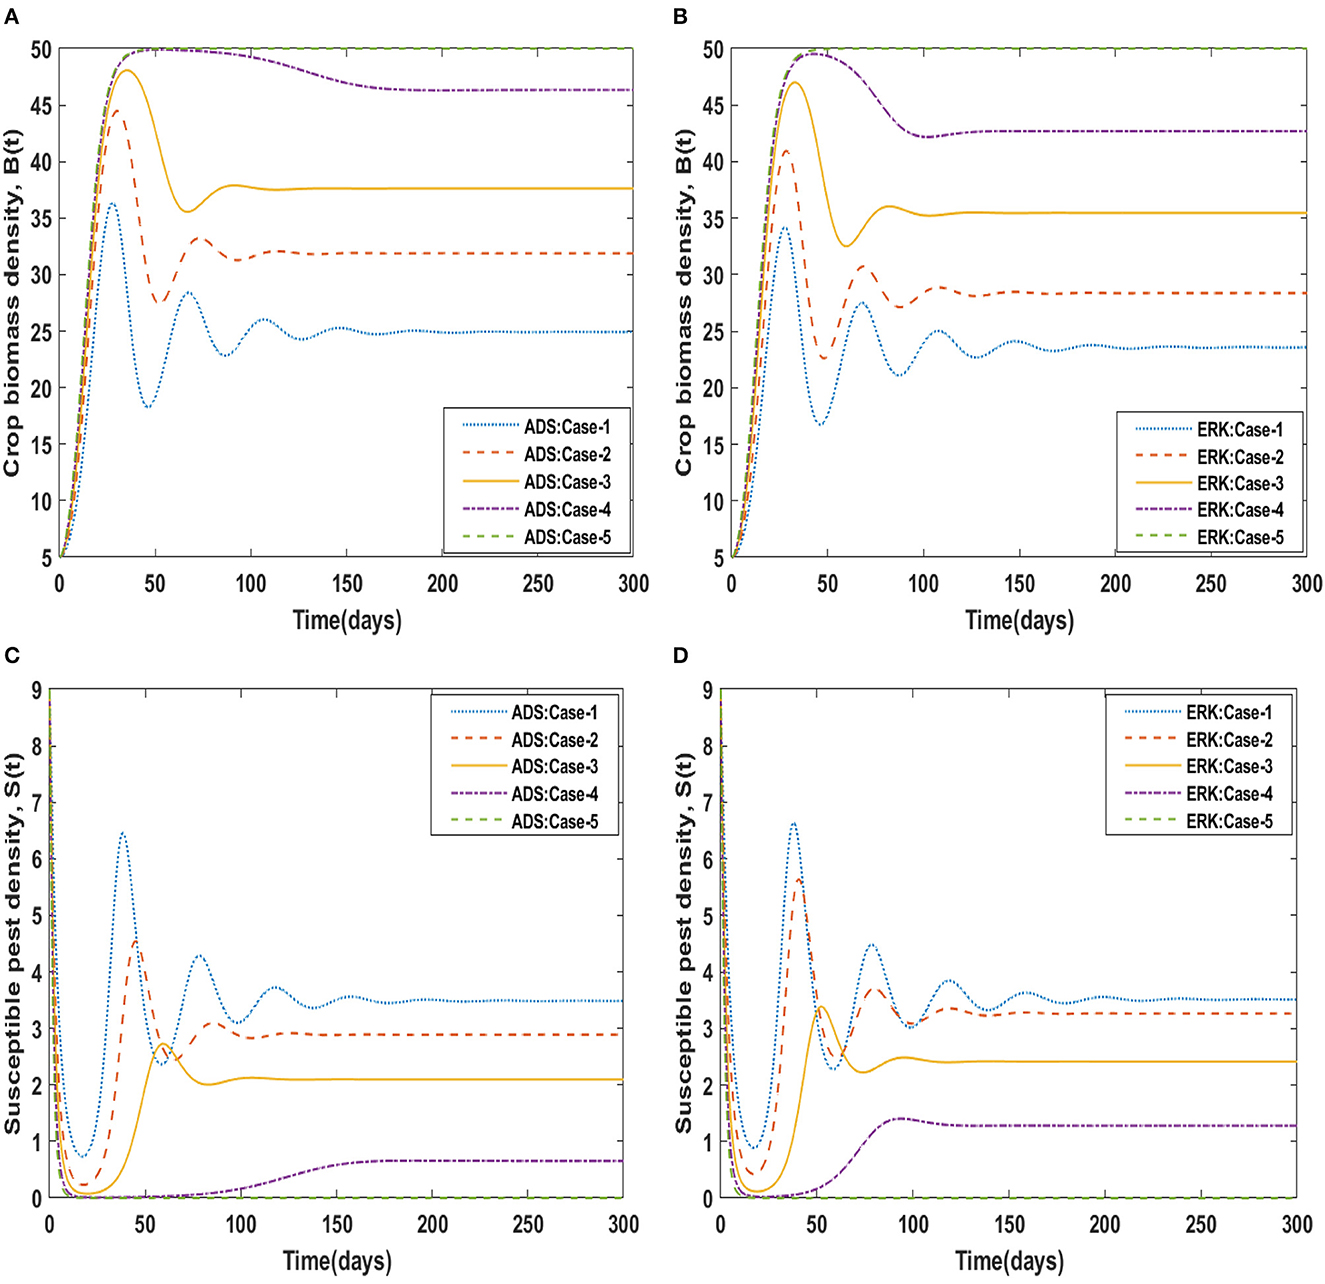
Figure 6. (A–D) Dynamics of B(t), S(t) for variation in c by ADS and ERK solvers.

Figure 7. (A–D) Dynamics of I(t), A(t) for variation in c by ADS and ERK solvers.
The dynamical behavior of the four compartments B(t), S(t), I(t), and A(t) for cases 1 to 5 of scenario 4 with the variability in disease associated death rate, i.e., β is analyzed and graphically portrayed in Figures 8, 9 respectively. The numerical solutions for scenario 4, case-1 of the non-linear delayed CPM model are calculated for all four classes B(t), S(t), I(t), and A(t) and presented in Table 4. The dynamics of crop biomass density are portrayed in Figures 8A, B exploiting the potential of the ADS and ERK numerical solvers for the variability in the disease associated death rate, i.e., β. It has been found that the crop biomass density falls as the value of β increases. Figures 8C, D show the effect of disease associated death rate on the density of susceptible pests. It is evident from Figure that raising the value of β would lead to a rise in the density of susceptible pests. The behavior of infected pest density for the variation in disease associated death rate is shown in Figures 9A, B. As the value of β is raised, it may be observed that the density of infected pests will decrease. Figures 9C, D show the impact of disease associated death rate against awareness level in people. The graphical representation presented that increasing the value of β causes the awareness level to decrease.
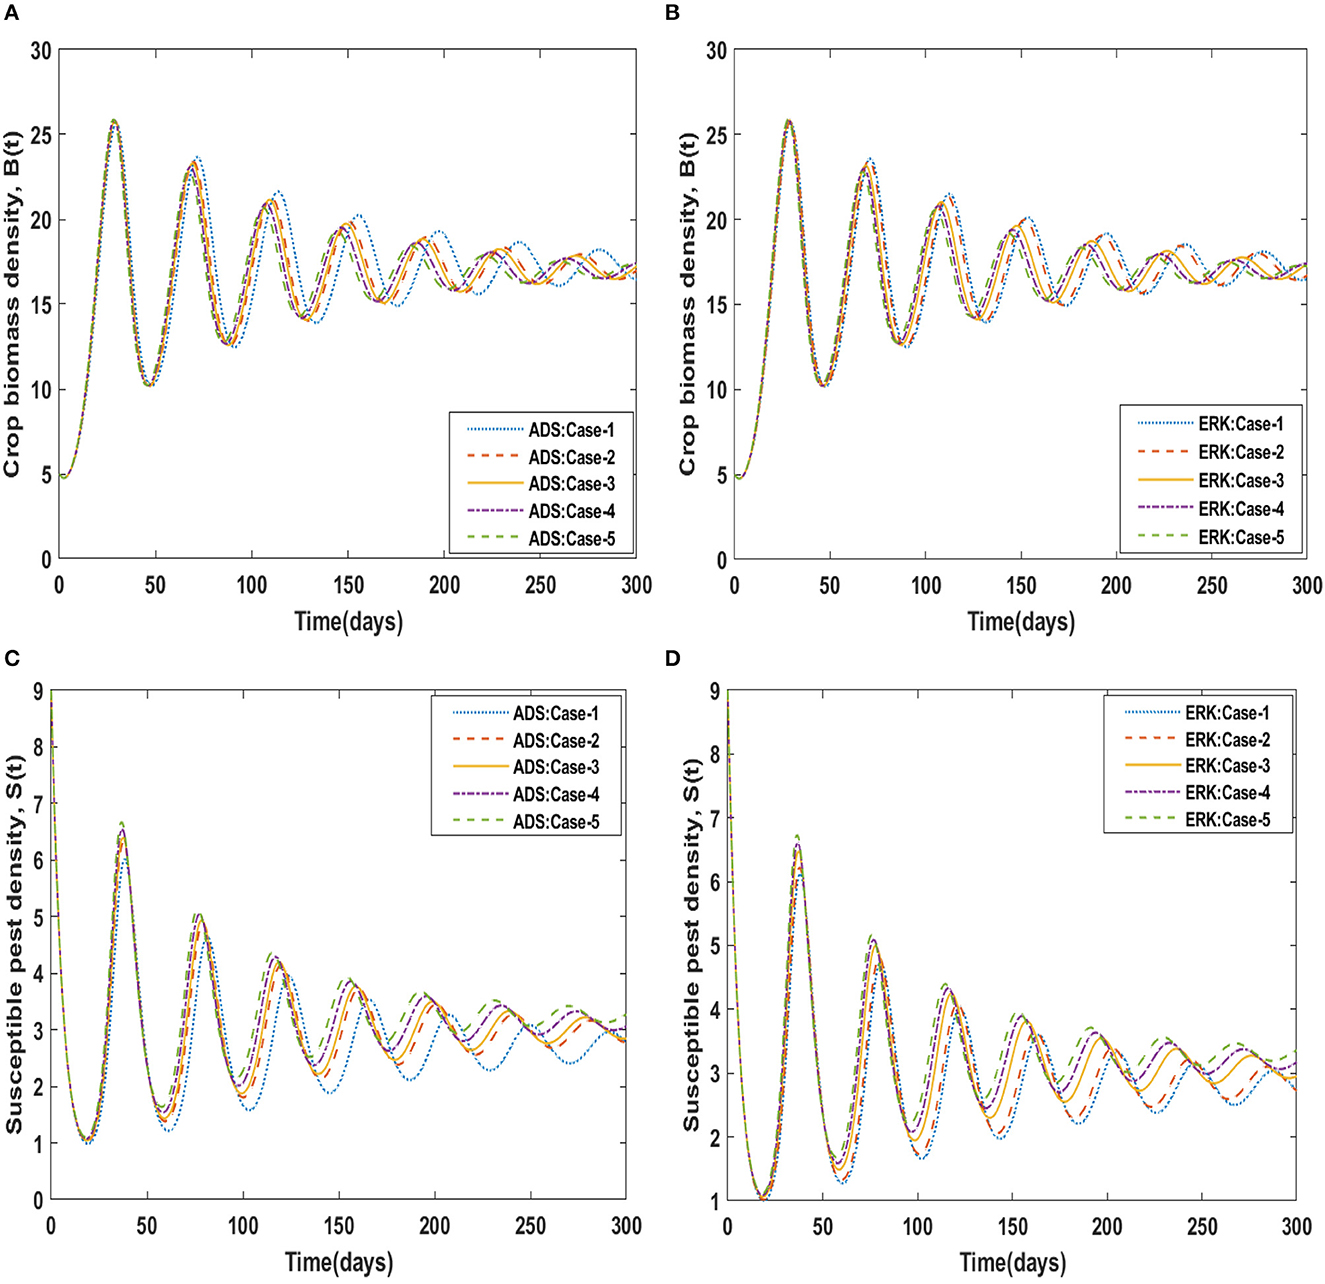
Figure 8. (A–D) Dynamics of B(t), S(t) for variation in β by ADS and ERK solvers.
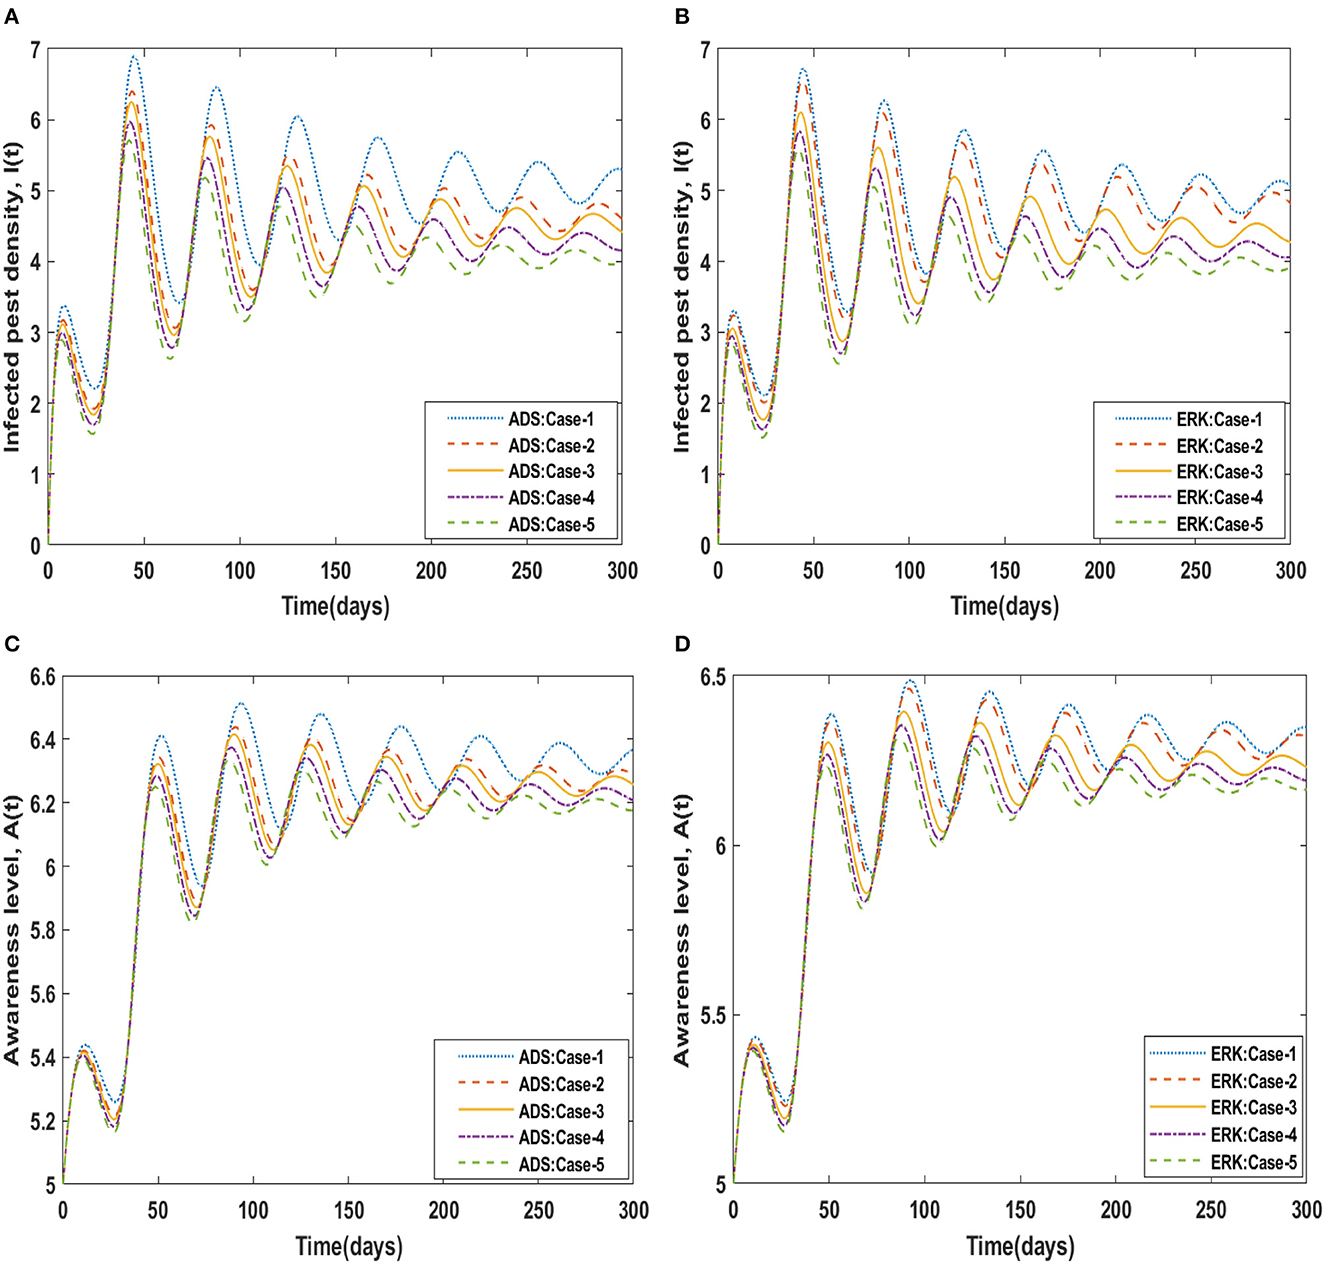
Figure 9. (A–D) Dynamics of I(t), A(t) for variation in β by ADS and ERK solvers.
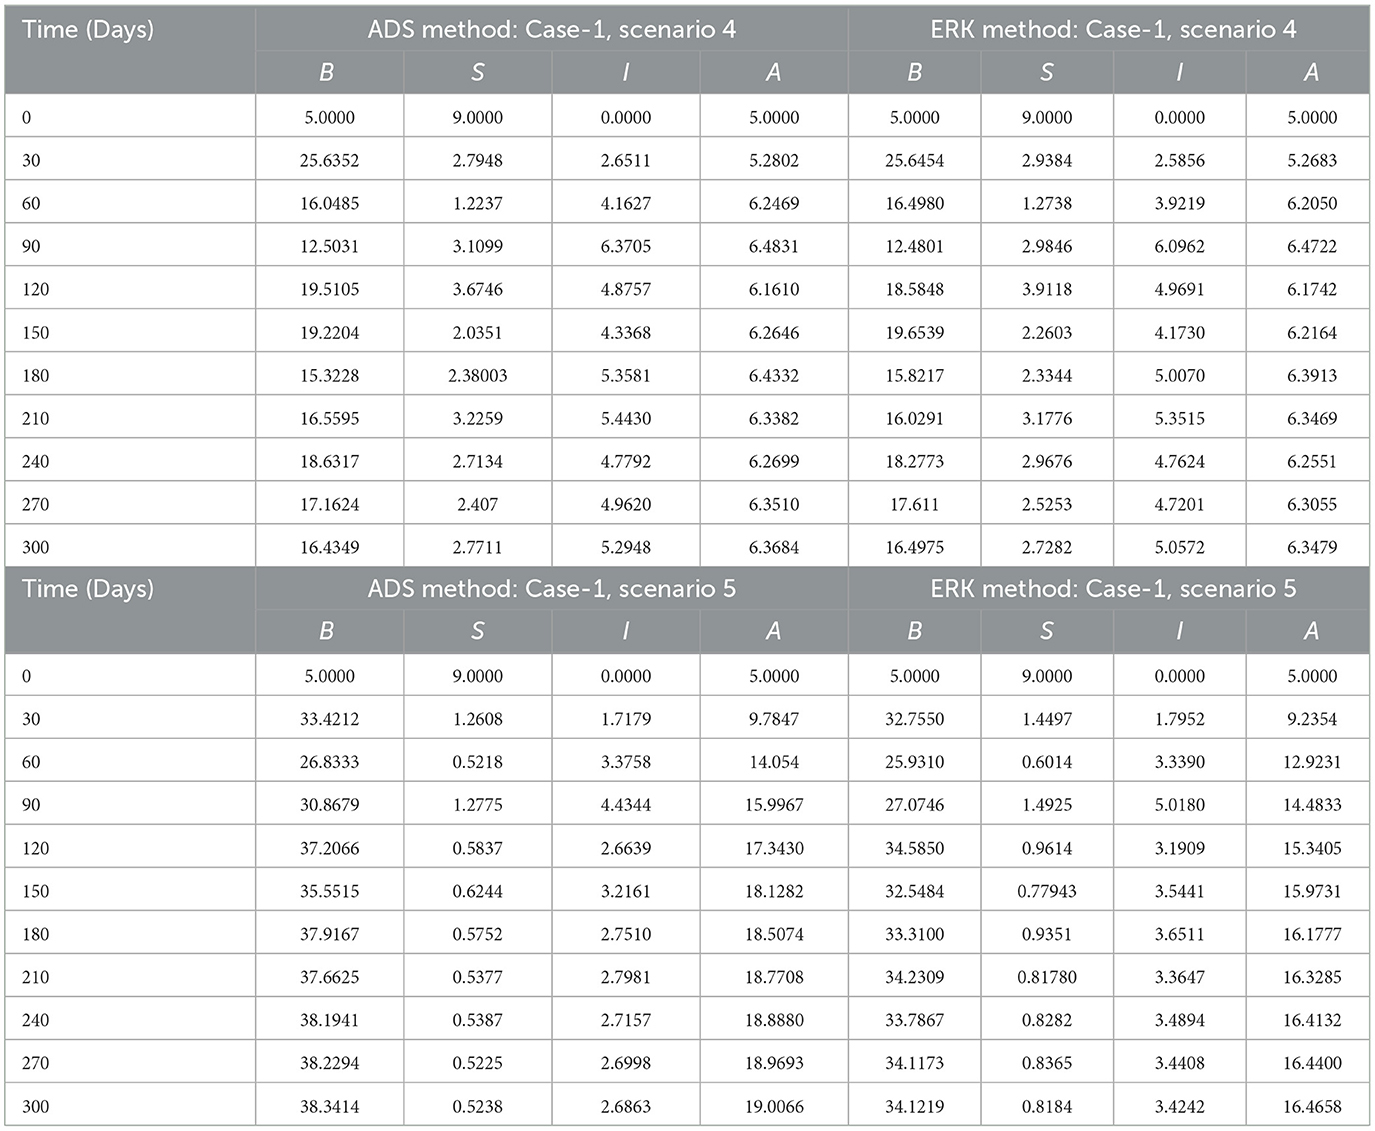
Table 4. Numerical solutions of non-linear delayed CPM model.
Using the strength of ADS and ERK numerical solvers, the dynamics for memory loss of aware people, i.e., υ , are investigated for all four compartments B(t), S(t), I(t), and A(t) for scenario 5, cases 1 to 5 of the non-linear delayed CPM model. The numerical outcomes of all four compartments B(t), S(t), I(t), and A(t) for case-1 of scenario 5 are provided in Table 4. The behavior of crop biomass density for the varying values of υ is depicted in Figures 10A, B, and it can be observed that crop biomass density decreases for higher values of υ. Figures 10C, D illustrated how the density of susceptible pests increases as the value of υ increases. Figures 11A, B show the dynamics of infected pest density for the variation in memory loss of aware people, i.e., υ. One may witness that the density of infected pests increases continuously in the first three cases, for υ = 0.01, 0.02, and 0.03, and then decreases again in the subsequent two cases, for υ = 0.04, and 0.05, in the interval of 0 to 300 days. Consequently, the density of infected pests shows varied behavior for different values of υ. Figures 11C, D portrayed the effect of memory loss in aware people, i.e., υ on awareness level compartment A(t). It is clearly noticed from Figures 11C, D that the awareness level is decreased as the value υis increased.
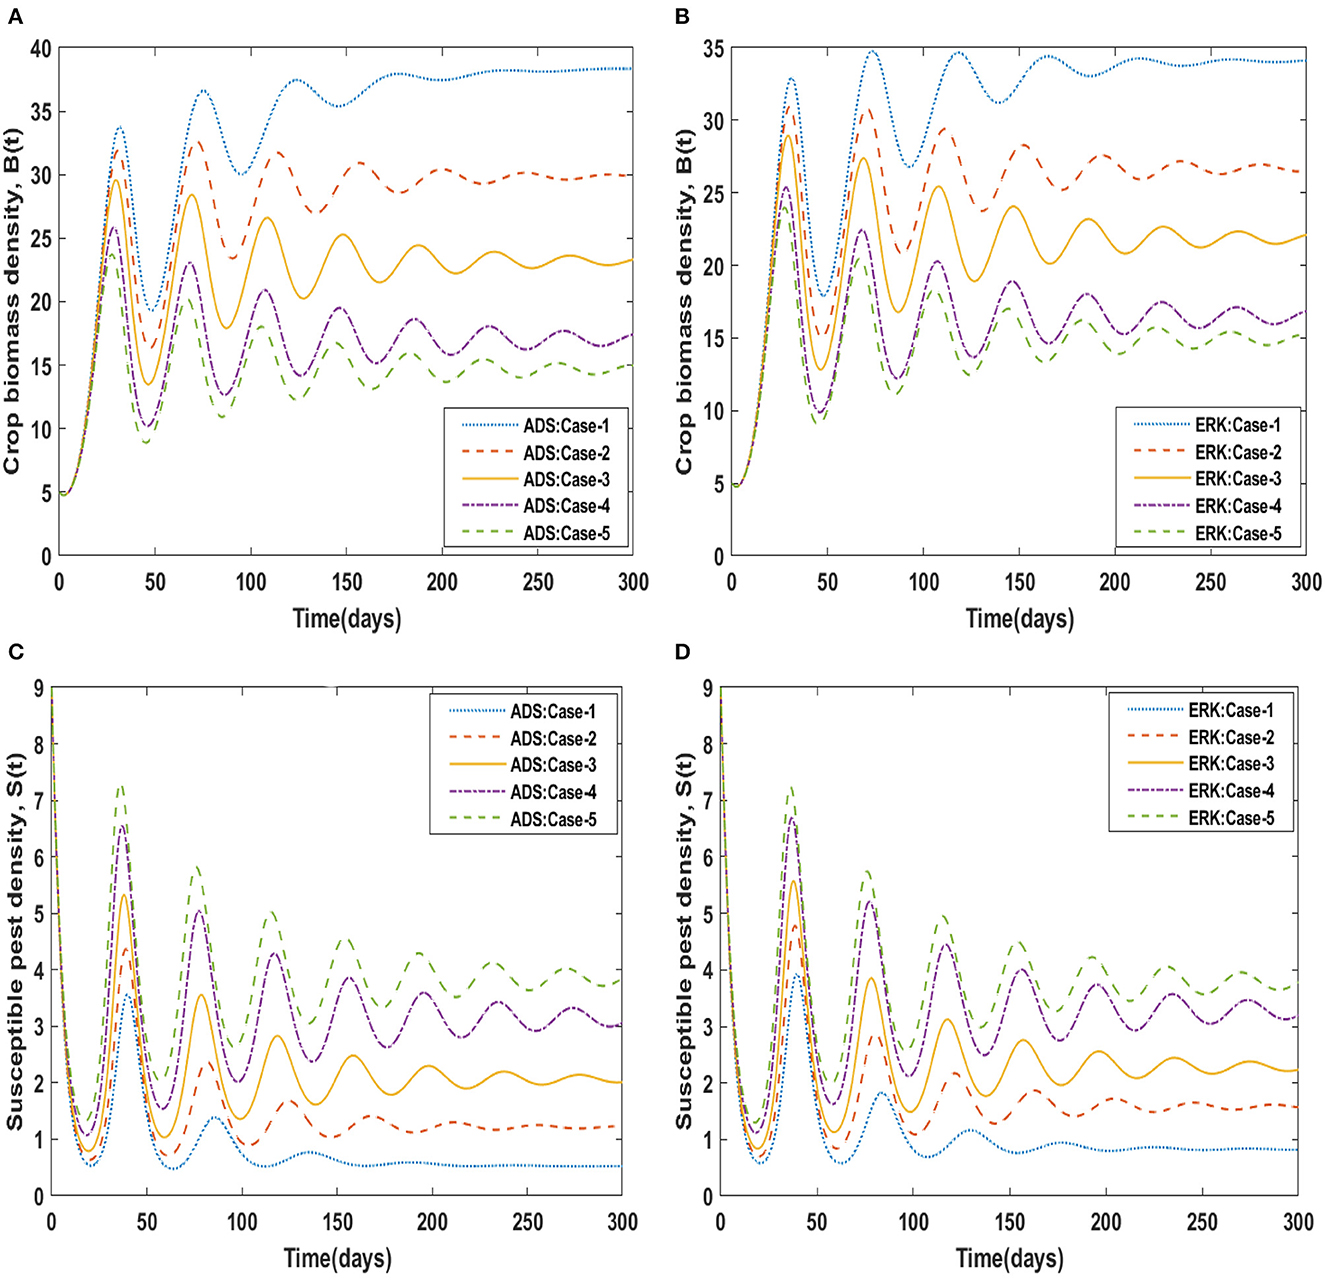
Figure 10. (A–D) Dynamics of B(t), S(t) for variation in υ by ADS and ERK solvers.
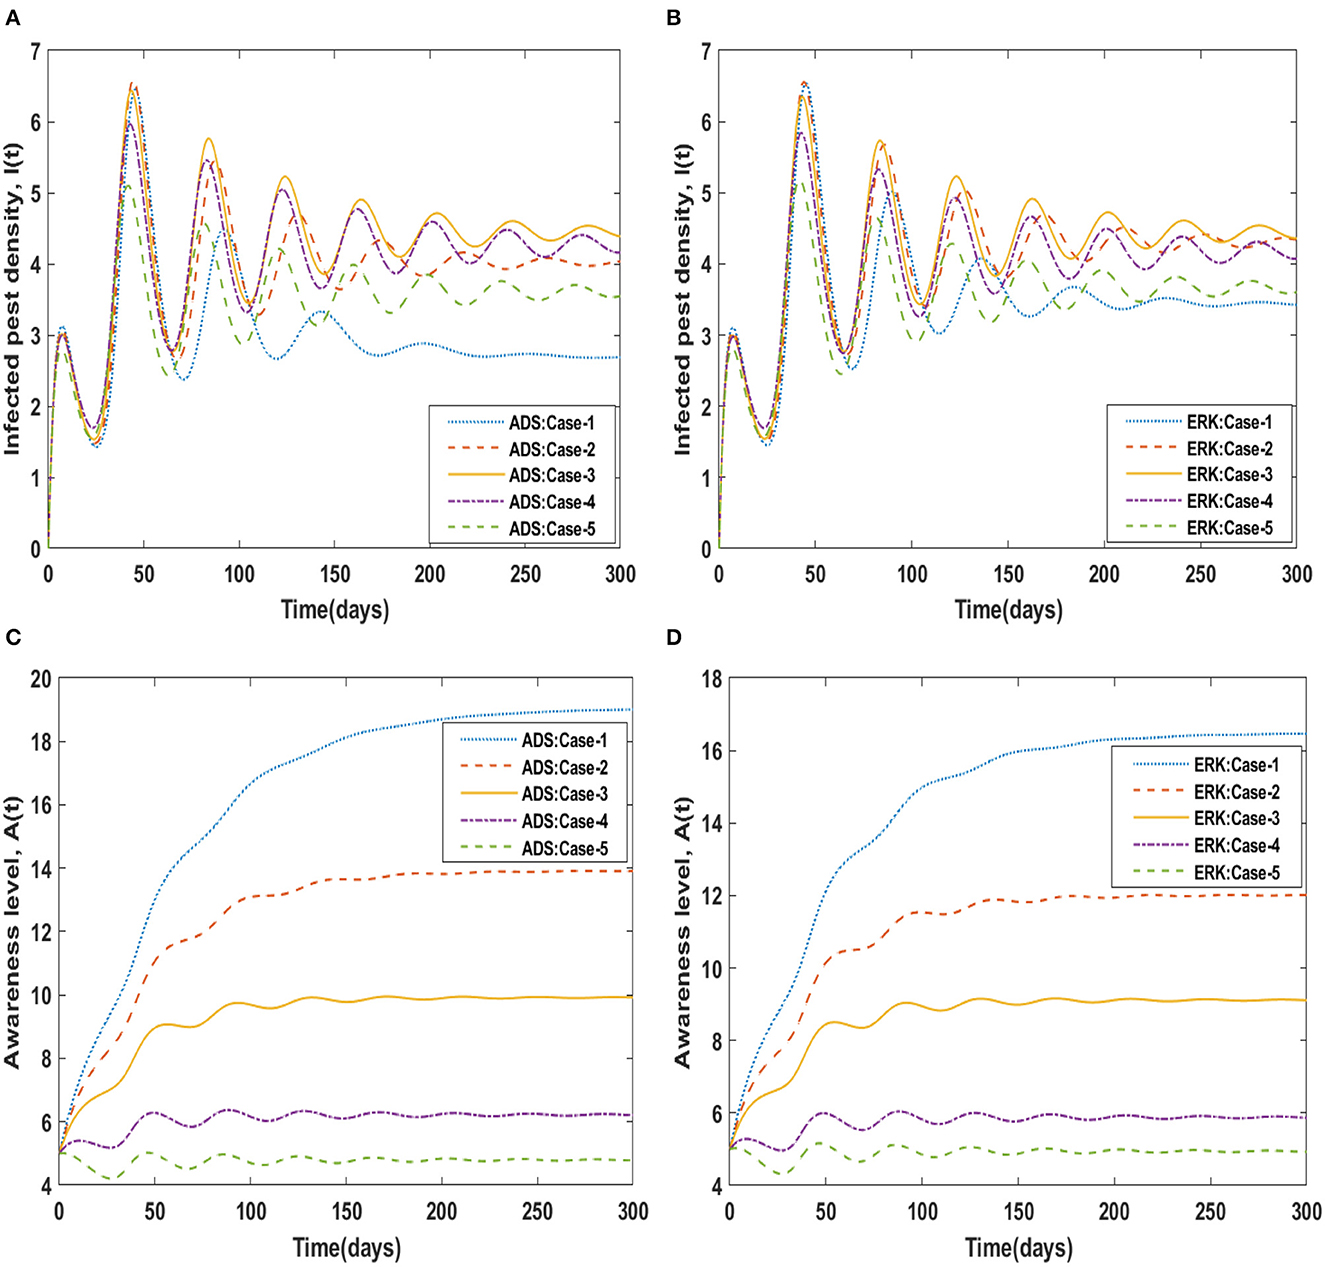
Figure 11. (A–D) Dynamics of I(t), A(t) for variation in υ by ADS and ERK solvers.
5. Conclusions
In this research, the numerical approximate solution of the non-linear delayed CPM system supervised by ODEs is investigated effectively to portray the dynamic impacts of unforeseen interactions between crops and pests, rehabilitation strategies, and environmental factors across time. Based on the presented model, the dynamic nature of crop biomass density [B(t)], susceptible pest density [S(t)], infected pest density [I(t)] and awareness level of the population [A(t)] may be forecasted effectively. Analysis based on the approximate numerical outcomes as well as graphic interpretations of the non-linear delayed CPM model is carried out by means of sundry scenarios by varying the different parameters utilized in the model. The approximate numerical solution of the non-linear delayed CPM model is computed by exploiting the state-of-the-art Adams (ADS) and explicit Runge–Kutta (ERK) numerical techniques. Compared with real-time models, delayed models exhibit greater realism because they take into account the interval between contact and infection. As delay affects processes along with dynamics, mathematically it impacts stability. This analysis can help to create predictive models for upcoming outbreaks and shed light on the efficacy of various pest management techniques. The numerical analysis that is being given makes it possible to optimize pest control tactics, analyze risks, educate people, and pursue continual improvement. It is essential for improving agricultural methods, reducing crop losses, and advancing environmentally friendly pest control strategies.
In the future, soft computing approaches based on artificial intelligence algorithms may be used to study the dynamics of epidemic models and other non-linear systems [68–73].
Data availability statement
The original contributions presented in the study are included in the article/supplementary material, further inquiries can be directed to the corresponding author.
Author contributions
Conceptualization, methodology, and writing—review and editing: NA and MR. Software: AK. Validation: MR. Formal analysis: MS and MR. Investigation: IA. Writing—original draft preparation: NA. Visualization: NA and MS. Project administration: AK and IA. All authors have read and agreed to the published version of the manuscript.
Conflict of interest
The authors declare that the research was conducted in the absence of any commercial or financial relationships that could be construed as a potential conflict of interest.
Publisher's note
All claims expressed in this article are solely those of the authors and do not necessarily represent those of their affiliated organizations, or those of the publisher, the editors and the reviewers. Any product that may be evaluated in this article, or claim that may be made by its manufacturer, is not guaranteed or endorsed by the publisher.
Abbreviations
IPM, Integrated Pest Management; ERK, Explicit Runge-Kutta; MD, Mating disruption; TV, Television; ODEs, Ordinary differential equations; HIV, Human immunodeficiency virus; COVID-19, coronavirus disease of 2019; ADS, Adams method; CPS, Crop pest management; B(t), S(t), I(t), A(t), Crop biomass density, Susceptible density, Infected density, Aware people density; B0, S0, I0 and A0, Initial conditions for B, S, I and A; NDSolve, Numerical solution of differential equations; α, Crop biomass growth rate; N, Maximum crop biomass percentage; δ, Rate of pest attacks; c, Pest natural death; β, Disease associated death rate; l, Aware individuals' activity level; d, Growth rate of aware individuals; υ, Memory loss of aware people; A0, Awareness level from a widespread source; τ, Delay in time.
References
1. Bhattacharyya S, Bhattacharya DK. Pest control through viral disease: mathematical modeling and analysis. J Theor Biol. (2006) 238:177–97. doi: 10.1016/j.jtbi.2005.05.019
2. Verma D, Banjo T, Chawan M, Teli N, Gavankar R. Microbial Control of Pests and Weeds. Natural Remedies for Pest, Disease and Weed Control. New York, NY: Academic Press, 119–26 (2020).
3. Deebani W, Jan R, Shah Z, Vrinceanu N, Racheriu M. Modeling the transmission phenomena of water-borne disease with non-singular and non-local kernel. Comput Methods Biomech Biomed Engin. (2022) 26: 1–14. doi: 10.1080/10255842.2022.2114793
4. Baker BP, Green TA, Loker AJ. Biological control and integrated pest management in organic and conventional systems. Biol Control. (2020) 140:104095. doi: 10.1016/j.biocontrol.2019.104095
5. Kansiime MK, Alawy A, Allen C, Subharwal M, Jadhav A, Parr M, et al. Effectiveness of mobile agri-advisory service extension model: evidence from direct2farm program in India. World Dev Persp. (2019) 13:25–33. doi: 10.1016/j.wdp.2019.02.007
6. Al Basir FAHAD, Samanta S, Tiwari PK. Bistability, generalized and zero-hopf bifurcations in a pest control model with farming awareness. J Biol Syst. (2023) 31:115–40. doi: 10.1142/S0218339023500079
7. Alshemmari H, Al-Shareedah AE, Rajagopalan S, Talebi LA, Hajeyah M. Pesticides driven pollution in Kuwait: the first evidence of environmental exposure to pesticides in soils and human health risk assessment. Chemosphere. (2021) 273:129688. doi: 10.1016/j.chemosphere.2021.129688
8. Tripathi S, Shah KK, Tiwari I, Shrestha J. Farmers' perception about major insect pests of cucurbits and their management. Indo J Agric Res. (2020) 3:153–70. doi: 10.32734/injar.v3i3.4414
9. Sinan M, Shah K, Kumam P, Mahariq I, Ansari KJ, Ahmad Z, et al. Fractional order mathematical modeling of typhoid fever disease. Results Phys. (2022) 32:105044. doi: 10.1016/j.rinp.2021.105044
10. Mutimawurugo MC, Wagara IN, Muhinyuza JB, Ogweno JO. Virulence and characterization of isolates of potato bacterial wilt caused by Ralstonia solanacearum (Smith) in Rwanda. Afr J Agric Res. (2019) 14:311–20. doi: 10.5897/AJAR2018.13686
11. Nešić K, Habschied K, Mastanjević K. Possibilities for the biological control of mycotoxins in food and feed. Toxins. (2021) 13:198. doi: 10.3390/toxins13030198
12. Kumar A, Mishra AK, Saroj S, Joshi PK. Impact of traditional versus modern dairy value chains on food security: Evidence from India's dairy sector. Food Policy. (2019) 83:260–70. doi: 10.1016/j.foodpol.2019.01.010
13. Santoso T. The status of Oryctes rhinoceros Nudivirus (OrNV) infection in Oryctes rhinoceros (Coleoptera: Scarabaeidae) in Indonesia. J Oil Palm Res. (2020) 32:582–9.
14. Kuang Y. Delay Differential Equations: With Applications in Population Dynamics. New York, NY: Academic Press (1993). doi: 10.21894/jopr.2020.0041
16. Tian Y, He G, Liu Z, Zhong L, Yang X, Stanley HE, et al. The impact of memory effect on resonance behavior in a fractional oscillator with small time delay. Phys Stat Mech Appl. (2021) 563:125383. doi: 10.1016/j.physa.2020.125383
17. Arafa AA, Xu Y, Mahmoud GM. Chaos suppression via integrative time delay control. Int J Bifurc Chaos. (2020) 30:2050208. doi: 10.1142/S0218127420502089
18. Mahmoud GM, Arafa AA, Abed-Elhameed TM, Mahmoud EE. Chaos control of integer and fractional orders of chaotic Burke–Shaw system using time delayed feedback control. Chaos, Solitons Fractals. (2017) 104:680–92. doi: 10.1016/j.chaos.2017.09.023
19. Mahmoud GM, Arafa AA, Mahmoud EE. Bifurcations and chaos of time delay Lorenz system with dimension 2n+1. The Eur Phys J Plus. (2017) 132:1–20. doi: 10.1140/epjp/i2017-11739-6
20. Rihan FA, Arafa AA, Rakkiyappan R, Rajivganthi C, Xu Y. Fractional-order delay differential equations for the dynamics of hepatitis C virus infection with IFN-α treatment. Alexandria Eng J. (2021) 60:4761–74. doi: 10.1016/j.aej.2021.03.057
21. Smith HL. An Introduction to Delay Differential Equations With Applications to the Life Sciences. New York, NY: Springer (2011).
22. Hu D, Li Y, Liu M, Bai Y. Stability and Hopf bifurcation for a delayed predator–prey model with stage structure for prey and Ivlev-type functional response. Nonlinear Dyn. (2020) 99:3323–50. doi: 10.1007/s11071-020-05467-z
23. Du Y, Niu B, Wei J. Two delays induce Hopf bifurcation and double Hopf bifurcation in a diffusive Leslie-Gower predator-prey system. Chaos Interdis J Nonlin Sci. (2019) 29:013101. doi: 10.1063/1.5078814
24. Bajeux N, Ghosh B. Stability switching and hydra effect in a predator–prey meta population model. Biosystems. (2020) 198:104255. doi: 10.1016/j.biosystems.2020.104255
25. Duan D, Fan Q, Guo Y. Hopf bifurcation analysis in a neutral predator–prey model with age structure in prey. Electr J Q Theor Diff Eq. (2019) 2019:1–13. doi: 10.14232/ejqtde.2019.1.30
26. Li Z, Dai B. Stability and Hopf bifurcation analysis in a Lotka–Volterra competition–diffusion–advection model with time delay effect. Nonlinearity. (2021) 34:3271. doi: 10.1088/1361-6544/abe77a
27. Daudi S, Luboobi L, Kgosimore M, Kuznetsov D, Mushayabasa S. A mathematical model for fall armyworm management on maize biomass. Adv Diff Eq. (2021) 2021:1–27. doi: 10.1186/s13662-021-03256-5
28. Li J, Huang Q, Liu B. A pest control model with birth pulse and residual and delay effects of pesticides. Adv Diff Eq. (2019) 2019:1–16. doi: 10.1186/s13662-019-1978-7
29. Xiang S, Pei Y, Liang X. Analysis and optimization based on a sex pheromone and pesticide pest model with gestation delay. Int J Biomathematic. (2019) 12:1950054. doi: 10.1142/S1793524519500542
30. Liu S, Huang M, Wang J. Bifurcation control of a delayed fractional Mosaic disease model for Jatropha curcas with farming awareness. Complexity. (2020) 2020:16. doi: 10.1155/2020/2380451
31. Kumari V, Chauhan S, Dhar J. Controlling pest by integrated pest management: a dynamical approach. Int J Mathemati Eng Manag Sci. (2020) 5:769. doi: 10.33889/IJMEMS.2020.5.4.061
32. Shi Z, Li Y, Cheng H. Dynamic analysis of a pest management smith model with impulsive state feedback control and continuous delay. Mathematics. (2019) 7:591. doi: 10.3390/math7070591
33. Arafa AA, Hamdallah SA, Tang S, Xu Y, Mahmoud GM. Dynamics analysis of a Filippov pest control model with time delay. Commun Nonlinear Sci Num Simulation. (2021) 101:105865. doi: 10.1016/j.cnsns.2021.105865
34. Al Basir F, Elaiw AM, Ray S. Effect of time delay in controlling crop pest using farming awareness. Int J Appl Comput Mathematic. (2019) 5:1–19. doi: 10.1007/s40819-019-0693-0
35. Allen-Perkins A, Estrada E. Mathematical modelling for sustainable aphid control in agriculture via intercropping. Proc Royal Soc A. (2019) 475:20190136. doi: 10.1098/rspa.2019.0136
36. Abraha T, Al Basir F, Obsu LL, Torres DF. Pest control using farming awareness: Impact of time delays and optimal use of biopesticides. Chaos Soliton Fractals. (2021) 146:110869. doi: 10.1016/j.chaos.2021.110869
37. Rossini L, Contarini M, Severini M, Speranza S. Reformulation of the Distributed Delay Model to describe insect pest populations using count variables. Ecol Modell. (2020) 436:109286. doi: 10.1016/j.ecolmodel.2020.109286
38. Al Basir F, Banerjee A, Ray S. Role of farming awareness in crop pest management-A mathematical model. J Theor Biol. (2019) 461:59–67. doi: 10.1016/j.jtbi.2018.10.043
39. Rahman MU, Arfan M, Shah Z, Kumam P, Shutaywi M. Nonlinear fractional mathematical model of tuberculosis (TB) disease with incomplete treatment under Atangana-Baleanu derivative. Alexandria Eng J. (2021) 60:2845–56. doi: 10.1016/j.aej.2021.01.015
40. Banu MS, Raju I, Mondal S. A comparative study on classical fourth order and butcher sixth order Runge–Kutta methods with initial and boundary value problems. Int J Mat Math Sci. (2021) 3:8–21. doi: 10.34104/ijmms.021.08021
41. Tang TQ, Shah Z, Jan R, Alzahrani E. Modeling the dynamics of tumor–immune cells interactions via fractional calculus. Eur Phys J Plus. (2022) 137:367. doi: 10.1140/epjp/s13360-022-02591-0
42. Kafle J, Thakur BK, Acharya G. Formulative visualization of numerical methods for solving non-linear ordinary differential equations. Nepal J Mathematic Sci. (2021) 2:79–88. doi: 10.3126/njmathsci.v2i2.40126
43. Tang TQ, Jan R, Bonyah E, Shah Z, Alzahrani E. Qualitative analysis of the transmission dynamics of dengue with the effect of memory, reinfection, and vaccination. Comput Mathemati Methods Med. (2022) 12:70. doi: 10.1155/2022/7893570
44. Shah Z, Jan R, Kumam P, Deebani W, Shutaywi M. Fractional dynamics of HIV with source term for the supply of new CD4+ T-cells depending on the viral load via Caputo–Fabrizio derivative. Molecules. (2021) 26:1806. doi: 10.3390/molecules26061806
45. Shoaib M, Raja MAZ, Sabir MT, Bukhari AH, Alrabaiah H, Shah Z, et al. A stochastic numerical analysis based on hybrid NAR-RBFs networks nonlinear SITR model for novel COVID-19 dynamics. Comput Methods Programs Biomed. (2021) 202:105973. doi: 10.1016/j.cmpb.2021.105973
46. Anwar N, Ahmad I, Raja MAZ, Naz S, Shoaib M, Kiani AK, et al. Artificial intelligence knacks-based stochastic paradigm to study the dynamics of plant virus propagation model with impact of seasonality and delays. Eur Phys J Plus. (2022) 137:144. doi: 10.1140/epjp/s13360-021-02248-4
47. Fatmawati MAK, Bonyah E, Hammouch Z, Shaiful EM. A mathematical model of tuberculosis (TB) transmission with children and adults groups: a fractional model. Aims Math. (2020) 5:2813–42. doi: 10.3934/math.2020181
48. Anwar N, Ahmad I, Kiani AK, Naz S, Shoaib M, Raja MAZ, et al. Intelligent predictive stochastic computing for nonlinear differential delay computer virus model. Waves Random Complex Media. (2022) 21:1–29. doi: 10.1080/17455030.2022.2155327
49. Städter P, Schälte Y, Schmiester L, Hasenauer J, Stapor PL. Benchmarking of numerical integration methods for ODE models of biological systems. Sci Rep. (2021) 11:1–11. doi: 10.1038/s41598-021-82196-2
50. Tang TQ, Jan R, Ur Rehman Z, Shah Z, Vrinceanu N, Racheriu M, et al. Modeling the dynamics of chronic myelogenous leukemia through fractional-calculus. Fractals. (2022) 30:2240262. doi: 10.1142/S0218348X22402629
51. Rong B, Rui X, Tao L, Wang G. Theoretical modeling and numerical solution methods for flexible multibody system dynamics. Nonlinear Dyn. (2019) 98:1519–53. doi: 10.1007/s11071-019-05191-3
52. Zhao J, Zhan R, Xu Y. Explicit exponential Runge–Kutta methods for semilinear parabolic delay differential equations. Math Comput Simul. (2020) 178:366–81. doi: 10.1016/j.matcom.2020.06.025
53. Shaalini JV, Pushpam AEK. Analysis of composite Runge Kutta methods and new one-step technique for stiff delay differential equations. IAENG Int J Appl Mathematics. (2019) 49:1–10. Available online at: https://api.semanticscholar.org/CorpusID:211543850
54. Bharathi DP, Jayakumar T, Vinoth S. Numerical solution of fuzzy mixed delay differential equations via Runge–Kutta method of order four. Intervals. (2019) 1:1–9. doi: 10.5890/DNC.2021.03.006
55. Senu N, Lee KC, Ahmadian A, Ibrahim SNI. Numerical solution of delay differential equation using two-derivative Runge–Kutta type method with Newton interpolation. Alexandria Eng J. (2022) 61:5819–35. doi: 10.1016/j.aej.2021.11.009
56. Hu X, Cong Y, Hu GD. Delay-dependent stability of Runge–Kutta methods for linear delay differential–algebraic equations. J Comput Appl Math. (2020) 363:300–11. doi: 10.1016/j.cam.2019.06.016
57. Khodabandehlo HR, Shivanian E, Abbasbandy S. Numerical solution of nonlinear delay differential equations of fractional variable-order using a novel shifted Jacobi operational matrix. Eng Comput. (2021) 32:1–15. doi: 10.1007/s00366-021-01422-7
58. Raja MA, Sabati M, Parveen N, Awais M, Awan SE. Integrated intelligent computing application for effectiveness of Au nanoparticles coated over MWCNTs with velocity slip in curved channel peristaltic flow. Sci Rep. (2021) 11:1–20. doi: 10.1038/s41598-021-98490-y
59. Cheema TN, Raja MA, Ahmad I, Naz S, Ilyas H. Intelligent computing with Levenberg–Marquardt artificial neural networks for nonlinear system of COVID-19 epidemic model for future generation disease control. Eur Phys J Plus. 135:1–35. doi: 10.1140/epjp/s13360-020-00910-x
60. Uddin I, Ullah I, Raja MAZ, Shoaib M, Islam S, Zobaer MS, et al. The intelligent networks for double-diffusion and MHD analysis of thin film flow over a stretched surface. Sci Rep. (2021) 11:1–20. doi: 10.1038/s41598-021-97458-2
61. Khan BA, Nadeem MA, Nawaz H, Amin MM, Abbasi GH, Nadeem M, et al. Pesticides: Impacts on Agriculture Productivity, Environment, and Management Strategies. Emerging Contaminants and Plants: Interactions, Adaptations and Remediation Technologies. Cham: Springer International Publishing (2023), 109–34.
62. Al Basir F, Adhurya S, Ray S. Impact of periodic farming awareness campaign through media for crop pest control management. Adv Mathemat Comput Model Eng Systems. (2023) 143:1–21. doi: 10.1201/9781003367420-6
63. Anwar N, Naz S, Shoaib M. Reliable numerical treatment with Adams and BDF methods for plant virus propagation model by vector with impact of time lag and density. Front Appl Mathematic Stat. (2022) 8:1001392. doi: 10.3389/fams.2022.1001392
64. Anwar N, Ahmad I, Kiani AK, Shoaib M, Raja MAZ. Intelligent solution predictive networks for non-linear tumor-immune delayed model. Comput Methods Biomech Biomed Engin. (2023) 25:1–28. doi: 10.1080/10255842.2023.2227751
65. Azizan FL, Sathasivam S, Velavan M, Azri NR, Manaf NIRA. Prediction of drug concentration in human bloodstream using Adams-Bashforth-Moulton method. J Adv Res Appl Sci Eng Technol. (2023) 29:53–71. doi: 10.37934/araset.29.2.5371
66. Citro V, D'Ambrosio R, Di Giovacchino S. A-stability preserving perturbation of Runge–Kutta methods for stochastic differential equations. Appl Math Lett. (2020) 102:106098. doi: 10.1016/j.aml.2019.106098
67. Shoaib M, Anwar N, Ahmad I, Naz S, Kiani AK, Raja MAZ, et al. Neuro-computational intelligence for numerical treatment of multiple delays SEIR model of worms propagation in wireless sensor networks. Biomed Signal Process Control. (2023) 84:104797. doi: 10.1016/j.bspc.2023.104797
68. Attia IM. Novel approach of multistate Markov chains to evaluate progression in the expanded model of non-alcoholic fatty liver disease. Front Appl Mathematic Statistics. (2022) 7:92. doi: 10.3389/fams.2021.766085
69. Lasri Doukkali A, Lorenzi T, Parcell BJ, Rohn JL, Bowness R. A hybrid individual-based mathematical model to study bladder infections. Front Appl Mathematic Stat. (2023) 5:1090334. doi: 10.3389/fams.2023.1090334
70. Netshikweta R, Garira W. A nested multiscale model to study paratuberculosis in ruminants. Front Appl Mathematic Stat. (2022) 79:817060. doi: 10.3389/fams.2022.817060
71. Oukouomi Noutchie SC, Mafatle NE, Guiem R, M'pika Massoukou RY. On the dynamics of sexually transmitted diseases under awareness and treatment. Front Appl Mathematic Stat. 8:860840. doi: 10.3389/fams.2022.860840
72. Ebrahim EA, Biru BZ. Multivariate analysis of drivers of migration, challenges, and prediction of future scenarios of female Ethiopian return migrants from the middle east. Front Appl Mathematic Stat. (2022) 8:870111. doi: 10.3389/fams.2022.870111
Keywords: non-linear delayed crop pest management model, public awareness, explicit Runge–Kutta method, Adams method, comparative analysis, approximate solutions, graphical illustrations
Citation: Anwar N, Ahmad I, Kiani AK, Shoaib M and Raja MAZ (2023) Numerical treatment for mathematical model of farming awareness in crop pest management. Front. Appl. Math. Stat. 9:1208774. doi: 10.3389/fams.2023.1208774
Received: 19 April 2023; Accepted: 24 August 2023;
Published: 07 September 2023.
Edited by:
Uttam Ghosh, University of Calcutta, IndiaReviewed by:
Ebenezer Bonyah, University of Education, Winneba, GhanaBapin Maa Ndal, University of Calcutta, India
Ramoshweu Solomon Lebelo, Vaal University of Technology, South Africa
Hira Soomro, Universiti Teknologi Petronas, Malaysia
Pankaj Tiwari, University of Kalyani, India
Copyright © 2023 Anwar, Ahmad, Kiani, Shoaib and Raja. This is an open-access article distributed under the terms of the Creative Commons Attribution License (CC BY). The use, distribution or reproduction in other forums is permitted, provided the original author(s) and the copyright owner(s) are credited and that the original publication in this journal is cited, in accordance with accepted academic practice. No use, distribution or reproduction is permitted which does not comply with these terms.
*Correspondence: Adiqa Kausar Kiani, YWRpcWFAeXVudGVjdC5lZHUudHc=