 Nasrullah Khan1
 Muhammad Aslam
 Mohammed Albassam
- 1College of Statistical Sciences, University of the Punjab, Lahore, Pakistan
- 2Department of Statistics, Faculty of Science, King Abdulaziz University, Jeddah, Saudi Arabia
This study investigates the efficiency of a modified exponentially weighted moving average (EWMA) control method using conditional expected delay to improve its efficiency in detecting changes in a process over time. While the modified EWMA control method is commonly used for this purpose, it can sometimes experience delays in detecting changes. The proposed method aims to address this limitation by incorporating conditional expected delay. The study utilizes simulations to conduct a performance comparison between the modified EWMA control method and the conventional EWMA control, employing the metric of conditional expected delay. Simulation results demonstrate the modified EWMA control method with conditional expected delay in terms of accurately and rapidly detecting changes. Overall, this study concludes that the integration of conditional expected delay into the modified EWMA control method can increase its effectiveness in detecting changes in a process. This has significant practical implications for a variety of industries that require timely and accurate detection of changes to maintain product quality and optimize processes.
1. Introduction
Shewhart control charts and control charts using the EWMA statistic are two widely used methods for monitoring and improving the quality of manufacturing and business processes. Shewhart control charts were first introduced by Walter A. Shewhart in the 1920's. This method involves plotting process data on a chart with upper and lower control limits based on the mean and standard deviation of the data. The data points are compared to these limits to detect any variations or changes in the process. Shewhart control charts are considered a standard tool for statistical process control (SPC) and are commonly used in manufacturing and quality control applications [1]. In contrast, control charts using the EWMA statistic are a more recent development that uses a modified exponentially weighted moving average (EWMA) control method to detect changes in a process. This method calculates a weighted average of the data over time, giving more weight to recent data points, and compares it to a control limit. Control charts using the EWMA statistic are more sensitive to changes in the process, making them suitable for detecting smaller or gradual changes [2]. In summary, Shewhart control charts rely on the mean and standard deviation of the data, while control charts using the EWMA statistic use a modified EWMA method to calculate a weighted average of the data. Both methods are useful for process monitoring and quality control applications and have their unique advantages. More information can be seen in Lucas and Saccucci [3] and Roberts [4].
The modified exponentially weighted moving average (EWMA) control chart is a statistical process control method used to monitor and improve the quality of manufacturing and business processes. The traditional EWMA control chart calculates a weighted average of the data over time, with more weight given to recent data points. However, the traditional EWMA control chart is less responsive to small or gradual changes, and its performance can be affected by process drift. In conclusion, the modified EWMA control chart is a modified version of the traditional EWMA control chart that incorporates a CED factor. This modification makes the chart more responsive to small or gradual changes in the process and reduces false alarms. The modified EWMA control chart has been successfully applied in various industries and is a valuable tool for process monitoring and quality control. Information on these control charts can be seen in Patel and Divecha [5], Khan et al. [6], and Khan et al. [7].
To overcome these limitations, the modified EWMA control chart uses a conditional expected delay (CED) factor. This factor adjusts the weight given to recent data points based on the probability of a change in the process. By incorporating this factor, the modified EWMA control chart is more sensitive to small or gradual changes in the process and better able to handle process drift. Research studies have shown that the modified EWMA control chart is an effective tool for detecting process changes and reducing false alarms generated by traditional EWMA charts. It has been successfully used in various industries, such as manufacturing, healthcare, and finance. Haq and Woodall [8] proposed a method to calculate CED for the modified EWMA control chart. More applications of EWMA control charts can be seen in Li et al. [9], Supharakonsakun and Areepong [10], and Taboran and Sukparungsee [11].
In the EWMA chart, the smoothing constant plays a key role in determining how much weight is given to old vs. new data. A small smoothing constant results in a smoother EWMA chart that is less sensitive to short-term changes in the data. When the smoothing constant is small, the EWMA chart will be more stable and less reactive to short-term changes as it places greater emphasis on older data points. This can be beneficial in scenarios where the process being monitored is relatively stable, and the focus is on identifying significant shifts or trends over longer periods. However, if the process being monitored is subject to frequent and rapid changes, a larger smoothing constant may be more appropriate as it will make the chart more sensitive to short-term changes and better able to detect shifts or trends that occur over shorter periods. In summary, the choice of smoothing constant should depend on the characteristics of the process being monitored and the goals of the analysis. Haq and Woodall [8] presented a critique on the modified EWMA chart by considering only a specific region of smoothing constant. The existing literature strongly indicates that no single control chart can achieve a flawless performance under all assumptions and with all control chart parameters. In terms of discontinuing the utilization of the control chart employing the modified EWMA method, it is evident from the research by Haq and Woodall [8] that they exclusively focus on instances where the performance of this modified EWMA-based chart is inferior compared to the control chart using the conventional EWMA technique. In a recent study conducted by Khan and Aslam [12], they demonstrated the enhanced effectiveness of the modified EWMA control chart compared to the traditional EWMA control chart. This improvement was evident in terms of the average run length (ARL). As mentioned by Patel and Divecha [5], the modified EWMA chart performs better for large values of smoothing constant. In this study, we will present the design of the modified EWMA control chart to evaluate the CED values for various values of the smoothing constant and shifts. We will show that the modified EWMA control chart performs better than the EWMA control chart in terms of CED.
2. Modified EWMA chart
It is postulated that the quality characteristic of interest, denoted as Yi, conforms to a normal distribution with a mean of μ and a variance of σ2. With this postulation as the basis, Khan et al. [7] proposed a control chart that generalizes the modified EWMA statistic presented by Alpaben and Jyoti [13]. The modified EWMA statistic based on sequence Yt proposed by Khan et al. [7] is given by
The modified EWMA statistic represents a broadening of the traditional EWMA and the EWMA statistic initially put forward by Alpaben and Jyoti [13]. It is worth highlighting that k, a constant in the formula, is best optimized by minimizing the variance of Mt, which is achieved when k is equal to , see Khan et al. [7]. When Mt falls within the designated range of the lower control limit (LCL) and upper control limit (UCL), the process is considered to be in control.
3. Performance evaluation of Khan et al.'s [7] chart
Now, we will compare the efficiency of the control chart proposed by Khan et al. [7] with the traditional EWMA control chart. Let δ denote the shift in the process and τ denote the delays in the shift. Note that τ presents the in-control sample before a shift in the process and the control chart reduces to a zero-state control chart when τ = 0, and more information can be seen in Riaz et al. [14]. Note that Haq and Woodall [8] restricted their comparison by considering the small values of the smoothing constant. From Patel and Divecha [5] and Khan et al. [7], it is clear that the modified EWMA control chart performs better when λ≥0.10. In this section, we will present the advantages of the control chart proposed by Khan et al. [7] over the traditional EWMA chart in terms of conditional expected delay (CED). The computation of CED holds significant practical implications across diverse industries that rely on timely and precise change detection to uphold product quality and streamline processes. The utilization of Monte Carlo simulation to calculate CED adds a robust dimension to this evaluation. Within this simulation framework, a shift is introduced while considering predetermined subgroups to be in control prior to the shift occurrence. The evaluation performance of both control charts will be done using the same parameters and using a Monte Carlo simulation. Several figures are presented to show the efficiency of the modified EWMA over the traditional EWMA in terms of CED. Figures 1A, B, 2A, B are presented to verify the results of our codes with reference to Haq and Woodall [8]. Utilizing our codes, the same figures for λ = 0.075 and λ = 0.085, along with various values of δ, are presented as shown in Haq and Woodall [8]. Figures 3A, B is presented when λ = 0.10. Figures 4A, B is presented when λ = 0.15. Figures 5A, B is presented when λ = 0.20 and Figures 6A, B is presented when λ = 0.30. When λ = 0.075, Haq and Woodall [8] considered the large shifts (δ = 0.5, 1.0, 2.0) to show the disadvantage of the modified EWMA control chart. From Figures 1A, B, it is clear that the modified EWMA has lower values of CED when λ ≤ 0.25. When λ = 0.085, Haq and Woodall [8] considered the large shifts (δ = 0.5, 1.0, 2.0) to show the disadvantage of the modified EWMA control chart. From Figures 2A, B, it is clear that the modified EWMA has lower values of CED when δ ≤ 0.25. When λ = 0.10, Figures 3A, B depicts that the modified EWMA control chart performs better than the traditional EWMA control chart in terms of CED when δ ≤ 0.25. When λ = 0.15, Figures 4A, B depicts that the modified EWMA control chart performs better than the traditional EWMA control chart in terms of CED for small and large values of δ. When λ = 0.20, Figures 5A, B depicts that the modified EWMA control chart performs better than the traditional EWMA control chart in terms of CED when δ ≤ 0.50. When λ = 0.30, Figures 6A, B depicts that the modified EWMA control chart performs better than the traditional EWMA control chart in terms of CED when δ ≤ 0.50. In a nutshell, for λ values below 0.010, the modified EWMA control chart demonstrates superior performance compared to the EWMA control chart when dealing with minor changes. Conversely, when the change is substantial (δ > 0.25), the traditional EWMA control chart exhibits better results than the modified counterpart. Notably, an interesting observation emerges as λ increases: the enhanced efficiency of the modified EWMA control chart becomes evident even in scenarios involving significant shifts. This dynamic underscores the nuanced relationship between the smoothing constant and the effectiveness of the modified EWMA control chart across various magnitudes of process shifts.
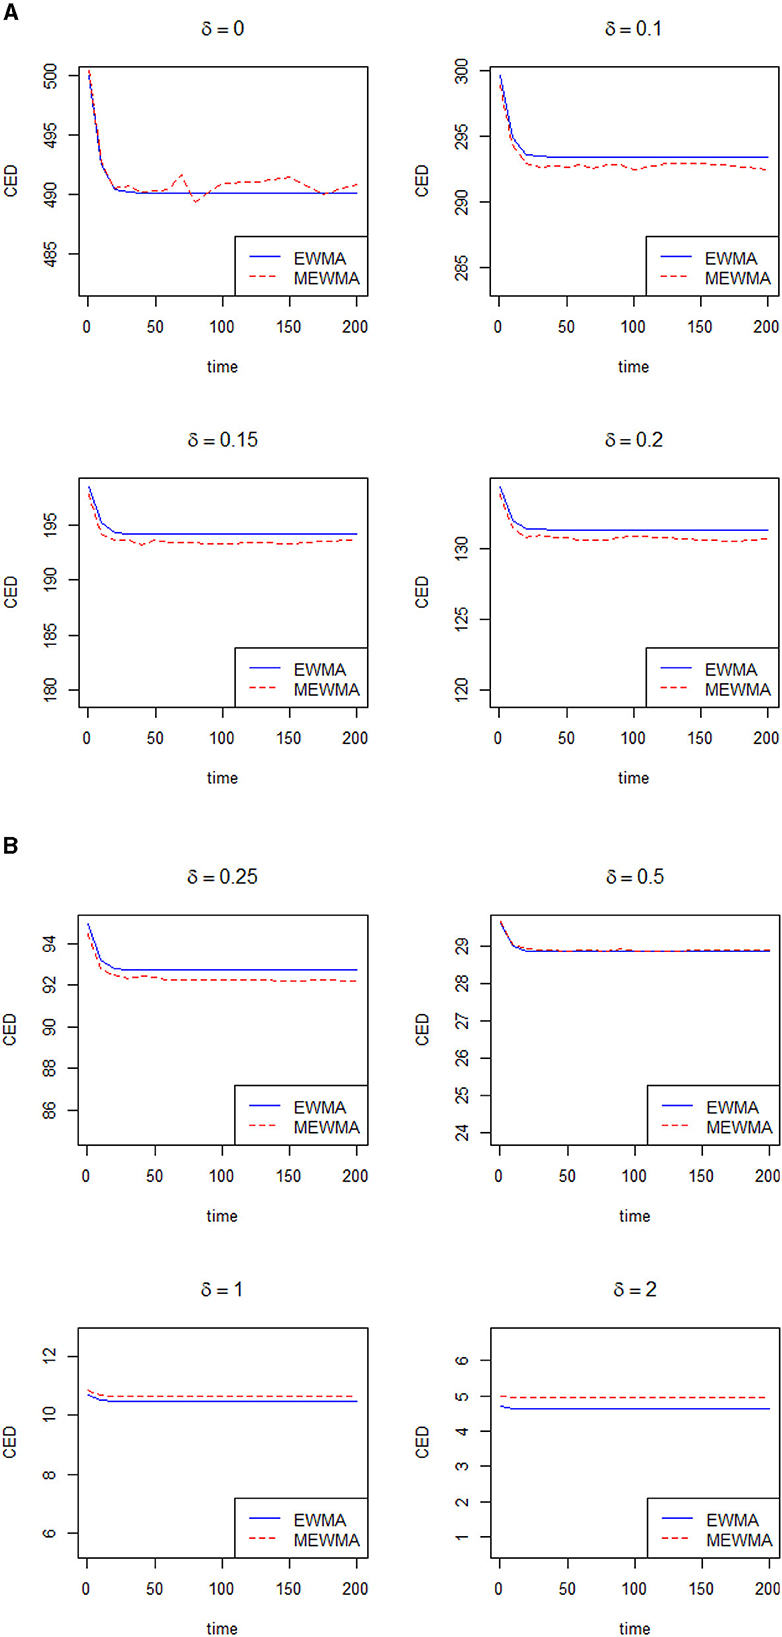
Figure 1. (A, B) CED profile when λ = 0.075.
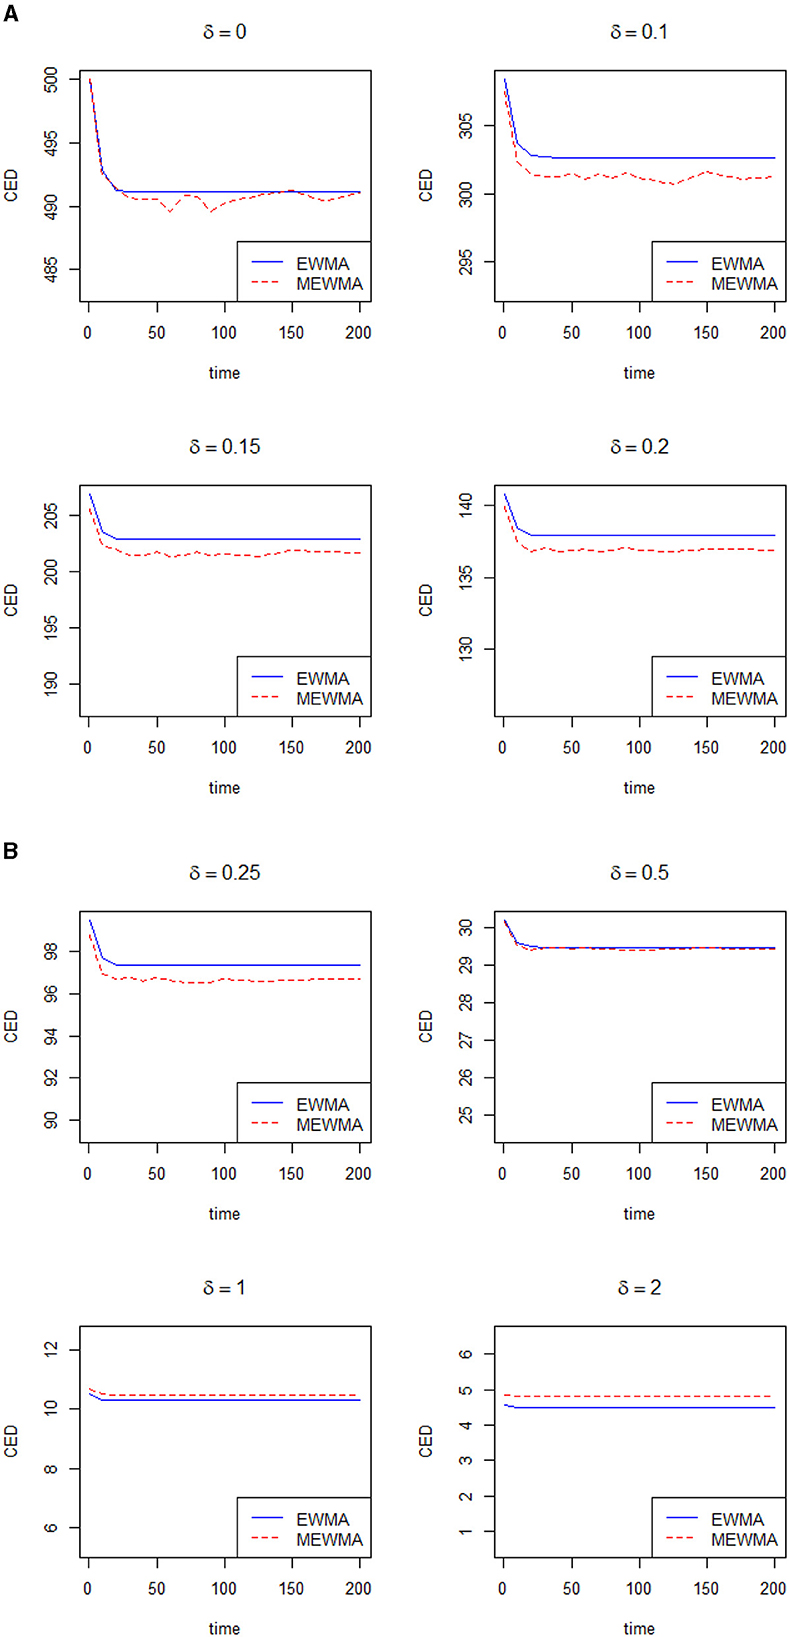
Figure 2. (A, B) CED profile when λ = 0.085.
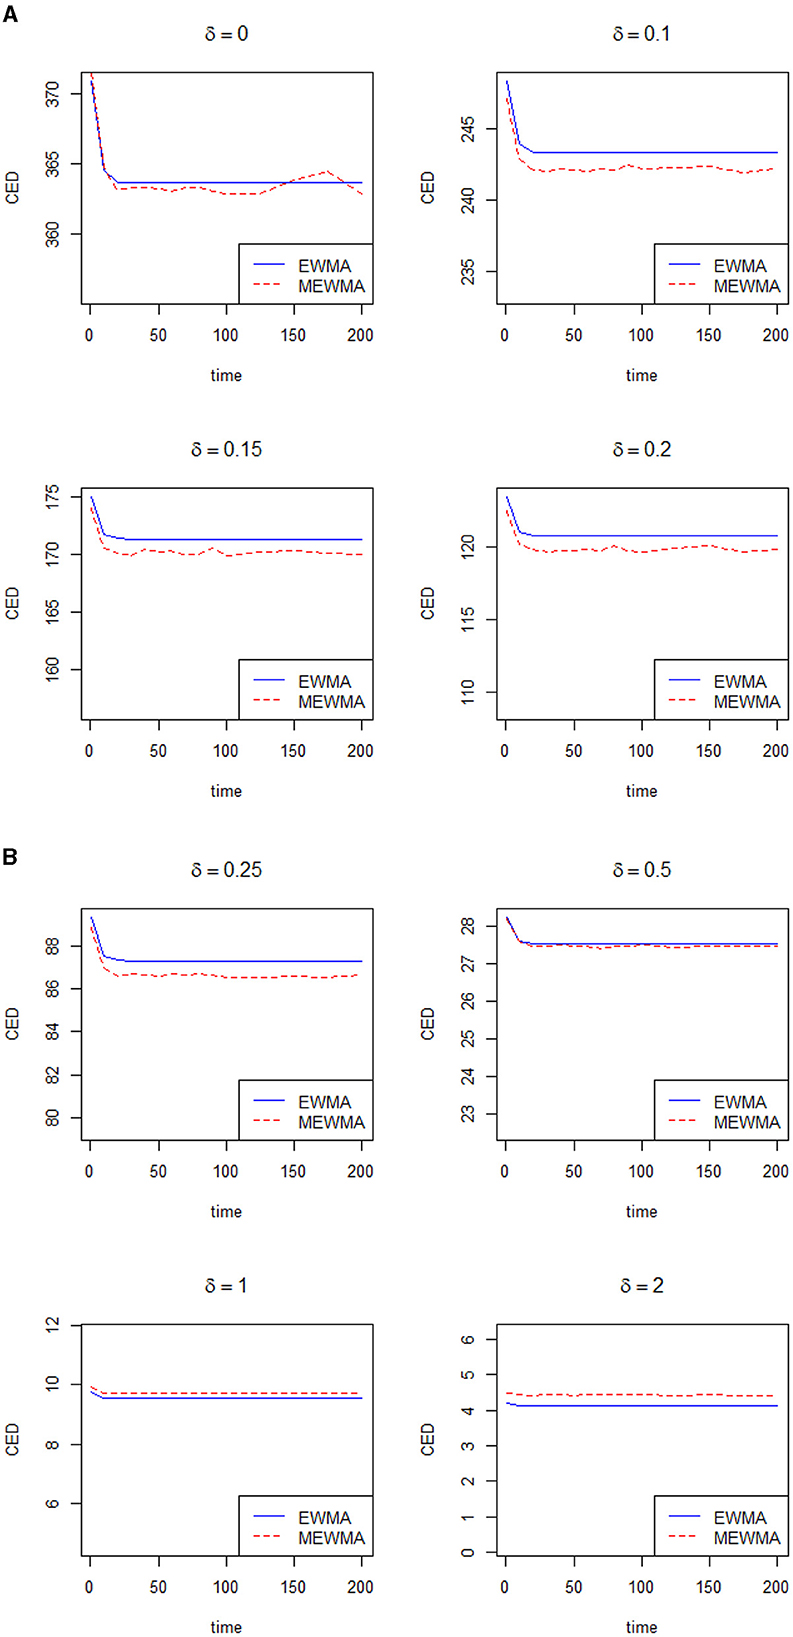
Figure 3. (A, B) CED profile when λ = 0.10.
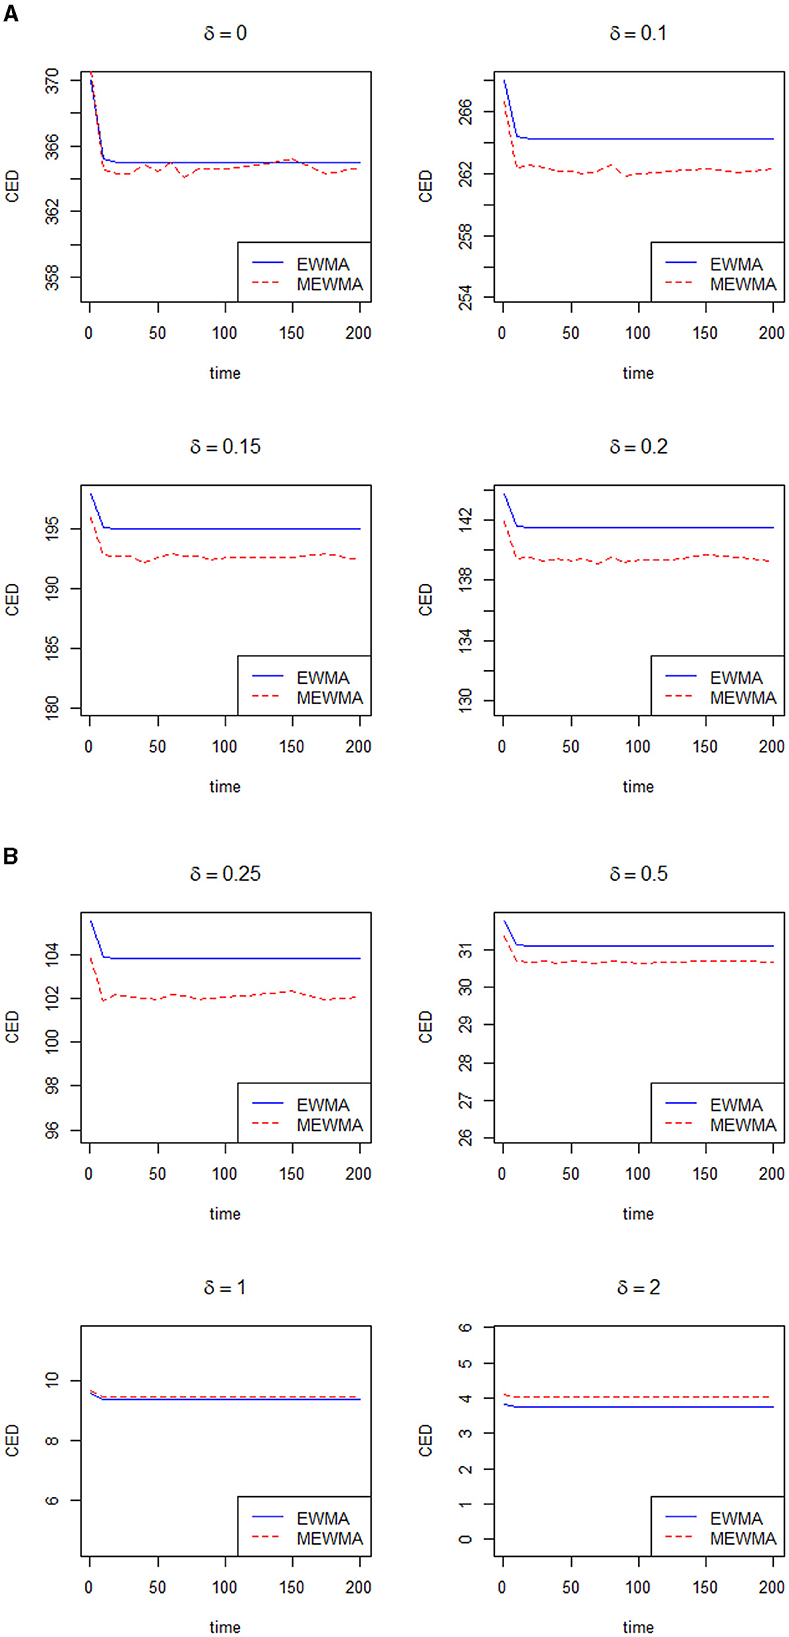
Figure 4. (A, B) CED profile when λ = 0.15.
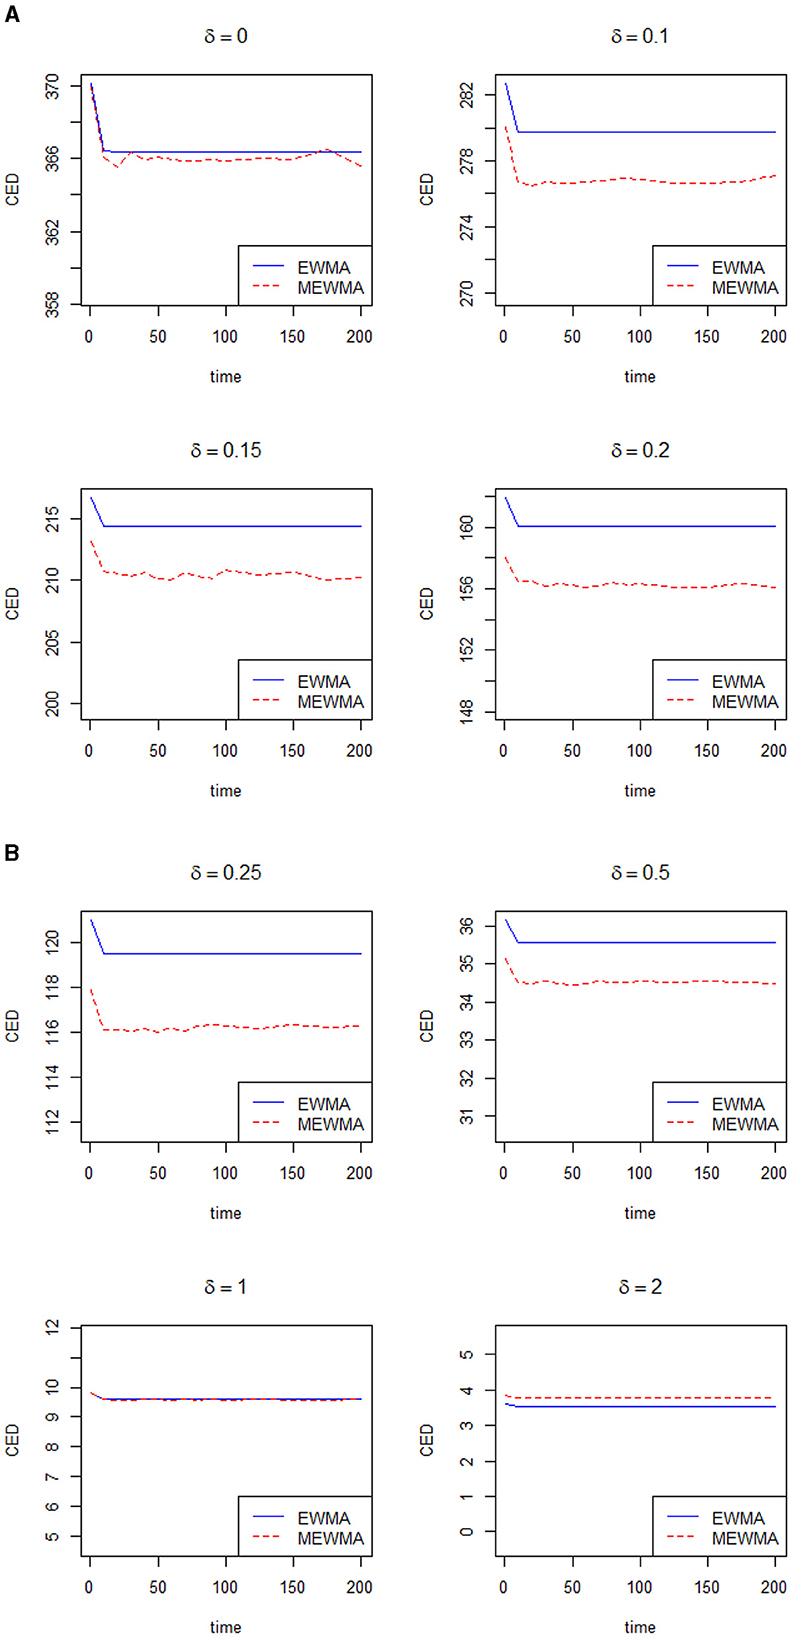
Figure 5. (A, B) CED profile when λ = 0.20.
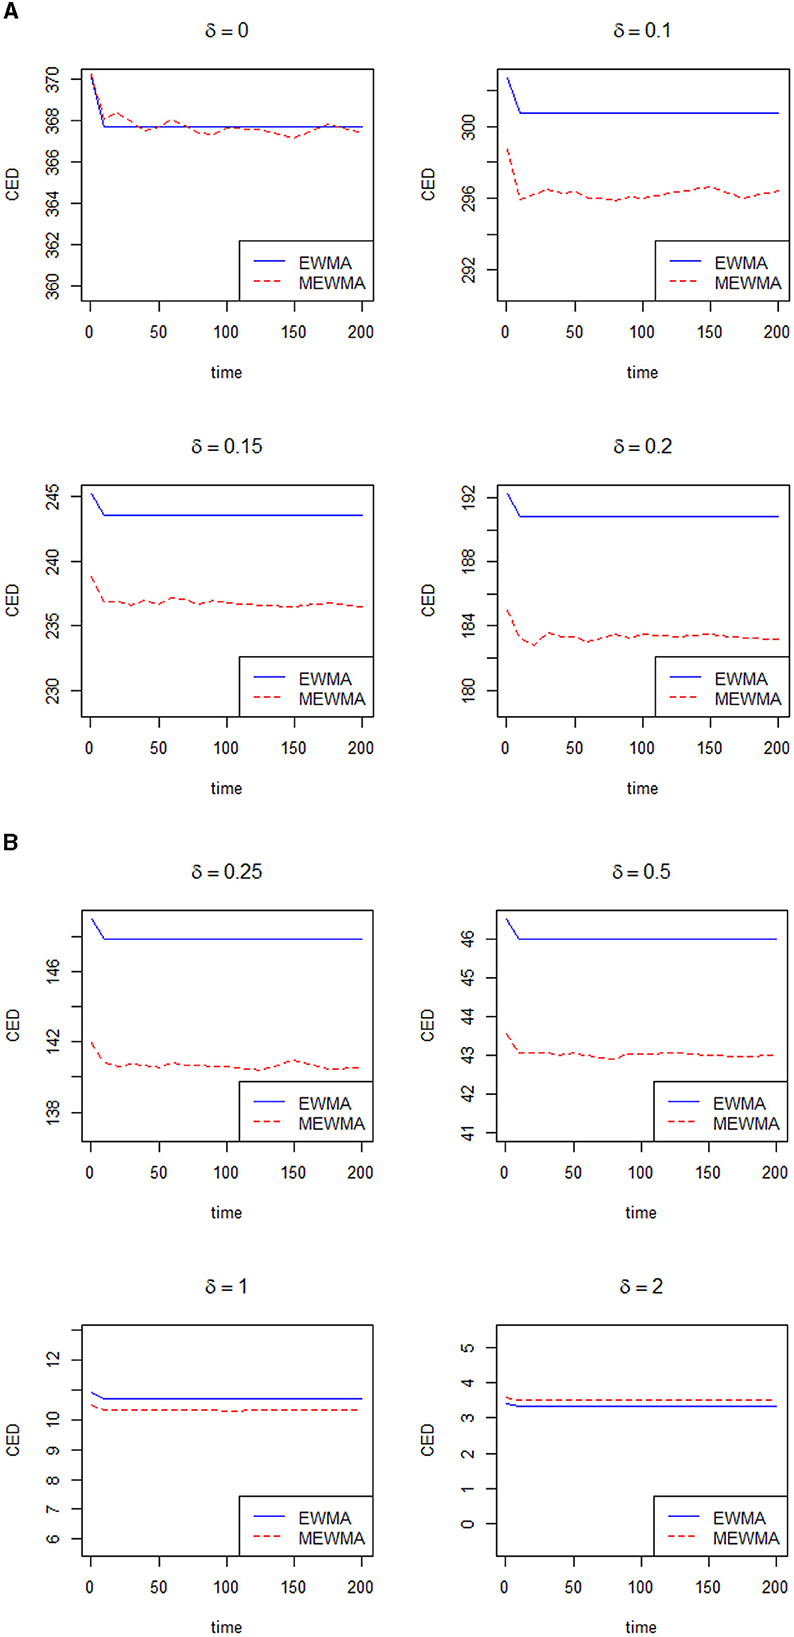
Figure 6. (A, B) CED profile when λ = 0.30.
4. Conclusion
This study investigated the efficacy of a modified exponentially weighted moving average (EWMA) control method that incorporated conditional expected delay to improve the efficiency of change detection in a process over time. While the modified EWMA control method is commonly used for this purpose, it can sometimes experience delays in detecting changes. To address this limitation, the proposed method integrated conditional expected delay. Simulations were conducted to compare the performance of the modified EWMA control method with conditional expected delay to both the traditional EWMA control method and the modified EWMA control method without conditional expected delay. The simulation results demonstrated that the modified EWMA control method with conditional expected delay excelled in accurately and rapidly detecting changes. In conclusion, this study suggests that the incorporation of conditional expected delay into the modified EWMA control method significantly enhanced its effectiveness in detecting changes in a process. These findings have important practical implications for various industries that required timely and accurate change detection to ensure product quality and optimize processes.
Author contributions
MAs: Writing—original draft, Writing—review and editing. NK: Software, Writing—original draft. MAl: Funding acquisition, Writing—review and editing.
Funding
The author(s) declare that no financial support was received for the research, authorship, and/or publication of this article.
Acknowledgments
The authors extend their sincere gratitude to the editor and reviewers for their invaluable suggestions that have significantly enhanced the quality and presentation of this article.
Conflict of interest
The authors declare that the research was conducted in the absence of any commercial or financial relationships that could be construed as a potential conflict of interest.
Publisher's note
All claims expressed in this article are solely those of the authors and do not necessarily represent those of their affiliated organizations, or those of the publisher, the editors and the reviewers. Any product that may be evaluated in this article, or claim that may be made by its manufacturer, is not guaranteed or endorsed by the publisher.
References
1. Wheeler DJ, Chambers DS. Understanding Statistical Process Control. Knoxville: Statistical Process Controls, Inc.; SPC Press. (1992).
2. Montgomery DC. Introduction to Statistical Quality Control. Hoboken, NJ: John Wiley and Sons (2020).
3. Lucas JM, Saccucci MS. Exponentially weighted moving average control schemes: properties and enhancements. Technometrics. (1990) 32:1–12. doi: 10.1080/00401706.1990.10484583
4. Roberts S. Control chart tests based on geometric moving averages. Technometrics. (2000) 42:97–101. doi: 10.1080/00401706.2000.10485986
5. Patel AK, Divecha J. Modified exponentially weighted moving average (EWMA) control chart for an analytical process data. J Chem Engin Mat Sci. (2011) 2:12–20.
6. Khan N, Aslam M, Jun CH. A EWMA control chart for exponential distributed quality based on moving average statistics. Qual Reliab Engin Int. (2016) 32:1179–90. doi: 10.1002/qre.1825
7. Khan N, Aslam M, Jun CH. Design of a control chart using a modified EWMA statistic. Qual Reliab Engin Int. (2017) 33:1095–104. doi: 10.1002/qre.2102
8. Haq A, Woodall WH. A critique of the use of modified and moving average-based EWMA control charts. Qual Reliab Engin Int. (2023). doi: 10.1002/qre.3290
9. Li H, Deng J, Yuan S, Feng P, Arachchige DD. Monitoring and identifying wind turbine generator bearing faults using deep belief network and EWMA control charts. Front Energy Res. (2021) 9:799039. doi: 10.3389/fenrg.2021.799039
10. Supharakonsakun Y, Areepong Y. Design and application of a modified EWMA control chart for monitoring process mean. Appl Sci Engin Prog. (2022) 15:5198–5198. doi: 10.14416/j.asep.2021.06.007
11. Taboran R, Sukparungsee S. An enhanced performance to monitor process mean with modified exponentially weighted moving average–sign control chart. Appl Sci Engin Prog. (2022) 15:5532–5532. doi: 10.14416/j.asep.2021.10.013
12. Khan N, Aslam M. On updating the results of the control chart using a modified EWMA statistic. Qual Reliab Engin Int. (2023). doi: 10.1002/qre.3321
13. Alpaben KP, Jyoti D. Modified exponentially weighted moving average (EWMA) control chart for an analytical process data. J Chem Engin Mat Sci. (2011) 2:12–20.
Keywords: quality control, simulation, EWMA statistic, efficiency, control chart
Citation: Khan N, Aslam M and Albassam M (2023) Efficiency enhancement of the modified EWMA control method with conditional expected delay for change detection in processes. Front. Appl. Math. Stat. 9:1268340. doi: 10.3389/fams.2023.1268340
Received: 27 July 2023; Accepted: 29 August 2023;
Published: 15 September 2023.
Edited by:
Han-Ying Liang, Tongji University, ChinaReviewed by:
Kashinath Chatterjee, Augusta University, United StatesYupaporn Areepong, King Mongkut's University of Technology North Bangkok, Thailand
Saowanit Sukparungsee, King Mongkut's University of Technology North Bangkok, Thailand
Copyright © 2023 Khan, Aslam and Albassam. This is an open-access article distributed under the terms of the Creative Commons Attribution License (CC BY). The use, distribution or reproduction in other forums is permitted, provided the original author(s) and the copyright owner(s) are credited and that the original publication in this journal is cited, in accordance with accepted academic practice. No use, distribution or reproduction is permitted which does not comply with these terms.
*Correspondence: Muhammad Aslam, YXNsYW1fcmF2aWFuQGhvdG1haWwuY29t