 Deepak Singh
 Pradip Basak2
- 1Division of Sample Surveys, ICAR-Indian Agricultural Statistics Research Institute, New Delhi, India
- 2Department of Agricultural Statistics, Uttar Banga Krishi Viswavidyalaya, Cooch Behar, West Bengal, India
Indices are created by consolidating multidimensional data into a single representative measure known as an index, using a fundamental mathematical model. Most present indices are essentially the averages or weighted averages of the variables under study, ignoring multicollinearity among the variables, with the exception of the existing Ordinary Least Squares (OLS) estimator based OLS-PCA index methodology. Many existing surveys adopt survey designs that incorporate survey weights, aiming to obtain a representative sample of the population while minimizing costs. Survey weights play a crucial role in addressing the unequal probabilities of selection inherent in complex survey designs, ensuring accurate and representative estimates of population parameters. However, the existing OLS-PCA based index methodology is designed for simple random sampling and is incapable of incorporating survey weights, leading to biased estimates and erroneous rankings that can result in flawed inferences and conclusions for survey data. To address this limitation, we propose a novel Survey Weighted PCA (SW-PCA) based Index methodology, tailored for survey-weighted data. SW-PCA incorporates survey weights, facilitating the development of unbiased and efficient composite indices, improving the quality and validity of survey-based research. Simulation studies demonstrate that the SW-PCA based index outperforms the OLS-PCA based index that neglects survey weights, indicating its higher efficiency. To validate the methodology, we applied it to a Household Consumer Expenditure Survey (HCES), NSS 68th Round survey data to construct a Food Consumption Index for different states of India. The result was significant improvements in state rankings when survey weights were considered. In conclusion, this study highlights the crucial importance of incorporating survey weights in index construction from complex survey data. The SW-PCA based Index provides a valuable solution, enhancing the accuracy and reliability of survey-based research, ultimately contributing to more informed decision-making.
1 Introduction
With the rapid growth of large-scale multivariate data generation, which is both complex and expansive, extracting meaningful insights becomes a challenging task due to the voluminous respondents and intricate relationships among variables. Therefore, it is imperative to develop statistical methodologies for summarizing such data to uncover underlying patterns, trends, and contextual factors that facilitate informed decision-making. One widely adopted approach for summarizing and comparing performance across subjects is the use of composite indicators or indices. Composite indicators or indices are mathematical or computational measures designed to effectively quantify multidimensional concepts that cannot be adequately captured by a single indicator alone e.g., industrialization, poverty, Human development, etc. A composite indicator is created by aggregating individual indicators into a single index measure based on a fundamental model and is used for ranking subjects. Composite indicators or indices have proven valuable in various domains of economic, social, and environmental statistics for summarizing and presenting information.
Most of the existing indices reported are either weighted or equally weighted averages of the variables. Wiesmann [1] reported the Global Hunger Index series using the average of three variables, the share of the population with insufficient access to food (provided by FAO); the fraction of the population of children under 5 who are underweight (provided by WHO); and the mortality rates of children under-5 (provided by UNICEF). Athreya et al. [2] reported the food insecurity in rural India by developing the Food Insecurity Index using the weighted average of sub-indices. Gentilini and Webb [3] proposed a multidimensional index of poverty and hunger. The Poverty and Hunger Index uses the five indices which are scaled against the maximum values of each indicator and added up using equal weights as in the construction of the human development index. Hastings [4] developed the Human Security Index (HIS) which is the average of the Social Fabric Index and the basic Human Development Index. Athreya et al. [5] reported the food insecurity in urban India using the same methodology as used by Athreya et al. [2]. Krishnamurthy et al. [6] developed the Vulnerability Index using the three indices which are scaled against the maximum values of each indicator and added up using equal weights. The Baseline Climate and Food Insecurity Index uses three indices which are scaled against the maximum values of each indicator and added up using equal weights [7]. Global Food Security Index [8] used the five indices by using two sets of weightings. One equal weight and the second available option, known as peer panel recommendation, averages the weightings suggested by five members of an expert panel. Every year, the United Nations Development Programme publishes the Human Development Index (HDI) in annually published Human Development Report. The HDI is the geometric mean of the three dimension indices i.e., Health, Education and Income [9]. Since 2019, the United Nations Development Programme is annually publishing the Global Multidimensional Poverty Index (MPI) in the Multidimensional Poverty Index Report [2023 Global Multidimensional Poverty Index (MPI)]. Alkire at al. [10] MPI uses information from ten indicators that are organized into three dimensions: health, education, and living standards. The index is constructed based on a weighted average using a nested weight structure: equal weight across dimensions and equal weight for each indicator within dimensions. Niti Ayog (Govt. of India) annually reported the Health Index in four rounds from 2014–15 to 2019–20 based on the weighted average of normalized variables in the report “Healthy States, Progressive India: Report on the Ranks of States and Union territories”1. The Global Hunger index, [11] report published by Concern Worldwide and Welthungerhilfe (Publishes annual publication on the Global Hunger Index) used the standardized scores of undernourishment, child mortality, child stunting, and child wasting to calculate the GHI score for each country. Undernourishment and child mortality each contribute one-third of the GHI score, while child stunting and child wasting each contribute one-sixth of the score in the Global Hunger 9.
Narain et al. [12] developed a new statistical methodology for the construction of index based on normalized indicators. Narain et al. [13, 14] have discussed regional dimensions of disparities in crop productivity in Uttar Pradesh and Madhya Pradesh states of India in the years 2001 and 2002, respectively using the Narain et al. [12] method of construction of the composite index. Narain et al. [15, 16] evaluated economic development in Karnataka and hilly states of India respectively using Narain et al. [12] method of construction of composite index. Narain et al. [17, 18] have estimated socioeconomic development of different districts in Kerala and different states of India respectively using the Narain et al. [12] method of construction of composite index. Rai et al. [19] developed the Livelihood Index for different agro-climatic zones of India based on the statistical background suggested by Narain et al. [12].
However, the challenge of multicollinearity persists in constructing indices from multivariate data, where the combination of weights for correlated variables often leads to the development of poorly constructed composite indices. To address this challenge, the Principal Component Analysis (PCA) based index method is effective. The unique property of PCA in removing multicollinearity has prompted numerous authors to utilize it for the development of indices such as Dahal [20] who developed a Soil Quality Index using principal components analysis. Kumar [21] created an Agricultural Development Index using the principal component technique. Raja and Tawheed [22] evaluated ten districts of Kashmir Valley concerning nine development indicators based on principal component-based Index. Chao and Wu [23] utilized the medical expenditure panel survey to develop a principal component -based index. Senna et al. [24] developed a Water Poverty Index using principal component analysis. Zhou et al. [25] used principal component analysis to develop a Green Finance Development Index. Lieberman-Cribbin et al. [26] developed SES index using principal component analysis on the variables; household income, gross rent, poverty, education, working class status, unemployment, and occupants per room. Mohammed et al. [27] developed the Resilience Index for municipal infrastructure using principal components analysis (PCA) for decision-makers regarding pavement network maintenance planning.
2 Some existing indices and their limitations
2.1 Multiple factor analysis
It does not serve the purpose to arrive at a meaningful and comparable composite index of development when the indicators are presented in different scale of measurements.
2.2 Aggregation method
The method is not suitable as the composite index of development obtained by use of the method depends on the unit in which the data are recorded.
2.3 Monetary index
Monetary values of developmental indicators may change from place to place and from time to time. All the indicators cannot be converted into monetary values like “death rate,” “birth rate,” “sex ratio,” “literacy rate” etc. cannot be converted into monetary values.
2.4 Ratio index
Developmental Indicators are transformed as ratio in the following manner
The method uses range value in the denominator, which is based on on only two observations. Other information is not utilized in this method.
2.5 Narain's index method
Narain et al. [12] method does not consider the effect of multicollinearity which is present among correlated variables and does not incorporate survey weight.
2.6 Principal component analysis
This method uses the estimator which is the function of the superpopulation covariance matrix Σyy and is not suitable if the data is collected through complex survey design.
The existing literature shows that methodologies for index construction are based on the assumption that the data is collected through simple random sampling and no method of index construction has been reported that is capable of incorporating survey weights available in data collected through surveys with planned sampling designs (complex survey designs), such as Household, Employment, Education, Income, Expenditure, Agricultural, Housing, Poverty alleviation and living conditions, Literacy, Enterprise, and Skill measurement surveys. This limitation results in biased estimates and rankings based on the existing methods of index construction for complex survey data which is collected through complex survey design. Notably, widely recognized large-scale surveys have complex survey designs involving stratification, unequal probabilities of selection, clustering, multi-stages and multi-phases like Demographic and Health Surveys (DHS), European Social Surveys, National Sample Surveys (NSS), National Family Health Surveys (NFHS), National Surveys of Children's Health (NSCH), and National Nutrition Surveys (NNS) exemplify real-life instances where this issue persists.
The existing PCA-based index methodology for survey data is based on the Ordinary Least Squares (OLS) estimator of variance covariance matrix which assumes that the data are collected using simple random sampling but most survey data are collected through complex survey design where the survey weight is attached with each sampled unit to make the sample representative of the population. The existing PCA (OLS-based approach) based index methodology for survey data is incapable of incorporating the survey weights in the calculation of indexes.
Ignoring survey weights in the development of estimates of a parameter in survey research can lead to biased and unreliable results. Survey weights are applied to adjust for the unequal probabilities of selection that occur in complex survey designs. These weights are essential for producing accurate and representative estimates of population parameters. Survey weights ensure that the sample accurately represents the target population and is designed to make the most efficient use of the data collected. Without survey weights, some segments of the population may be overrepresented or underrepresented in the sample. Survey weights help balance the sample to reflect the population's distribution, reducing this bias. Ignoring survey weights in survey research can compromise the quality and validity of the estimates, leading to biased, inefficient, and unrepresentative results. It's essential to use appropriate weighting techniques when analyzing survey data to ensure that the findings accurately reflect the target population.
Therefore, in this research study, we have proposed a new Survey Weighted PCA (SW-PCA based approach) based Index methodology for disaggregated survey-weighted data which produces the unbiased estimate of variance-covariance matrix, thereby producing unbiased eigenvalues, unbiased eigenvectors, resulting in the development of unbiased and efficient indices. By incorporating the survey weights and addressing the issue of multicollinearity among variables, we aim to overcome these challenges and provide a robust framework for constructing composite indices that accurately represent the underlying survey data.
3 Material and methods
3.1 Existing PCA (population variance covariance, PVC-PCA based approach) based index methodology for disaggregated population data
Consider a survey conducted where the population is distributed across various subpopulations, such as states within a country and unit level can be, e.g., individuals or households or farms etc. The observational recordings are taken from each individual or unit of the whole population. The researcher aims to compare the performance of these subpopulations. To facilitate this comparison, it is necessary to establish an index or measure that enables a meaningful assessment of subpopulation performance. For this, let us consider a finite population U = (1, 2,…,k,…,N) of size N units having l subpopulations such that the hth subpopulation Nh units and (h= 1, 2,…, l) and be the set of p standardized variables which are used for index development. Let us suppose that the non-zero eigenvalues of the variance-covariance matrix Σyy of the variables under study for index development are λ1 > λ2 > λ3…> λp and the corresponding eigenvectors are γ1, γ2, γ3,…, γp. The Population variance covariance matrix for disaggregated population data is expressed as
where, Ȳ = ∑h∑iyhi/N.
Let the population variance-covariance matrix Σyy is a real positive definite matrix. Let us suppose that the non-zero eigenvalues of are λ1 > λ2 > λ3…> λp and the corresponding eigenvectors are γ1, γ2, γ3, …, γp. For distinct λj‘s (j = 1, 2, 3,…, p), a (p × p) orthogonal matrix can be formed, where
Γ matrix diagonalizes Σyy matrix such that
where A = diag (λ1, λ2, λ3,…,
Now let us consider an orthogonal transformation of y such that
where PC1, PC2, PCp are the p components of P and are called principal components [28].
The composite index corresponding to ith population unit of hth subpopulation is given as
where the PChij's are principal component scores corresponding to the population unit ∀h = 1, 2,…, l; i = 1, 2, …, Nh; j = 1, 2,…, p.
The average of within hth subpopulation gives the composite index value for hth subpopulation as
The composite index values of subpopulations are normalized as
The ranking of l subpopulations is determined by the normalized composite index (CIh) where a value of 1 represents the highest rank and a value of 0 represents the lowest rank.
3.2 PCA based index methodology for disaggregated survey (sample) data
Consider a survey conducted where the population is distributed across various subpopulations. When the population is large, the observational recordings from each individual or unit of the whole population (as in the case of PVC-PCA based index methodology for disaggregated population data) are expensive and time consuming, therefore a sample is drawn from the population. The sample from the population is generally collected using complex survey design as they are less costly and efficient as the selected sample is representative of the population. Since the selected sample is collected through a survey design, the survey weight is attached to each unit in the survey. When the researcher aims to compare the performance of these subpopulations, it is necessary to establish an index or measure that enables a meaningful assessment of subpopulation performance. Principal Component Analysis (PCA) is utilized to develop an index specifically tailored for disaggregated data to exclude the effect of multicollinearity present in the data. For PCA, the eigenvalues and eigenvectors of the variance-covariance matrix of the variables (Σyy) under study are the target parameters of interest.
For this, let us consider a finite population U = (1, 2,…,k,…,N) of size N units having l subpopulations such that the hth subpopulation has Nh units and (h = 1, 2,…, l). Let s be a probabilistic sample of size n drawn from this population such that where nh is the number of units belonging to the hth sub-population with the assumption that nh≠0 and dhi denotes the survey weight associated with ith unit of the sample in hth subpopulation such that = 1. Let be the p set of standardized indicator variables and be values of the variables y corresponding to ith sample unit of hth subpopulation where, h= 1, 2,…, l and i = 1, 2, …, nh.
3.2.1 Existing PCA (OLS-PCA based approach) based index methodology for disaggregated survey data
Existing PCA-based index methodology for disaggregated survey data is based on the Ordinary Least Squares (OLS) estimator of which assumes that the data is collected using a simple random sampling and does not include survey weight in its calculation. The ordinary least squares estimator of ∑yy is given as
where, ȳs = ∑h∑iyhi/n. The OLS estimator of ∑yy is used for the development of PCA-based index method on sampled data. For that let us assume that is a real positive definite matrix whose non-zero eigenvalues are λ1yy > λ2yy > λ3yy ... > λpyy and the corresponding eigenvectors are γ1yy, γ2yy, γ3yy...γpyy. For distinct (j =1, 2, 3,…,p), a (p × p) orthogonal matrix can be formed, where
Γ matrix diagonalizes matrix such that
where A = diag = .
Now let us consider an orthogonal transformation of y such that
where PC1yy, PC2yy, PCpyy are the p components of P and are called principal components [28].
The composite index corresponding to ith sample unit of hth subpopulation is given as
where the are principal component scores of corresponding to the sample unit ∀ h = 1, 2,…, l; i=1,2,…,nh; j = 1, 2,…,p.
The average of within hth subpopulation gives the composite index value for hth subpopulation as
The composite index values of subpopulations are normalized as
The ranking of l subpopulations is determined by the normalized composite index (CIh) where a value of 1 represents the highest rank and a value of 0 represents the lowest rank. The commonly used OLS-PCA based index methodology which relies on the Ordinary Least Squares (OLS) estimator, fails to incorporate survey weights in data collected through complex survey designs. This omission of survey weights results in a biased estimate of variance covariance matrix in commonly used OLS-PCA-based index methodology leading to biased eigenvalues, indices and thereby erroneous rankings of subpopulations. In the subsequent section, a Survey-Weighted (SW) estimator-based index method is proposed which includes the survey weight present in survey data.
3.2.2 Proposed survey weighted PCA (SW-PCA based approach) based index methodology for disaggregated survey data
The Survey Weighted (SW) estimator of Population Variance Covariance matrix given by Skinner et al. [29] and Smith et al. [30] is
where, .
The SW estimator of is used for the development of SW-PCA based index methods. For that let us assume that the is a real positive definite matrix whose non-zero eigenvalues are λ1yyw > λ2yyw > λ3yyw...λpyyw and the corresponding eigenvectors are γ1yyw, γ2yyw, γ3yyw...γpyyw. For distinct (j =1, 2, 3,…,p), a (p × p) orthogonal matrix can be formed, where
Γ matrix diagonalizes matrix such that
where A = diag (λ1yyw, λ2yyw, λ3yyw..., λpyyw) =
Now let us consider an orthogonal transformation of y such that
where PC1yyw, PC2yyw, PCpyyw are the p components of P and are called principal components [28].
The composite index corresponding to ith sample unit of hth subpopulation is given as
where the are principal component scores of corresponding to the sample unit ∀ h = 1, 2,…, l; i= 1,2,…,nh; j = 1, 2,…,p.
The average of within hth subpopulation gives the composite index value for hth subpopulation as
The composite index values of subpopulations are normalized as
The ranking of l subpopulations is determined by the normalized composite index (CIh) where a value of 1 represents the highest rank and a value of 0 represents the lowest rank. In the next section of the simulation study, we compare the existing OLS-PCA based index methodology for disaggregated survey data and proposed Survey Weighted PCA (SW-PCA) based Index methodology for disaggregated survey data with respect to PVC-PCA based index method on population data.
4 Simulation study
4.1 Population generation and sample extraction
To evaluate the empirical performance of the developed methodology, a simulation study has been conducted using artificially generated data. A population of N = 100,000 units was generated using multivariate normal distribution. The population consists of twelve indicator variables denoted by y = (y1, y2,…, y12) and one design variable z which is the sum of all the indicator variables. Thus, the population data becomes x = (y′, z) where the linearity and homoscedasticity assumptions of the variables are satisfied. The mean vector uy and variance-covariance matrix (Σyy) of twelve indicator variables were taken similar to that being estimated from the NSS 68th Round data for all of India on the twelve sets of variables. The details of the mean vector and variance covariance matrix of the variables are given in Tables 1, 2 respectively.

Table 1. Mean of variables considered for population data generation.

Table 2. Variance covariance matrix of variables considered for population generation.
This population was then stratified into five strata of equal size based on the ordered z-values, the first stratum containing the 20,000 units with the smallest z-values and so on. A sample of size 2,000 units was drawn from this population following U-shaped allocation of sample size from the strata. The allocated sample sizes in the strata are presented in Table 3. The Monte Carlo simulation was run S = 5,000 times. A simulation study was carried out in R software.
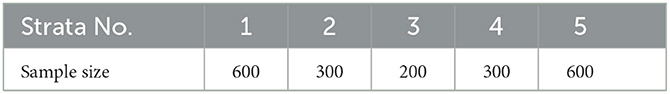
Table 3. Stratum sample sizes.
Both OLS-PCA and SW-PCA based index were computed using the disaggregated sample data. The PVC-PCA based Index was also computed using the disaggregated population data. The performance of OLS-PCA and SW-PCA based indices on disaggregated sampled data is compared with the PVC-PCA based index developed from disaggregated population data.
4.2 Comparative analysis of proposed SW-PCA based index and the existing OLS-PCA based index methodology for disaggregated survey data with respect to PVC-PCA based index for disaggregated population data
4.2.1 Eigenvalues comparison
In the context of principal component analysis (PCA), eigenvalues are used to determine the amount of variance explained by each principal component. Therefore the eigenvalues are computed from ordinary least squares (OLS) estimator , survey-weighted (SW) estimator and the population parameter to compare the efficiency of existing OLS-PCA based index and SW-PCA based index on disaggregated survey data with respect to PVC-PCA based index on disaggregated population data. The eigenvalues of (used for OLS-PCA based approach) and (used for SW-PCA based approach) are compared with the eigenvalues of population parameter Σyy (used for PVC-PCA based approach) as presented in Table 4. The results in Table 4 clearly illustrate that the first two principal components account for 83.92 percent of the total variation present in the population. This highlights the significant contribution of these components in the development of the index. Additionally, the standard deviation of the eigenvalues for the first two principal components is lower in the case of SW-PCA compared to OLS-PCA.
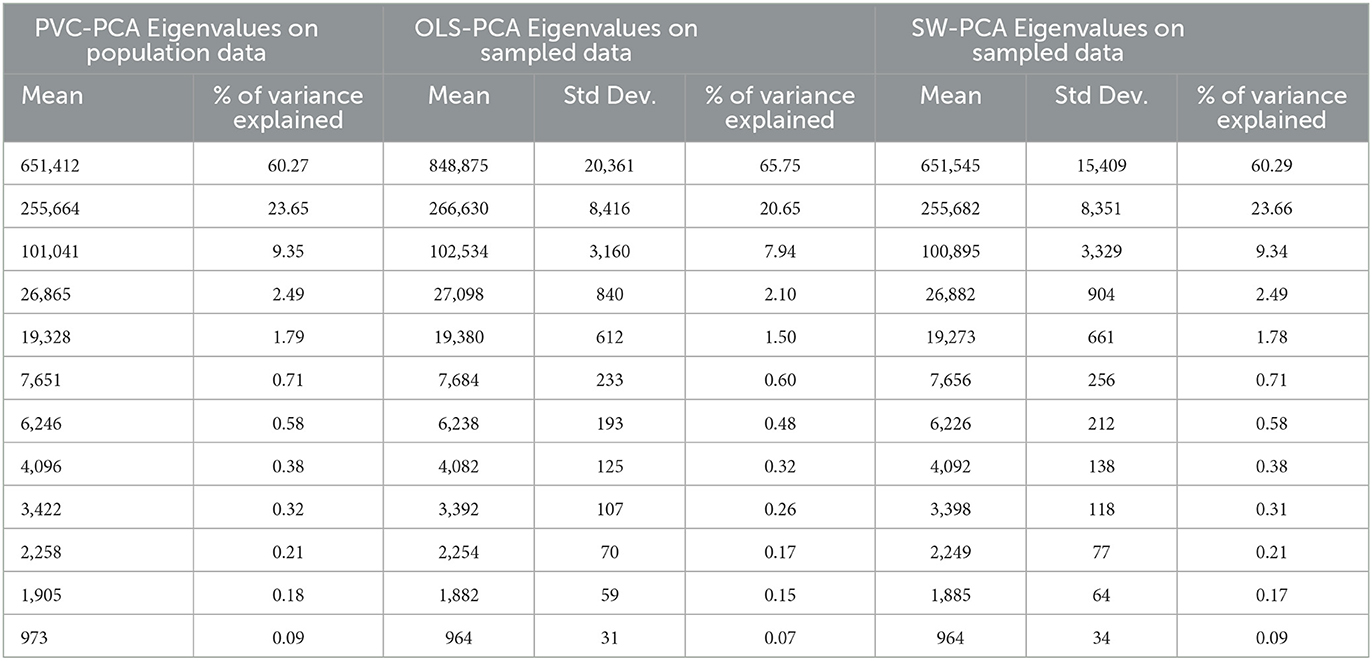
Table 4. Eigen value comparison of OLS-PCA and SW-PCA based index method on sampled data with respect to PVC-PCA based index on population data.
The bias of the eigenvalues of (OLS-PCA) and (SW-PCA) estimator are compared with the eigenvalues of population parameter Σyy (PVC-PCA) in Figure 1.
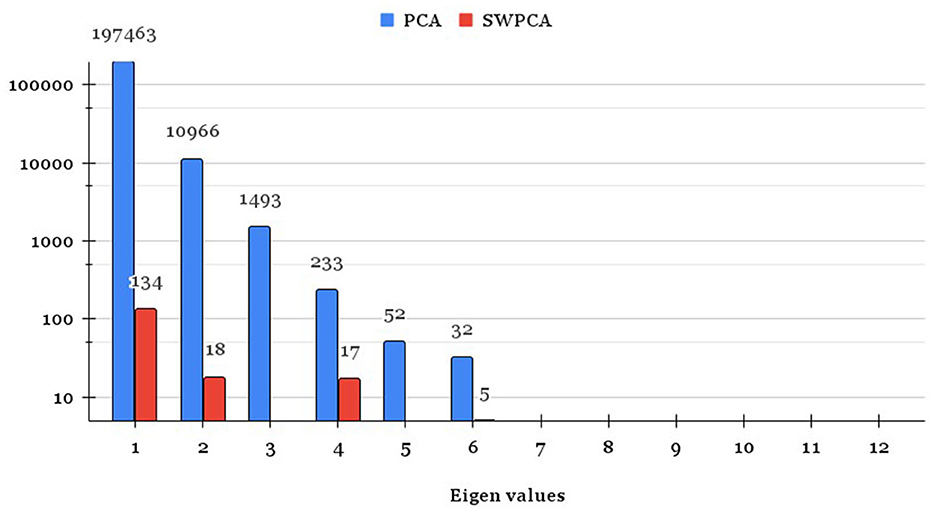
Figure 1. Bias of eigenvalues of OLS-PCA and SW-PCA based index method.
Figure 1 shows that the bias of most of the eigenvalues of (SW-PCA) estimator is lesser in comparison to the existing (OLS-PCA) estimator with respect to population parameter Σyy (PVC-PCA), especially for the eigenvalues which are having a major contribution to the total variation of the data. From the bias and standard deviation of eigenvalues of OLS-PCA and SW-PCA on sampled data with respect to PVC-PCA on population data, we can conclude that the SW-PCA method on sampled data addresses the issue of representativeness and its eigenvalues are nearer to eigenvalues of PVC-PCA based index method of population by incorporating the weights attached to each sampling unit. Since eigenvalues play a crucial role in index construction methods, Figure 1 and Table 4 lead to the conclusion that the SW-PCA-based index exhibits lower bias and higher efficiency compared to the existing OLS-PCA-based index for survey data referring PVC-PCA based index method on population data.
4.2.2 Eigenvectors comparison
In principal component analysis (PCA), eigenvectors are also generated by each principal component which are further used in the development of PCA scores. Therefore the eigenvectors are computed from the Ordinary Least Squares (OLS) estimator , the Survey-Weighted (SW) estimator and the population parameter to compare the efficiency of existing OLS-PCA based index and SW-PCA based index on disaggregated survey data with respect to PVC-PCA based index on disaggregated population data. The eigenvectors of (used for OLS-PCA based approach) and (used for SW-PCA based approach) are compared with the eigenvectors of population parameter Σyy (used for PVC-PCA based index on disaggregated population data) as presented in Supplementary Table 1. The bias of all the elements of eigenvectors of the first two principal components which contribute 83.92 percent of the total variation is lesser in the case of (SW-PCA) in comparison to Σyy (OLS-PCA method) referring eigenvector of population parameter Σyy (PVC-PCA) indicating the efficiency of SW-PCA based index method. Table 5 presents the average bias and average standard deviation of the elements of eigenvectors and it can be seen from Table 5 that the bias and standard deviation of SW-PCA is lesser than OLS-PCA for all the eigenvectors. Therefore we can conclude that the SW-PCA method on sampled data addresses the issue of representativeness and its eigenvectors are nearer to the eigenvectors of the PVC-PCA based index method of population by incorporating the weights attached to each sampling unit.
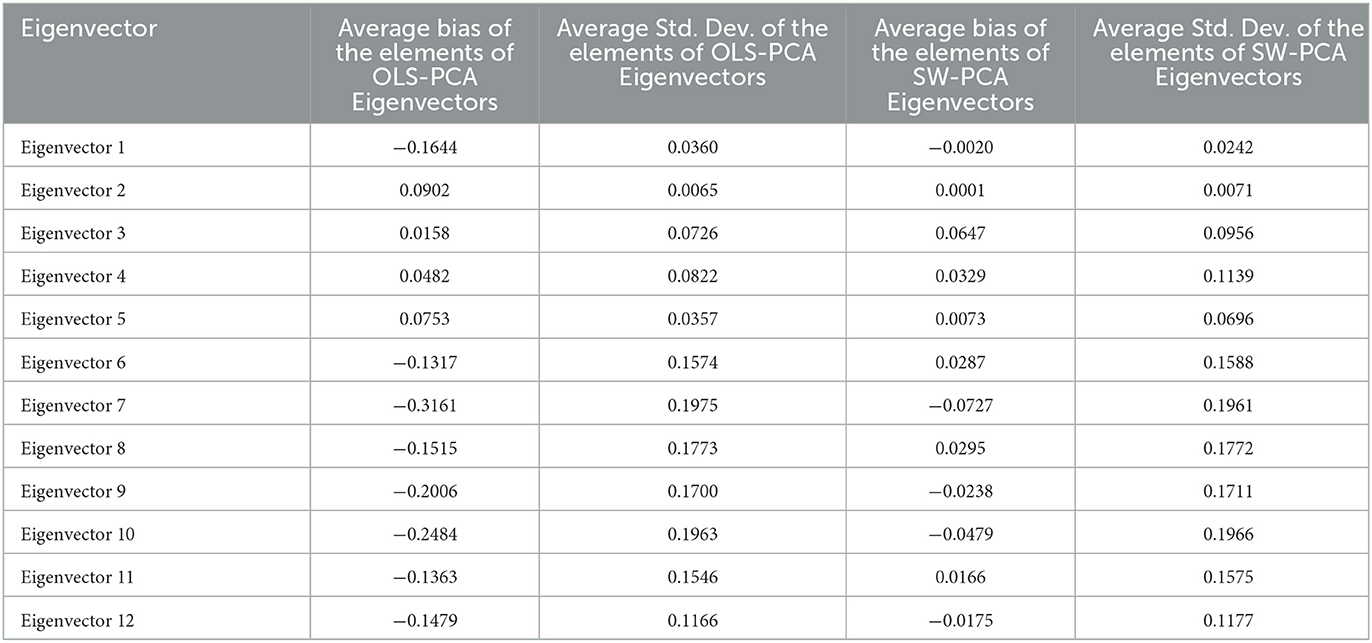
Table 5. Average bias and standard deviation of the elements of OLS-PCA and SW-PCA eigenvectors with respect to PVC-PCA based index on population data.
4.2.3 Comparison of percentage of variance explained by principal components
In this section, the percentage of variance explained by eigenvalues of existing OLS-PCA and proposed SW-PCA based method on disaggregated sampled data are compared with respect to PVC-PCA based index on population data. Table 6 and Figure 2 shows that the absolute bias of the percentage of variance explained by all the eigenvalues of Ordinary Least squares Estimator (used for OLS-PCA based index on survey data) is higher in comparison to the bias of Survey Weighted estimator (used for SW-PCA based index on survey data) on survey data which indicates that percentage of variance explained by the eigenvalues of survey weighted estimator are more representative to the percentage of variance explained by the population variance covariance matrix Σyy (used for PVC-PCA index on population data). This observation suggests that SW-PCA is more efficient than the existing OLS-PCA based index for sampled data with respect to PVC-PCA based index method on population data, demonstrating its effectiveness in capturing the underlying structure of the data.
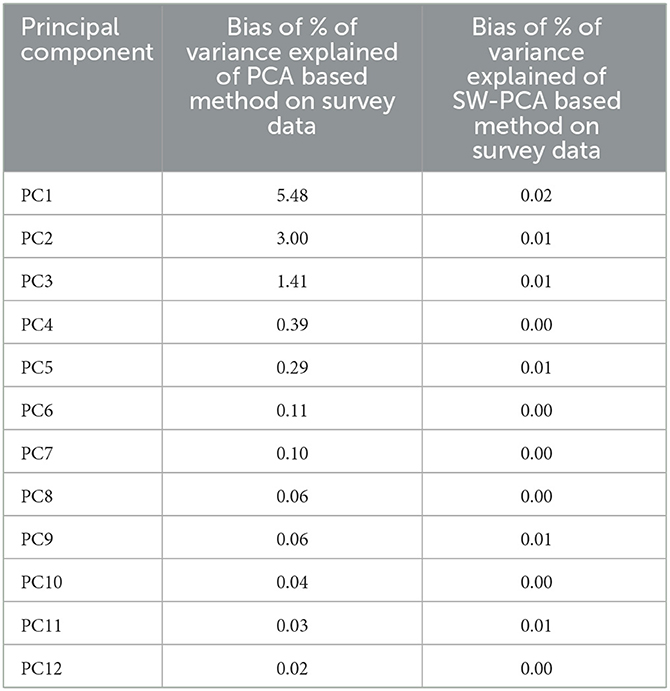
Table 6. Bias of % of variance explained of PCA based method on disaggregated survey data.
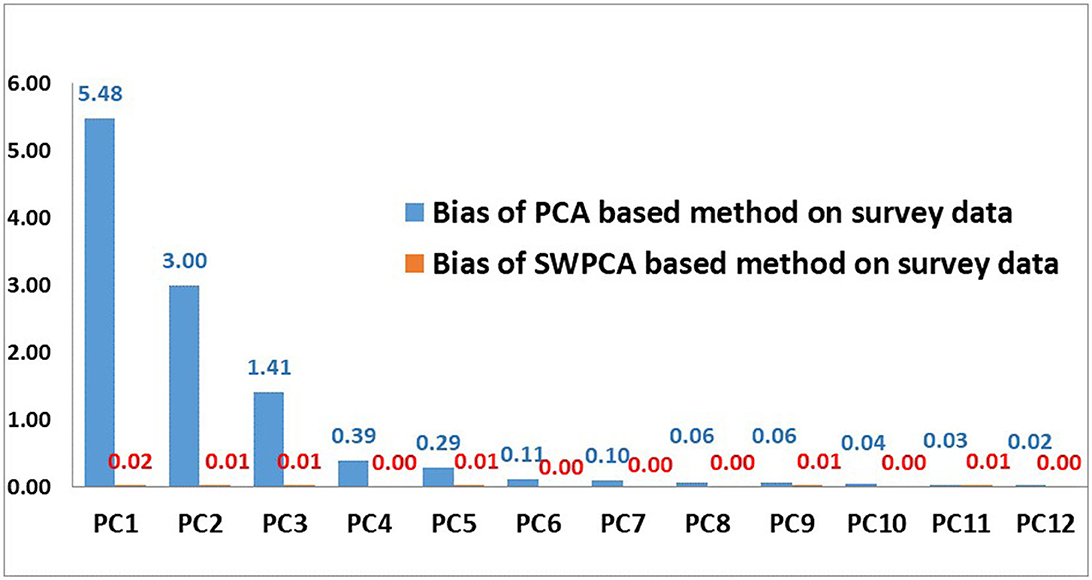
Figure 2. Bias of % of variance explained by principal components of PCA and SW-PCA based method.
4.2.4 Comparison of efficiency of existing OLS-PCA and proposed SW-PCA based index methodology of survey data with respect to PVC-PCA based index methodology on population data
Developed indices based on existing OLS-PCA and proposed SW-PCA based index for disaggregated sampled survey data are compared with PVC-PCA index based on disaggregated population data using the criterion of percentage Relative Root Mean Square Error (RRMSE). RRMSE is the root mean squared error normalized by the root mean square value where each residual is scaled against the actual value. In this study, the residuals are the difference of the normalized composite index values calculated by the index methodologies for disaggregated sampled survey data (OLS-PCA and SW-PCA index for survey data) and PVC-PCA based index methodology on population data of l subpopulations. RRMSE of OLS-PCA and SW-PCA index for survey data examines the convergence of OLS-PCA and SW-PCA index with PVC-PCA based index respectively. RRMSE is defined by
where are the computed index values from disaggregated sampled data by existing OLS-PCA or proposed SW-PCA based index methodologies while θi are the index values of PVC-PCA based index methodology for disaggregated population data corresponding to ith strata/subpopulation respectively, l denotes total number of strata and S denotes the number of simulation run. The values of percentage RRMSE of different methods are reported in Table 7.
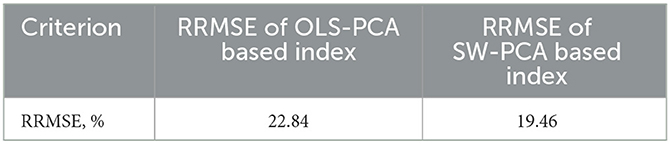
Table 7. Percentage RRMSE of the existing OLS-PCA and proposed SW-PCA based index method for sampled/survey data with respect to PVC-PCA based index on population data.
The results show that the value of percentage RRMSE is higher for the existing OLS-PCA based Index as compared to the proposed SW-PCA based Index on disaggregated sampled survey data. Is signifies that the proposed SW-PCA based index on survey data is better representative and more converging to PVC-PCA based index for the population in comparison to the existing OLS-PCA based index on survey data. In other words, the proposed SW-PCA based Index is more efficient than the existing OLS-PCA based Index for sampled data collected through complex survey design referring PVC-PCA based index on population data. Therefore, it is concluded from the simulation study that the proposed SW-PCA based Index should be used for the development of index for data collected through survey designs. The simulation study establishes that the survey-weighted PCA-based index for sample data is more representative to the PCA based index on population data and thereby should be recommended for complex survey designs where the weight is attached to each sampling unit rather than the existing OLS estimator based PCA index for survey data.
4.3 Conclusion of simulation study
Basically, under an ideal situation, we should carry the complete enumeration of the population rather than a survey to get the exact estimate of population parameters which we can get from the PVC-PCA based index methodology on population data in our case study. But in practical situations, we carry the survey rather than the complete enumeration due to resource constraints. Under these situations, we can calculate different estimators like OLS-PCA and proposed SW-PCA based index of population parameter i.e., PVC-PCA based index in our case study. However it is recommended to use BLUE estimators (best linear unbiased estimators) having minimum divergence from the population parameter. In this Section 3.2.1, 3.2.2, 3.2.3 show that the SW-PCA based index has a lesser bias in comparison to OLS-PCA based index and Section 3.2.4 shows that the SW-PCA based index is converging more than OLS-PCA based index to PVC-PCA based index on population data i.e., population parameter.
5 Real data case study
5.1 Food consumption index for different states of India using NSS data (68th round)
In this section, we have applied the existing OLS-PCA based index methodology and our proposed SW-PCA based index methodology on Household Consumer Expenditure Survey (HCES), NSS 68th Round survey data collected through complex design. NSS 68th Round data is collected from all the states of India using a Stratified Multistage Sampling Design. Households are the primary units of the survey and states are the subjects on which indices and ranking based on indices is developed.
Household Consumer Expenditure Survey (HCES), NSS 68th Round data contains information on twelve variables of consumption, i.e., Cereals (Y1), Pulses & pulse products (Y2), Milk & milk products (Y3), Salt & sugar (Y4), Edible oil (Y5), Egg, fish & meat (Y6), Vegetables (Y7), Fruits (fresh) (Y8), Spices (Y9), Beverages (Y10), Served processed food (Y11), and Packaged processed food (Y12). These variables are assembled into a single quantity that has been termed as Food Consumption Index (FCI). The FCI may be used for ranking of the states within a country or ranking of districts within a state based on their consumption behavior. Therefore, FCIs are calculated for each of the sampled households within a state by combining the twelve variables of consumption using the PCA and SW-PCA based index. Then the FCIs of the households within a state are averaged to get the FCI score of the state. Finally, the FCI scores of the states are rescaled using the following formula
where, Rescaled FCIi is the rescaled FCI score of ith state, min(FCIi) and max(FCIi) are the minimum and maximum FCI score of the states respectively. Thus, the ranking of the states of India is done based on rescaled FCI scores. The rescaled FCI scores and ranks of the states using OLS-PCA and SW-PCA based index have been provided in Supplementary Table 2.
In this section, our aim is to show that there is a significant change in the ranking of states done through OLS-PCA and our proposed SW-PCA (Survey-Weighted estimator) based index methodology. Besides that, we have compared the ranking of states done through OLS-PCA and our proposed SW-PCA based index methodology with respect to Per Household Total Consumption (PHTC), Average Daily Intake Per Capita of Calories (ADIPCC), and Average Daily Intake Per Capita of Protein (ADIPCP) of the states of India. PHTC, ADIPCC, and ADIPCP are considered as references based on understanding that the ranking of states should converge with the PHTC, ADIPCC, and ADIPCP because the ranking of states is done baed on consumption variables which are used to derive Per Household Total Consumption, Average Daily Intake Per Capita of Calories and Average Daily Intake Per Capita of Protein. More the convergence, the more efficient will be the index methodology.
To evaluate the performance of the developed methodology, we have used the mean square deviation of ranks of states between Rescaled FCI and variables considered for consumption like PHTC, ADIPCC, and ADIPCP both for OLS-PCA and SW-PCA index methodology for survey data. Per household total consumption has been calculated from NSSO 68th round data, and average daily intake per capita of calories and average daily intake per capita of protein are obtained from NSSO 68th round report released by the Government of India. The ranking of states with respect to these variables associated with consumption is given in Supplementary Tables 3, 4.
The Mean square deviation of ranks is given as , where, Ri indicates the rank of ith state through the Index and Vi indicates rank of ith state with respect to variables considered for consumption like total consumption, per capita daily intake of calories and protein, and n is the total number of states used for comparison.
Figure 3 reveals that the mean square deviation of ranks in the case of SW-PCA based Index is smaller than the OLS-PCA based Index for each of the consumption variables considered for comparison. The ranking of states from SW-PCA based index method converges more to consumption variables i.e., Per Household Total Consumption, Average Daily Intake Per Capita of Calories and Average Daily Intake Per Capita of Protein. Therefore, the proposed SW-PCA based index is efficient in ranking the states in comparison to OLS-PCA based Index which does not utilize the survey information available in survey data.
Figure 3. Mean square deviation of ranks of OLS-PCA and SW-PCA based indices with respect to variables considered for consumption.
Figure 4 shows the Food Consumption Index using OLS-PCA and SW-PCA based index methods in which the states are classified into four groups: (i) better performing states having food consumption index score range 0.75–1; (ii) moderate performing states having food consumption index score range 0.5–0.75; (iii) poorly performing states having food consumption index score range 0.25–0.50; and (iv) worst performing states having food consumption index score range 0.0–0.25. There are significant changes in the grouping of states when comparing both the index methods which is clear from Figure 4.
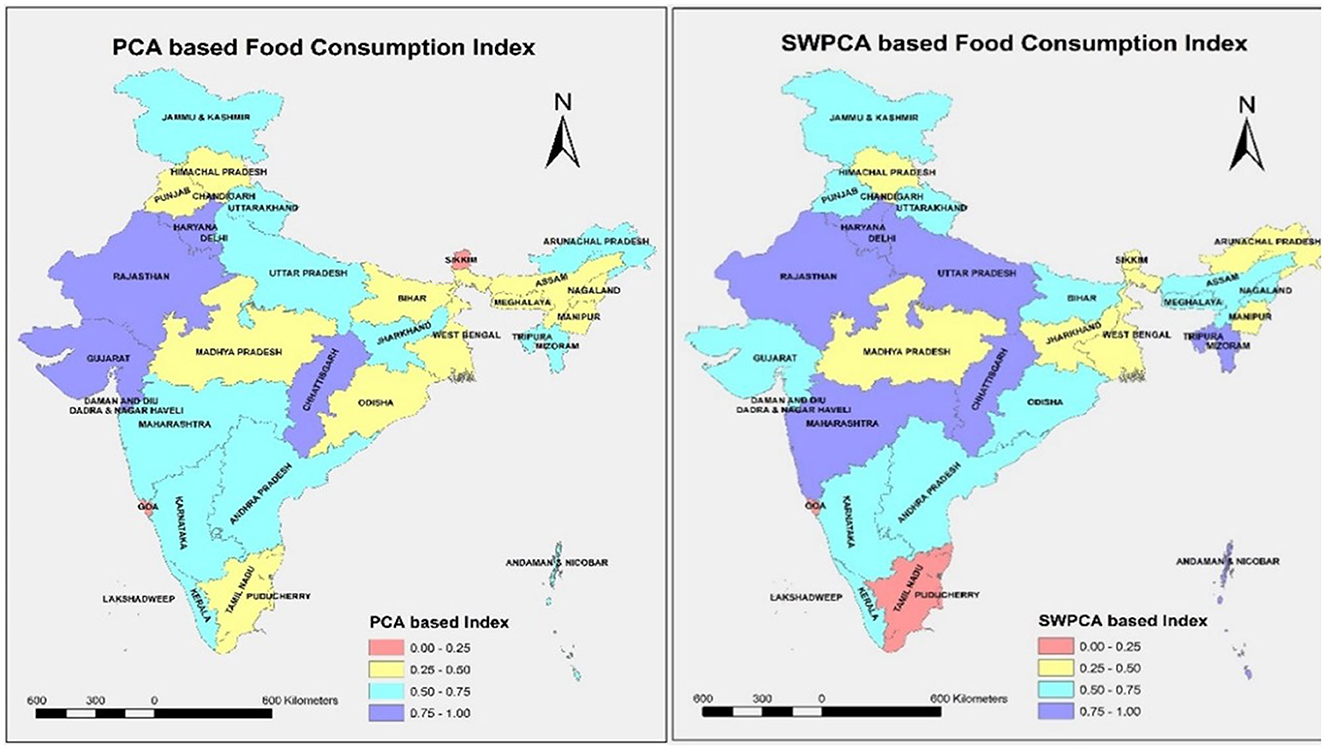
Figure 4. State-wise food consumption Index using OLS-PCA and SW-PCA based index methods.
Figure 5 portrays the cluster dendrogram, which represents the hierarchal relationship between the states under consideration based on OLS-PCA and SW-PCA based indexes. The states can be grouped into three groups (low, medium, and high-performing states) based on the extent of food consumption. It was discovered that the cluster membership of 23 states/union territories remained constant, whereas the cluster membership of 12 states/union territories changed. Therefore, we can conclude from the Figures 4, 5 that there are significant changes in the ranking of states due to the survey weights, and it is recommended to use the ranking of subpopulations based on SW-PCA based index.
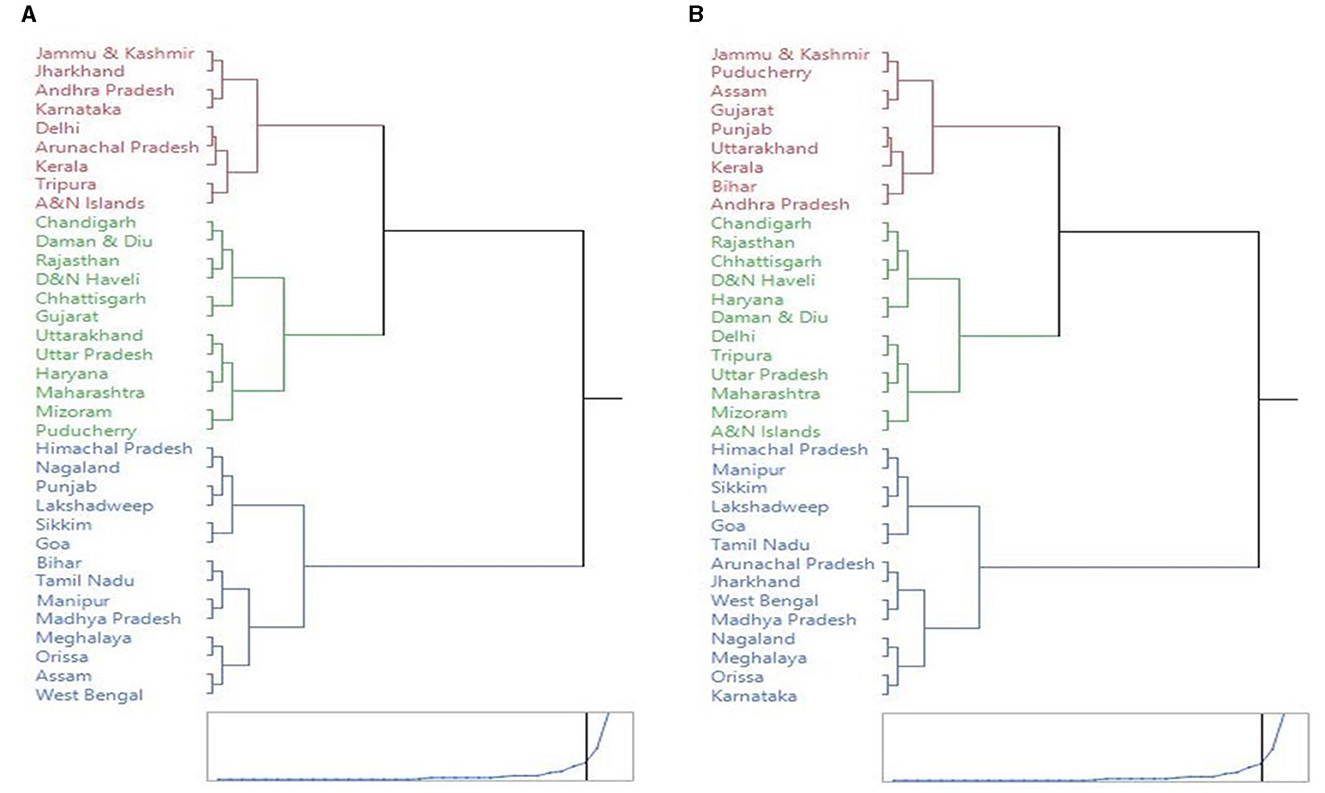
Figure 5. Cluster dendogram of states based on PCA and SW-PCA based index ranking using minimum ward's distance. (A) PCA method. (B) SW-PCA method.
Using the clustering of SW-PCA indices, the low-performing states and union territories in terms of the Food Consumption Index are Arunachal Pradesh, Goa, Himachal Pradesh, Jharkhand, Karnataka, Lakshadweep, Manipur, Meghalaya, Madhya Pradesh, Nagaland, Orissa, Sikkim, Tamil Nadu, and West Bengal. The mean value of the Food Consumption Index was 0.41 for the first group. Andhra Pradesh, Assam, Bihar, Gujarat, Jammu & Kashmir, Kerala, Puducherry, Punjab, and Uttarakhand are the medium-performing states with an average score of 0.63, while Andaman & Nicobar Islands, Chandigarh, Chhattisgarh, Daman & Diu, Delhi, Dadar & Nagar Haveli, Haryana, Maharashtra, Mizoram, Rajasthan, Tripura, and Uttar Pradesh are the best-performing states in terms of food consumption index, with an average food consumption index value of 0.41.
6 Conclusion
The research paper highlights a critical gap in the current methodology for constructing composite indices from survey data. The existing OLS-PCA based index methodology for survey data relies on the Ordinary Least Squares (OLS) estimator of the variance-covariance matrix, assuming that data is collected using simple random sampling, ignoring the complexities of real-world survey designs involving survey weights. The current OLS-PCA based index methodology for survey data does not incorporate these survey weights, leading to biased and unreliable results and compromising the quality and validity of survey findings.
In response to this challenge, the proposed Survey Weighted PCA (SW-PCA) based Index methodology represents a significant advancement. By explicitly accounting for survey weights and addressing multicollinearity issues, SW-PCA offers a more accurate and reliable way to construct composite indices from sample data collected through complex sampling designs. It ensures that the resulting indices provide an unbiased representation of the underlying population, improving the overall quality of survey-based research.
Our simulation study demonstrated that the SW-PCA based index outperforms indices that do not consider survey weights, indicating its higher efficiency. To validate the proposed methodology, we applied it to a real dataset to construct a food consumption index for different states in India. The results revealed a significant change and improvement in the ranking of states for the food consumption index when survey weights were incorporated in the index development process.
Based on the findings of this study, we can conclude that neglecting to incorporate survey weights in the construction of indices using survey data results in a loss of representativeness, leading to erroneous inferences and conclusions.
Data availability statement
Publicly available datasets were analyzed in this study. This data can be found here: https://microdata.gov.in/nada43/index.php/catalog/127/study-description#::~text=The%20NSS%2068th.,(ii)%20Employment%20and%20Unemployment.
Author contributions
DS: Conceptualization, Methodology, Project administration, Software, Visualization, Writing—original draft, Writing—review and editing. PB: Conceptualization, Data curation, Validation, Visualization, Writing—review and editing. RK: Conceptualization, Investigation, Methodology, Supervision, Validation, Writing—review and editing. TA: Conceptualization, Validation, Visualization, Writing—review and editing.
Funding
The author(s) declare that no financial support was received for the research, authorship, and/or publication of this article.
Conflict of interest
The authors declare that the research was conducted in the absence of any commercial or financial relationships that could be construed as a potential conflict of interest.
Publisher's note
All claims expressed in this article are solely those of the authors and do not necessarily represent those of their affiliated organizations, or those of the publisher, the editors and the reviewers. Any product that may be evaluated in this article, or claim that may be made by its manufacturer, is not guaranteed or endorsed by the publisher.
Supplementary material
The Supplementary Material for this article can be found online at: https://www.frontiersin.org/articles/10.3389/fams.2023.1274530/full#supplementary-material
Footnotes
1. ^Healthy States, Progressive India: Report on the ranks of states and union Territories. Report (2019-20) by Niti Ayog, Goverment of India.
References
1. Wiesmann D. A Global Hunger Index: Measurement concept, ranking of countries, and trends. FCND discussion paper 212, IFPRI. (2006).
2. Athreya VB, Bhavani RV, Anuradha G, Gopinath R, Velan AS. Report on the state of food insecurity in rural India. Published by M. S. Swaminathan Research Foundation. ISBN: 81-88355-06-2. (2008).
3. Gentilini U, Webb P. How are we doing on poverty and hunger reduction? A new measure of country performance. Food Policy. (2008) 33:521–32. doi: 10.1016/j.foodpol.2008.04.005
4. Hastings AD. From human development to human security: A prototype, human security index. UNESCAP working paper (WP/09/03). (2009).
5. Athreya VB, Rukmani R, UNESCAP working paper. Report on the state of food insecurity in urban India. Published by M. S. Swaminathan Research Foundation. ISBN: 978-81-88355-21-1. (2010).
6. Krishnamurthy PK, Lewis K, Choularton RJ. A methodological framework for rapidly assessing the impacts of climate risk on national-level food security through a vulnerability index. Global Environ Change. (2014) 25:121–32. doi: 10.1016/j.gloenvcha.2013.11.004
7. Food insecurity and climate change technical report. (2015). Available online at: https://www.metoffice.gov.uk/food-insecurity-index/resources/HCVI_website_technical_report_v4.pdf (accessed September 22, 2023).
8. Global food security index. (2016). An annual measure of the state of global food security. A report from the Economist Intelligence Unit, The Economist (www.economist.com).
9. United Nations Development Programme (UNDP). Human Development Report 2021/2022: Uncertain Times, Unsettled Lives. Shaping Our Future in a Transforming World. (2022).
10. Alkire S, Kanagaratnam U, Suppa N. The global Multidimensional Poverty Index (MPI) 2023 country results and methodological note. (2023). Available online at: https://hdr.undp.org/system/files/documents/hdp-document/2023mpireportenpdf.pdf (accessed September 22, 2023).
11. Von Grebmer K, Bernstein J, Resnick D, Wiemers M, Reiner L, Bachmeier M, et al. Global Hunger Index: Food Systems Transformation and Local Governance. Bonn; Dublin: Welt Hunger Hilfe CONCERN Worldwide (2022).
12. Narain P, Rai SC, Sarup S. Statistical evaluation on development on socio-economic front. J Ind Soc Ag Stat. (1991) 43:329–45.
13. Narain P, Sharma SD, Rai SC, Bhatia VK. Regional dimensions of disparities in crop productivity in Uttar Pradesh. J Ind Soc Ag Stat. (2001) 54:62–79.
14. Narain P, Sharma SD, Rai SC, Bhatia VK. Dimensions of regional disparities in socio-economic development of Madhya Pradesh. J Ind Soc Ag Stat. (2002) 55:88–107.
15. Narain P, Sharma SD, Rai SC, Bhatia VK. Evaluation of economic development at micro level in Karnataka. J Ind Soc Ag Stat. (2003) 56:52–63.
16. Narain P, Sharma SD, Rai SC, Bhatia VK. Estimation of socio economic development in hilly states. J Ind Soc Ag Stat. (2004) 58:126–35.
17. Narain P, Sharma SD, Rai SC, Bhatia VK. Estimation of socio-economic development of different districts in Kerala. J Ind Soc Ag Stat. (2005) 59:48–55.
18. Narain P, Sharma SD, Rai SC, Bhatia VK. Statistical evaluation of social development at district level. J Ind Soc Ag Stat. (2007) 61:216–26.
19. Rai A, Sharma SD, Sahoo PM, Malhotra PK. Development of livelihood index for different agro-climatic zones of India. Agric Econ Res Rev. (2008) 21:173–82.
20. Dahal H. Factor analysis for soil test data: a methodological approach in environment friendly soil fertility management. J Agric Environ. (2007) 8:8–19. doi: 10.3126/aej.v8i0.722
21. Kumar M. Study on development indices and their sensitivity analysis. M.Sc. thesis, ICAR-Indian Agricultural Research Institute, New Delhi. (2008).
22. Raja TA, Tawheed Y. Statistical evaluation of socio-economic development with a new composite index of Kashmir valley. Int Res J Agric Econ Stat. (2014) 5:317–20. doi: 10.15740/HAS/IRJAES/5.2/317-320
23. Chao YS, Wu CJ. Principal component-based weighted indices and a framework to evaluate indices: results from the Medical Expenditure Panel Survey 1996 to 2011. PLoS ONE. (2017) 12:e0183997. doi: 10.1371/journal.pone.0183997
24. Senna LDD, Maia AG, Medeiros JDFD. The use of principal component analysis for the construction of the Water Poverty Index. RBRH. (2019) 24:84. doi: 10.1590/2318-0331.241920180084
25. Zhou X, Tang X, Zhang R. Impact of green finance on economic development and environmental quality: a study based on provincial panel data from China. Environ Sci Pollut Res. (2020) 27:19915–32. doi: 10.1007/s11356-020-08383-2
26. Lieberman-Cribbin W, Tuminello S, Flores RM, Taioli E. Disparities in COVID-19 testing and positivity in New York City. Am J Prev Med. (2020) 59:326–32. doi: 10.1016/j.amepre.2020.06.005
27. Mohammed A, Zayed T, Nasiri F, Bagchi A. Asset management-based resilience index formulation for pavements via principal components analysis. Constr Innov. (2022). doi: 10.1108/CI-04-2022-0083
28. Singh D. Principal component analysis in modelling lactation milk yield in Haryana cows. M.Sc. Thesis, Chaudhary Charan Singh Haryana Agricultural University, Hisar. (2009).
29. Skinner CJ, Holmes DJ, Smith TMF. The effect of sample design on principal component analysis. J Am Stat Assoc. (1986) 81:789–98. doi: 10.1080/01621459.1986.10478336
Keywords: multicollinearity, survey weight, food consumption index, principal component, index, household consumer expenditure survey (NSS 68th Round)
Citation: Singh D, Basak P, Kumar R and Ahmad T (2023) On the methodological framework of composite index under complex surveys and its application in development of food consumption index for India. Front. Appl. Math. Stat. 9:1274530. doi: 10.3389/fams.2023.1274530
Received: 08 August 2023; Accepted: 29 September 2023;
Published: 17 November 2023.
Edited by:
Bo Wang, University of Leicester, United KingdomCopyright © 2023 Singh, Basak, Kumar and Ahmad. This is an open-access article distributed under the terms of the Creative Commons Attribution License (CC BY). The use, distribution or reproduction in other forums is permitted, provided the original author(s) and the copyright owner(s) are credited and that the original publication in this journal is cited, in accordance with accepted academic practice. No use, distribution or reproduction is permitted which does not comply with these terms.
*Correspondence: Raju Kumar, cmFqdS5rdW1hckBpY2FyLmdvdi5pbg==