 Masahiro Okada
 Hiroshi Ito
- 1National Research Institute of Police Science, Kashiwa, Japan
- 2Faculty of Design, Kyushu University, Fukuoka, Japan
Introduction: Speaker recognition has been performed by considering individual variations in the power spectrograms of speech, which reflect the resonance phenomena in the speaker's vocal tract filter. In recent years, phase-based features have been used for speaker recognition. However, the phase-based features are not in a raw form of the phase but are crafted by humans, suggesting that the role of the raw phase is less interpretable. This study used phase spectrograms, which are calculated by subtracting the phase in the time-frequency domain of the electroglottograph signal from that of speech. The phase spectrograms represent the non-modified phase characteristics of the vocal tract filter.
Methods: The phase spectrograms were obtained from five Japanese participants. Phase spectrograms corresponding to vowels, called phase spectra, were then extracted and circular-averaged for each vowel. The speakers were determined based on the degree of similarity of the averaged spectra.
Results: The accuracy of discriminating speakers using the averaged phase spectra was observed to be high although speakers were discriminated using only phase information without power. In particular, the averaged phase spectra showed different shapes for different speakers, resulting in the similarity between the different speaker spectrum pairs being lower. Therefore, the speakers were distinguished by using phase spectra.
Discussion: This predominance of phase spectra suggested that the phase characteristics of the vocal tract filter reflect the individuality of speakers.
1 Introduction
Identifying individuals using speech is crucial for biometric authentication in terms of security measures, transcription of the minutes of meetings, and identification of speakers in phone fraud. Various techniques have been developed for identifying speakers using statistics and machine learning with large amounts of data. For example, the i-vector, a de facto standard feature representing speaker individuality, is calculated from large speech data using factor analysis assuming a Gaussian mixture model. Another example is the x-vector, which is extracted using a time-delay neural network with a statistical pooling layer [1–3]. In these studies, the speech signals were not directly used but were transformed into acoustic features before they were input into machines. Although acoustic signals contain both power (squared magnitude) and phase in the time and frequency domains, most of these features are derived from power alone. While phase is rarely used owing to the difficulties in its interpretation [4, 5], power can be directly related to sound energy, which is interpretable as the volume of sounds. Most acoustic phenomena are related to sound energy in the form of resonance, where the sound energy is amplified at a certain frequency, such as in musical instruments and room reverberations. Therefore, the acoustical phenomena can be investigated by simply analyzing the power, even if the phase is discarded. In other words, we can conclude that acoustics represents a theoretical system based on power without a phase. However, discarding the phase would cause a lack of information obtained from acoustic signals. Similarly, speaker recognition conducted based only on power-based features would cause a lack of information, such as the speaker's individuality.
Recently, in addition to speaker recognition [6–8], research on acoustics has focused on the phases of acoustic signals in speech recognition [9], audio classification [5], and spoofing detection [10]. These studies defined the phase by using mathematical tools, such as the Fourier or Hilbert transform, and proposed the following phase-based features: phase differences between time frames, arg(Xm/Xm−1) [6], phase differences among harmonics of speech, [7], time-differential phase, dθ/dt [8], frequency-differential phase, −dφ/dω [9], phase transformed by complex trigonometric functions, exp(iφ) [5], and phase combined with log-magnitude, [10]. Here, Xm is the short-time Fourier transform (STFT) of speech signals with a frame index of time window m, is the phase of kth harmonics derived by fitting harmonic-structure-based signals [11], θ is the phase of Hilbert transform, φ is the phase of STFT, ω is the angular frequency, ϕ is the phase of Fourier transform, and X = |X| exp (iϕ) is the Fourier transform of speech signals. Such features can improve the performance by adapting the phase to tasks. The phase-based features have been used for speaker recognition and spoofed speech discrimination from genuine speech in recent past [12, 13].
However, these phase-based features are still less interpretable because they were crafted by humans. The phase should be used in its raw form without modification to understand its meaning and avoid the risk of unnecessary involvement of the human perspective. A classical reason for not using the raw phase is the phase ambiguity due to its 2π periodic nature. Therefore, in phase calculations, we must wrap the phase values to a range of 2π. The wrapping operation generates a discontinuity at 2π. The trigonometric functions in the phase-based features can remove the discontinuity in exchange for the use of the raw phase. In this study, circular averaging was applied to overcome the discontinuity [14]. Circular averaging helps calculate the raw phase despite the phase ambiguity.
Furthermore, a rapid change in phase with time prevents analyses of the raw phase. Because the typical frequency of speech signals is approximately 100 Hz or higher, the phase rotates over 100 times per second. These rotations appear noisy if the phase is visualized in the time-frequency domain [∠SX(t, ω) in Figure 1]. This problem has been resolved by differentiating phases with respect to time and frequency, or by calculating phase differences with respect to time frames and harmonics contained in the speech. However, these procedures would not allow the phase to be used in its raw form.
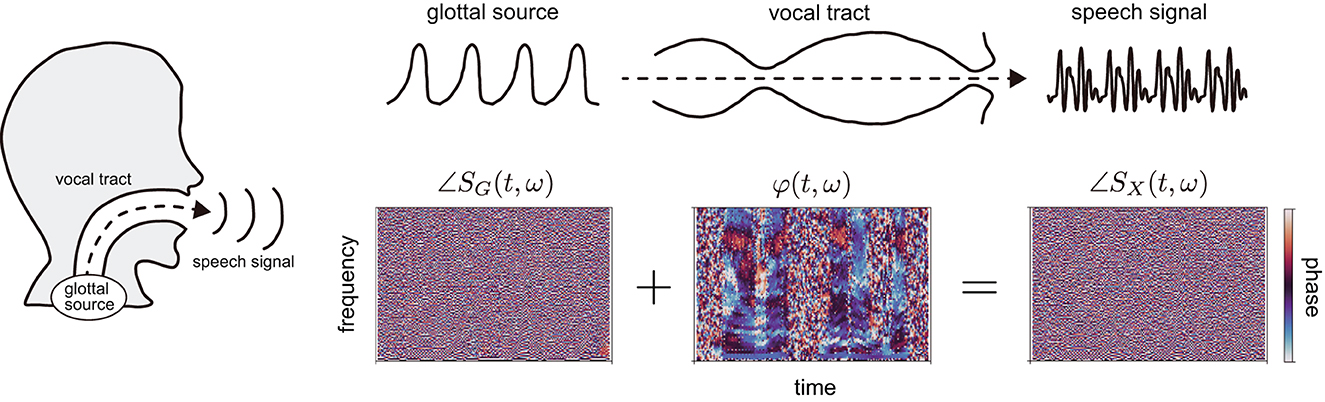
Figure 1. Speech production process and corresponding phases in the time-frequency domain. The glottal source generates a source signal, which goes through the vocal tract; the modified signal can be expressed as speech. Based on the phases of speech and glottal source signals, ∠SX(t, ω) and ∠SG(t, ω), respectively, we calculated phase spectrograms expressing the phase characteristics of vocal tract filter φ(t, ω), which reflect the motion of the vocal tract in utterances.
In a previous study, we proposed phase spectrograms [15], which allow us to observe the phase characteristics of the vocal tract filter in the time-frequency domain similar to power spectrograms [φ(t, ω) in Figure 1]. The phase spectrograms are calculated by subtracting the phase in the time-frequency domain of electroglottograph (EGG) signal from that of speech. The benefit of the phase spectrograms is the removal of the rapid phase rotations, making differentiating phase or calculating phase differences unnecessary. Therefore, we adopted the phase spectrograms to analyze the raw phase in this study.
Furthermore, the usage of phase spectrograms contributes to making the phase more interpretable in terms of speaker recognition because the phase characteristics of the vocal tract filter can detect fine differences in vocal tracts among speakers. Specifically, the phase characteristics of the vocal tract filter can take different values among different speakers despite having the same power characteristics [16], i.e., the utterance of the same vowels (Figure 2).
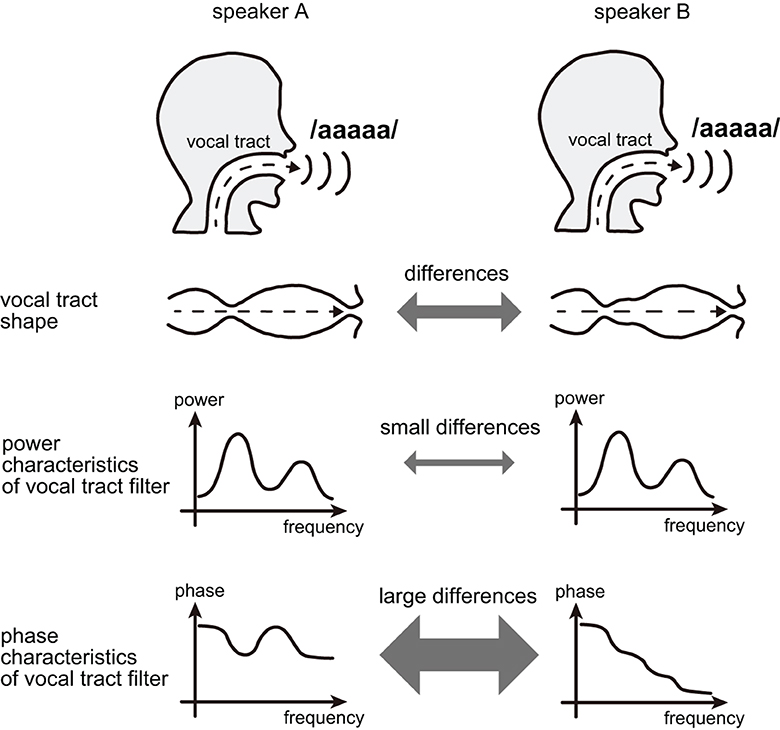
Figure 2. When different speakers utter the same vowel, the phase characteristics of the vocal tract filter may differ and reflect the speaker's individuality despite the similar power characteristics of the vocal tract filter.
In this study, we aimed to perform speaker recognition using phase spectrograms. However, this study analyzed data from a few speakers unlike the previous studies of speaker recognition [1–3], wherein extensive data were used. We analyzed homogeneous data limited by controlling measurement conditions, i.e., gender, age, and speaking style. Therefore, we investigated in the current research whether the phase characteristics of the vocal tract filter could discriminate the homogeneous speakers. Furthermore, by discriminating speakers based only on the raw phase, we considered the relationship between the raw phase and the speaker's individuality.
2 Materials and methods
2.1 Overview of speaker recognition procedure
We attempted to perform speaker recognition based solely on the phase characteristics of vocal tract filters. The procedure comprised three steps, i.e., calculating the phase spectrograms, deriving the averaged phase spectra, and evaluating the similarity between the spectra of individuals. The overview of the speaker recognition procedure is summarized in Figure 3.
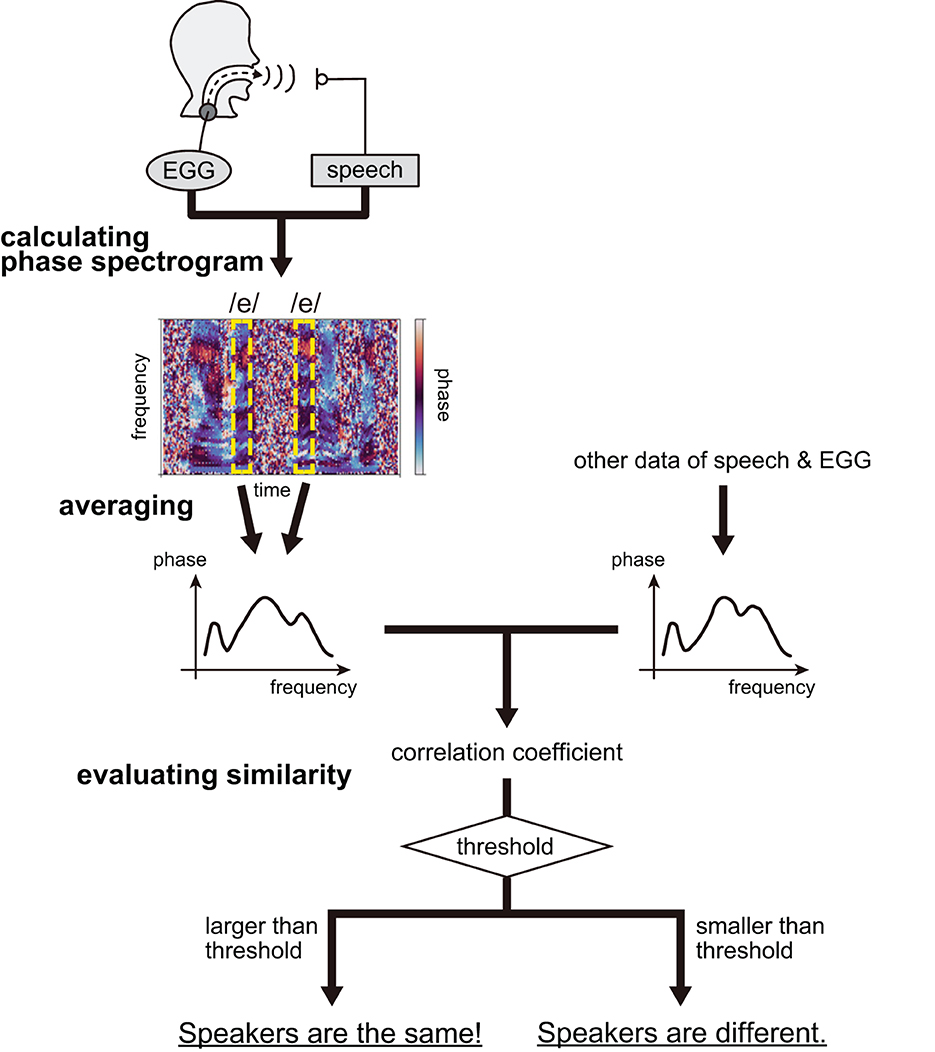
Figure 3. Speaker recognition procedure; the case of vowel /e/ is described for instance.
First, we calculated the phase spectrograms expressing the phase characteristics of the vocal tract filter, φ(t, ω), defined as:
where SX(t, ω) and SG(t, ω) denote the STFT of speech and EGG signals measured from speakers, respectively. It should be noted that speech is merely an output from the vocal tract filter and that the EGG signal approximates a glottal source signal, generated at the glottis, and is given as input to the vocal tract filter (Figure 1). Therefore, both signals can be used to construct the phase characteristics of a vocal tract filter. Here, EGG signals were adopted owing to simplicity of measurement, which requires the placement of electrodes outside the neck [17]. The signals were obtained from five Japanese males as they uttered Japanese sentences representing a proper balance of Japanese linguistic sounds, and repeated them five times. The recorded signals were then transformed using STFT. According to Equation (1), we calculated the phase spectrograms considering an argument of the STFT quotient of speech and EGG signals. Refer to our previous publication regarding the details on the calculation of phase spectrograms [15].
Next, considering that the phase spectrograms were robustly calculated for the vowels, we extracted the spectrograms corresponding to the time instances at which the vowels /e/, /a/, and /o/ existed from all Japanese sentences. The spectrograms lost time information, transforming into spectra and defining the phase spectra as φv(ω) = φ(τv, ω), where τv is the time instance of vowels. The spectra of a specific vowel were then circular-averaged within one of the five measurement repetitions to remove the effect of consonants before and after the vowel; this was achieved owing to phonetic balance in the sentences. The number of vowels used for averaging is listed in Table 1.
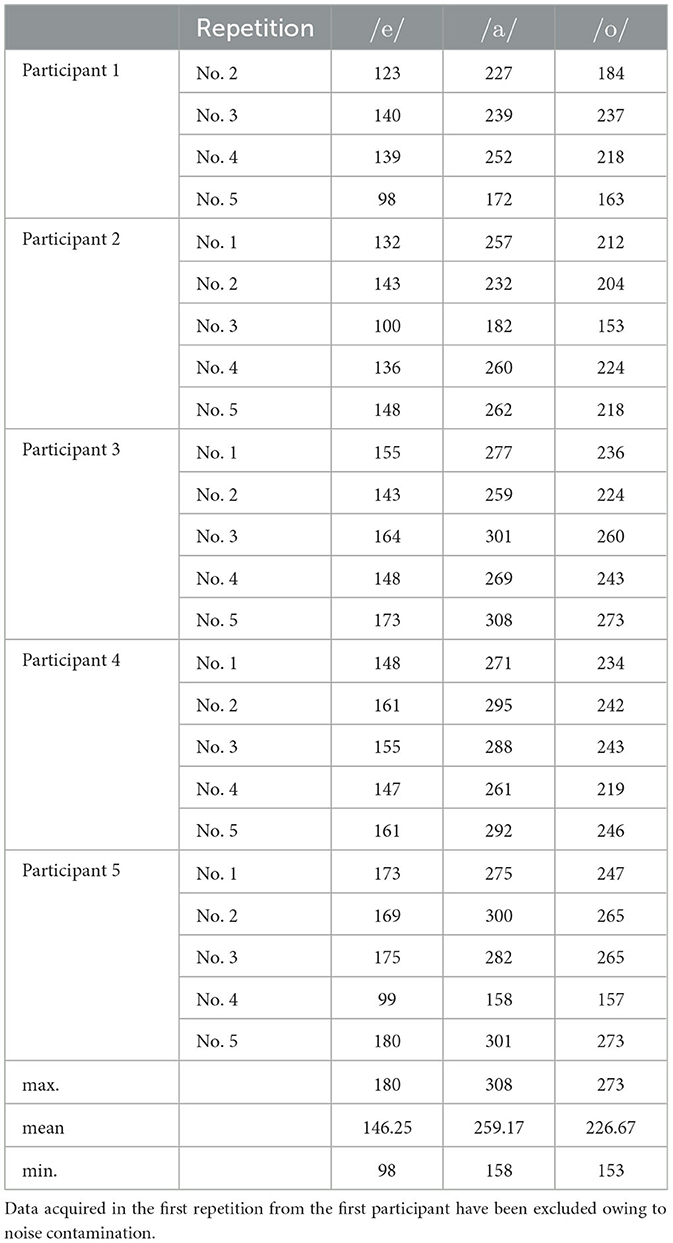
Table 1. Number of vowels used for calculating the average phase spectra after data exclusion.
Furthermore, we calculated the correlation coefficients using circular statistics to evaluate the similarity between pairs of averaged phase spectra. The calculation of spectra yielded 46 spectral pairs for the same speaker and 230 spectral pairs for different speakers. For the 276 pairs, correlation coefficient ρP, which is analogous to Pearson's correlation, was introduced as [14, 18]:
where and are the averaged phase spectra and ωk and ωl are the frequencies discretized by STFT. After scoring, we determined whether the spectrum pair was produced by the same speaker based on whether the correlation value of the pair exceeded a threshold.
2.2 Principle of phase spectrogram calculation
We explain the principle of calculating phase spectrograms and why phase rotations disappear in the phase spectrograms using EGG signals [15].
The phase of the STFT of a speech signal, whose spectrum has a harmonic structure, can be expressed as
for ω ≈ ωn, where ωn is the frequency of the nth Fourier component of the speech signal and X(ωn) is the Fourier transform of the speech signal. The term ωnt causes phase rotations with the passage of time. According to the source-filter theory [19], human speech in the frequency domain, X(ωn), is expressed as
where H(ωn) and G(ωn) are the resonance characteristics of the vocal tract and the glottal source characteristics expressed in the frequency domain, respectively. Here, we approximate a glottal source signal as EGG one, which is measured more easily than the glottal source signal. Therefore, by obtaining speech and EGG signals through a measurement, the phase characteristics of the vocal tract, i.e., ∠H(ωn), can be calculated based on Equations (3) and (4) as
The phase spectrogram is defined as the right-hand side of Equation (5), that is, the difference between the phases in the time-frequency domain of speech and EGG signals, which are simultaneously but separately measured in utterance. This definition does not contain the term ωnt because of subtraction on the right-hand side of the equation; therefore, the rotation disappears in the phase spectrogram.
2.3 Acquisition of speech and electroglottograph signals
We recorded the speech and EGG signals of participants (five males aged 25–27 years) isolated in an anechoic room. Males were chosen as the participants because we previously reported that the global pattern in the phase spectrogram of males' speech was more evident than that of females [15]. The participants uttered 54 Japanese sentences comprising 50 sentences in subset A of ATR phonetically balanced sentences [20] and four additional sentences (Table 2) that are often used in Japanese phonetic studies. These sentences were repeated five times. Only the ATR sentences were analyzed to avoid phoneme bias in this study. The numbers and ratios of vowels contained in the ATR sentences are listed in Table 3. The script of these 54 sentences was presented to the participants using a monitor (27fw, HP). The speech and EGG signals were recorded at a sampling rate of 48 kHz at 16-bit resolution via an omnidirectional headset microphone (model 4066, DPA), EGG measurement equipment (EG2-PCX2, Glottal Enterprise), and audio interface (SERIES 208i, TASCAM). Figure 4 illustrates the measurement setup.
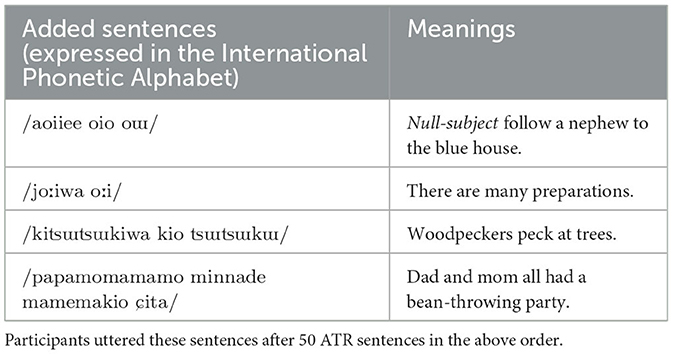
Table 2. Four additional sentences in the measurement.
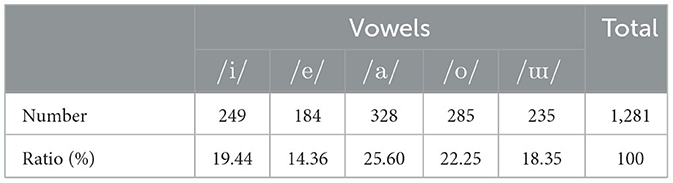
Table 3. Numbers and ratios of vowels contained in subset A of ATR phonetically balanced sentences.
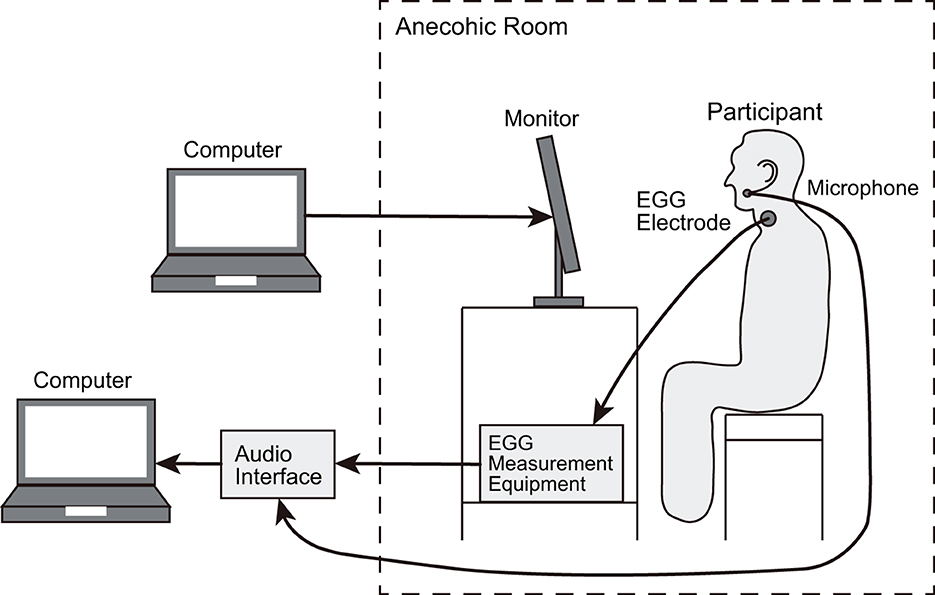
Figure 4. Measurement setting at which speech and EGG signals were recorded from participants.
It should be noted that our studies involving human participants were reviewed and approved by the ethics committee of the National Research Institute of Police Science. All participants provided written informed consent to participate in this study.
2.4 Adjustment of time between speech and EGG signals
Recordings of a speech signal are typically delayed compared with those of an EGG one considering the transmission of speech signals through the vocal tract is time-consuming. Therefore, we corrected the time delay caused by this transmission via time shifting using a cross-correlation between the envelopes of two signals before calculating the phase spectrograms. Note that the cross-correlation was calculated with respect to each sentence. Additionally, unlike the computation of phase spectrograms, the cross-correlation was computed without downsampling the signals. The envelopes were calculated using the Hilbert transform. However, before the Hilbert transform, EGG signals were low-cut by a zero-phase finite impulse response filter of 200 orders, whose cut-off frequency was set to 200 Hz, to stabilize the cross-correlation computation. Despite this, the speech and EGG signals, whose calculated time delay widely strayed from that of other sentences owing to unstable cross-correlation calculation, were excluded from the analysis in increments of sentences. The exclusion threshold was set to one standard deviation.
The means and standard deviations of the calculated time delay are summarized in Table 4. The standard deviation values were in the range of 0.02–0.07 ms. These values are comparable to 0.08 ms reported as an error of the time delay in a previous paper, wherein similar measurement apparatuses were used [21]. Additionally, the mean and standard deviation values were converted to those of the length of the vocal tract via multiplication with the sound speed (which was assumed to be 340 m/s) to verify the mean value. The vocal tract length of adult males is known to be approximately equal to 17 cm [22]. The obtained mean length could be regarded to be valid because its value did not deviate considerably from the value of 17 cm. Therefore, we considered that the time correction for the transmission of speech signals through the vocal tract succeeded.
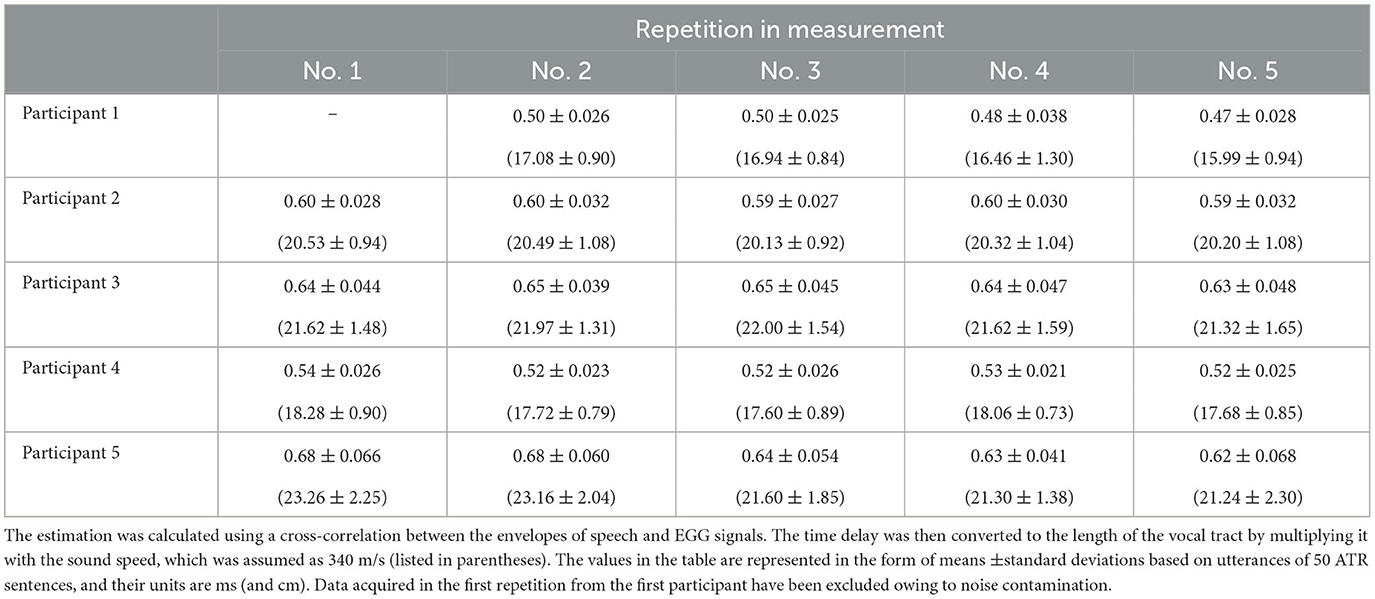
Table 4. Estimated time delay for the transmission of speech signals through the vocal tract.
2.5 Calculation of phase spectrograms and phase spectra
We calculated the phase spectrograms and phase spectra using a Blackman window with a length of 25 ms. The calculation was performed after downsampling the speech and EGG signals to 8,000 Hz because the value of the power spectra of vowels in speech signals decreased over approximately 4,000 Hz, thereby indicating that the phase values were meaningless over this frequency. The data at 0 Hz, which showed meaningless phase information, were removed.
The phase spectra were extracted from the phase spectrograms using the speech segmentation kit Julius [23, 24], which can automatically detect vowels in speech signals and determine their time ranges. In the marked range, the 25 ms length showing the maximum power was used to express the phase spectra. A 25 ms long rectangular window was used to determine the maximum power. Vowels incorrectly marked by Julius and those with time intervals shorter than 25 ms were excluded from the analysis. Additionally, the same sequential vowels, such as /aa/ and /o:oo/, which were not separated in a waveform, were regarded as one vowel to avoid double counting.
2.6 Definition of circular averaging
The circular average can be defined as [14]
where is the averaged phase spectrum, , , φv(ω) is the phase spectrum for a specific vowel, and V is the number of vowels for averaging.
2.7 Averaging and scoring of power spectra
For comparison, we introduced the averaged power spectra of speech, and , and their correlation, ρ, as
for j = 1, 2 and
respectively, where SX(τv, ω) is the STFT of speech at the time instance in which the vowel of interest exists and ωk is the frequency discretized by STFT. Var[xk] and Cov[xk, yk] represent the variance of xk and covariance between xk and yk with respect to k, respectively.
The spectra corresponding to the averaged power characteristics of the vocal tract filter are presented below.
The correlation between and was similarly defined by Equation (8), where SG(τv, ω) is the STFT of EGG signals. Further, SX(τv, ω) and SG(τv, ω) were calculated using the Hamming window.
2.8 Canonical correlation for averaged phase spectra
Canonical correlation embeds phase data, which are cyclical and have values lying on a circle, into a two-dimensional Euclidean space. Therefore, phase data are treated as two-dimensional vectors, such as and ; these vectors are converted into linearly combined forms and , respectively. Canonical correlation is defined as the correlation between and maximized with respect to a and b. In other words, the calculation of phase correlation is replaced by the problem of determining coefficients a and b that maximize the correlation. Therefore, the canonical correlation coefficient ρc can mathematically be given as [25]:
subject to .
Using Lagrange's method for undetermined multipliers, Equation (10) can be transformed into the following biquadratic equation [18]:
where
and I denotes an identity matrix.
2.9 Canonical correlation for averaged power spectra
For comparison, we calculated the canonical correlations for the averaged power spectra by redefining the averaged power spectra in the vector form as and . Consequently, the matrices in Equation (11) can be replaced with:
3 Results
3.1 Effectiveness of averaged phase spectra for speaker recognition
We attempted to discriminate between the five Japanese male participants by using the averaged phase spectra. Based on the procedures mentioned in Section 2.1, we calculated the accuracy as (NTP+NTN)/NALL, where NTP is the number of spectrum pairs obtained and correctly judged to be from the same speaker, NTN is the number of spectrum pairs obtained and correctly judged to be from different speakers, and NALL = 276 is the number of all evaluated spectrum pairs. Because the ratio between the number of spectrum pairs obtained from the same and different speakers was unbalanced, we undersampled the number of the different speaker spectrum pairs to 46, which is equal to the number of the same speaker spectrum pairs; consequently, the chance level of accuracy became 0.5. Speaker recognition was conducted based on whether the correlation value of the spectrum pair exceeded a threshold (see Section 2.1). We investigated the dependency of the accuracy on the threshold. Note that the undersampling process was repeated five times in unused pairs, thereby comparing all possible speaker spectrum pairs.
Consequently, the accuracy was found to be approximately 1.0 when the threshold was set appropriately (Figure 5A). Moreover, speaker recognition was performed over a wide range of thresholds. Then, we compared the accuracy derived according to the averaged phase spectra with that derived by the same procedure while using the averaged power spectra of speech-only signals or averaged power characteristics of the vocal tract filter. The averaged phase spectra yielded a wider range of effective thresholds than the two power spectra.
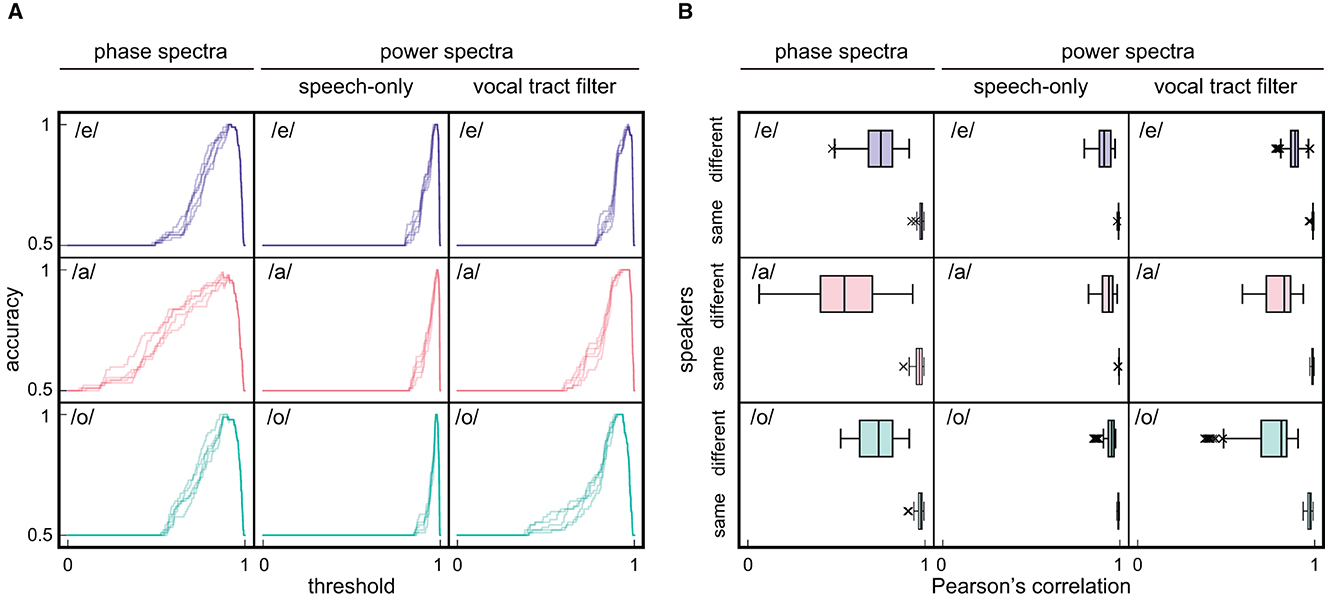
Figure 5. Results of speaker recognition. (A) The dependency of accuracy on threshold that determines the identity of speakers based on Pearson's correlation between spectra. Three types of spectra: averaged phase spectra, averaged power spectra of speech-only signals, and averaged power characteristics of vocal tract filter, are calculated for three Japanese vowels /e/, /a/, and /o/. Because the number of same and different speaker spectrum pairs was 46 and 230, respectively, which indicates an imbalance, spectrum pairs of different speakers were undersampled to 46. Accuracy as a function of threshold was then investigated by varying the threshold in increments of 0.001. To compare all different speaker spectrum pairs, undersampling is performed on unused pairs four more times for five evaluations. Note that the horizontal axes are restricted to positive values for viewability, although the threshold can take negative values. (B) Pearson's correlation among spectrum pairs of different and same speakers. Outliers are defined as greater or less than 1.5 times the interquartile range.
A wider range of effective thresholds indicates that the spectrum pairs obtained from different speakers had lower correlation values in the phase spectra than those in the power spectra (Figure 5B, phase: /e/; median = 0.75, /a/; median = 0.54, /o/; median = 0.74, speech-only signal power: /e/; median = 0.91, /a/; median = 0.94, /o/; median = 0.95, vocal tract filter power: /e/; median = 0.89, /a/; median = 0.83, /o/; median = 0.81). In fact, the averaged phase spectra of the five participants exhibited different shapes for the same vowel, while the two types of averaged power spectra were apparently similar among speakers and less discriminative (Figure 6). Thus, the results demonstrate that the averaged phase spectra discriminate speakers more clearly than do the averaged power spectra.
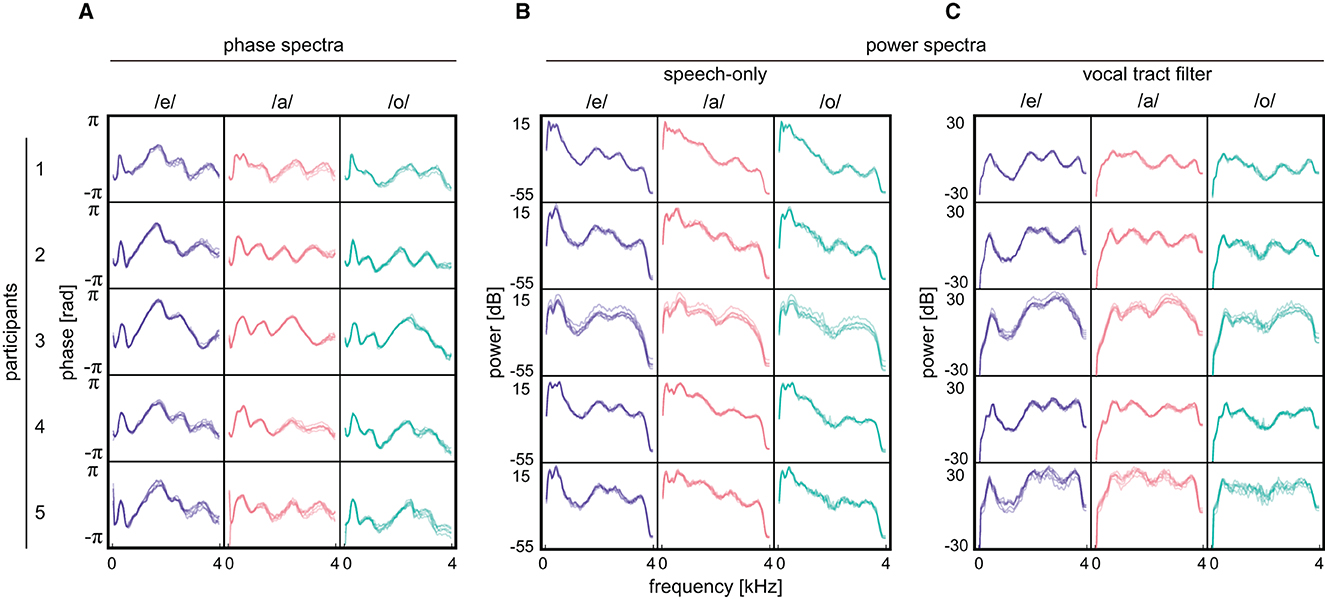
Figure 6. Results obtained from participants. (A) Averaged phase spectra for three Japanese vowels /e/, /a/, and /o/. (B) Averaged power spectra of speech-only signals. (C) Averaged power characteristics of vocal tract filter. During the measurements, participants uttered Japanese sentences and repeated them five times. The spectra were calculated with respect to each repetition and overlaid. The spectra acquired in the first repetition by the first participant are not plotted since noisy data is obtained.
Herein, we compared the obtained results with those obtained in previous studies [6–8] to investigate the validity of the obtained results. Previously published studies demonstrated that the performance of speaker recognition using phase-based features was comparable to that using magnitude-based features. Meanwhile, our study demonstrated that both phase and power spectra of the vocal tract filter achieved an accuracy approximately equal to 1.0 when the threshold was set appropriately, that is, the outcomes obtained based on the phase and power spectra were comparable. Moreover, the listening experiment in [8] showed that the speech of different speakers with distorted phases caused listeners to believe that the speech belonged to the same speaker. The averaged power spectra obtained in our study exhibited more similar shapes than the averaged phase spectra, meaning that discarding phase could blur a difference among speakers. Therefore, the obtained results are consistent with those of previous studies. It is worth noting that we could not directly compare our study findings and those of the previous studies because previous studies adopted different approaches.
3.2 Measure of individuality based on canonical correlation
In Section 3.1, we adopted Pearson's correlation to measure the similarity between the averaged phase spectra. Pearson's correlation can capture the global structure of spectra; however, this property may be detrimental to measuring a speaker's individuality. Therefore, better performance can be obtained by performing evaluations based on the fine structure of the spectra.
Speaker recognition studies often define a speaker's individuality as deviations from the ideal average speaker by removing common trends in a large number of speakers [1, 26]. For the average phase spectrum, the fine structure after subtracting the global common trend from the whole was considered to correspond to individuality. Accordingly, we introduced canonical correlation, which is another definition of the correlation between two angular or phase data instances [18, 25]. The canonical correlation of phase data provides two coefficients, and the larger of the two coefficients reflects common trends in the compared spectra while the smaller coefficient expresses the component that is not fully represented by the larger one. Therefore, the smaller canonical correlation coefficient can be considered the deviation from common trends, i.e., individuality.
After calculating the smaller coefficients of canonical correlation between all 276 spectrum pairs, the accuracy as a function of threshold was computed and compared with that derived using canonical correlation coefficients based on the averaged power spectra of speech and EGG signals. Consequently, the range of high accuracy in the averaged phase spectra was greater than that in the averaged power spectra (Figure 7A) considering the distributions of canonical correlation coefficients of different speaker spectrum pairs shifted toward lower values in the averaged phase spectra than those in the averaged power spectra (Figure 7B, phase: /e/; median = 0.54, /a/; median = 0.30, /o/; median = 0.56, power: /e/; median = 0.87, /a/; median = 0.83, /o/; median = 0.82). Moreover, the range of high accuracy in the averaged phase spectra was broader than that derived using Pearson's correlation, indicating that deviations from common trends in the averaged phase spectra can help distinguish speakers. Although Pearson's correlation is simple and comprehensible, the canonical correlation yielded better performance in speaker recognition.
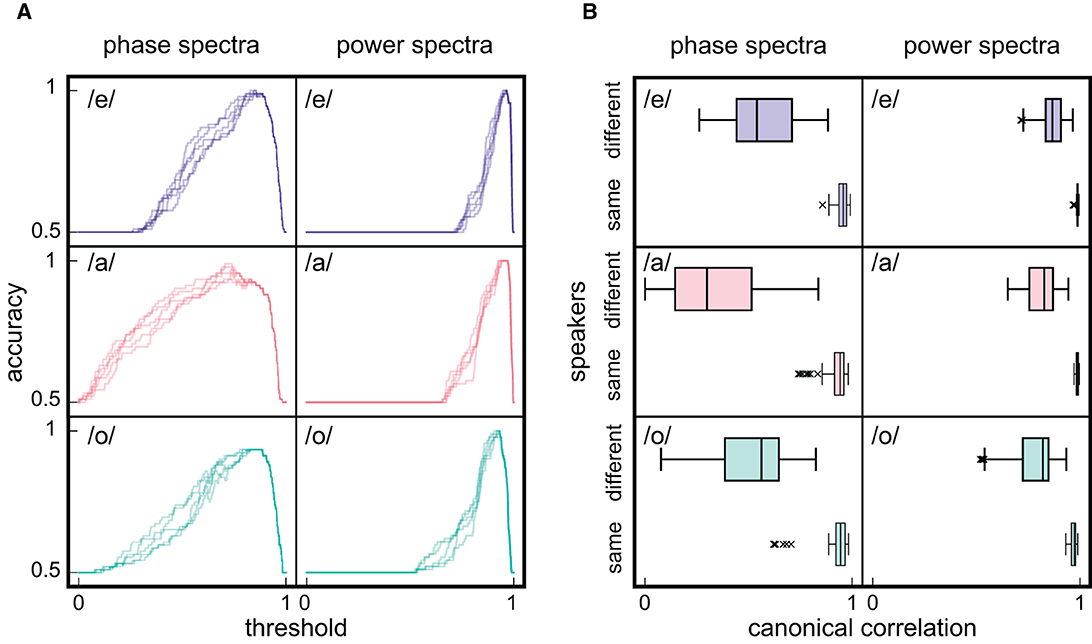
Figure 7. Speaker recognition based on scoring by the small canonical correlation coefficient. (A) The dependency of accuracy on threshold that determines the identity of speakers based on canonical correlation between spectra. (B) Canonical correlation among spectrum pairs of different and same speakers. Graph notation is equivalent to that in Figure 5.
4 Discussion
This study demonstrated that the averaged phase spectra of different speakers have a lower correlation, which allowed us to discriminate different speakers more clearly than the averaged power spectra do. Furthermore, deviations from common trends in the averaged phase spectra helped distinguish the speakers. Therefore, the speaker's individuality appeared in phase spectrograms, i.e., the phase characteristics of the vocal tract filter.
In this study, the data were obtained by controlling the measurement conditions, e.g., gender and age. This study was associated with several limitations. First, we used data from five speakers only; these data were not enough for a speaker recognition study. In addition, this study limited the age and gender of participants. Additionally, we used Japanese, which contains fewer types of vowels than other languages. Moreover, this study focused only on the speech data obtained from participants when they read sentences.
The speaker's individuality is associated with nonlinguistic information, which is one type of information speech contains. Speech contains three types of information, i.e., linguistic, paralinguistic, and nonlinguistic information [27], whereas speech signals are physically composed of power and phase. Linguistic information refers to what is spoken; that is, vowels and consonants. Because vowels and consonants have apparent differences in the power spectra, linguistic information can be understood easily using the power spectra. For instance, the frequencies of prominent peaks in the power spectra are significantly different for each vowel [19]. Meanwhile, paralinguistic information corresponds to intonations and accentuations in sentences, which are not inferable from the written text but are deliberately added by the speaker to modify or supplement the linguistic information. Nonlinguistic information corresponds to aspects such as the age, gender, idiosyncrasy, and physical and emotional states of the speaker, which are not directly related to the linguistic and paralinguistic contents of speech. It is difficult to explain paralinguistic and nonlinguistic information by only using the power spectra, e.g., the contour of the fundamental frequency of speech is often used for an intonation analysis [27].
For efficient speech communication, linguistic information (i.e., contents we would like to transmit by speech) must precede other information, and thus be easily transferred to conversation partners. Meanwhile, human hearing is known to be insensitive to phase, compared with power [28]. Therefore, it is reasonable that linguistic information is assigned to power and not to phase. This idea is consistent with the fact mentioned above that linguistic information can be understood easily using the power spectra. However, our experiment demonstrated that the speaker's individuality can be associated with the phase. The superiority of phase over power obtained in our experimental setting suggested that the power and phase play different roles, i.e., power and phase are mainly related to linguistic and nonlinguistic information, respectively. We hope to clarify the additional information contained in the phase in future studies. In this way, the phase will become useful in acoustics.
5 Conclusion
The present study clarified that the non-modified phase characteristics of the vocal tract filter can distinguish speakers better than the power-based approach, suggesting that phase can carry the speaker's individuality more than power in some conditions.
Data availability statement
The raw data supporting the conclusions of this article will be made available by the authors, without undue reservation.
Ethics statement
The studies involving humans were approved by the Ethics Committee of the National Research Institute of Police Science. The studies were conducted in accordance with the local legislation and institutional requirements. The participants provided their written informed consent to participate in this study.
Author contributions
MO: Funding acquisition, Investigation, Methodology, Writing—original draft, Writing—review & editing. HI: Conceptualization, Funding acquisition, Writing—review & editing, Supervision, Writing—original draft.
Funding
The author(s) declare financial support was received for the research, authorship, and/or publication of this article. This work was supported by the Japan Society for the Promotion of Science KAKENHI grants JP20K23357 (MO), JP18H01671 (MO), JP23K17161 (MO), and JP23H04475 (HI).
Acknowledgments
We would like to thank Prof. Kaburagi for insightful discussions.
Conflict of interest
The authors declare that the research was conducted in the absence of any commercial or financial relationships that could be construed as a potential conflict of interest.
Publisher's note
All claims expressed in this article are solely those of the authors and do not necessarily represent those of their affiliated organizations, or those of the publisher, the editors and the reviewers. Any product that may be evaluated in this article, or claim that may be made by its manufacturer, is not guaranteed or endorsed by the publisher.
References
1. Dehak N, Kenny PJ, Dehak R, Dumouchel P, Ouellet P. Front-end factor analysis for speaker verification. IEEE Trans Audio Speech Lang Process. (2011) 19:788–98. doi: 10.1109/TASL.2010.2064307
2. Snyder D, Garcia-Romero D, Sell G, Povey D, Khudanpur S. X-vectors: robust DNN embeddings for speaker recognition. In: 2018 IEEE International Conference on Acoustics, Speech and Signal Processing (ICASSP). Calgary, AB (2018). p. 5329–33.
3. Mak MW, Chien JT. Machine Learning for Speaker Recognition. Cambridge: Cambridge University Press (2020).
4. Yatabe K, Masuyama Y, Kusano T, Oikawa Y. Representation of complex spectrogram via phase conversion. Acoust Sci Technol. (2019) 40:170–7. doi: 10.1250/ast.40.170
5. Hidaka S, Wakamiya K, Kaburagi T. An investigation of the effectiveness of phase for audio classification. In: ICASSP 2022 - 2022 IEEE International Conference on Acoustics, Speech and Signal Processing (ICASSP). Singapore (2022). p. 3708–12.
6. McCowan I, Dean D, McLaren M, Vogt R, Sridharan S. The delta-phase spectrum with application to voice activity detection and speaker recognition. IEEE Trans Audio Speech Lang Process. (2011) 19:2026–38. doi: 10.1109/TASL.2011.2109379
7. Hernáez I, Saratxaga I, Sanchez J, Navas E, Luengo I. Use of the harmonic phase in speaker recognition. In: Proceedings of the Interspeech. Florence (2011). p. 2757–60.
8. Vijayan K, Raghavendra Reddy P, Sri Rama Murty K. Significance of analytic phase of speech signals in speaker verification. Speech Commun. (2016) 81:54–71. doi: 10.1016/j.specom.2016.02.005
9. Dutta A, Ashishkumar G, Rao CVR. Phase based spectro-temporal features for building a robust ASR system. In: Proceedings of the Interspeech. Shanghai (2020). p. 1668–72.
10. Yang J, Wang H, Das RK, Qian Y. Modified magnitude-phase spectrum information for spoofing detection. IEEE/ACM Transact Audio Speech Lang Process. (2021) 29:1065–78. doi: 10.1109/TASLP.2021.3060810
11. Degottex G, Stylianou Y. Analysis and synthesis of speech using an adaptive full-band harmonic model. IEEE Trans Audio Speech Lang Process. (2013) 21:2085–95. doi: 10.1109/TASL.2013.2266772
12. Nongrum D, Pyrtuh F. A comparative study on effect of temporal phase for speaker verification. In:Basu S, Kole DK, Maji AK, Plewczynski D, Bhattacharjee D, editors. Proceedings of International Conference on Frontiers in Computing and Systems. Singapore: Springer Nature (2023). p. 571–8.
13. Liu M, Wang L, Dang J, Lee KA, Nakagawa S. Replay attack detection using variable-frequency resolution phase and magnitude features. Comp. Speech Lang. (2021) 66:101161. doi: 10.1016/j.csl.2020.101161
15. Okada M. Visualization of phase characteristics of a vocal tract using phase-conversion method with electroglottograph signals. Acoust Sci Technol. (2021) 42:150–3. doi: 10.1250/ast.42.150
16. Murthy HA, Yegnanarayana B. Group delay functions and its applications in speech technology. Sadhana. (2011) 36:745–82. doi: 10.1007/s12046-011-0045-1
19. Fant G. Acoustic Theory of Speech Production: With Calculations based on X-Ray Studies of Russian Articulations. 2nd ed. Hague: Mouton (1970).
20. Sagisaka Y, Takeda K, Abel M, Katagiri S, Umeda T, Kuwabara H. A large-scale Japanese speech database. In: Proceedings of the First International Conference on Spoken Language Processing (ICSLP 1990). Kobe (1990). p. 1089–92.
21. Alku P, Murtola T, Malinen J, Kuortti J, Story B, Airaksinen M, et al. Openglot—an open environment for the evaluation of glottal inverse filtering. Speech Commun. (2019) 107:38–47. doi: 10.1016/j.specom.2019.01.005
23. Lee A, Kawahara T, Shikano K. Julius—an open source real-time large vocabulary recognition engine. In: Proceedings of the 7th European Conference on Speech Communication and Technology (Eurospeech 2001). Aalborg (2001). p. 1691–94.
24. Lee A, Kawahara T. Recent development of open-source speech recognition engine Julius. In: Proceedings of the Asia-Pacific Signal and Information Processing Association Annual Summit and Conference (APSIPA ASC). Sapporo (2009). p. 131–7.
26. Kenny P, Boulianne G, Dumouchel P. Eigenvoice modeling with sparse training data. IEEE Transact. Speech Audio Process. (2005) 13:345–54. doi: 10.1109/TSA.2004.840940
27. Fujisaki H. Information, prosody, and modeling - with emphasis on tonal features of speech. In: Proceedings of the Speech Prosody. Nara (2004). p. 1–10.
Keywords: speaker recognition, phase characteristics of vocal tract filter, phase spectrogram, averaged phase spectrum, raw phase
Citation: Okada M and Ito H (2023) Phase characteristics of vocal tract filter can distinguish speakers. Front. Appl. Math. Stat. 9:1274846. doi: 10.3389/fams.2023.1274846
Received: 09 August 2023; Accepted: 20 November 2023;
Published: 08 December 2023.
Edited by:
Xiaodong Luo, Norwegian Research Institute (NORCE), NorwayReviewed by:
Valentín Cardeñoso-Payo, University of Valladolid, SpainCandy Olivia Mawalim, Japan Advanced Institute of Science and Technology, Japan
Copyright © 2023 Okada and Ito. This is an open-access article distributed under the terms of the Creative Commons Attribution License (CC BY). The use, distribution or reproduction in other forums is permitted, provided the original author(s) and the copyright owner(s) are credited and that the original publication in this journal is cited, in accordance with accepted academic practice. No use, distribution or reproduction is permitted which does not comply with these terms.
*Correspondence: Masahiro Okada, bS5va2FkYUBucmlwcy5nby5qcA==