 Muhammad Aslam1*
 Florentin Smarandache2
- 1Department of Statistics, Faculty of Science, King Abdulaziz University, Jeddah, Saudi Arabia
- 2Mathematics, Physics, and Natural Science Division, University of New Mexico, Gallup, NM, United States
In this paper, we propose the introduction of a neutrosophic chi-square-test for consistency, incorporating neutrosophic statistics. Our aim is to modify the existing chi-square -test for consistency in order to analyze imprecise data. We present a novel test statistic for the neutrosophic chi-square -test for consistency, which accounts for the uncertainties inherent in the data. To evaluate the performance of the proposed test, we compare it with the traditional chi-square -test for consistency based on classical statistics. By conducting a comparative analysis, we assess the efficiency and effectiveness of our proposed neutrosophic chi-square -test for consistency. Furthermore, we illustrate the application of the proposed test through a numerical example, demonstrating how it can be utilized in practical scenarios. Through this implementation, we aim to provide empirical evidence of the improved performance of our proposed test when compared to the traditional chi-square-test for consistency based on classical statistics. We anticipate that the proposed neutrosophic chi-square -test for consistency will outperform its classical counterpart, offering enhanced accuracy and reliability when dealing with imprecise data. This advancement has the potential to contribute significantly to the field of statistical analysis, particularly in situations where data uncertainty and imprecision are prevalent.
1. Introduction
In statistical analysis, the chi-square -test for consistency, also known as the chi-square test, is a commonly used method to determine if there is a significant association between two categorical variables in a 2 × 2 contingency table. This test allows researchers to assess whether the observed frequencies in the table deviate significantly from what would be expected under the assumption of independence between the variables. The 2 × 2 table also referred to as a contingency table or cross-tabulation table presents the frequencies or counts of two categorical variables. The resulting test statistic follows a chi-square distribution with one degree of freedom. If the calculated chi-square statistic exceeds a critical value from the chi-square distribution, it indicates a significant departure from independence. This suggests that there is an association or relationship between the variables under investigation. On the other hand, if the calculated chi-square statistic is smaller than the critical value, it suggests no significant association, implying that the variables are independent. Recent research has expanded upon the application and interpretation of the chi-square-test for consistency, exploring its use in various fields such as healthcare, social sciences, and marketing. In conclusion, the chi-square-test for consistency is a valuable statistical tool for assessing the association between two categorical variables in a 2 × 2 contingency table. More details on the application of chi-square-test can be seen in Dutton and Dutton [1], McHugh [2], Rana and Singhal [3], Lin et al. [4], Benhamou and Melot [5], and Ahammed and Smith [6].
Imprecise data, also referred to as data with imprecise, interval, and fuzzy observations, encompasses various scenarios. In practical terms, imprecise data may arise when measuring water levels, collecting survey responses, or determining the lifetimes or failure times of electronic components. Neutrosophic statistics is a specialized branch of statistics that deals with uncertainties and imprecise information using the framework of neutrosophy. Neutrosophy is a philosophical concept introduced by Smarandache [7] aiming to analyze and study the indeterminate, uncertain, and ambiguous nature of various phenomena. In traditional statistics, uncertainty is often handled using probabilistic methods, which assume that events can be described by precise probabilities. However, in many real-world scenarios, uncertainties cannot be accurately represented by traditional probability theory. Neutrosophic statistics offers an alternative approach to address these limitations and provides a framework for handling uncertain, imprecise, and incomplete data. The fundamental principle of neutrosophic statistics is the recognition that most real-world problems involve not only true and false values but also indeterminacy, which represents the degree of truth or falsity. Neutrosophic statistics extends the notion of probability by introducing a third parameter called indeterminacy. This additional parameter allows for a more comprehensive representation of uncertainty and ambiguity in statistical analysis. Neutrosophic statistics is particularly useful in situations where information is incomplete, imprecise, or contradictory. It provides a formal framework for representing and manipulating uncertain data, making it applicable to a wide range of fields, including decision making, artificial intelligence, pattern recognition, and data mining. One of the significant advantages of neutrosophic statistics is its ability to handle incomplete and imprecise data. Traditional statistical methods often struggle when faced with missing data or imprecise measurements. Neutrosophic statistics, on the other hand, provides mechanisms to handle such situations, enabling researchers to make meaningful inferences even in the presence of incomplete information. Moreover, neutrosophic statistics offers a flexible framework for modeling uncertainty. It allows for the integration of various types of uncertainties, including random uncertainties, fuzzy uncertainties, and subjective uncertainties. By capturing and analyzing multiple dimensions of uncertainty, neutrosophic statistics provides a more realistic and nuanced representation of complex real-world phenomena. In conclusion, neutrosophic statistics is an innovative and powerful approach to handle uncertainty and imprecise information in statistical analysis. By incorporating the concept of neutrosophy, this field provides a more comprehensive framework for representing and analyzing uncertainties. Neutrosophic statistics has the potential to significantly impact various disciplines, enabling researchers to gain deeper insights and make more informed decisions in the face of uncertainty.
Smarandache [8] demonstrated the superior effectiveness of neutrosophic statistics when compared to classical and interval statistics. Shahzadi [9] introduced neutrosophic statistical analysis for temperature data collected from various cities in Pakistan. Additionally, Al Aita and Talebi [10] in the same year presented a method for analyzing imprecise data using neutrosophic augmented experimental design. Furthermore, Aslam and Saleem [11] put forth a neutrosophic test for evaluating linearity, while Aslam [12] conducted research on neutrosophic statistical testing methods for imprecise sequential contingency data. More applications of neutrosophic statistics can be seen in Chen et al. [13], Alhabib and Salama [14], Polymenis [15], Aslam [16], Raghav [17], Al Aita and Aslam [18], and Chen et al. [19].
In this paper, our main contribution is the introduction of a neutrosophic chi-square test for consistency, which incorporates the principles of neutrosophic statistics. The existing chi-square test for consistency is widely used in statistical analysis, but it assumes precise and deterministic data. Our aim is to modify this test to handle imprecise data by considering uncertainties inherent in the data. To achieve this, we propose a novel test statistic for the neutrosophic chi-square test for consistency. This test statistic takes into account the imprecise nature of the data and provides a more accurate assessment of consistency. We intend to evaluate the performance of our proposed test by comparing it with the traditional chi-square test for consistency based on classical statistics. This comparative analysis will allow us to assess the efficiency and effectiveness of our approach. Additionally, we plan to illustrate the practical application of the proposed test through a numerical example. By demonstrating how it can be utilized in real-world scenarios, we aim to provide empirical evidence of the improved performance of our test compared to the traditional chi-square test for consistency based on classical statistics. This empirical evidence will highlight the enhanced accuracy and reliability of our proposed test when dealing with imprecise data. The anticipated outcome of our research is that the proposed neutrosophic chi-square test for consistency will outperform its classical counterpart. By incorporating neutrosophic statistics and considering the uncertainties in the data, our test has the potential to offer more accurate and reliable results. This advancement in statistical analysis, particularly in situations where data uncertainty and imprecision are prevalent, will contribute significantly to the field.
2. Methods
In order to explore the statistical significance of the disparities between the observed frequencies within two separate dichotomous distributions, a comprehensive investigation will be conducted. This analysis aims to delve into the significance of the variations observed between the frequencies in each distribution, ultimately shedding light on the underlying factors that contribute to these differences. By examining the statistical significance, we can gain a deeper understanding of the implications and potential impact of these disparities within the context of the given distributions. The existing test given in Kanji [20] can be applied when the data is precise. Under complexity and uncertainty, the data may be imprecise and indeterminate therefore the existing test cannot be applied. Now, we present the modification of chi-square test under neutrosophic statistics in this section as follows:
When presented with two distinct samples, each categorized into two classes, it is possible to construct a comprehensive 2 × 2 table. This table serves as a valuable tool for organizing and analyzing the neutrosophic data obtained from the samples, facilitating a deeper understanding of the relationships between the variables under investigation. By systematically organizing the data into rows and columns, the 2 × 2 table allows for a clear visualization of the neutrosophic frequency distribution within each class of the two samples. The imprecise data in 2 × 2 table is shown in Table 1. The neutrosophic 2 × 2 table having the measure of indeterminacy (IN) is shown in Table 2. The first values in Table 2 present the determinate values and the second values are known as the indeterminate values and IN is the measure of indeterminacy. Note that neutrosophic 2 × 2 table reduces to 2 × 2 table under classical statistics when IL = 0. The neutrosophic test statistic is given as:
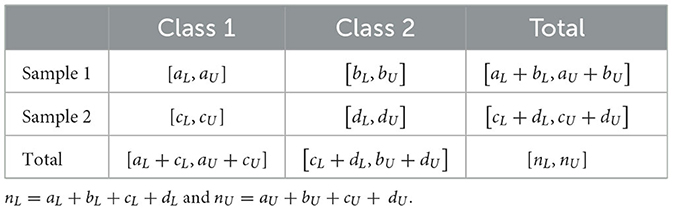
Table 1. Neutrosophic 2 × 2 table.
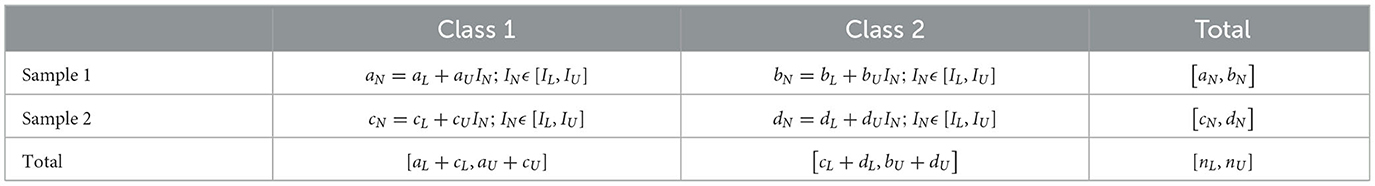
Table 2. Neutrosophic 2 × 2 table with measure of indeterminacy.
The test statistic proposed here conforms to the chi-square distribution with a single degree of freedom. Note that the neutrosophic chi-square test is the generalization of the chi-square test statistic under classical statistics. The first part presents the test statistic under classical statistics and the second part denote the indeterminate part. In accordance with the guidelines outlined in Kanji [20], the suggested test should be utilized when the sample size exceeds 20. When IL =0, the neutrosophic chi-square test simplifies to the test statistic in classical statistics, and this is expressed as follows:
The methodology for the proposed test is outlined in the following steps:
Step 1: Formulate the null hypothesis H0 asserting independence between two samples, in contrast to the alternative hypothesis H1 suggesting a lack of independence between the two samples.
Step 2: Specify the significance level (α) and determine the critical value using the chi-square table from Kanji [20].
Step 3: Calculate the following statistic:
Step 4: Reject the null hypothesis (H0) if the computed value exceeds the critical value.
3. Application
In this section, we will discuss the application of the proposed test using data collected from the production process. The data represents the number of defective articles produced by two machines and has been obtained from Parthiban and Gajivaradhan [21]. The specific data can be found in Table 3. The data consists of recorded counts of defective articles produced by the two machines within an hour. Upon analyzing the data, it becomes evident that the existing test mentioned in Kanji [20] is not suitable for testing the null hypothesis (H0), which assumes that both machines produce the same number of defectives. Instead, the alternative hypothesis (H1) states that the two machines do not produce the same number of defectives. Therefore, to test these hypotheses, the application of the neutrosophic chi-square test is deemed appropriate. This test allows for the examination of both the null and alternative hypotheses. For the actual data, we proceed to implement the proposed test, and the resulting value of the neutrosophic test statistic is calculated as follows:
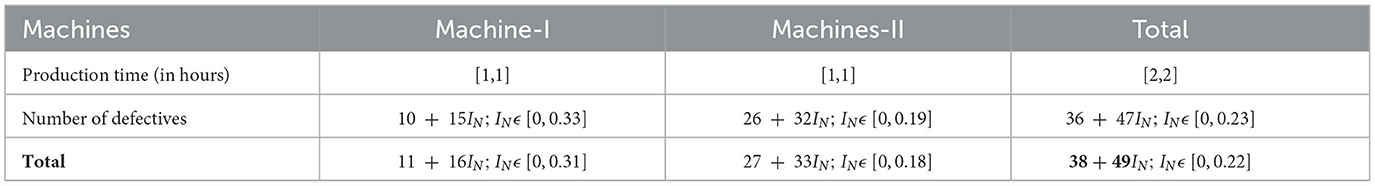
Table 3. The numerical data.
The proposed test will be implemented as follows:
Step-1: H0: two machines produce the same number of defectives vs. H1: two machines do not produce the same number of defectives.
Step-2: Specified the level of significance α =0.05 and the tabulated value is 5.02.
Step-3: The calculated value of neutrosophic test statistic is .
Step-4: Compare the calculated value of with the tabulated value of 5.02. If is ≤5.02, the null hypothesis cannot be rejected. Therefore, it is concluded that both machines produce the same number of defectives within an hour.
4. Comparative study
Now, let us compare the performance of the proposed chi-square test with the existing chi-square test in terms of flexibility, informativeness, and adequacy. As previously mentioned, the neutrosophic chi-square test serves as a generalization of the existing chi-square test. When there are no indeterminate observations in the data, the proposed test simplifies to the existing chi-square test. In the numerical example provided, the neutrosophic value of the test statistic is represented as , where IN falls within the range of [0, 0.5848]. The initial value of 0.4430 signifies the values obtained from the existing test statistic under classical statistics. The subsequent part (0.2795)IN, represents the indeterminate component, and the measure of indeterminacy is 0.5848. From the analysis conducted, it becomes evident that the proposed test yields results within an indeterminate interval instead of providing an exact value. Considering the nature of the data, which is presented within an indeterminate interval, the use of the existing test could potentially mislead decision-makers. Hence, the existing test mentioned in Kanji [20] is not suitable for datasets containing indeterminate intervals. On the other hand, the proposed test provides results for the test statistic ranging from 0.4430 to 0.2795. Additionally, the proposed test supplies information regarding the measure of indeterminacy, which is calculated to be 0.5848. This measure indicates a high level of indeterminacy during the test implementation. Consequently, the proposed test demonstrates greater efficiency than the existing test in terms of flexibility and provision of information.
5. Concluding remarks
In this paper, we proposed a neutrosophic chi-square test for consistency, which incorporates neutrosophic statistics to handle imprecise data. Our test modifies the existing chi-square test for consistency by considering the uncertainties inherent in the data. We introduced a novel test statistic that accounts for the imprecise nature of the data, providing a more accurate assessment of consistency. To evaluate the performance of our proposed test, we conducted a comparative analysis with the traditional chi-square test based on classical statistics. Through our comparative analysis, we demonstrated that the proposed neutrosophic chi-square test for consistency outperforms its classical counterpart. The traditional chi-square test assumes precise and deterministic data, which can be inadequate for scenarios involving imprecise data. In contrast, our test incorporates the principles of neutrosophic statistics, allowing for a more comprehensive representation and analysis of uncertainties. The neutrosophic chi-square test provides results within an indeterminate interval, which accurately reflects the imprecise nature of the data. We illustrated the application of our test using data from the production process, showcasing its effectiveness in practical scenarios. The proposed neutrosophic chi-square test for consistency offers enhanced accuracy and reliability when dealing with imprecise data. By considering uncertainties and indeterminacies, our test provides a more realistic and nuanced analysis, contributing significantly to the field of statistical analysis. Neutrosophic statistics, as a specialized branch of statistics, offers a powerful framework for handling uncertainty and imprecise information. By incorporating neutrosophy, our test enables researchers to gain deeper insights and make more informed decisions in the face of uncertainty. In conclusion, the proposed neutrosophic chi-square test for consistency presents a valuable advancement in statistical analysis, particularly in situations where data uncertainty and imprecision are prevalent. Its ability to handle imprecise and incomplete data, along with its flexibility in modeling uncertainty, makes it applicable to a wide range of fields. The integration of neutrosophic statistics provides a more comprehensive framework for representing and analyzing uncertainties, thereby contributing to the improvement of statistical analysis methodologies. There are several limitations and drawbacks associated with the proposed test within the framework of neutrosophic statistics. Given that neutrosophic tests are designed for handling complex or imprecise data, the interpretation of test results becomes notably challenging. Additionally, there is a shortage of specialized computer software for the analysis of imprecise data, representing a promising avenue for future research and development. Further research opportunities also exist in the exploration of various statistical properties of the proposed test.
Data availability statement
The original contributions presented in the study are included in the article/supplementary material, further inquiries can be directed to the corresponding author.
Author contributions
MA: Data curation, Software, Writing—original draft, Writing—review and editing. FS: Funding acquisition, Methodology, Validation, Writing—review and editing.
Funding
The author(s) declare that no financial support was received for the research, authorship, and/or publication of this article.
Acknowledgments
The authors are deeply thankful to the editor and reviewers for their valuable suggestions to improve the quality and presentation of the paper.
Conflict of interest
The authors declare that the research was conducted in the absence of any commercial or financial relationships that could be construed as a potential conflict of interest.
Publisher's note
All claims expressed in this article are solely those of the authors and do not necessarily represent those of their affiliated organizations, or those of the publisher, the editors and the reviewers. Any product that may be evaluated in this article, or claim that may be made by its manufacturer, is not guaranteed or endorsed by the publisher.
References
1. Dutton J, Dutton M. Characteristics and performance of students in an online section of business statistics. J Stat Educ. (2005) 13:3. doi: 10.1080/10691898.2005.11910564
2. McHugh ML. The chi-square test of independence. Biochemia Med. (2013) 23:143–9. doi: 10.11613/BM.2013.018
3. Rana R, Singhal R. Chi-square test and its application in hypothesis testing. J Prac Cardiovas Sci. (2015) 1:69. doi: 10.4103/2395-5414.157577
4. Lin J-J, Chang C-H, Pal N. A revisit to contingency table and tests of independence: bootstrap is preferred to Chi-square approximations as well as Fisher's exact test. J Biopharm Stat. (2015) 25:438–58. doi: 10.1080/10543406.2014.920851
5. Benhamou E, Melot V. Seven proofs of the Pearson Chi-squared independence test and its graphical interpretation. arXiv preprint arXiv:1808.09171. doi: 10.48550/arXiv.1808.09171
6. Ahammed F, Smith E. Prediction of students' performances using course analytics data: a case of water engineering course at the university of south Australia. Educ Sci. (2019) 9:245. doi: 10.3390/educsci9030245
7. Smarandache F. Introduction to Neutrosophic Statistics, Sitech and Education Publisher, Craiova. Columbus, OH: Romania-Educational Publisher (2014), p. 123.
8. Smarandache F. Neutrosophic Statistics is An Extension of Interval Statistics, While Plithogenic Statistics is the Most General Form of Statistics. Brooklyn, NY: Infinite Study. (2022).
9. Shahzadi I. Neutrosophic statistical analysis of temperature of different cities of Pakistan. Neutrosophic Sets Syst. (2023) 53:10. doi: 10.61356/j.nswa.2023.76
10. Al Aita A, Talebi H. Exact neutrosophic analysis of missing value in augmented randomized complete block design. Compl Int Syst. (2023) 25:1–15. doi: 10.1007/s40747-023-01182-5
11. Aslam M, Saleem M. Neutrosophic test of linearity with application. AIMS Math. (2023) 8:7981–9. doi: 10.3934/math.2023402
12. Aslam M. Data analysis for sequential contingencies under uncertainty. J Big Data. (2023) 10:24. doi: 10.1186/s40537-023-00700-z
13. Chen J, Ye J, Du S. Scale effect and anisotropy analyzed for neutrosophic numbers of rock joint roughness coefficient based on neutrosophic statistics. Symmetry. (2017) 9:208. doi: 10.3390/sym9100208
14. Alhabib R, Salama A. The neutrosophic time series-study its models (linear-logarithmic) and test the coefficients significance of its linear model. Neutrosophic Sets Syst. (2020) 33:105–15.
15. Polymenis A. A neutrosophic Student'st–type of statistic for AR (1) random processes. J Fuzzy Ext Appl. (2021) 2:388–93.
16. Aslam M. Neutrosophic F-test for two counts of data from the poisson distribution with application in climatology. Stats. (2022) 5:773–83. doi: 10.3390/stats5030045
17. Raghav YS. Neutrosophic generalized exponential robust ratio type estimators. Int J Anal Appl. (2023) 21:41–41. doi: 10.28924/2291-8639-21-2023-41
18. AlAita A, Aslam M. Analysis of covariance under neutrosophic statistics. J Stat Comput Simul. (2022) 24:1–19.
19. Chen J, Ye J, Du S, Yong R. Expressions of rock joint roughness coefficient using neutrosophic interval statistical numbers. Symmetry. (2017) 9:123. doi: 10.3390/sym9070123
Keywords: neutrosophic statistics, chi-square -test for consistency, imprecise data, comparative analysis, data uncertainty
Citation: Aslam M and Smarandache F (2023) Chi-square test for imprecise data in consistency table. Front. Appl. Math. Stat. 9:1279638. doi: 10.3389/fams.2023.1279638
Received: 18 August 2023; Accepted: 29 September 2023;
Published: 19 October 2023.
Edited by:
Valentina De Simone, University of Campania Luigi Vanvitelli, ItalyReviewed by:
Muhammad Ahmed Shehzad, Bahauddin Zakariya University, PakistanAtif Akbar, Bahauddin Zakariya University, Pakistan
Oluwafemi Samson Balogun, University of Eastern Finland, Finland
Copyright © 2023 Aslam and Smarandache. This is an open-access article distributed under the terms of the Creative Commons Attribution License (CC BY). The use, distribution or reproduction in other forums is permitted, provided the original author(s) and the copyright owner(s) are credited and that the original publication in this journal is cited, in accordance with accepted academic practice. No use, distribution or reproduction is permitted which does not comply with these terms.
*Correspondence: Muhammad Aslam, YXNsYW1fcmF2aWFuQGhvdG1haWwuY29t