- 1Department of Mechanical and Materials Engineering, University of Nebraska-Lincoln, Lincoln, NE, United States
- 2Department of Biomechanics, University of Nebraska Omaha, Omaha, NE, United States
- 3Scholl College of Podiatric Medicine, Rosalind Franklin University of Medicine and Science, North Chicago, IL, United States
- 4Daniel Guggenheim School of Aerospace Engineering, Georgia Institute of Technology, Atlanta, GA, United States
Introduction: Biomechanical changes due to aging increase the oxygen consumption of walking by over 30%. When this is coupled with reduced oxygen uptake capacity, the ability to sustain walking becomes compromised. This reduced physical activity and mobility can lead to further physical degeneration and mortality. Unfortunately, the underlying reasons for the increased metabolic cost are still inadequately understood. While motion capture systems can measure signals with high temporal resolution, it is impossible to directly characterize the fluctuation of metabolic cost throughout the gait cycle.
Methods: To address this issue, this research focuses on computing the metabolic cost time series from the mean value using two neural-network-based approaches: autoencoders (AEs) and expanders. For the AEs, the encoders are designed to compress the input time series down to their mean value, and the decoder expands those values into the time series. After training, the decoder is extracted and applied to mean metabolic cost values to compute the time series. A second approach leverages an expander to map the mean values to the time series without an encoder. The networks are trained using ten different metabolic cost models generated by a computational walking model that simulates the gait cycle subjected to 35 different robotic perturbations without using experimental input data. The networks are validated using the estimated metabolic costs for the unperturbed gait cycle.
Results: The investigation found that AEs without tied weights and the expanders performed best using nonlinear activation functions, while the AEs with tied weights performed best with linear activation functions. Unexpectedly, the results show that the expanders outperform the AEs.
Discussion: A limitation of this research is the reliance on time series for the initial training. Future efforts will focus on developing methods that overcome this issue. Improved methods for estimating within-stride fluctuations in metabolic cost have the potential of improving rehabilitation and assistive devices by targeting the gait phases with increased metabolic cost. This research could also be applied to expand sparse measurements to locations or times that were not measured explicitly. This application would reduce the number of measurement points required to capture the response of a system.
1 Introduction
Impairments such as stroke, cerebral palsy, or even normal aging increase the oxygen consumption of walking (Rose et al., 1990; Platts et al., 2006). For example, on average, older adults have a 30% greater metabolic cost (Martin et al., 1992; Mian et al., 2006). When coupled with reduced oxygen uptake capacity, the ability to sustain walking becomes compromised, leading to reduced independence and quality of life (Morris and Hardman, 1997). The underlying reasons for the increased metabolic cost are inadequately understood. For example, certain training interventions (Franz, 2016) and assisting lateral balance (Ortega et al., 2008) have been ineffective in reducing metabolic costs. One potential explanation is that we cannot measure when these interventions help or hinder metabolic efficiency during the gait cycle.
Although motion capture systems can measure numerous signals with high temporal resolutions, we cannot directly measure the fluctuation of metabolic cost throughout the gait cycle. By this, we mean the fluctuation in “cost,” not “consumption.” Changes in oxygen “consumption” are slow: For example, studies show a delay with a time constant of about 40 s after an abrupt change in exercise intensity (e.g., a transition from rest to exercise) (Whipp et al., 1982; Whipp and Ward, 1990; Selinger and Donelan, 2014). Although these changes are much slower than a stride cycle (i.e., about 1 s), this does not imply that phases of the gait cycle cannot contribute by different amounts.
We define these contributions of parts of the gait cycles as “costs”. There is a consensus that different gait cycle phases have different costs (Marsh et al., 2004; Gottschall and Kram, 2005; Doke et al., 2007; Umberger, 2010; Gonabadi et al., 2020). Our current knowledge is based on indirect estimations (e.g., estimating the cost of swinging a leg while standing (Doke et al., 2007). While these estimations agree on the broad strokes (e.g., swing costs less than stance), there are large inconsistencies (Gonabadi et al., 2020; Dzewaltowski et al., 2024). This inability to estimate the cost of different phases hinders interventions: e.g., if exercise interventions or orthoses reduce metabolic cost during one phase but increase cost in another phase, we fail to understand how to improve these interventions. The present manuscript focuses on new methods for estimating the cost of different gait cycle phases.
There are several model-based methods; however, there are large differences between the used approaches, and they sometimes do not agree very well. One common approach is using musculoskeletal models and muscle metabolic rate equations. Umberger et al. (2003) developed widely used equations that estimate metabolic cost from muscle fiber work and heat energy losses associated with shortening-lengthening and activation of muscle fibers. Umberger applied his equations to a forward dynamics model with 12 muscles per side to produce the first estimation of the time series of metabolic rate during the gait cycle. Different groups developed alternative models and equations. Kim and Roberts, 2015; Roberts et al., 2016 argue that musculoskeletal models only simulate a subset of muscles, and interactions between muscles and other tissues are complex. They developed equations to estimate metabolic rate as a function of joint moments and angular velocity and produced a different time series of metabolic cost. Other estimations from Pimental et al. (2021) or Gonabadi et al. (2020) negatively correlate with the most cited time series estimation from (Umberger, 2010), which predicts that the push-off phase has the lowest cost. Some inconsistencies could be due to differences in participants, walking conditions, and measurement errors; however, it is unlikely that this explains the entire inconsistency. Reviews by Umberger and Rubenson (2011) and Hicks et al. (2015) state a need for “novel approaches.” One limitation is that no validation of the phase-specific metabolic cost has been attempted. While valuable work compared metabolic cost equations to indirect calorimetry measurements of stride mean metabolic cost (Miller, 2014; Koelewijn et al., 2019), estimations of the time series are given without validation (Umberger, 2010; Gonabadi et al., 2020; Pimentel et al., 2021).
There has been increased interest in data-driven methods that do not rely on musculoskeletal simulation. With the advent of methods and sensors that collect large human movement datasets, machine learning methods have become popular for predicting outcomes (Halilaj et al., 2018). Machine learning has already achieved very high performance in areas like interpreting histological images or estimating pressure risks (Zhang et al., 2025). Still, it is also starting to be used to estimate metabolic cost. Several regression-based and advanced machine-learning methods allowed estimating steady-state metabolic costs over shorter and shorter timescales (Selinger and Donelan, 2014). Many commercially available wearable devices (e.g., smartwatches, rings) incorporate algorithms to estimate average metabolic rate. Additionally, various research studies have developed similar algorithms for applications such as managing exercise intensity and nutritional planning. For example, a recent study uses a multi-modal algorithm based on a combination of neural networks to estimate the metabolic rate of treadmill walking in a contactless fashion using image-based sensors (Huang et al., 2024). Selinger and Donelan (2014) developed a technique that fits an exponential function to breath data to reduce the time required to predict the steady-state metabolic cost to about 2 min. Other groups developed sensor fusion methods to estimate at an even shorter timescale; Ingraham et al. (2019) evaluated different wearable sensors (respiratory, EMG, accelerometers, heart rate, and skin temperature sensors) to estimate metabolic costs. They trained different statistical models using regression and found it possible to estimate steady-state metabolic cost with a root mean square error of around 1 W kg-1 using 4-5 sensor modalities. In Slade et al. (2019) regression and neural network models were used to estimate steady-state metabolic cost from EMG and treadmill ground reaction forces. They could estimate the metabolic cost in a very short time (∼1 s) with an error of 8.0%.
Autoencoders (AE) are neural networks that work with machine learning and artificial intelligence. Many data science studies discuss optimization of their use, training, and performance (Vincent et al., 2010; Xie et al., 2015; Yang et al., 2016; Chai et al., 2019). In medical research, AEs are used for image processing and classification. Myronenko (2018) used an autoencoder for MRI image processing and segmentation. Ma et al. (2022) employ an enhanced edge-attention-autoencoder to improve image segmentation. Ding et al. (2019) show how image segmentation for cancer diagnosis proved reliable and faster than radiologists. AEs have also been applied in biomechanics. For example, Portnova-Fahreeva et al. (2023) employed an AE controller to perform dimensionality reduction to control a high-dimensional prosthetic hand. Huang and Zhang (2023) employed a variational AE to generate three-dimensional models of the lumbar spine for use in disease analysis and population modeling. Finally, Diethelm et al. (2024) implemented a long-short-term memory AE to detect anomalies in kinematic movement data. Dindorf et al. (2024) employed a variational AE to generate synthetic posture data for signal denoising.
The present study aims to investigate the usability of neural networks for estimating within-stride time series (such as within-stride metabolic cost) using only stride mean data as inputs. The underlying motivation is that the stride mean metabolic cost can be measured using indirect calorimetry (Margaria, 1968; Beaver et al., 1973); consequently, developing methods that estimate time series from single scalars could be useful for estimating within-stride metabolic cost. We evaluate this in a dataset with simulated walking experiments in which the metabolic cost time series can be known for training and validation. In Section 2, we discuss the datasets and models for metabolic cost and the two approaches for estimating within-stride metabolic costs. Section 3 investigates the performance of different architectures. Section 4 presents the results of the optimized networks, while Section 5 concludes with an overall discussion.
2 Methods
In the present study, we compare two general approaches for estimating the metabolic cost time series from the measurable mean metabolic cost: an autoencoder approach - which is implemented in two ways - and an expander approach. We trained the two autoencoders and the decoder using data from 10 model-based metabolic cost timeseries from simulated perturbed walking experiments. After training, we extracted the autoencoders and decoders to reconstruct the metabolic cost time series from an unperturbed walking condition that was left out of the training.
The autoencoder approaches produce a network that maps a mean value to the corresponding time series, such that the instantaneous metabolic cost can be computed directly from the mean cost. The autoencoder (Figure 1a) takes the time series as input, encodes the mean values as the latent space, and then recovers the original time series from the latent space. After training, the decoder is extracted from the autoencoder and used separately to predict metabolic time series directly from their measured means. Our underlying reason for using this approach is the assumption that using a method that has had access to the complete timeseries as inputs could perhaps be more suitable for reconstructing timeseries than methods that never have access to timeseries as inputs. In this manuscript, we investigate this assumption by comparing the performance of autoencoder algorithms to decoder-only algorithms. We also investigated the performance of the autoencoder with both untied and tied weights between the encoder and decoder (Nowlan and Hinton, 1992). We abbreviate the untied autoencoders as UAE and the autoencoders with tied weights and bias as TAE. The expander approach leverages a single network to map a mean value to its corresponding time series, as shown in Figure 1b. In practice, the second approach is comparable to training only the decoder in the autoencoder however, we call this network an expander instead of a decoder to avoid confusion when discussing the two approaches.

Figure 1. Main algorithm structures. (a) An autoencoder is trained to produce a time series from 1 to 100 percent of a gait cycle (e.g., the within-stride metabolic cost time series according to (Umberger, 2010)). The decoder is extracted from the autoencoder, such that it produces the estimated time series using a single value as the input (e.g., the mean metabolic cost of a gait cycle). (b) In a second approach, an expander network is trained directly to expand a single value to a corresponding time series (e.g., the mean metabolic cost to the corresponding within-stride metabolic cost time series).
Both approaches require existing time series and their mean values for training, and we rely on data from simulated walking experiments to satisfy this need. We previously generated data from simulated walking experiments (Dzewaltowski et al., 2024) using a neuromuscular simulation (Song and Geyer, 2015; Song and Geyer, 2018). The simulated walking experiments included both normal walking and 35 different cases of walking with perturbations from a robotic waist tether (Antonellis et al., 2022). The simulated data was used to compute instantaneous metabolic costs using a range of models from the literature (cf. Section 2.2), providing the necessary time series for training the two approaches. We trained the networks to reproduce the model-based within-stride metabolic costs time series using the perturbed walking conditions. We evaluated the performance of the two approaches by assessing their capability to reproduce the time series for unperturbed walking conditions (i.e., normal walking), which was not part of the training dataset.
2.1 Datasets
We used a neuromechanical simulation from Song and Geyer to generate data simulating walking under forced perturbations from a waist tether (Song and Geyer, 2015; Song and Geyer, 2018). Specifically, we ran a two-dimensional variant of the model that restricts motion to the sagittal plane in Simscape First Generation Multibody (MathWorks, Natick, MA). The model contained seven rigid segments simulating the legs and a trunk and 9 Hill-type muscles per leg controlled by a set of 71 muscle-reflex parameters. The 71 control parameters were optimized for each walking condition by running an optimization (Hansen, 2006) that minimized a physiologically-inspired cost function that strives to make the model walk without falling and with a minimal muscle activation sum (Dzewaltowski et al., 2024). In this framework, we simulated the effects of forward force perturbations at the hip. We simulated 32 sinusoidal force profiles with peak timings covering the entire gait cycle and peak forces ranging from 0% to 24% percent of body weight, three constant force profiles, and an unperturbed walking condition for a total of 36 conditions. After optimizing the control parameters for each walking condition, we extracted the time series to constitute the dataset for the present study. The dataset generated by this experiment is similar to the type of data that one could obtain from human motion capture experiments. For the estimation algorithm, we only used signals that are available from human motion capture experiments, such as’ strideaverage metabolic cost, joint kinematics and kinetics and muscle activations.
2.2 Model-based metabolic cost
We trained and evaluated our networks using 10 different model-based metabolic costs. Since the actual within-stride metabolic cost is not available, we evaluated our method “in silico” using simulated-within-stride metabolic cost based on methods proposed in the literature. We selected a relatively large range of model-based methods to maximize confidence in the evaluation.
We used the model-based metabolic cost methods from Bhargava, Houdijk, Lichtwark, and Umberger to generate metabolic cost time series based on force, length, and velocity time series from the muscles from the neuromuscular simulation (Bhargava et al., 2004; Lichtwark and Wilson, 2005; Houdijk et al., 2006; Umberger, 2010). Each method generates metabolic cost based on the sum of mechanical work from the muscles and energy losses from heat using slightly different proposed equations. The within-stride metabolic cost time series is produced by taking the sum of all the leg muscles. The method from Margaria estimates metabolic cost time series based on the positive and negative work (Margaria, 1968). We also used additional model-based methods from Kim and Roberts, Beck, Margaria, and Minetti to generate metabolic cost time series based on purely kinetic and kinematic data from the neuromuscular simulation (Margaria, 1968; Minetti and Alexander, 1997; Kim and Roberts, 2015; Beck et al., 2019). The method from Kim and Roberts uses joint moments and angular velocity, and we refer to the metabolic cost estimated with this model as the Kim Joint. The method from Beck uses the sum of EMG signals, which we refer to as the EMG Sum. The equation derived from Margaria was applied to joint powers and center-of-mass power similar to its implementation in (Caputo and Collins, 2014). We refer to these as Margaria Joint and Maragaria COM. The method from Minetti and Alexander estimates metabolic cost using joint moments and angular velocity, and we refer to this as Minetti Joint. Detailed explanations of the implementations are in Supplementary Material of Dzewaltowski et al. (2024).
2.3 Network training procedure
For both types of network approaches, the training data consists of a set of within-stride metabolic cost time series,
where

Figure 2. Training Process. (a) The training process used for the autoencoder with the loss function used. (b) The training process used for the expander approach with the loss function.
For the expander (Figure 2b), the set of mean values,
which is the mean-square error between the original and reproduced time series where
2.4 Network application procedure for estimating the within-stride time series
The three networks (two autoencoders and one expander) were trained using the 10 metabolic cost models computed from the simulated walking data for only the perturbed walking conditions. The metabolic costs for the unperturbed walking condition were reserved for validation of the trained networks. After training, the decoders were extracted from the autoencoders to identify the metabolic time series from a given stride mean value. The expander was used in the same way as the extracted decoders. Figure 3 presents the application process of the two methods, which shows how the mean value is used as the only input to either network to identify the corresponding time series. After the training is completed, both approaches can estimate within-stride metabolic cost time series without needing time series as inputs.
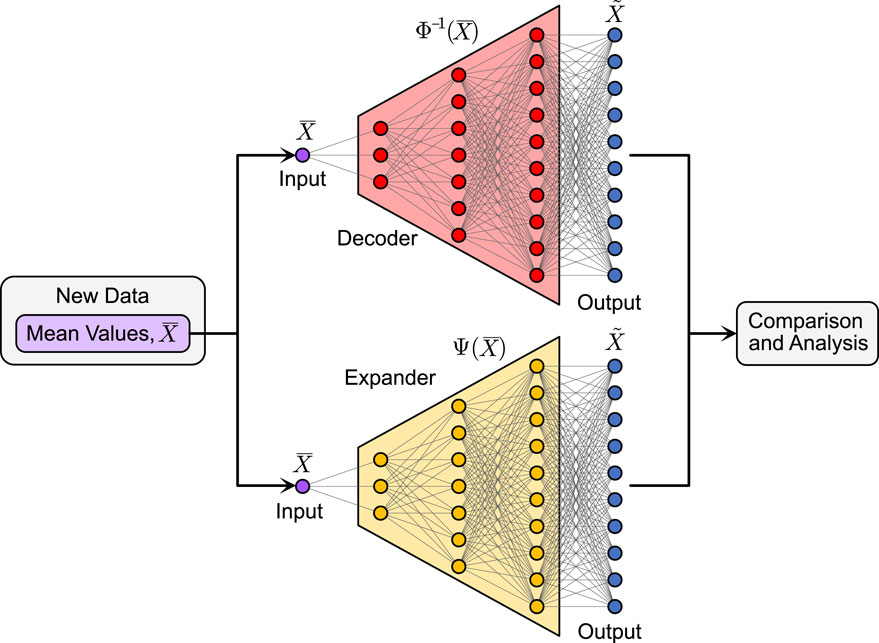
Figure 3. Application Process. In the application step, the stride mean value of an unknown time series (e.g., within-stride metabolic cost) is passed as input to the decoder or expander to estimate the corresponding time series. Note that the decoders and expanders are applied separately using the same input data.
2.5 Tuning of network architecture
We evaluated different architectures and compared their performance by computing the Pearson correlation coefficient,
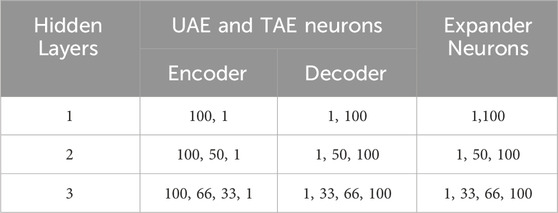
Table 1. Network Architectures. The architectures listed in the table are used to study the effect of the number of layers on the performance of each network.
The results of the network architecture study are presented in Figures 4a–c for the UAE, TAE, and expander, respectively, for the ten metabolic costs. The results show that the UAE and expander networks converge to the same result when two or more hidden layers are included as expected. The TAE networks appear to converge to the same values regardless of the number of layers, but there are small variations in the
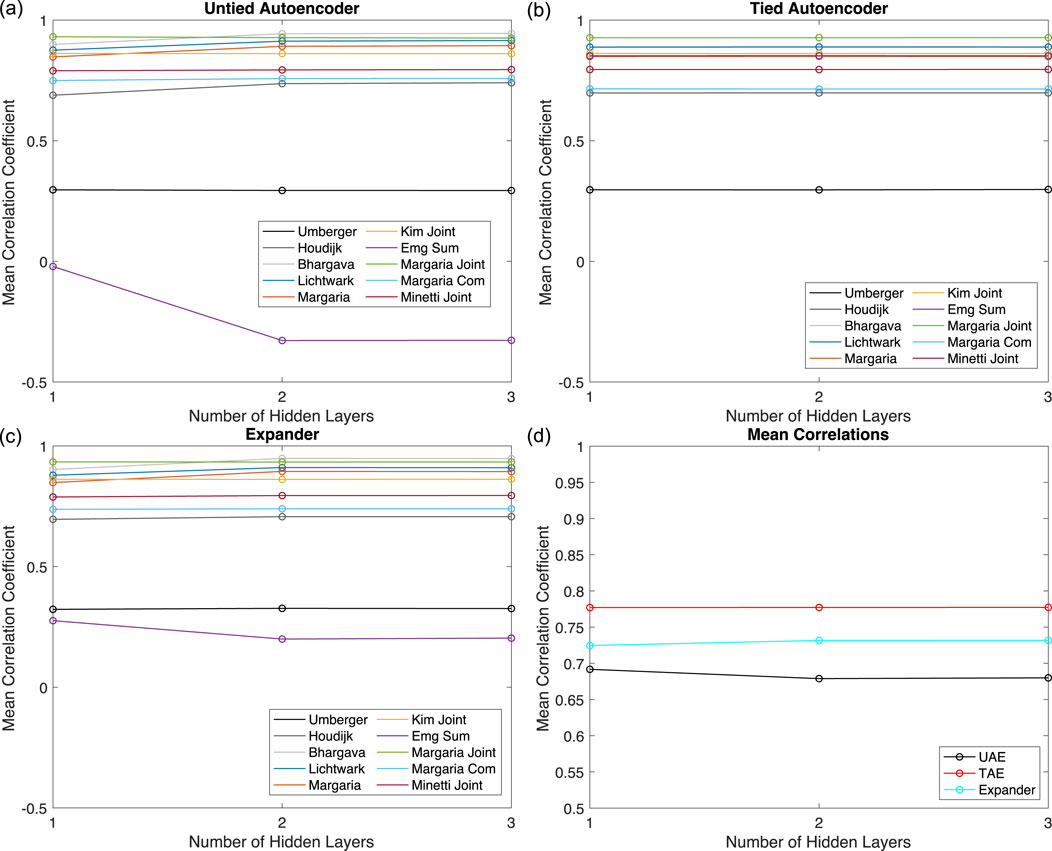
Figure 4. Network Architecture Results. The mean
We proceeded with studying the effect of the activation functions on each network’s performance to improve the results for the EMG Sum and Umberger metabolic costs while maintaining the results for the others. We consider six nonlinear activation functions: relu, elu, sigmoid, silu, mish, and tanh. We start with networks with two layers and change the activation function in the layer with 50 neurons. The reason we modify this layer is that the networks need to end with a linear activation function to ensure that the output is scaled appropriately for each metabolic cost. Additionally, some of the metabolic cost models (e.g., Margaria) had negative values for some portions of the gait cycle, which cannot be captured using nonlinear activation functions selected as they converge to fixed values for negative inputs. Just as in the study of the number of layers, we set the number of epochs to 2000, repeat the training process 50 times for each activation function, and then compute the mean
We depict the results for two layers in Figures 5a–c for the UAEs, TAEs, and expanders. We also present the average
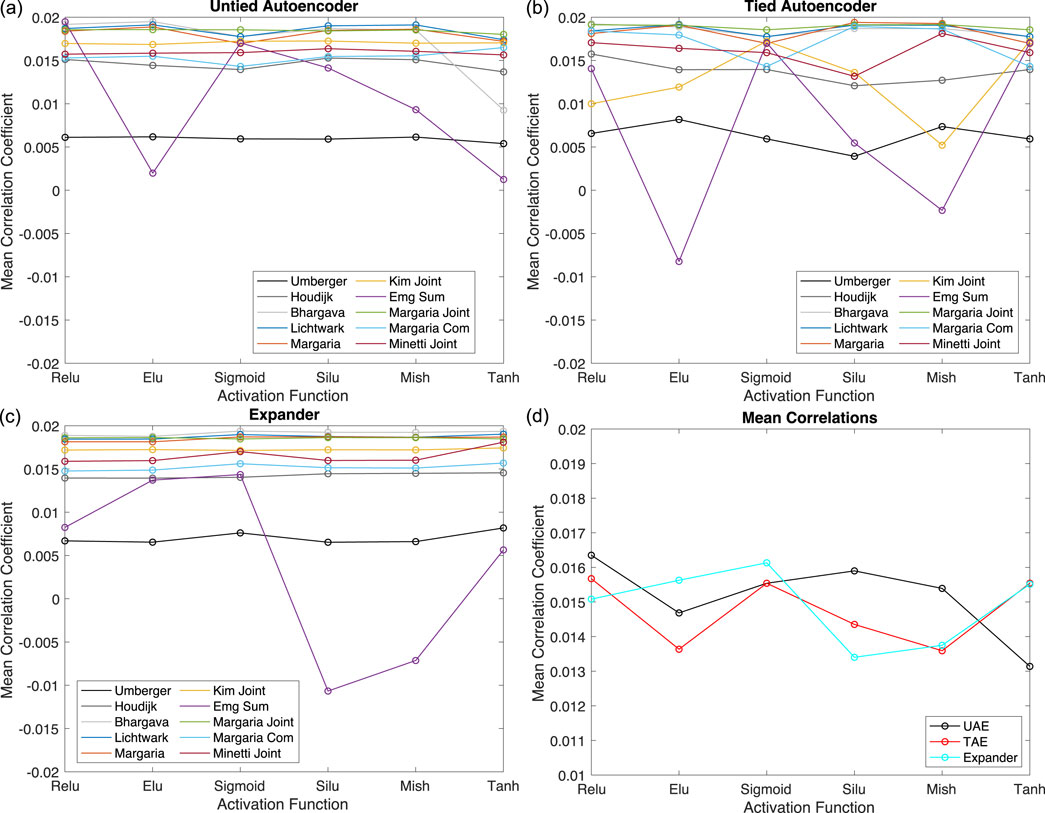
Figure 5. Activation Function Results for Two Hidden Layers. The mean
Based on these results, we switch to the three-layer networks and modify the layer’s activation function with 66 neurons, such that the nonlinear activation function is sandwiched between two layers with linear activation functions. We perform the same study as with the two-layer network with 2000 epochs and 50 trials and present the results in Figures 6a–c for the UAEs, TAEs, and expanders. We also include the performance of the case where a linear activation function is used in the layer with 66 neurons. Figure 6d presents the mean
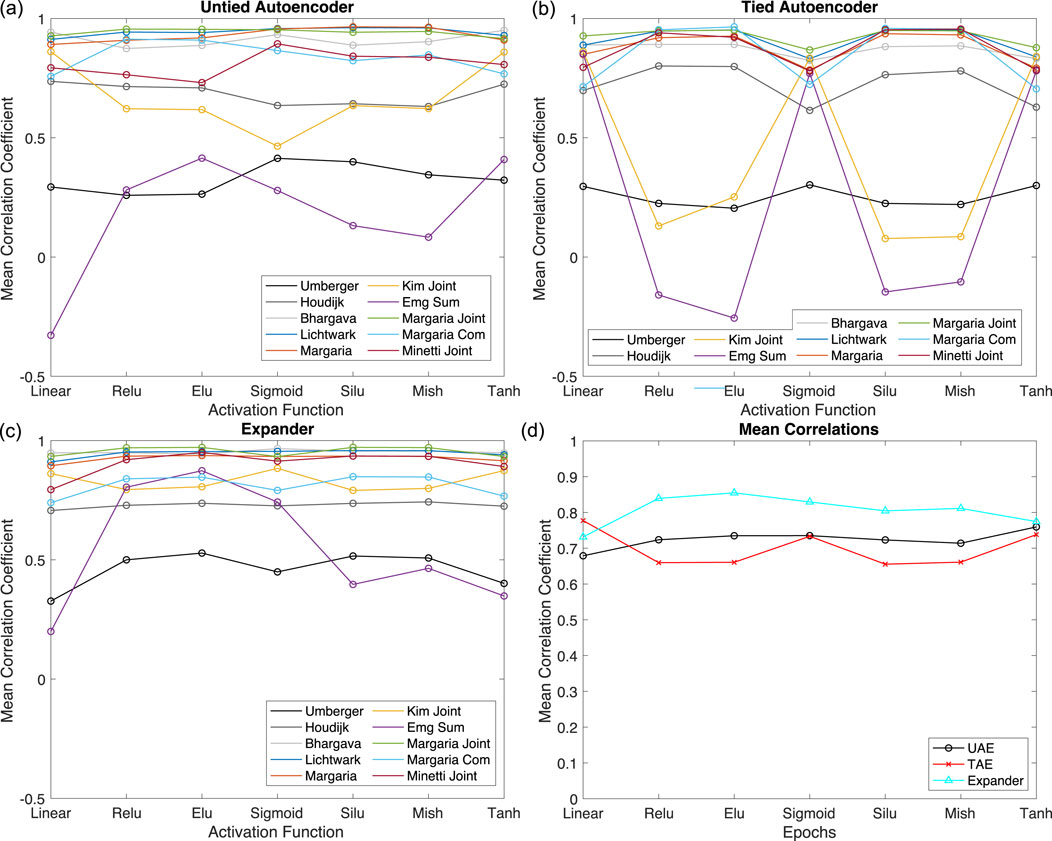
Figure 6. Activation Function Results for Three Hidden Layers. The mean
For the UAEs, the nonlinear activation functions have the biggest effect on model fit for EMG Sum and Kim Joint metabolic costs but have a relatively small effect on the others, including the Umberger metabolic cost that we want to improve. The tanh activation function results in the best overall performance, as seen in Figure 6d. For the TAEs, the nonlinear activation functions have the largest influence on the EMG Sum and Kim Joint metabolic costs, just like the UAEs. An interesting pattern appears where nonlinear activation functions that worsen the EMG Sum, Kim Joint, and the Umberger metabolic costs improve the results for the other metabolic costs, and vice versa. However, the improvement gained for the EMG Sum, Kim Joint, and Umberger metabolic costs is substantially larger than the decrease seen for the other metabolic costs. From Figure 6d, the TAEs perform the best when only linear activation functions are used. For the expanders, we find that all nonlinear activation functions improve the performance of the networks overall compared to the linear activation functions. The EMG Sum and Umberger metabolic costs peak for the elu activation function, and only a small decrease in performance for the Kim Joint is observed for this function. Indeed, Figure 6d shows that using the elu activation function results in the best performance for the expanders.
Based on these results, we fix the number of layers to three and set the activation function in the layer with 66 neurons to tanh, linear, and elu for the UAEs, TAEs, and expanders, respectively. We then proceed with investigating the effect of the number of epochs on the performance of each network using 50 trials just as in the previous studies. We consider the performance of the networks for epochs ranging from 250 to 3,000 with a step size of 250 and also from 3,500 to 10,000 with a step size of 500. We present the results for the UAEs, TAEs, and expanders in Figures 7a–c, respectively, and the mean
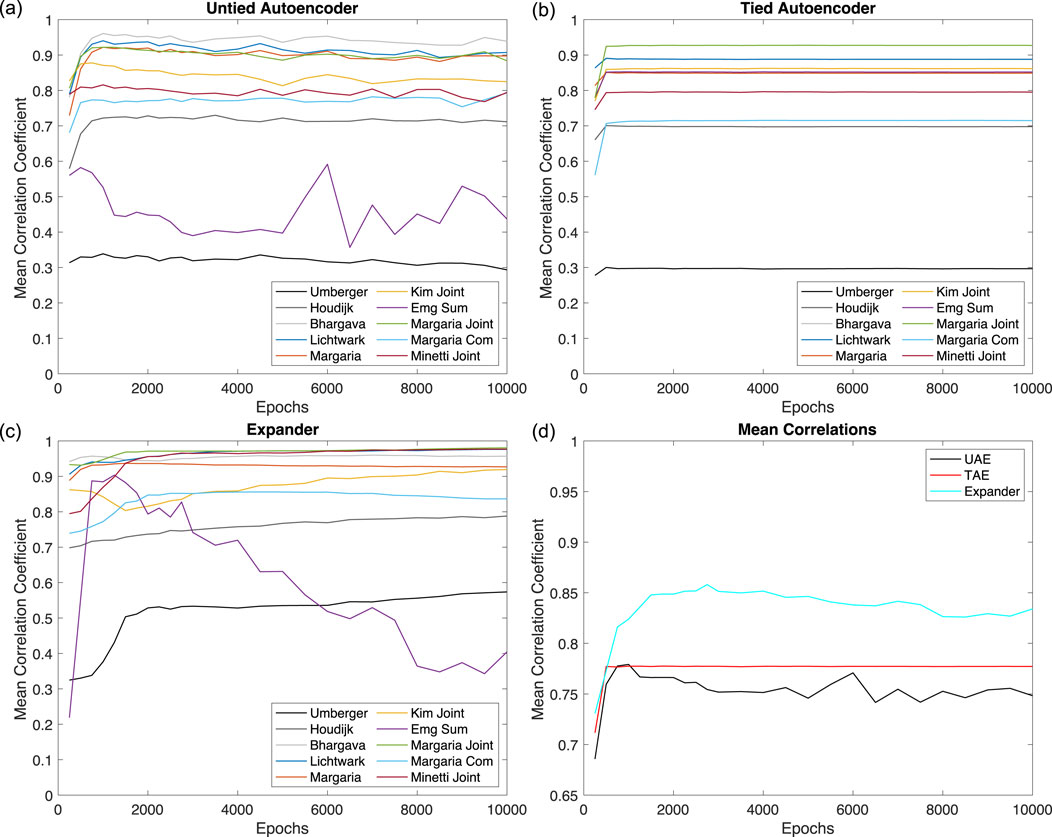
Figure 7. Effect of Training Epochs. Correlation coefficients as a function of epochs. Results indicate that the optimal number of epochs is approximately 2000. (a) Untied autoencoder. (b) Tied Autoencoder. (c) Expander. (d) Mean correlations.
3 Results
Using the best-performing network configurations as discussed in the previous section, we trained each network using the perturbed datasets and then estimated the metabolic cost time series for the unperturbed dataset using the corresponding mean metabolic costs as input. We present the exact and estimated metabolic cost time series for Umberger, Houdijk, Margaria, Bhargava, Lichtwark, and Kim Joint models in Figure 8. We present the remaining models (Margaria COM, EMG Sum, Margaria Joint, and Minetti Joint) in Figure 9. The EMG Sum is provided twice: once with the predictions from all networks and a second time with only the estimation from the expander, which shows that only the expander can reproduce the EMG Sum model. We provide the
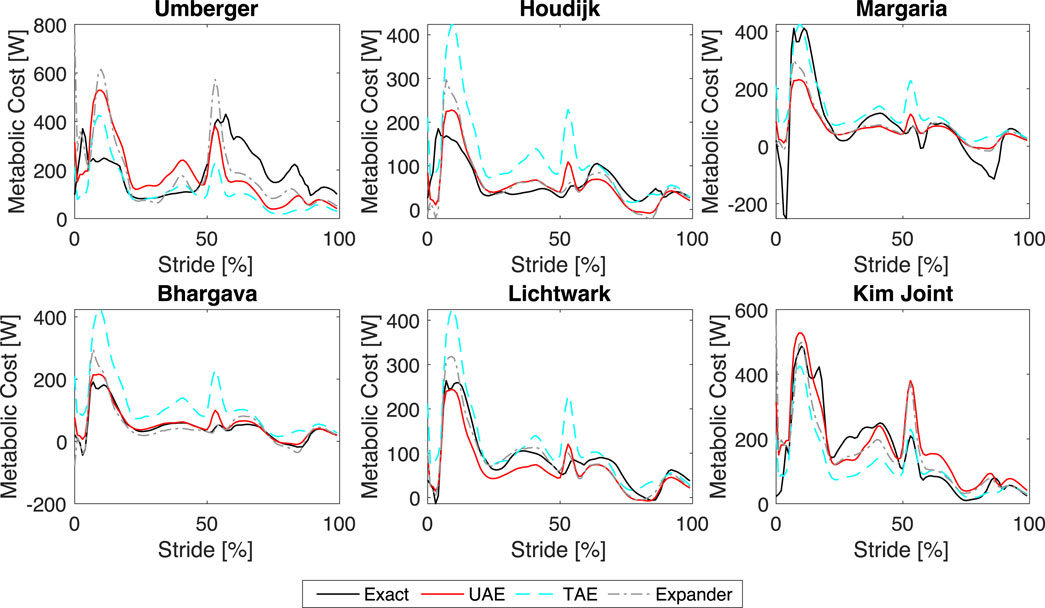
Figure 8. Estimated versus Actual Metabolic Cost Time Series. Comparison of the exact and estimated metabolic cost time series for the Umberger, Houdijk, Margaria, Bhargava, Lichtwark, and Kim Joint models.
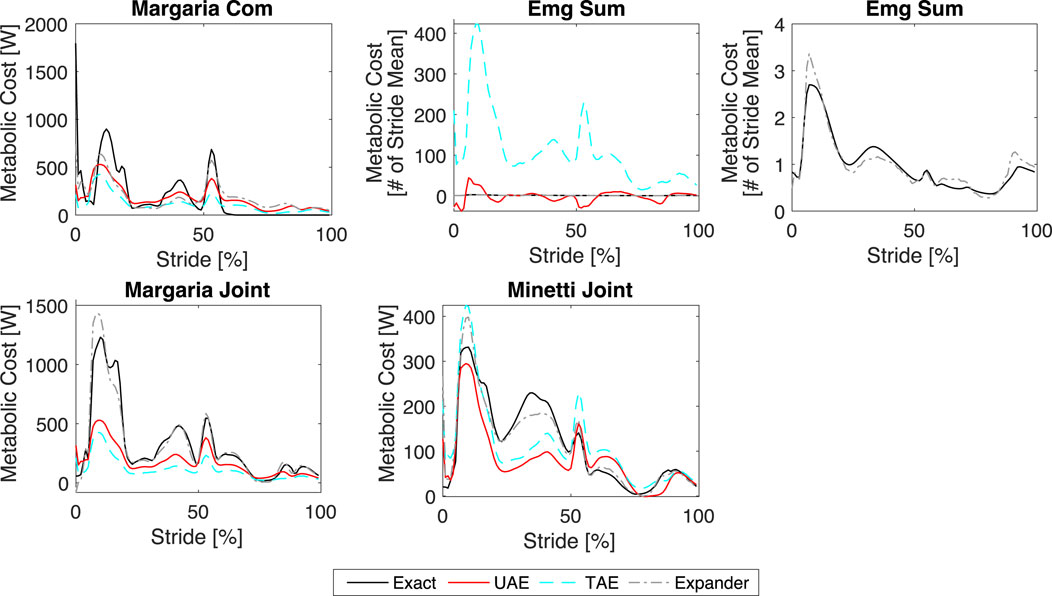
Figure 9. Results. Comparison of the exact and estimated metabolic cost time series for the Margaria COM, EMG Sum, Margaria Joint, and Minetti Joint models.
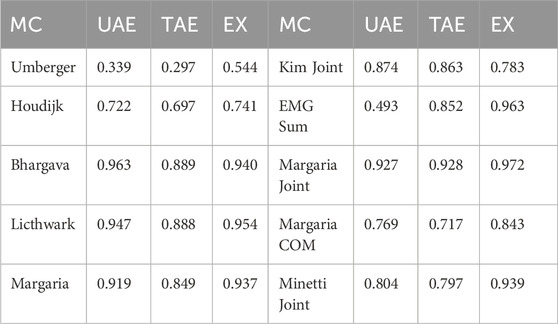
Table 2. Correlation coefficients. The
Next, we consider the mapping from mean metabolic cost to instantaneous cost produced by each network by plotting their outputs as surfaces in Figures 10a–c for the UAE, TAE, and expander, respectively. The surface outputs are computed for mean metabolic costs varying from 0 to 300 W. The surface profile produced by the UAE reveals that the output clusters to three regimes that are connected by step-ups in amplitude. Interestingly, the increases in amplitude occur for all portions of the stride at the same mean metabolic costs, though the amounts of increase vary. To investigate these results, we trained five different UAE networks and compared their surface profiles (not shown here). We found that the stepped-surface profile is a generic result for the UAEs, though the locations and widths of the steps varied for each network. Furthermore, we found that all parts of the profile increased at the same mean metabolic cost values just as seen in Figure 10a, such that this is also a generic result for the UAE.
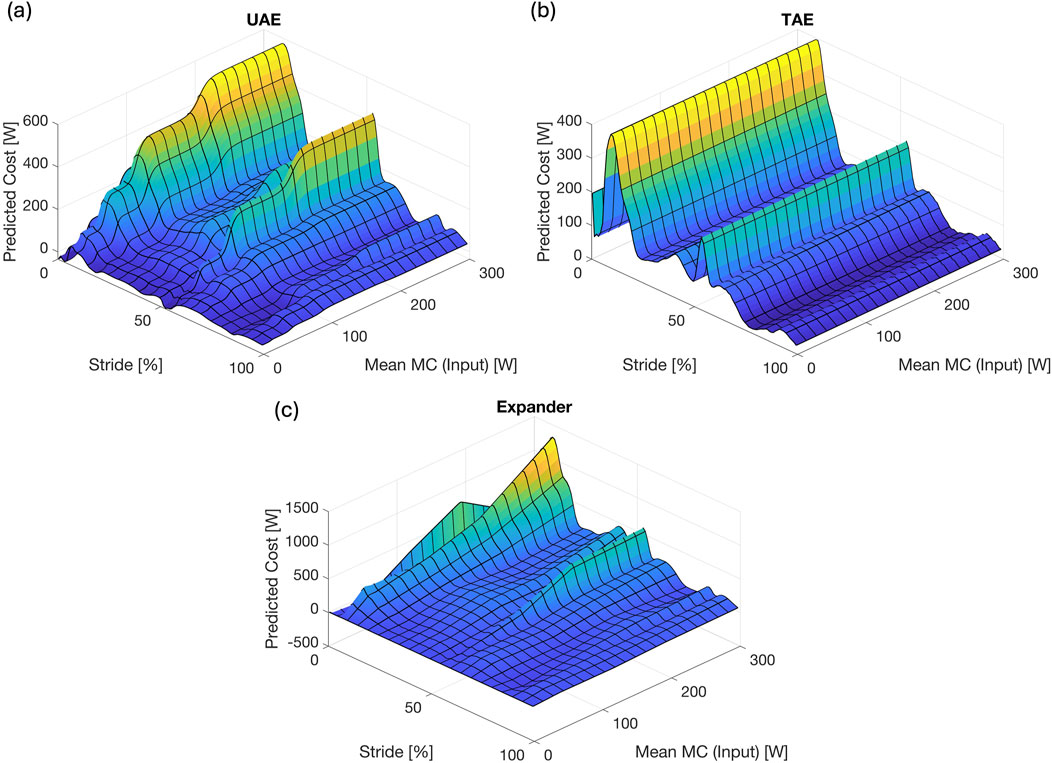
Figure 10. Surface Profiles. Surface profiles for (a) the UAE network, (b) the TAE network, and (c) the expander network.
Interestingly, time series estimated by the TAE appear to have the same shape with only minor differences in amplitude. Several possible explanations exist for this result: first, the TAE may not have enough trainable parameters to adequately capture the variations across the different metabolic cost models; second, the use of linear activation functions causes the TAE to only be able to identify a best approximation of all models; or third, the mapping of instantaneous cost to mean cost is non-invertible and a different model is required to map the mean cost to the instantaneous cost, which cannot be achieved with the TAE due to the tied weights and biases. For the first possible explanation, the TAE has 19310 trainable parameters for this configuration while the UAE and expanders have 28021 and 9010, respectively. Thus, the TAE clearly has enough trainable parameters to capture the variations across the different models. To explore the second reason, we replaced the nonlinear activation functions in the UAE and expander networks with a linear activation function, and then computed their corresponding surface profiles (not shown here). We found that both the UAE and expander networks increased monotonically in instantaneous amplitude as the mean metabolic cost increased, such that they were able to capture the variations in metabolic cost unlike the TAE. Thus, the use of linear activation functions is not the reason for the lack of variation in the TAE surface profile. Instead, we conclude that the mapping from instantaneous to mean metabolic cost is non-invertible and a different mapping is needed to Convert from mean cost to instantaneous cost. This is further supported by the fact that the UAE can reproduce the metabolic cost models better than the TAE across the range of mean costs.
Overall, the surface profile for the expander shows the greatest variation including both increases and decreases in amplitudes as the mean metabolic cost increases. Furthermore, the changes in amplitude do not occur uniformly across the gait cycle unlike the profile for the UAE. Thus, the use of the elu nonlinear activation functions gives the expanders the ability to adapt their amplitudes at different stages of the gait cycle independently for a given mean metabolic cost input. These results suggest that learning the full time series from its mean value is an easier problem to solve than mapping the time series to a mean value then expanding that learned mean back to the time series. This is interesting because one would expect that incorporating the original time series into the network as in the UAE and TAE would produce better results than providing only the mean as the input as in the expander. Furthermore, these results support the conclusion that training a network to map instantaneous metabolic cost to mean produces a model that is non-invertible, and a different model is needed to map the mean cost back to the time series.
4 Discussion
This research investigated the performance of two approaches for estimating the within-stride metabolic cost of the gait cycle directly from the measurable mean metabolic cost. The first approach employed autoencoders to train a decoder to map the mean value to the corresponding time series. The second approach trained an expander network to directly produce the instantaneous metabolic cost from the corresponding mean value. The networks were applied to walking data generated using a neuromechanical simulation under 35 different forced perturbations applied through a waist tether and one unperturbed state. The networks were trained using the perturbed walking datasets then applied to the unperturbed data and the results were evaluated using the Pearson correlation coefficient.
The networks were constructed using an arithmetic sequence from 100 to 1 neuron for the encoders and expanders and the reverse sequence was used for the decoders and expanders. The effect of the number of layers (and number of neurons due to the arithmetic sequence), activation functions, and the number of epochs on the performance of each network were investigated using trials of 50 different networks in each study. The investigation concluded that 3 layers with a nonlinear activation function sandwiched between two linear layers produced the best results for the UAE and expanders, while using only linear activation functions for the TAE networks performed best. The best nonlinear activation function for the UAE was determined to be the tanh function while the elu function was best for the expanders. The optimal number of epochs was found to be 1,000, 500, and 2000 for the UAEs, TAEs, and expanders, respectively.
The results revealed that the UAE and expander were able to reproduce a wider range of metabolic cost models whereas the TAE converged to a single profile that best approximates all models losing the ability to capture the variations of individual models. Looking into the individual series models results, the UAE and TAE performed poorly for the Umberger and EMG Sum models failing to reconstruct the data with acceptable accuracy, whereas the expander showed a more precise reproduction for the same models and a noticeable enhancement for the EMG Sum estimation. Of note, the Umberger model is one of the five models that calculate metabolic cost based on kinetic and kinematic data from the internal muscles of the model (Dzewaltowski et al., 2024). While internal muscle data was used for evaluating the metabolic cost estimation, it was not included as an input to the estimation (training) algorithms to realistically reflect that internal muscle data would not be available during human experiments. The fact that the algorithms did not have access to the source data of the Umberger metabolic cost model could explain the inadequate performance in reconstructing the Umberger model series.
As for the rest of the metabolic cost models, namely, Kim Joint, EMG Sum, Margaria Joint, Margaria COM, and Minetti Joint, these metabolic cost models were based on motion capture and EMG signals. The simulated data for such signals was used as inputs to the estimation algorithms since it is typically available and measurable in human experiments. This probably explains the relatively better evaluation results, except for EMG Sum. We believe that the relatively worse evaluation result for estimating the EMG Sum based metabolic cost could probably be explained by the relatively noisier nature of this metric.
Overall, the expanders performed consistently better than the autoencoders, such that the expanders are recommended for use over the autoencoders. The reasons behind that are related to the fact that the autoencoders compression stage results in significant losses of details in data series leading to a propagation of these losses in the reconstruction stage. To achieve this compression, generally a significant number of hidden layers have to be added into the construction of the auto-encoder with careful selection of activation functions to ensure the accuracy of the compression-reconstruction (Osaulenko, 2021). Expanders on the other hand work better when it comes to series reconstruction especially for complex data series with subtle variations (Prabhu et al., 2017), as seen in the metabolic cost times series. The major strength of the approaches considered here, especially with the expander, is that the networks can produce the instantaneous metabolic cost directly from the mean metabolic cost, providing a window into how different parts of the gait cycle can vary in cost. Once trained, the application of the networks is fast, such that they could be used for quick diagnostics or real time applications, such as energy expenditure estimation during exercise.
One of the limitations of the employed approaches is that they rely on simulated time series for training and optimizing the network parameters. As such, the output of the networks cannot be regarded as the true metabolic cost, but rather a representation of the real cost based on a nonlinear combination of the models used in the training. A related limitation is that this entire research study is done on a simulated walking dataset. Even though this entire research study is done on a simulated walking dataset(s), this method offers an advantage for in silico validation research since the ground truth metabolic cost is known because it is defined during the generation of the simulation. We acknowledge the importance of experimental validation, and to that end our group is actively working on collecting data for human perturbation experiments as well as the recently published walking dataset (Antonellis et al., 2022; Dzewaltowski et al., 2024). Additionally, creative validation approaches for testing whether estimation methods can reproduce model-based metabolic costs (Dzewaltowski et al., 2024) or evaluating whether the estimation methods can detect induced changes like increased metabolic cost of the swing phase.
Another limitation with the architecture tuning is that only linear layers were used. While the tuning did show some architectures performed better than others the finding of no benefit of adding more than two hidden layers could potentially be explained by this. The performance of the networks could be improved by enriching the dataset with additional models for metabolic cost as well as new datasets generated from enhanced computational models. However, this limitation does not prevent one from applying the networks to study how different physical changes (e.g., aging or therapeutic devices) alter the instantaneous metabolic costs as well as the costs incurred during specific phases of the gait cycle. Improving the confidence and knowledge of the within-stride fluctuations in metabolic cost could be useful for rehabilitation and assistive devices for clinical populations. More specifically this knowledge could enable design rehabilitation interventions that specifically target the costliest phase of the gait cycle and assistive devices that focus assistance during the costliest phase of the gait cycle. Another limitation is that the high performance of the trained networks could be due to an already strong correlation and similarity between the perturbed and unperturbed walking datasets. As such, the results and performance of the networks could be improved by providing a wider range of perturbed conditions using different physical alterations (e.g., perturbing the ankle instead of the waist). Future efforts are focused on creating methods that estimate within-stride metabolic costs that do not rely on those datasets in the training process as well as on the application of the networks discussed here for determining how different physical conditions alter specific phases of the gait cycle. Additionally, further work will focus on leveraging multiple methods for estimating instantaneous metabolic cost to cross-validate the methods while also identifying changes to the cost in specific phases of the gait cycle.
Data availability statement
The original contributions presented in the study are included in the article/Supplementary Material, further inquiries can be directed to the corresponding author.
Author contributions
MM: Investigation, Methodology, Writing – original draft, Writing – review and editing, Data curation. AD: Data curation, Software, Writing – original draft, Writing – review and editing, Investigation. PM: Funding acquisition, Methodology, Project administration, Resources, Software, Supervision, Visualization, Writing – original draft, Writing – review and editing, Investigation. KM: Conceptualization, Data curation, Formal Analysis, Funding acquisition, Investigation, Methodology, Software, Validation, Visualization, Writing – original draft, Writing – review and editing.
Funding
The author(s) declare that financial support was received for the research and/or publication of this article. MM and KM were supported through NSF, grant number 2203144. PM received support from NSF 2203143, NIH P20GM109090, NIH P20GM152301. The conclusions in this article are only those of the authors and do not necessarily reflect the views of the funders.
Acknowledgments
The authors thank Seungmoon Song for supporting the generation of generating the simulated dataset and Daniel Ferris and Eric Perrault for their advice with writing the proposal for this project.
Conflict of interest
The authors declare that the research was conducted in the absence of any commercial or financial relationships that could be construed as a potential conflict of interest.
Generative AI statement
The author(s) declare that no Generative AI was used to create this manuscript.
Publisher’s note
All claims expressed in this article are solely those of the authors and do not necessarily represent those of their affiliated organizations, or those of the publisher, the editors and the reviewers. Any product that may be evaluated in this article, or claim that may be made by its manufacturer, is not guaranteed or endorsed by the publisher.
Supplementary material
The Supplementary Material for this article can be found online at: https://www.frontiersin.org/articles/10.3389/fbioe.2025.1579085/full#supplementary-material
References
Antonellis, P., Mohammadzadeh Gonabadi, A., Myers, S. A., Pipinos, I. I., and Malcolm, P. (2022). Metabolically efficient walking assistance using optimized timed forces at the waist. Sci. Robot. 7, eabh1925. doi:10.1126/scirobotics.abh1925
Beaver, W. L., Wasserman, K., and Whipp, B. J. (1973). On-line computer analysis and breath-by-breath graphical display of exercise function tests. J. Appl. Physiol. 34, 128–132. doi:10.1152/jappl.1973.34.1.128
Beck, O. N., Punith, L. K., Nuckols, R. W., and Sawicki, G. S. (2019). Exoskeletons improve locomotion economy by reducing active muscle volume. Exerc. Sport Sci. Rev. 47, 237–245. doi:10.1249/jes.0000000000000204
Bhargava, L. J., Pandy, M. G., and Anderson, F. C. (2004). A phenomenological model for estimating metabolic energy consumption in muscle contraction. J. Biomechanics 37, 81–88. doi:10.1016/s0021-9290(03)00239-2
Caputo, J. M., and Collins, S. H. (2014). Prosthetic ankle push-off work reduces metabolic rate but not collision work in non-amputee walking. Sci. Rep. 4, 7213. doi:10.1038/srep07213
Chai, Z., Song, W., Wang, H., and Liu, F. (2019). A semi-supervised auto-encoder using label and sparse regularizations for classification. Appl. Soft Comput. 77, 205–217. doi:10.1016/j.asoc.2019.01.021
Diethelm, M., Edelmann, A., Bogjeska, J., and Graf, E. (2024). Movement analysis with LSTM autoencoder for anomaly detection. Zurich University of Applied Sciences. Available online at: https://www.zhaw.ch/storage/engineering/institute-zentren/cai/studentische_arbeiten/Fall_2024/PA24_Movement_Analysis_with_LSTM_Autoencoder_for_Anomaly_Detection_diethmik_edelmanj.pdf?utm_source=chatgpt.com.
Dindorf, C., Dully, J., Konradi, J., Wolf, C., Becker, S., Simon, S., et al. (2024). Enhancing biomechanical machine learning with limited data: generating realistic synthetic posture data using generative artificial intelligence. Front. Bioeng. Biotechnol. 12, 1350135. doi:10.3389/fbioe.2024.1350135
Ding, L., Liu, G.-W., Zhao, B.-C., Zhou, Y.-P., Li, S., Zhang, Z.-D., et al. (2019). Artificial intelligence system of faster region-based convolutional neural network surpassing senior radiologists in evaluation of metastatic lymph nodes of rectal cancer. Chin. Med. J. (Engl.) 132, 379–387. doi:10.1097/cm9.0000000000000095
Doke, J., Donelan, J. M., and Kuo, A. D. (2007). Mechanics and energetics of swinging the human leg. J. Exp. Biol. 210, 2399. doi:10.1242/jeb.006767
Dzewaltowski, A. C., Antonellis, P., Gonabadi, A. M., Song, S., and Malcolm, P. (2024). Perturbation-based estimation of within-stride cycle metabolic cost. J. Neuroeng. Rehabil. 21, 131. doi:10.1186/s12984-024-01424-8
Franz, J. R. (2016). The age-associated reduction in propulsive power generation in walking. Exerc. Sport Sci. Rev. 44, 129–136. doi:10.1249/jes.0000000000000086
Gonabadi, A. M., Antonellis, P., and Malcolm, P. (2020). Differences between joint-space and musculoskeletal estimations of metabolic rate time profiles. PLoS Comput. Biol. 16, e1008280. doi:10.1371/journal.pcbi.1008280
Gottschall, J. S., and Kram, R. (2005). Energy cost and muscular activity required for leg swing during walking. J. Appl. Physiol. 99, 23–30. doi:10.1152/japplphysiol.01190.2004
Halilaj, E., Rajagopal, A., Fiterau, M., Hicks, J. L., Hastie, T. J., and Delp, S. L. (2018). Machine learning in human movement biomechanics: Best practices, common pitfalls, and new opportunities. J. Biomech. 81, 1–11. doi:10.1016/j.jbiomech.2018.09.009
Hansen, N. (2006). The CMA evolution strategy: a comparing review. Stud. Fuzziness Soft Comput. 192, 75–102. doi:10.1007/11007937_4
Hicks, J. L., Uchida, T. K., Seth, A., Rajagopal, A., and Delp, S. L. (2015). Is my model good enough? Best practices for verification and validation of musculoskeletal models and simulations of movement. J. Biomech. Eng. 137, 020905. doi:10.1115/1.4029304
Houdijk, H., Bobbert, M. F., and de Haan, A. (2006). Evaluation of a Hill based muscle model for the energy cost and efficiency of muscular contraction. J. Biomech. 39, 536–543. doi:10.1016/j.jbiomech.2004.11.033
Huang, K., and Zhang, J. (2023). Three-dimensional lumbar spine generation using variational autoencoder. Med. Eng. Phys. 120, 104046. doi:10.1016/j.medengphy.2023.104046
Huang, S., Dai, H., Yu, X., Wu, X., Wang, K., Hu, J., et al. (2024). A contactless monitoring system for accurately predicting energy expenditure during treadmill walking based on an ensemble neural network. iScience 27, 109093. doi:10.1016/j.isci.2024.109093
Ingraham, K., Ferris, D. P., and David Remy, C. (2019). Predicting energy cost from wearable sensors: a dataset of energetic and physiological wearable sensor data from healthy individuals performing multiple physical activities. doi:10.6084/M9.FIGSHARE.7473191
Kim, J. H., and Roberts, D. (2015). A joint-space numerical model of metabolic energy expenditure for human multibody dynamic system. Int. J. Numer. method. Biomed. Eng. 31, e02721. doi:10.1002/cnm.2721
Kingma, D. P., and Ba, J. (2014). Adam: a method for stochastic optimization. arXiv [cs.LG]. doi:10.48550/arXiv.1412.6980
Koelewijn, A. D., Heinrich, D., and van den Bogert, A. J. (2019). Metabolic cost calculations of gait using musculoskeletal energy models, a comparison study. bioRxiv. doi:10.1101/588590
Lichtwark, G. A., and Wilson, A. M. (2005). A modified Hill muscle model that predicts muscle power output and efficiency during sinusoidal length changes. J. Exp. Biol. 208, 2831–2843. doi:10.1242/jeb.01709
Ma, S., Li, X., Tang, J., and Guo, F. (2022). EAA-Net: rethinking the autoencoder architecture with intra-class features for medical image segmentation. arXiv [cs.CV]. doi:10.48550/arXiv.2208.09197
Margaria, R. (1968). Positive and negative work performances and their efficiencies in human locomotion. Int. Z. für Angew. Physiol. Einschließlich Arbeitsphysiologie 25, 339–351. doi:10.1007/bf00699624
Marsh, R. L., Ellerby, D. J., Carr, J. A., Henry, H. T., and Buchanan, C. I. (2004). Partitioning the energetics of walking and running: swinging the limbs is expensive. Science 303, 80–83. doi:10.1126/science.1090704
Martin, P. E., Rothstein, D. E., and Larish, D. D. (1992). Effects of age and physical activity status on the speed-aerobic demand relationship of walking. J. Appl. Physiol. 73, 200–206. doi:10.1152/jappl.1992.73.1.200
Mian, O. S., Thom, J. M., Ardigò, L. P., Narici, M. V., and Minetti, A. E. (2006). Metabolic cost, mechanical work, and efficiency during walking in young and older men. Acta Physiol. (Oxf.) 186, 127–139. doi:10.1111/j.1748-1716.2006.01522.x
Miller, R. H. (2014). A comparison of muscle energy models for simulating human walking in three dimensions. J. Biomech. 47, 1373–1381. doi:10.1016/j.jbiomech.2014.01.049
Minetti, A. E., and Alexander, R. M. (1997). A theory of metabolic costs for bipedal gaits. J. Theor. Biol. 186, 467–476. doi:10.1006/jtbi.1997.0407
Morris, J. N., and Hardman, A. E. (1997). Walking to health. Sports Med. 23, 306–332. doi:10.2165/00007256-199723050-00004
Myronenko, A. (2018). 3D MRI brain tumor segmentation using autoencoder regularization. Available online at: http://arxiv.org/abs/1810.11654 (Accessed October 28, 2024).
Nowlan, S. J., and Hinton, G. E. (1992). Simplifying neural networks by soft weight-sharing. Neural comput. 4, 473–493. doi:10.1162/neco.1992.4.4.473
Ortega, J. D., Fehlman, L. A., and Farley, C. T. (2008). Effects of aging and arm swing on the metabolic cost of stability in human walking. J. Biomech. 41, 3303–3308. doi:10.1016/j.jbiomech.2008.06.039
Osaulenko, V. M. (2021). Expansion of information in the binary autoencoder with random binary weights. Neural comput. 33, 3073–3101. doi:10.1162/neco_a_01435
Pimentel, R. E., Pieper, N. L., Clark, W. H., and Franz, J. R. (2021). Muscle metabolic energy costs while modifying propulsive force generation during walking. Comput. Methods Biomech. Biomed. Engin. 24 (14), 1552–1565. doi:10.1080/10255842.2021.1900134
Platts, M. M., Rafferty, D., and Paul, L. (2006). Metabolic cost of over ground gait in younger stroke patients and healthy controls. Med. Sci. Sports Exerc. 38, 1041–1046. doi:10.1249/01.mss.0000222829.34111.9c
Portnova-Fahreeva, A. A., Rizzoglio, F., Mussa-Ivaldi, F. A., and Rombokas, E. (2023). Autoencoder-based myoelectric controller for prosthetic hands. Front. Bioeng. Biotechnol. 11, 1134135. doi:10.3389/fbioe.2023.1134135
Prabhu, A., Varma, G., and Namboodiri, A. (2017). Deep Expander networks: efficient deep networks from graph theory. arXiv [cs.CV]. doi:10.1007/978-3-030-01261-8_2
Roberts, D., Hillstrom, H., and Kim, J. H. (2016). Instantaneous metabolic cost of walking: joint-space dynamic model with subject-specific heat rate. PLoS One 11, e0168070. doi:10.1371/journal.pone.0168070
Rose, J., Gamble, J. G., Burgos, A., Medeiros, J., and Haskell, W. L. (1990). Energy expenditure index of walking for normal children and for children with cerebral palsy. Dev. Med. Child. Neurol. 32, 333–340. doi:10.1111/j.1469-8749.1990.tb16945.x
Selinger, J. C., and Donelan, J. M. (2014). Estimating instantaneous energetic cost during non-steady-state gait. J. Appl. Physiol. 117, 1406–1415. doi:10.1152/japplphysiol.00445.2014
Slade, P., Troutman, R., Kochenderfer, M. J., Collins, S. H., and Delp, S. L. (2019). Rapid energy expenditure estimation for ankle assisted and inclined loaded walking. J. Neuroeng. Rehabil. 16, 67. doi:10.1186/s12984-019-0535-7
Song, S., and Geyer, H. (2015). A neural circuitry that emphasizes spinal feedback generates diverse behaviours of human locomotion. J. Physiol. 593, 3493–3511. doi:10.1113/jp270228
Song, S., and Geyer, H. (2018). Predictive neuromechanical simulations indicate why walking performance declines with ageing. J. Physiol. 596, 1199–1210. doi:10.1113/jp275166
Umberger, B. R. (2010). Stance and swing phase costs in human walking. J. R. Soc. Interface 7, 1329–1340. doi:10.1098/rsif.2010.0084
Umberger, B. R., Gerritsen, K. G. M., and Martin, P. E. (2003). A model of human muscle energy expenditure. Comput. Methods Biomech. Biomed. Engin. 6, 99–111. doi:10.1080/1025584031000091678
Umberger, B. R., and Rubenson, J. (2011). Understanding muscle energetics in locomotion. Exerc. Sport Sci. Rev. 39, 59–67. doi:10.1097/jes.0b013e31820d7bc5
Vincent, P., Larochelle, H., Lajoie, I., Bengio, Y., and Manzagol, P.-A. (2010). Stacked denoising autoencoders: learning useful representations in a deep network with a local denoising criterion. J. Mach. Learn. Res. 11, 3371–3408.
Whipp, B. J., and Ward, S. A. (1990). Physiological determinants of pulmonary gas exchange kinetics during exercise. Med. Sci. Sports Exerc. 22, 62–71. doi:10.1249/00005768-199002000-00011
Whipp, B. J., Ward, S. A., Lamarra, N., Davis, J. A., and Wasserman, K. (1982). Parameters of ventilatory and gas exchange dynamics during exercise. J. Appl. Physiol. 52, 1506–1513. doi:10.1152/jappl.1982.52.6.1506
Xie, J., Girshick, R., and Farhadi, A. (2015). Unsupervised deep embedding for clustering analysis. arXiv [cs.LG]. doi:10.48550/arXiv.1511.06335
Yang, B., Fu, X., Sidiropoulos, N. D., and Hong, M. (2016). Towards K-means-friendly spaces: simultaneous deep learning and clustering. arXiv [cs.LG]. doi:10.48550/arXiv.1610.04794
Keywords: walking, biomechanics, energetics, machine learning, system identification
Citation: Mustafa M, Dzewaltowski AC, Malcolm P and Moore KJ (2025) Estimating within-stride metabolic cost from stride-average data using autoencoders and expander networks. Front. Bioeng. Biotechnol. 13:1579085. doi: 10.3389/fbioe.2025.1579085
Received: 18 February 2025; Accepted: 12 May 2025;
Published: 20 June 2025.
Edited by:
Eduardo Palermo, Sapienza University of Rome, ItalyReviewed by:
Wenxin Niu, Tongji University, ChinaTyler A. Wood, Northern Illinois University, United States
Copyright © 2025 Mustafa, Dzewaltowski, Malcolm and Moore. This is an open-access article distributed under the terms of the Creative Commons Attribution License (CC BY). The use, distribution or reproduction in other forums is permitted, provided the original author(s) and the copyright owner(s) are credited and that the original publication in this journal is cited, in accordance with accepted academic practice. No use, distribution or reproduction is permitted which does not comply with these terms.
*Correspondence: Keegan J. Moore, a21vb3JlQGdhdGVjaC5lZHU=
 Manal Mustafa
 Alex C. Dzewaltowski
 Philippe Malcolm
 Keegan J. Moore