 Simon J. Tunster†‡
 Raquel Boqué-Sastre‡
 Gráinne I. McNamara†
 Susan M. Hunter
 Hugo D. J. Creeth
 Rosalind M. John*
- Biomedicine Division, School of Biosciences, Cardiff University, Cardiff, United Kingdom
Hormones from the fetally derived placenta signal to the mother throughout pregnancy to ensure optimal fetal growth and prepare the mother for her new role in nurturing her offspring. Through evolution, placental hormones have under gone remarkable diversification and species-specific expansions thought to be due to constant rebalancing of resource allocation between mother and offspring. Genomic imprinting, an epigenetic process in which parental germlines silence genes in the offspring, is thought to be the physical embodiment of a second conflicting interest, between the male and female mammal. Several genes silenced by paternal imprints normally function to limit the placental endocrine lineages of the mouse placenta. We hypothesized that paternal imprinting has adapted to overcome the rapid evolution of placental hormone gene families by directly regulating the lineages that express these hormones rather than individual hormones. This predicts the existence of genes maternally silenced in the offspring counteracting the influence of the paternal imprint. Here we report on the consequences of loss of function of Paternally expressed gene 3 (Peg3), on placental endocrine lineages. Mutant male placenta displayed a marked loss of the spongiotrophoblast, a key endocrine lineage of the placenta, and the glycogen cell lineage alongside reduced stores of placental glycogen and changes in expression of the normal repertoire of placental hormones. Peg3 is known to transcriptionally repress placental hormone genes. Peg3 consequently both positively and negatively regulates placental hormones through two independent and opposing mechanisms. Female placenta showed moderate response to loss of Peg3 with minor alterations to the junctional zone lineages and few changes in gene expression. These data highlight the important fact that female placenta compensate for the loss of Peg3 better than male placenta. This work lends further support to our novel hypothesis that the parental genomes are competing over the endocrine function of the mouse placenta and further suggests that a conflict between males and females begins in utero.
Introduction
Eutherian mammals provide nutrients to their young in utero via the fetally derived placenta enabling prolonged gestation and the birth of relatively mature offspring central to their reproductive success (John and Hemberger, 2012). Across mammalian species there are a wide variety of placental shapes, sizes, and structures (Carter and Enders, 2004; Capellini et al., 2011) as well as an extensive diversification of several placental hormone gene families (Rawn and Cross, 2008). These rapid changes are thought to reflect the antagonistic yet interdependent relationship between mother and offspring with higher growth rates favoring the offspring and counter-adaptation by the mother to preserve her future reproductive potential (Haig, 1996). A second antagonistic relationship exists between males and females as a consequence of the inequality of resource provision to their mutual offspring. Genomic imprinting, an epigenetic process whereby the paternal and maternal germlines have switched off certain genes inherited by their offspring (Surani, 1998), is thought to be a result of these conflicting interests (Moore and Haig, 1991). However, the continual evolution of placental hormones, which act to extract resources from the mother, poses a unique challenge for this theory of genomic imprinting as rapid evolution would allow genes to continually escape direct imprinting. We previously reported on three maternally silenced genes that function to restrain the development of endocrine lineages of the mouse placenta (Tunster et al., 2010, 2011, 2014, 2016a,b). This led us to hypothesize that the paternal genome has overcome the rapid evolution of placental hormone genes by regulating placental endocrine lineages rather than specific genes. However, evidence for maternal silencing of genes to counteract the action of the paternal genome providing more compelling support for this hypothesis is lacking.
In mice, seven distinct and identifiable lineages manufacture placental hormones (Simmons et al., 2007, 2008; Gasperowicz et al., 2013; Rai and Cross, 2014). The spongiotrophoblast is the most substantial endocrine lineage in terms of cell number (Coan et al., 2006), forming the bulk of the junctional zone sandwiched between the decidua (maternal component of the placenta) and the labyrinth (fetally derived, nutrient exchange). Paternally silenced Pleckstrin Homology-Like Domain, Family A, Member 2 (Phlda2) functions to specifically to restrict the expansion of this lineage with just twofold increased expression reducing the contribution of the spongiotrophoblast to the mature placenta by ∼50% (Tunster et al., 2010, 2016a). Conversely, loss-of-expression of Phlda2 results in a twofold expansion, co-incident with changes in the expression of spongiotrophoblast-expressed hormones (Tunster et al., 2016a). Paternally silenced Achaete-scute complex homolog 2 (Ascl2 aka Mash2) also functions to restrict the expansion of the spongiotrophoblast (Tunster et al., 2016b) while paternally silenced Cyclin dependent kinase inhibitor 1c (Cdkn1c) is required for the proper development of this lineage (Tunster et al., 2011). Cdkn1c support the differentiation of the second major cell type of the junctional zone, the glycogen cell lineage, recognized by stores of glycogen that accumulate as gestation proceeds (Coan et al., 2006). Additionally, there are a number of other genes paternally silenced by virtue of their location on the paternally inactivated X chromosome that regulate cell types within the junctional zone (John and Hemberger, 2012). The spongiotrophoblast and glycogen cell lineages expresses members of the placental lactogen gene family (Prls) (Simmons et al., 2007, 2008). Prls are related to the pituitary hormone prolactin, and some members of this family play an important role in driving the maternal adaptations required for a successful pregnancy (Muller et al., 1999; Bhattacharyya et al., 2002). There are 22 Prl family members in mice of which only Prl3d1 (PL-I) and Prl3b1 (PL-II) have formally been shown to signal via the prolactin receptor (Soares et al., 2007). In addition to Prls, the spongiotrophoblast lineage expresses pregnancy specific glycoproteins (Psgs), a 17 member multigene gene family that contributes to the protection of the semiallotypic fetus from the maternal immune system and remodels placental and maternal vasculature (Moore and Dveksler, 2014). The spongiotrophoblast lineage is important for fetal growth (Tunster et al., 2010, 2014, 2016a) and the priming of maternal care during pregnancy (Creeth et al., 2018), which place demands on maternal resources.
Five distinct trophoblast giant cell (TGC) lineages, recognized by their giant nuclei, also express Prls (Simmons et al., 2007). The secondary parietal (P-) TGC are located as a single discontinuous layer of cells between the maternal decidua, and junctional zone (Simmons et al., 2007). Overexpression of Ascl2 results 40% fewer P-TGCs (Tunster et al., 2016b). Sinusoidal TGCs (S-; previously called trophoblast layer I) are in direct contact with maternal blood spaces in the labyrinth (Simmons et al., 2007, 2008) and Cdkn1c is required for their proper development (Tunster et al., 2011). Spiral artery (SpA-) TGCs line the maternal blood system in the maternal decidua before entry into the junctional zone, canal (C-) TGCs line the maternal blood canals entering the junctional zone and passing through to the labyrinth, and channel (Ch-) TGCs line the maternal blood spaces located beneath the decidua where maternal blood leaves the placenta (Gasperowicz et al., 2013; Rai and Cross, 2014). Alterations in the expression of Phlda2, Ascl2, and Cdkn1c do not appear to have a major impact on these lineages. Only one maternally silenced gene, insulin-like growth factor 2 gene (Igf2), has been well characterized with respect to the placental endocrine lineages. Gain-in-expression of Igf2 promotes the expansion of the glycogen cell and P-TGC lineages with minimal effect on the spongiotrophoblast (Lopez et al., 1996; Esquiliano et al., 2009).
The function of Phlda2, Ascl2, and Cdkn1c in regulating the spongiotrophoblast calls attention to this lineage as site of action for genomic imprinting. However, a paternally expressed gene with an antagonist function on this lineage has not been reported. The maternally silenced Paternally expressed gene 3 (Peg3) plays an important role in both fetal and placental development (Li et al., 1999; Curley et al., 2004). Altered expression of a number of spongiotrophoblast-expressed genes in Peg3 knock out (KO) placenta (Broad et al., 2009; Kim et al., 2013) suggests changes in the relative contribution of this lineage to the placenta. However, not all the reported gene changes were consistent with a simple loss or gain of one or more endocrine lineages. Transcriptional studies on Peg3 are complicated by its function as a zinc finger protein silencing the expression of a number of placental hormone genes, including several Prls and Psgs (Broad and Keverne, 2011; Thiaville et al., 2013; Lee et al., 2015) that are used as markers to identify the seven placental endocrine lineages. Consequently changes in their expression could indicate either a change in cell number or changes in expression within a specific cell type, or potentially both outcomes, highlighting one of the challenges of using cell lineage markers on heterogeneous tissues. To overcome this challenge, we employed a combination of classic histology and gene expression profiling with the newly developed RNAscope technology to characterize placental lineages in male and female Peg3 KO placenta. In addition to finding support for our original hypothesis of parental conflict over the spongiotrophoblast, we observed differences in both the placental lineages and gene transcription between male and female Peg3 KO placenta.
Results
We bred Peg3-/+ (maternal inheritance of targeted allele) Mus musculus 129 mouse strain males derived from the original line (Li et al., 1999; Curley et al., 2004) with wild type (WT) 129 females to generate Peg3+/- (paternal inheritance of targeted allele; KO) and matched Peg3+/+ (WT) fetuses and placenta at E14.5. There were no differences in fetal weights at E14.5 between WT and Peg3 KO fetuses, and no difference by fetal sex (Figure 1A). Peg3 KO placenta were 18–20% lighter than their WT counterparts and wet weights did not differ by fetal sex (Figure 1B). Fetal:placental ratios were not significantly different (Figure 1C). Hematoxylin and eosin (H&E) staining of male and female WT and KO sections suggested subtle differences in the junctional zone with less cell free space (Figure 1D). The intensity of Periodic Acid Schiff (PAS) staining, which identifies glycogen stores (Coan et al., 2006), was similar between the four genotypes (Figure 1E). A biochemical quantification of placental glycogen revealed a substantial difference in total glycogen (F3,81 = 5.88, p = 0.00110; Figure 1F). Male Peg3 KO placenta possessed 43% less total glycogen (p = 0.0075) and female Peg3 KO placenta possessed 35% less (p = 0.0389). Glycogen was different as a proportion of placental weight (F3,81 = 5.88, p = 0.03) but only between WT and KO male placenta (p = 0.046; Figure 1G).
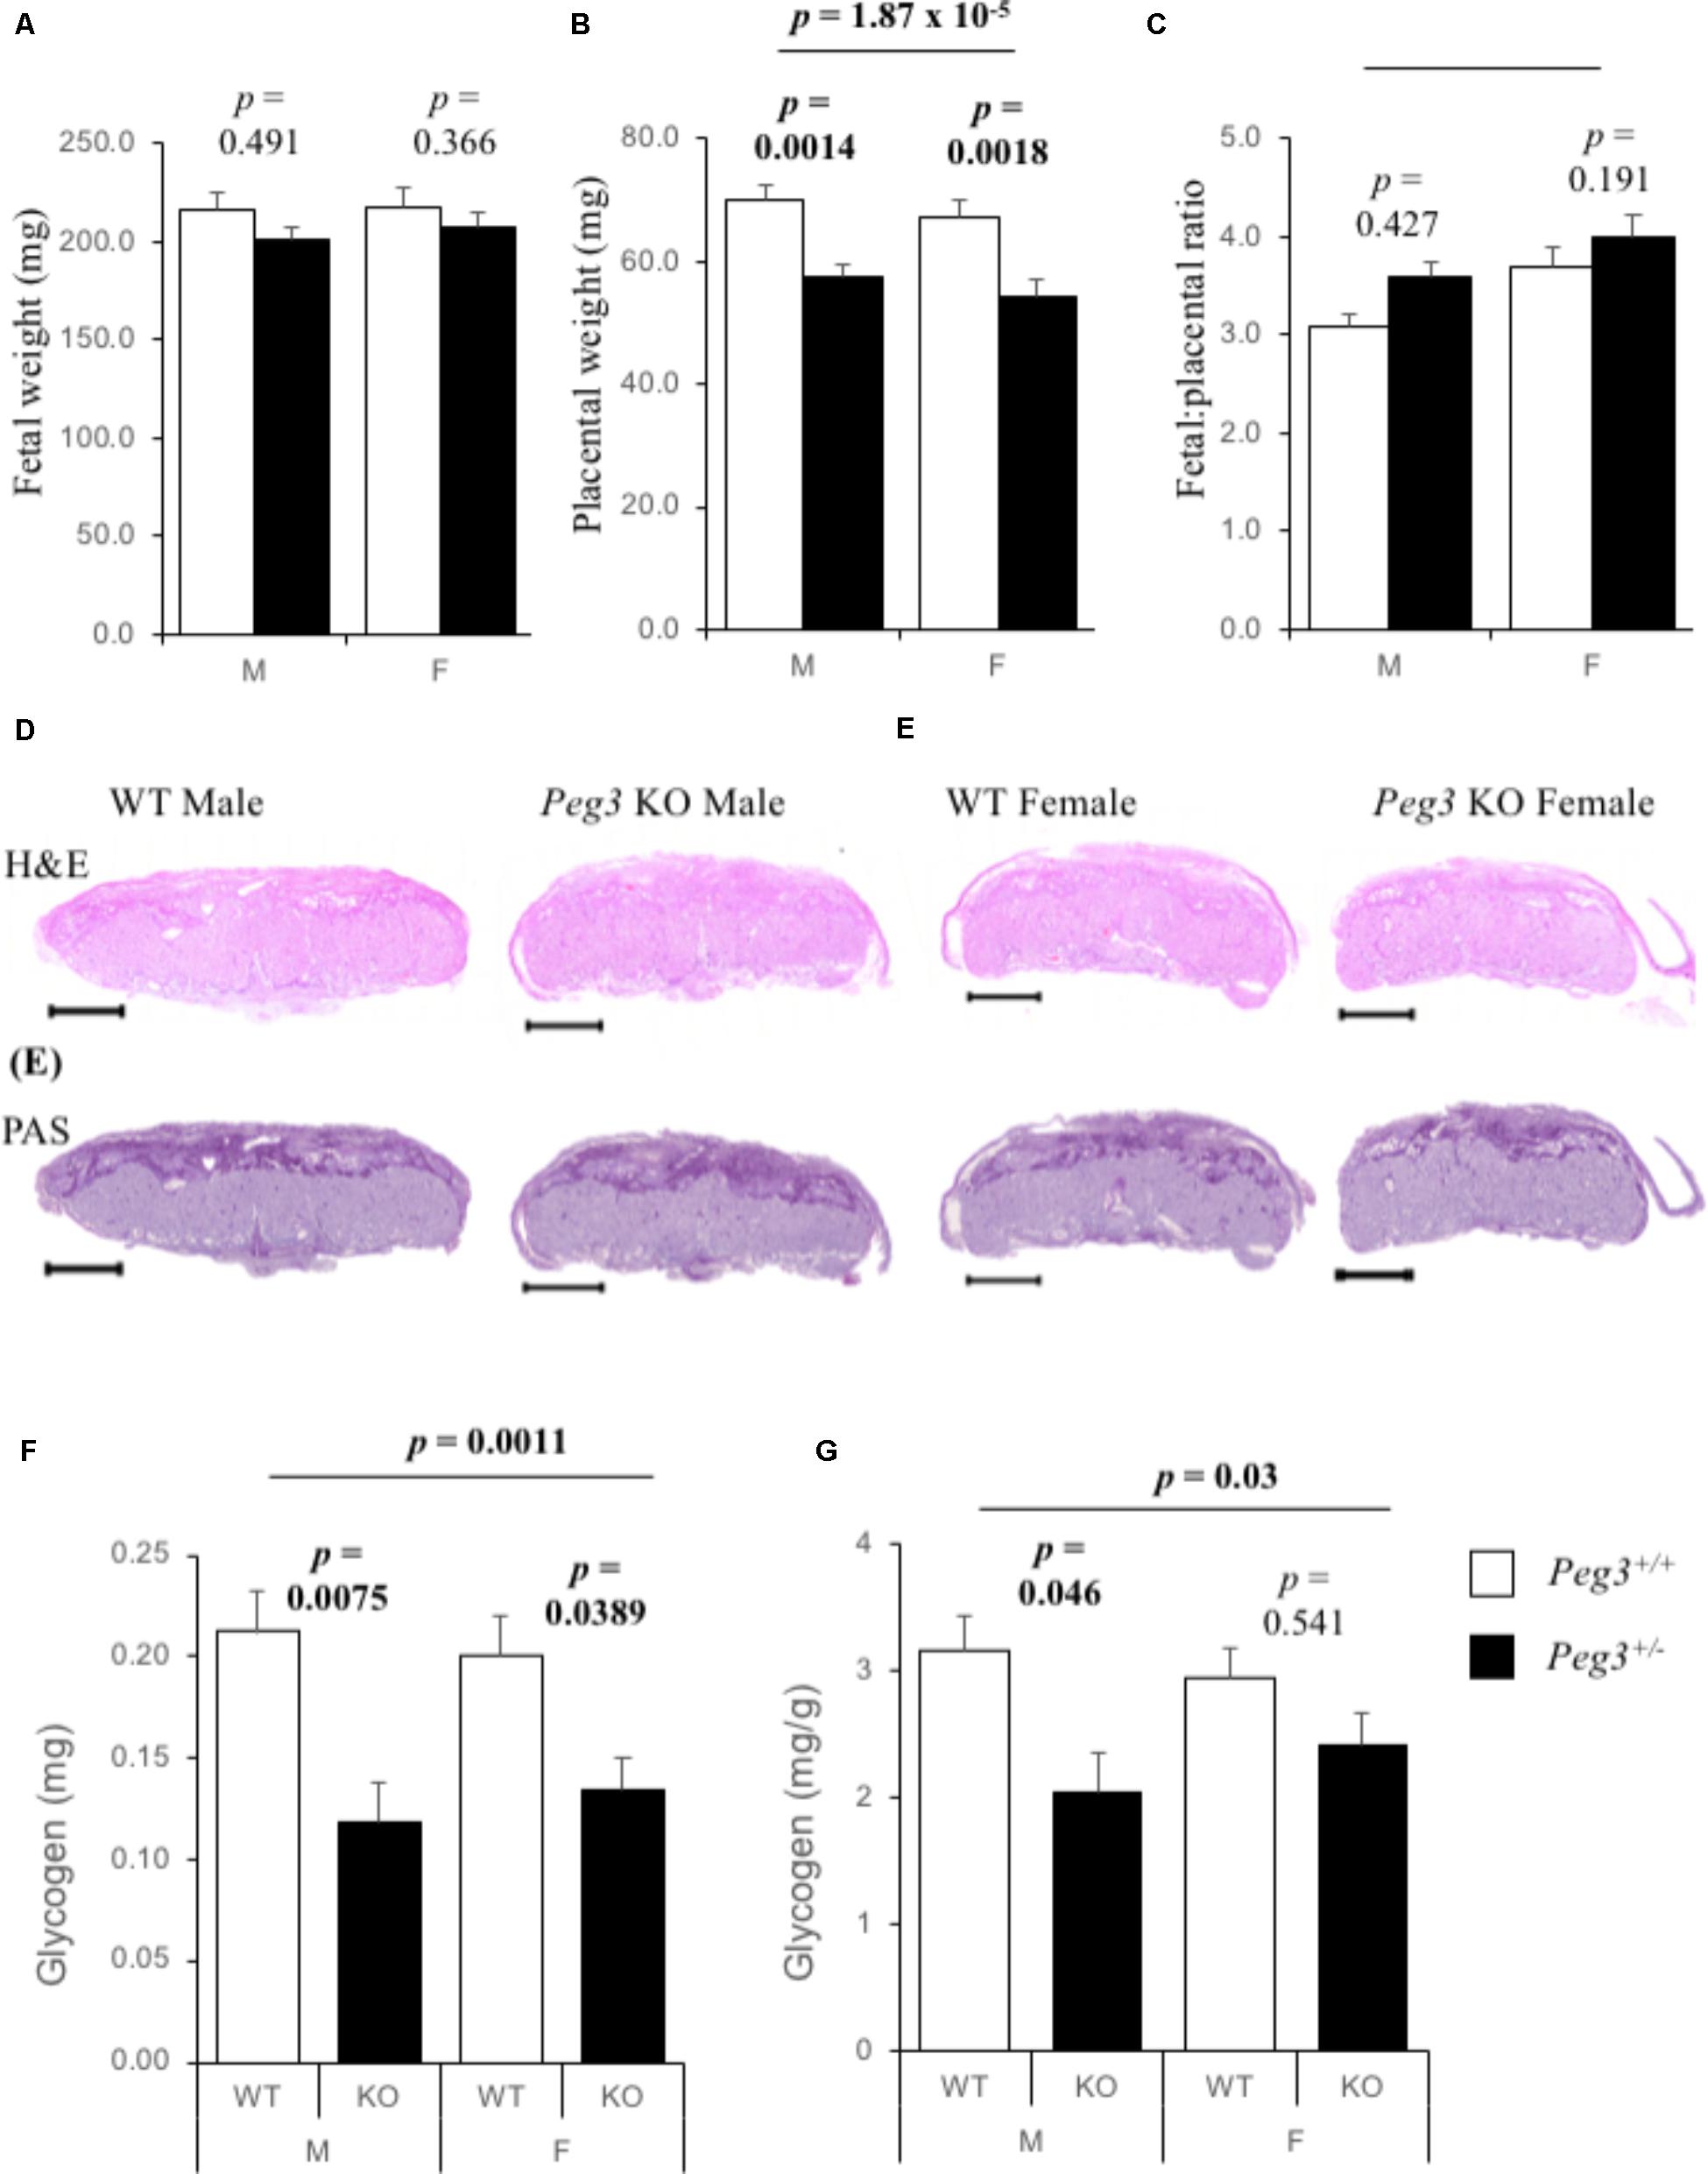
FIGURE 1. Reduction in placental glycogen stores in Peg3 deficient placenta. (A) Wet weights of male and female WT and Peg3 KO fetuses at E14.5. No difference between WT male (N = 22), and WT female (N = 24), fetal weights, or between WT male and Peg3 KO male (N = 22), or between WT female and Peg3 KO female (N = 20), fetal weights. Data from 11 litters, litter size between 5 and 10. (B) Wet weights of WT and Peg3 KO placenta at E14.5. No difference in weight between WT male and WT female placenta. Male and female Peg3 KO placenta weighed 18 and 19% less than sex-matched WT placenta. (C) Fetal:Placental (F:P) ratios at E14.5. (D) Hematoxylin and eosin staining of male and female WT, and Peg3 KO midline placental sections at E14.5. (E) PAS staining of adjacent male and female WT and Peg3 KO midline placental sections. (F) Direct biochemical determination of total glycogen (mg) present in male and female WT and Peg3 KO placenta at E14.5. Male WT placenta contain same total glycogen as female placenta (p = 0.69). Male and female Peg3 KO placenta contain 46 and 33% less total placental glycogen than sex-matched WT placenta. (G) Glycogen expressed as mg/g placenta. Male and female Peg3 KO placenta contain 35 and 18% less placental glycogen per gram than sex-matched WT placenta. Scale bars = 1000 μm. Error bars represent SEM. Statistical significance calculated from ANOVA with Bonferroni correction. Data in Supplementary Table S1.
A reduction in placental glycogen stores can reflect fewer glycogen cells, as reported in placenta lacking the paternally expressed Igf2 (Lopez et al., 1996). Alternatively, we have observed a reduction in placental glycogen when just the spongiotrophoblast lineage is reduced (Tunster et al., 2016a). Gross area measurements of midline sections from seven placenta of each sex/genotype revealed that junctional zone areas were different between the groups (F3,24 = 5.83, p = 0.00599). Peg3 KO male junctional zone midline area was 34% smaller than WT male placenta (p = 4.50 × 10⁻⁹; Figure 2A). Female Peg3 KO placenta showed a more modest 19% reduction in the junctional zone midline area compared to WT female placenta (p = 5.08 × 10⁻⁸; Figure 2A). The increase in Labyrinth zone:Junctional zone (Lz:Jz) ratio between WT and KO placenta was not significant (Figure 2B). Quantitative analysis of junctional zone cell numbers from mid line sections revealed a difference in the number of spongiotrophoblast (F3,24 = 10.3, p = 0.000113) and glycogen cells (F3,24 = 7.12, p = 0.0014) (Figure 2C). Male Peg3 KO placenta possessed 50% fewer spongiotrophoblast cells (p = 9.06 × 10⁻⁴), and female Peg3 KO placenta showed an attenuated 37% fewer spongiotrophoblast cells (p = 0.00969). Male Peg3 KO placenta possessed 40% fewer glycogen cells than WT male placenta (p = 0.00654), and female Peg3 KO placenta possessed 30% fewer glycogen cells than WT female controls (p = 0.0384). Male and female Peg3 KO placenta retained a normal ratio of spongiotrophoblast to glycogen cells (Figure 2D).
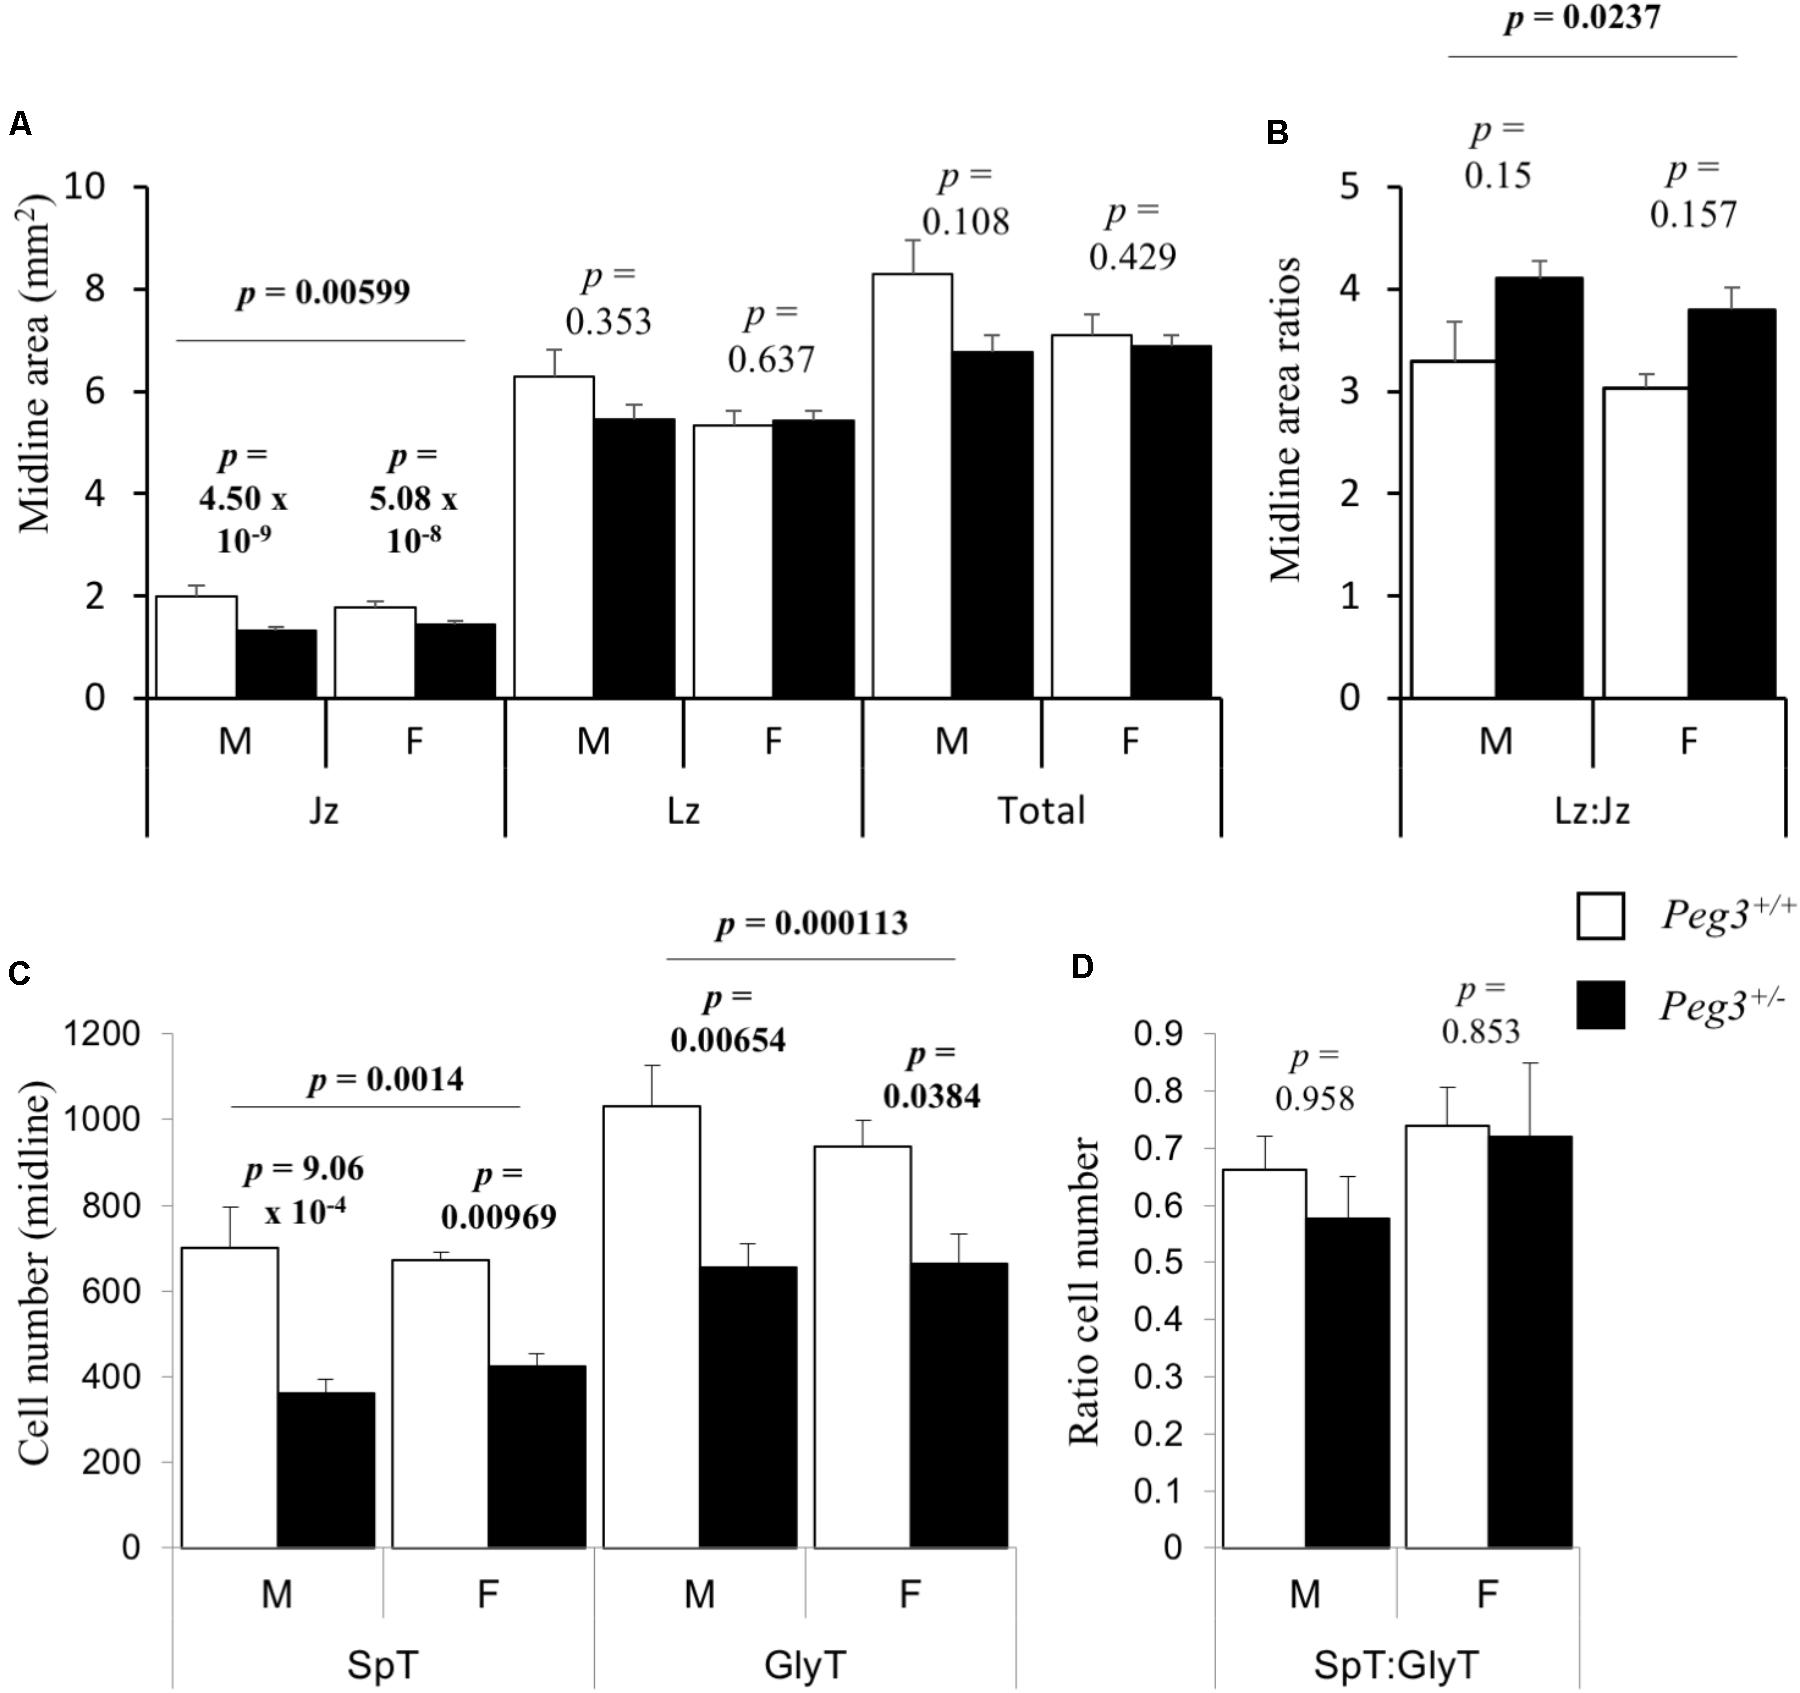
FIGURE 2. Sexually dimorphic loss of spongiotrophoblast and glycogen cells from junctional zone in response to loss of Peg3. (A) Junctional zone (Jz), labyrinth zone (Lz), and total areas of midline E14.5 placental sections (mm2) from WT, and Peg3 KO male and female placenta. (B) Labyrinth to junctional zone midline area ratios. (C) Spongiotrophoblast (Spt) and glycogen cell (GlyT) number cell number within midline areas of the junctional zone. (D) Ratio of spongiotrophoblast to glycogen cell number within the junctional zone. N = 6–7 placenta per genotype, sex matched within litter. Seven independent litters; error bars represent SEM. Statistical significance calculated from ANOVA with Bonferroni correction. Data in Supplementary Table S2.
Between WT male and female placenta from Peg3 KO litters, the majority of markers of the spongiotrophoblast, TGC lineages, and labyrinth were expressed at similar levels (Supplementary Figure S1 and Supplementary Table S1). Trophoblast specific protein alpha [Tpbpa; expressed in glycogen cells, spongiotrophoblast, SpA-TGCs, C-TGCs, and 50% of P-TGCs (Hu and Cross, 2011)], Cdkn1c [glycogen cells, P-TGCs and S-TGCs (Riley et al., 1998; Westbury et al., 2001; Georgiades et al., 2002; Coan et al., 2006)], Prl2a1 [glycogen cells, SpA-TGCs and C-TGCs (Simmons et al., 2008)], and exclusive markers of the glycogen cell lineage Protocadherin 12 (Pcdh12) (Bouillot et al., 2006), 1,4-alpha-glucan-branching enzyme (Gbe1), and UDP-glucose pyrophosphorylase 2 (Ugp2) were all expressed at higher levels in male placenta at E14.5 (Supplementary Figure S1). This did not translate as increased total placental glycogen (0.212 mg ± 0.02 vs. 0.201 mg ± 0.02; P = 0.69), or glycogen per mg of placental weight (3.16 mg/g ± 0.28 vs. 2.94 mg/g ± 0.25; P = 0.57), or a higher glycogen cell number (1031 ± 95.9 vs. 937 ± 54.6; P = 0.42), in WT male placenta, at least at E14.5 (Supplementary Tables S1, S2).
Between WT and Peg3 KO male placenta, reduced expression of markers of the spongiotrophoblast and glycogen cell lineages was consistent with the loss of both these cells types determined histologically. Tpbpa was 30–40% lower in Peg3 KO male placenta relative to WT male controls (Figure 3A). Prl8a8 and Prl8a1, two markers predominantly or exclusively expressed in the spongiotrophoblast (Simmons et al., 2008; Figure 3B) and Prl6a1, an exclusive marker for glycogen cells (Simmons et al., 2008) were similarly reduced in expression (Figure 3C) while genes expressed in the labyrinth and pan markers of TGCs were expressed at WT levels (Figures 3D,E). Not all genes expressed from the spongiotrophoblast and glycogen cell lineages showed reduced expression in male Peg3 KO placenta. Strikingly, few significant reductions in gene changes were apparent in female Peg3 KO placenta and Psg17 and Psg19, co-expressed with Prl8a8 in spongiotrophoblast (Wynne et al., 2006; Figure 3F), were expressed at significantly higher levels than WT despite the 37% loss of this lineage.
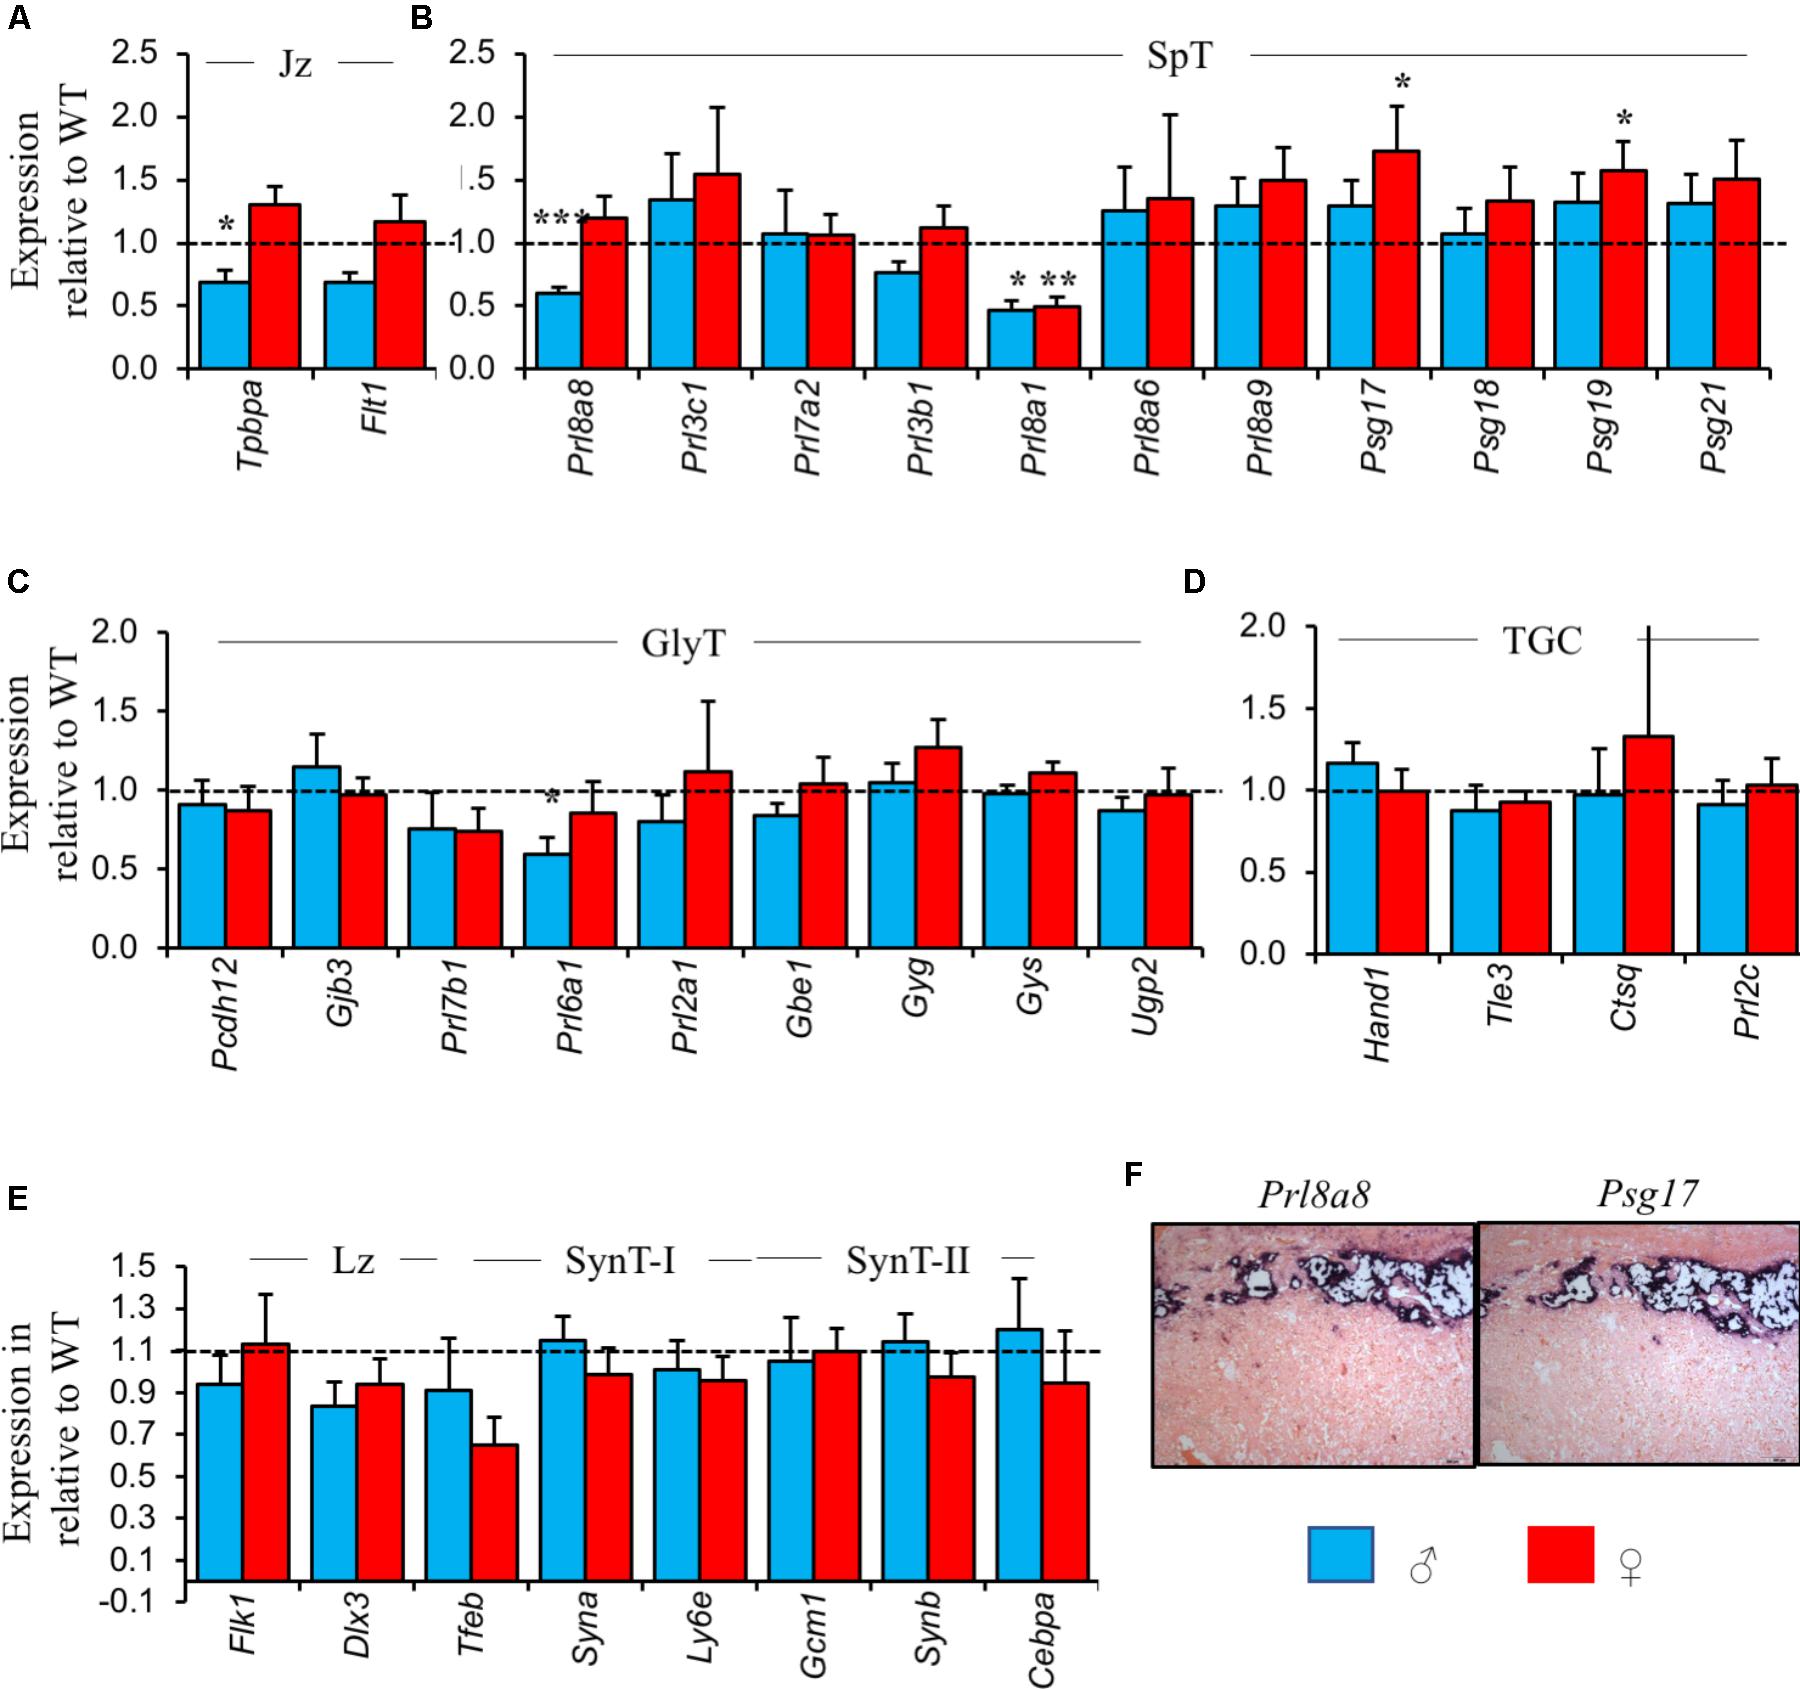
FIGURE 3. Placental lineage analysis by RT-qPCR reveals differences in the normal repertoire of placental hormone gene expression between male and female Peg3 KO placenta. (A) RT-qPCR comparison of mature junctional zone markers Tpbpa and Flt1 at E14.5 in male and female Peg3 KO placenta relative to sex-matched WT placenta. (B) RT-qPCR comparison of markers exclusively or predominantly expressed in the mature spongiotrophoblast lineage. (C) RT-qPCR comparison of markers exclusively or predominantly expressed in the mature glycogen cell lineage. (D) RT-qPCR comparison of pan-TGC markers. (E) RT-qPCR comparison of markers of the mature labyrinth, syncytiotrophoblast layers I and II (SynT-I and SynT-II). (F) In situ hybridization of adjacent E14.5 placental sections with Prl8a8 and Psg17 riboprobes. Scale bars = 100 mm. For the RT-qPCR analysis, N = 4 placenta per genotype and sex, total N = 16 (2 vs. 2 from 2 independent litters, and 2 vs. 2 of each sex); error bars represent SEM. Statistical significance calculated from ANOVA with Bonferroni correction. ∗P < 0.05. Data in Supplementary Table S3 and at https://osf.io/jhc83/.
Previously, β-galactosidase staining revealed broad expression of Peg3 in the junctional zone, within cells with large nuclei lining the region between the junctional zone and maternal decidua identified as P-TGCs, and some unidentified cells in the labyrinth (Hiby et al., 2001). We asked whether RNAscope, an ultrasensitive in situ hybridization amplification technique (Wang et al., 2012), could provide a more sensitive approach for identifying cell types expressing Peg3. This approach allows the detection of individual target RNAs within intact cells in alongside multiplex analysis for multiple markers which can aid lineage identification. We first applied a commercially available Peg3 RNAscope probe (Supplementary Figure S2A), to WT paraformaldehyde-fixed sections which revealed a strong punctuate signal in the nucleus with weaker staining within the cytoplasm (Supplementary Figures S2B,C). An identical localization was apparent with a custom designed Peg3 probe spanning a different region of Peg3 (Supplementary Figures S2D,E).
We performed triple detection of Peg3 (red) with Prl3b1 (green) to identify spongiotrophoblast cells, P-TGCs, C-TGCs, and S-TGCs (Simmons et al., 2008), and Pcdh12 (turquoise), to identify glycogen cells (Bouillot et al., 2006; Figure 4A). Peg3 was expressed in both Prl3b1+ve, and Pcdh12+ve cells within the junctional zone (Figure 4B). Peg3 signal within the Prl3b1+ve spongiotrophoblast cells was stronger, and more nuclear in comparison to the neighboring Pcdh12+ve glycogen cells. Some cells with large nuclei located at the periphery of the junctional zone adjacent to the decidua and strongly positive for Prl3b1, indicative of P-TGC cells, were weakly positive for Peg3 signal (Figure 4C and Supplementary Figure S3). A few cells adjacent to the spiral arteries within the decidua were positive for Peg3 and Pcdh12 identifying migrated glycogen cells, not SpA-TGCs (Figure 4D). Peg3 signal was apparent in Prl3b1+ve cells with large nuclei lining the maternal vasculature on entry into the labyrinth (Canal TGCs; Figure 4E) and exiting via junctional zone (Channel TGCs) (Figure 4F). Peg3 was co-expressed with Prl3b1 in some cells in the labyrinth indicative of S-TGCs (indicated by arrow Figure 4G). In addition, there were some cells with small nuclei (indicated by asterisks) that were Prl3b1-ve/Peg3+ve, and large cells that were Prl3b1+ve/Peg3-ve (Figure 4G). This reciprocal relationship between Prl3b1 and Peg3 was consistent with the role of Peg3 transcriptionally repressing Prl3b1 expression (Kim et al., 2013). In summary, Peg3 was expressed in all endocrine lineages except the SpA-TGCs.
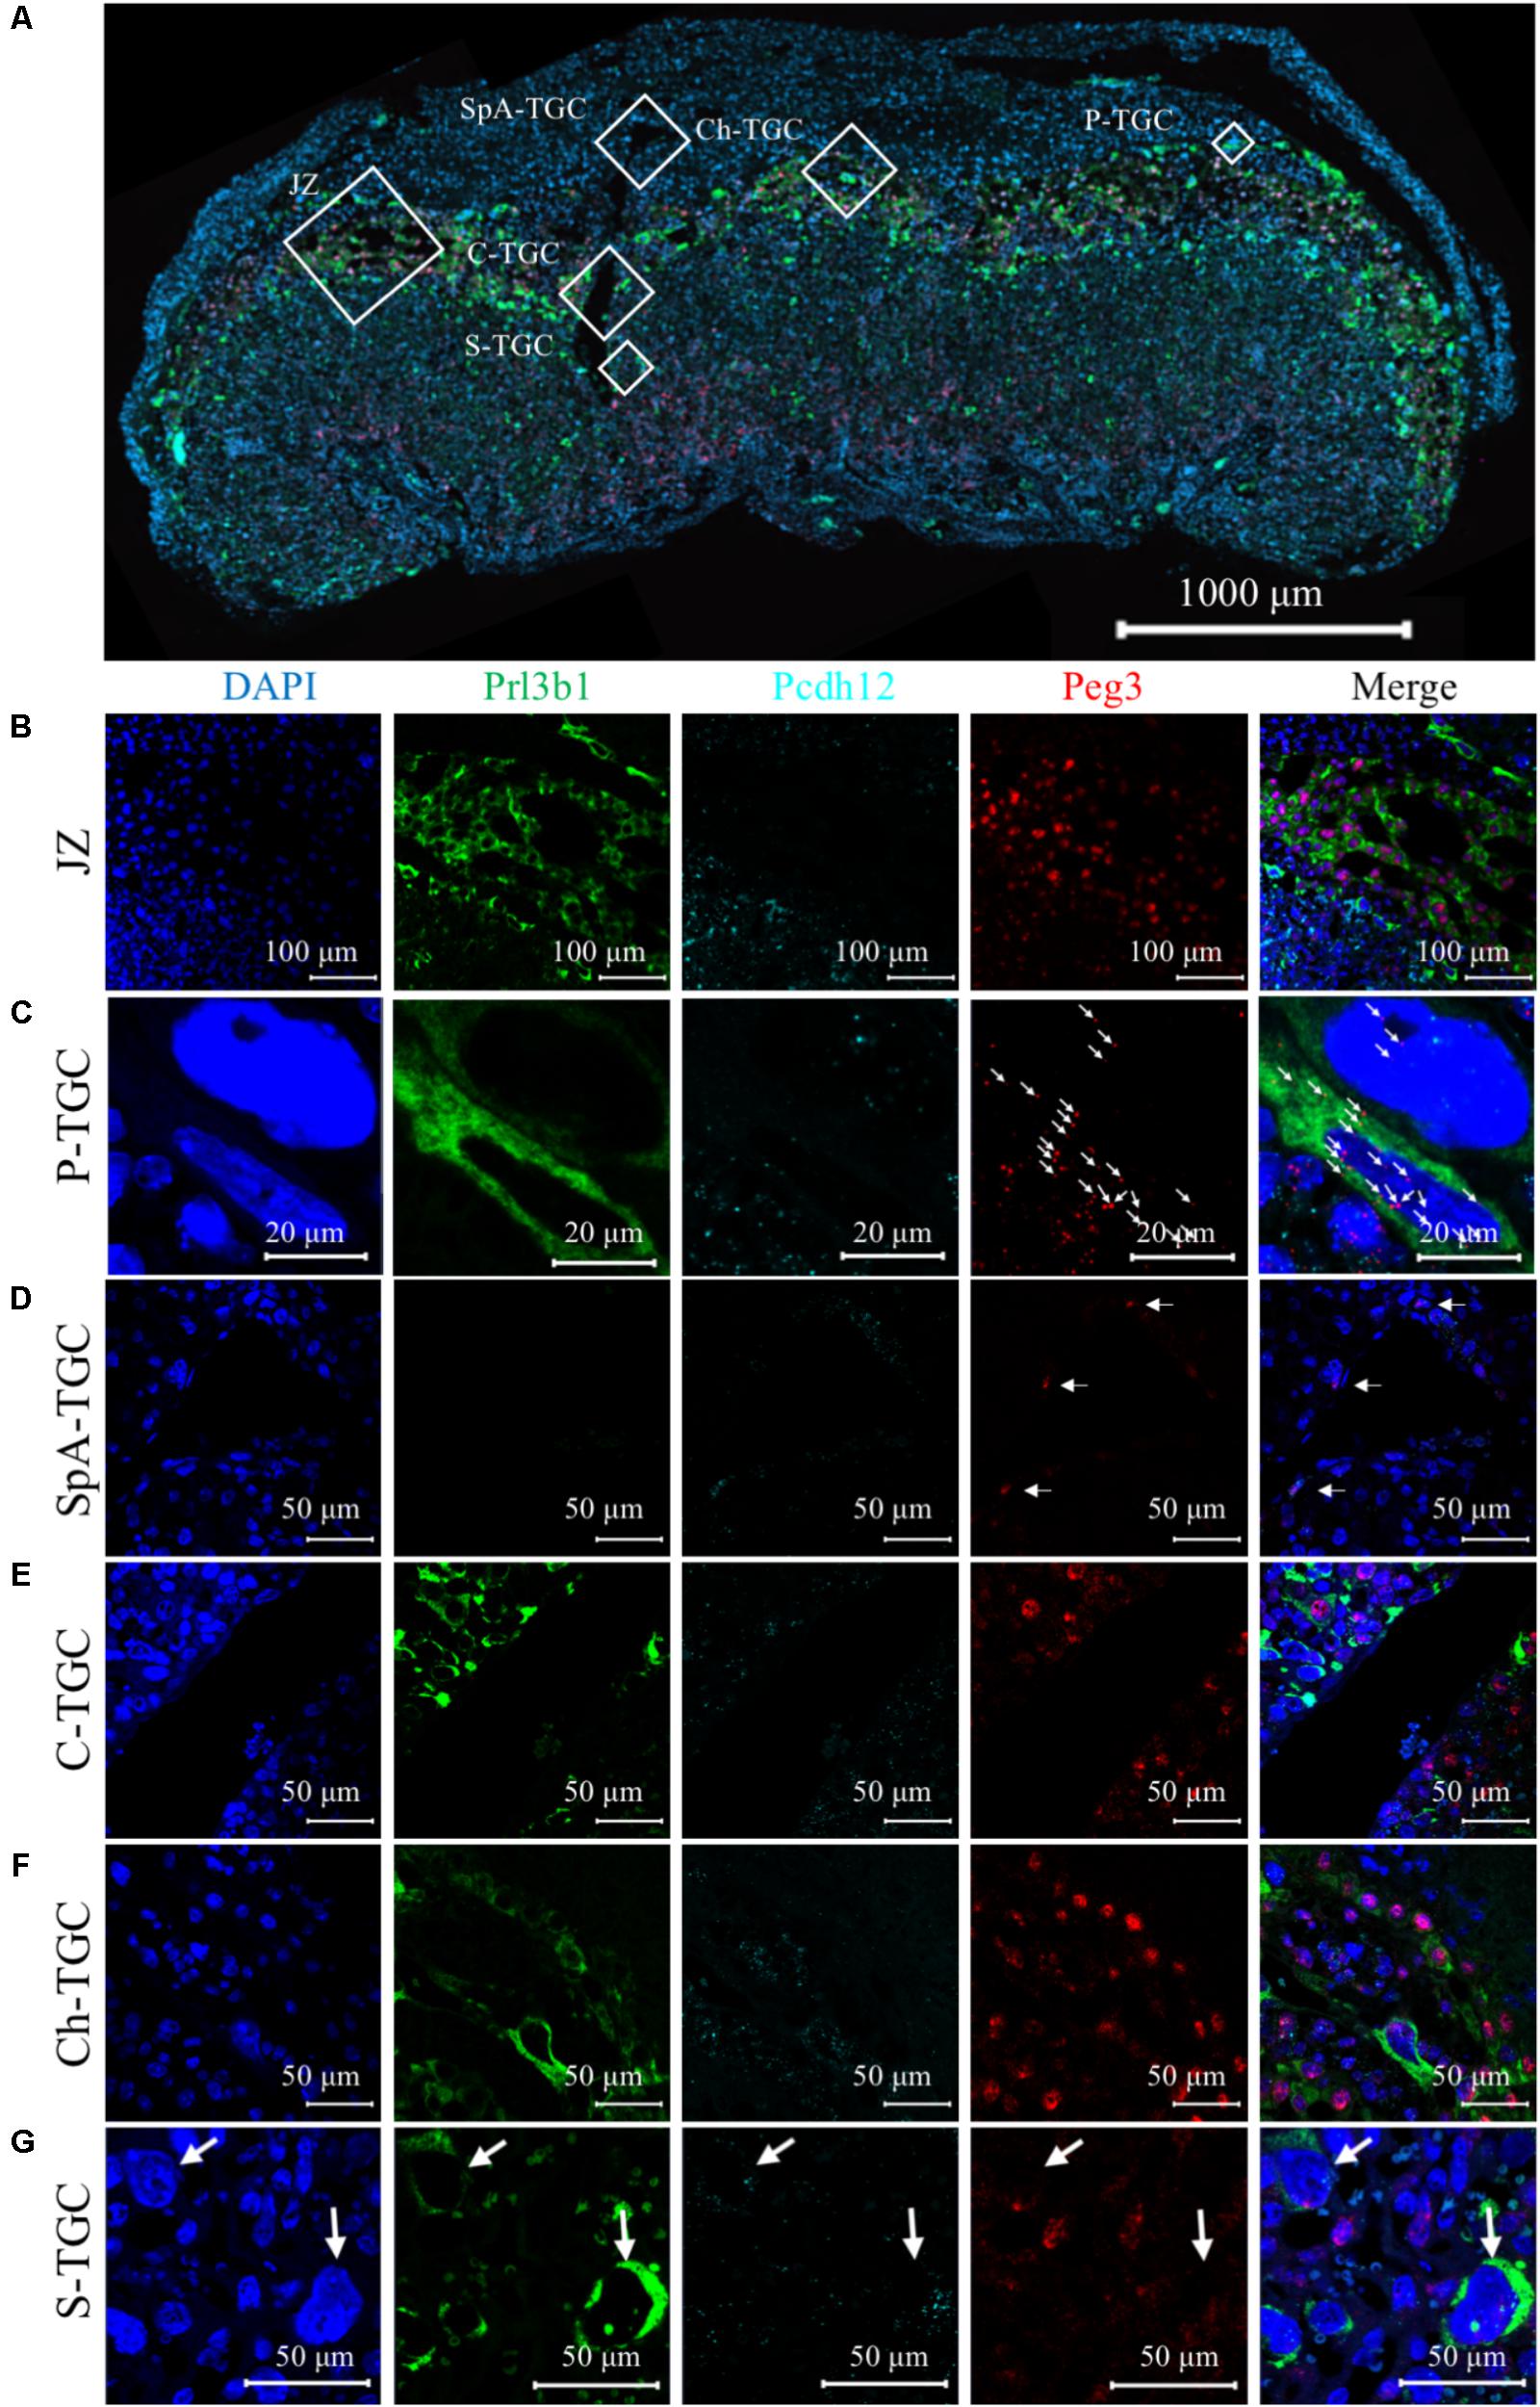
FIGURE 4. Three-plex detection of Peg3, Pcdh12, and Prl3b1 identifies Peg3+ve cells. (A) Low magnification image of whole E14.5 female WT placental section after in situ amplification of Peg3 (red), Pcdh12 (turquoise), and Prl3b1 (Pl2; green). Nuclei labeled with DAPI (blue). (B) Higher resolution image of region indicated by open white box labeled Jz in 4A. Peg3 signal localizes to both Prl3b1+ve spongiotrophoblast cells and Pcdh12+ve glycogen cells. Further images in Supplementary Figure S3. (C) Higher resolution image of region indicated by open white box labeled P-TGC in panel (A). Single RNA molecule detection of Peg3 localized to large Prl3b1+ve mononuclear cells lining region between decidua and junctional zone indicated by white arrows. (D) Higher resolution image of region indicated by open white box labeled SpA-TGC in panel (A). Peg3 signal in Prl3b1-ve/Pcdh12+ve cells surrounding maternal spiral artery within decidua indicated by white arrows. (E) Higher resolution image of region indicated by open white box labeled C-TGC in panel (A). Peg3 signal in Prl3b1+ve cells lining wide channels where maternal blood enters the labyrinth. (F) Higher resolution image of region indicated by white boxed region labeled Ch-TGC in panel (A). Peg3 signal in Prl3b1+ve cells lining small channels within the junctional zone. (G) Higher resolution image of region indicated by white boxed region labeled S-TGC in panel (A). Peg3 signal in some large Prl3b1+ve mononuclear cells located lining the maternal blood sinusoids indicated by white arrows and some Prl3b1-ve cells with small nuclei in labyrinth.
Triple detection of Peg3, Pcdh12, and Prl3b1 on placental samples from a single litter further illustrated the differences between WT and Peg3 KO sections from male and female placenta identified histologically (Figures 5A–D). The male Peg3 KO placenta (Figure 5B) had relatively fewer Prl3b1+ve cells compared to the male WT placenta (Figure 5A) and the female Peg3 KO placenta (Figure 5D) expressed Prl3b1 at higher levels compared to the matched female WT placenta (Figure 5C). Although assessed qualitatively, these data highlight the future potential for this approach in the detailed characterization of placental lineages.
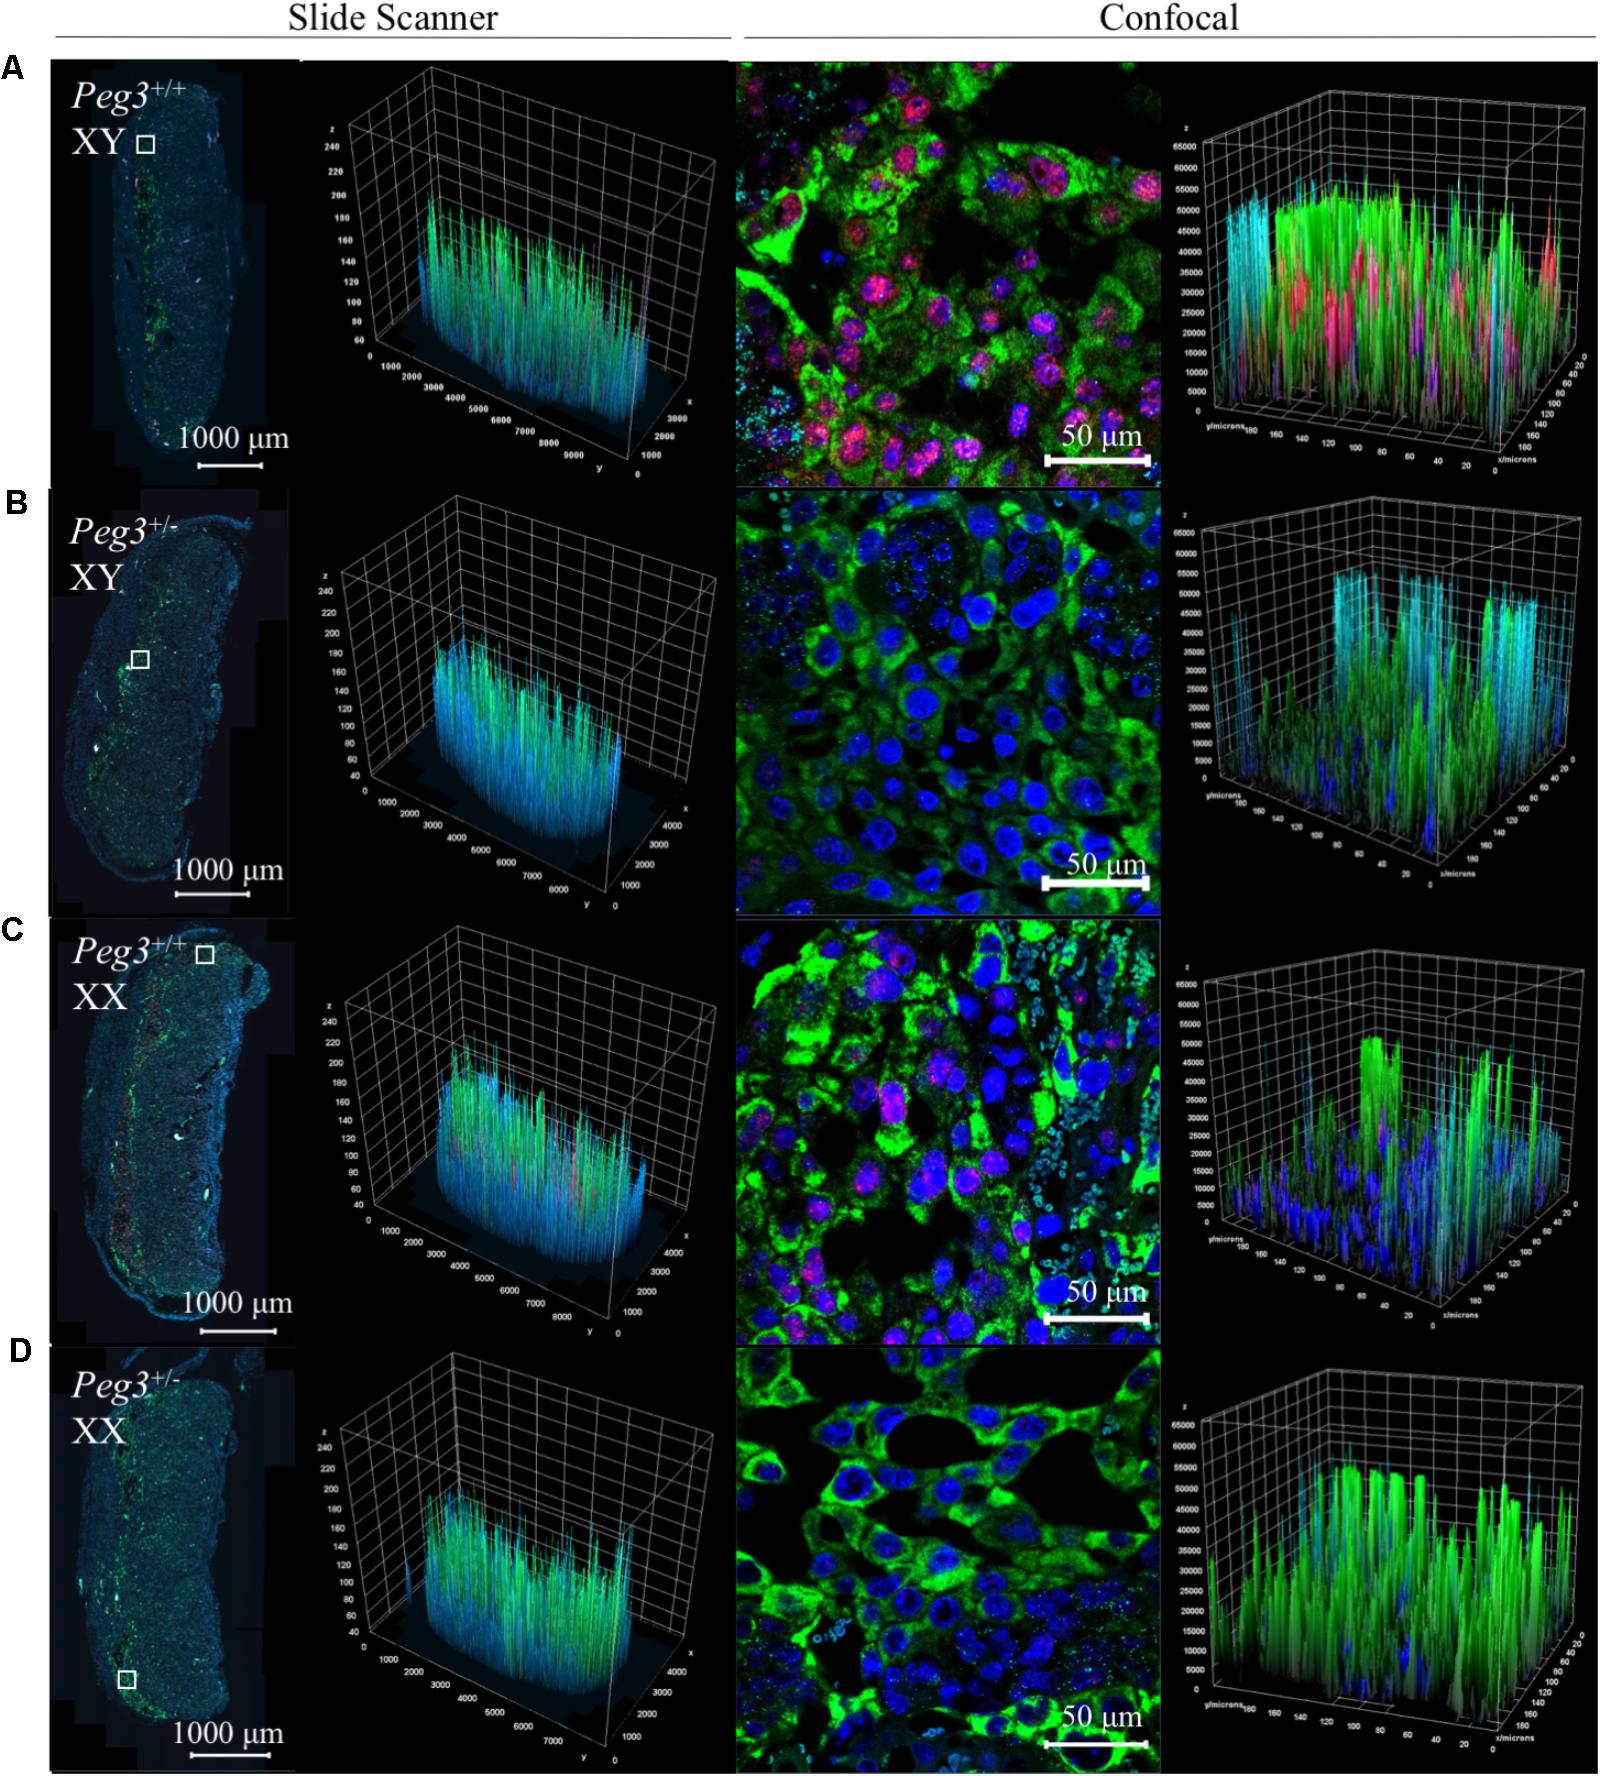
FIGURE 5. Three-plex detection of Peg3, Pcdh12, and Prl3b1 expression in WT and Peg3KO male and female E14.5 placenta. Images of whole E14.5 placental sectional and junctional zone after in situ amplification of Peg3 (red), Pcdh12 (turquoise), and Prl3b1 (Pl2; green). Nuclei labeled with DAPI (blue). All placenta are from the same litter and treated in an identical manner to generate the images. (A) WT male placenta. (B) Peg3 KO male placenta. (C) WT female placenta. (D) Peg3 KO female placenta. Scale bars between confocal and slide scanner are different because the confocal images at 16 bits and the slide scanner images at 8 bits. Z = fluorescence intensity value; Y and X = area of the sample.
Both male and female placenta were impacted by loss-of-function of Peg3 but female placenta presented with a considerably more subtle phenotype. Sexually dimorphic expression has been reported for Peg3 (Faisal et al., 2014) but on the 129 strain background there was no difference in the expression of Peg3 between E14.5 WT male and female placenta (Figure 6A). Peg3 expression was fivefold higher in female Peg3 KO placenta compared to male Peg3 KO placenta (Figure 6B). This was at considerably lower that the normal level of expression in WT female placenta (Supplementary Table S4) illustrated by RNAscope analysis of the junctional zone after maternal transmission of the targeted allele (Figures 6C,D).
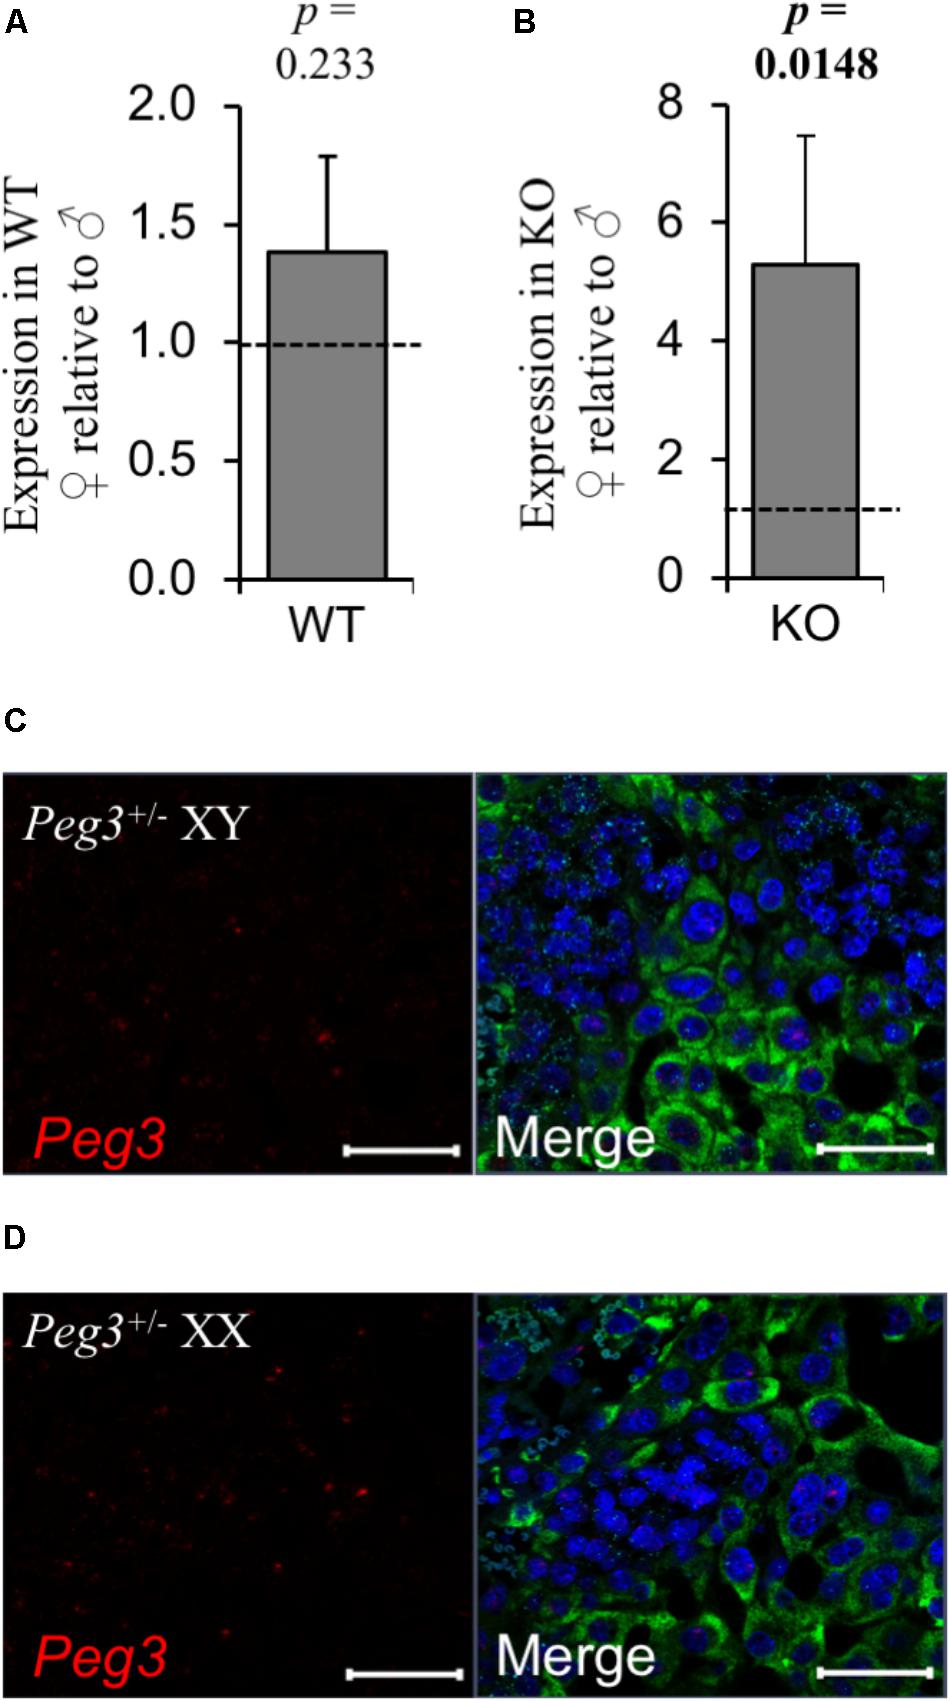
FIGURE 6. No evidence for substantial relaxation of maternal silencing in female placenta. (A) RT-qPCR comparison of Peg3 expression between WT male and WT female placenta at E14.5. (B) RT-qPCR comparison of Peg3 expression between KO male and KO female placenta at E14.5. (C,D) High resolution image of three-plex analysis of junctional zone of male and female placenta inheriting the targeted Peg3 allele maternally (silenced). For the RT-qPCR analysis, N = 4 placenta per genotype (2 vs. 2 from 2 independent litters); error bars represent SEM. Statistical significance calculated using from ANOVA with Bonferroni correction. Data in Supplementary Table S4.
Discussion
We previously reported that several paternally silenced imprinted genes converge on the placental endocrine lineages to limit the production of placental hormones. This led us to hypothesize that the male genome adapted to overcome the rapid evolution of placental hormone gene families by directly regulating the lineages that express placental hormones rather than individual hormone genes. Here, we demonstrate that the maternally silenced Peg3 gene is required for the expansion of the spongiotrophoblast and glycogen cell lineages consistent with our original hypothesis (Figure 7), with additional intriguing complexities.
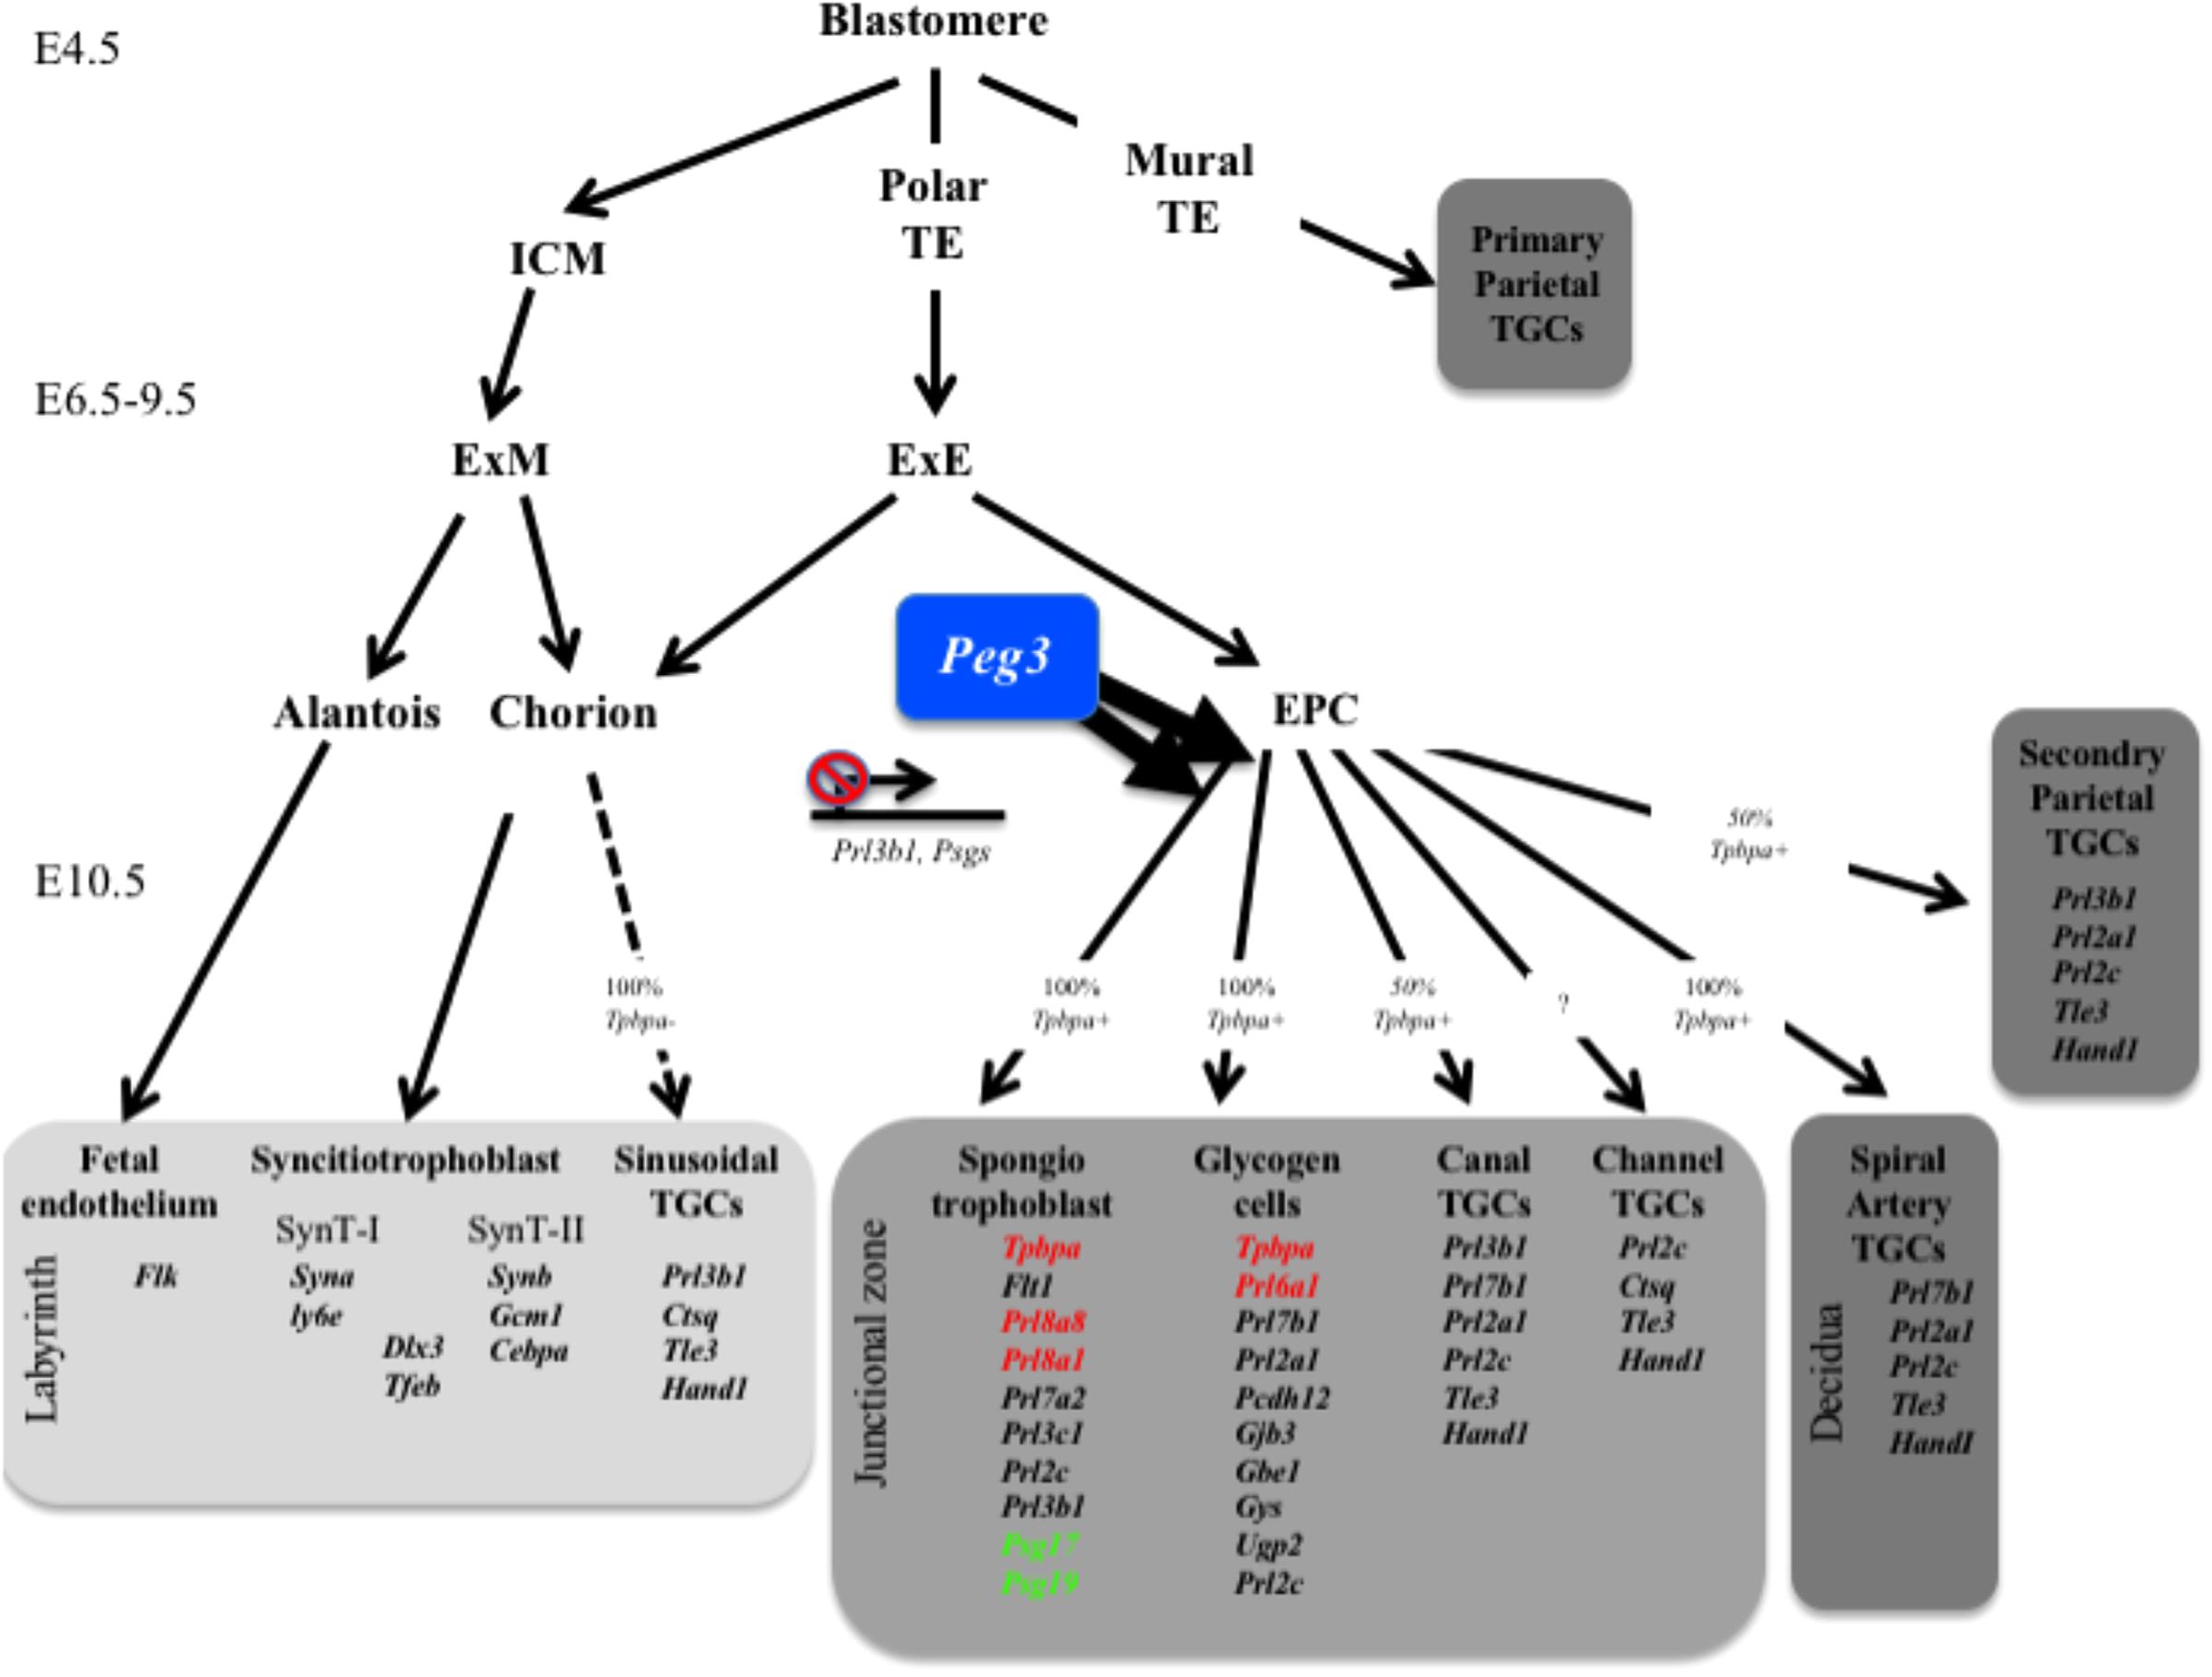
FIGURE 7. Summary of gene expression data in relation to placental lineages. Peg3 is required for the expansion of both the glycogen cell and spongiotrophoblast lineages. Genes indicated in red are significantly reduced in expression in male Peg3 KO placenta. Genes indicated in green are significantly elevated in female Peg3 KO placenta. ICM, inner cell mass; TE, trophectoderm; TGCs, trophoblast giant cells; ExM, extraembryonic mesoderm; ExE, extraembryonic ectoderm; EPC, ectoplacental cone; SynT, syncitiotrophoblast.
Peg3 Positively and Negatively Regulates Placental Hormones
This study applied both classic histological techniques and a cutting-edge imaging approach to explore the phenotypic consequences of loss of Peg3 function in the mouse placenta in more detail. Male Peg3 KO placenta showed a 50% loss of spongiotrophoblast, a 40% loss of glycogen cells, and a 45% reduction in placental glycogen alongside 40–60% reduction in expression of Tpbpa, Flt1, Prl8a8, Prl8a1, and Prl6a1. Not all genes expressed from the spongiotrophoblast and glycogen cell lineage were reduced in expression coincident with the loss of this lineage. This is consistent with the known function of Peg3 as a transcriptional repressor of placental hormone genes. The reciprocal relationship between the intensity of Peg3 and Prl3b1 signal in TGCs (Figure 5) provides further support for the role of Peg3 as a transcriptional repressor for Prl3b1 (Kim et al., 2013). Psgs are also targets for Peg3 upregulated in response to loss of function of Peg3 (Broad and Keverne, 2011) and possess multiple copies of the DNA-motif for Peg3 (Lee et al., 2015). A key finding from this study is therefore that Peg3 both positively and negatively regulates placental hormones through two independent and opposing mechanisms.
Attenuated Response to Loss of Peg3 in Female Placenta
Studies in mice are beginning to take into account the possibility of sexually dimorphic response of the placenta to genetic and environmental manipulations (Kalisch-Smith et al., 2017). Mutations involving the Peg3 domain are known to have more severe effects on males than on females (Kim et al., 2012, 2013; Faisal et al., 2014). In comparison to male placenta, female Peg3 KO placenta showed a more modest 37% loss of spongiotrophoblast, 29% loss of glycogen cells, and 33% reduction in placental glycogen. Aside from Prl8a1 there were no significant reductions in the expression of genes found be reduced in male placenta, while Psg17 and Psg19, co-expressed with Prl8a8 in the spongiotrophoblast, were significantly elevated. Prl8a8 was significantly different between male and female Peg3 KO placenta but for most other criteria there were no significant differences between male and female mutants (Supplementary Tables S1–S4). These findings may be explained by naturally existing differences between male and female placenta. For example, Tpbpa was more highly expressed in WT male relative to WT female placenta and, although not significant with the numbers used in our study, the area of the Jz was slightly greater in WT male placenta. The sexually dimorphic response to loss of Peg3 did not manifest as a significant difference in placental weight between male and female mutants or in fetal growth restriction, at least at E14.5. Fetal growth restriction has been reported at later time points and one study has recorded similar newborn weights between male and female mutant pups (He et al., 2016). However, this study examined an imprinting center mutation on a mixed genetic background and further work is required.
Minimal Expression From the Maternal Peg3 Allele
Expression of Peg3 is higher in the placenta of E14.5 male B6/129-mixed background embryos compared to female (Faisal et al., 2014) but we did not find a significant difference in Peg3 levels between male and female 129 placenta. We did find evidence for expression from the normally silenced maternal allele in both male and female placenta, with female placenta showing greater leaky expression. This expression represented <1% of the WT level, considerably lower than the normally active allele. While gene expression was analyzed only at E14.5 and we cannot exclude more significant Peg3 expression from the maternal allele at earlier stages, it does seem unlikely that such a low level of expression would be sufficient to even partially rescue the spongiotrophoblast deficit. Sex-biased outcomes have been reported in response to mutations of YY1 binding sites in the Peg3 promoter (He et al., 2017) suggesting another potential mechanism that may be tempering the phenotype in female placenta. Whether the mechanism is direct or indirect, these data highlight the important fact that female placenta compensate for the loss of Peg3 far better than male placenta.
Relevance to Prenatal Depression in Humans?
Our observation of a sexually dimorphic response in the placenta to loss of Peg3 has potentially important implications. We recently reported reduced expression of the human PEG3 gene in the placenta from women with either diagnosed depression in pregnancy or questionnaire determined depressive symptoms (Janssen et al., 2016). We observed the association in placenta from male infants but not female infants. We further observed a reduction in the expression of human placental lactogen, related to Prls genes in mice, again only in placenta from males. This current study highlights functional differences between male and female mouse placenta in response to loss of Peg3. This sexually dimorphic response might explain why we see a significant association between placental PEG3 and prenatal depression in the placenta from boys and not girls in our human study. In light of these sex-specific phenotypes, it will be important to further explore both the behavioral phenotype in mice (McNamara et al., 2017) and gene expression data in human pregnancies.
Summary
In conclusion, we report that loss of function of the imprinted Peg3 gene results in the loss of both the spongiotrophoblast and glycogen cell lineages. This supports Haig’s original prediction that imprinted genes will be in conflict over the endocrine function of the placenta (Haig, 1996) and our hypothesis that this is achieved through the regulation of placental lineages that manufacture hormones (John and Hemberger, 2012; John, 2013, 2017). The sexually dimorphic response of the placenta to loss-of-function of Peg3 and the remarkable fact that Peg3 appears to be required both for the expression and repression of key placental hormones adds additional layers of complexity to studying the function of Peg3 both in pregnancy and mammalian evolution.
Materials and Methods
Mouse Strains and Genotyping
Animal studies and breeding were approved by the Universities of Cardiff Ethical Committee and performed under a United Kingdom Home Office project license (RJ). All mice were housed under standard conditions throughout the study on a 12 h light–dark cycle with lights coming on at 07.00 h with a temperature range of 21°C ± 2 with free access to water (tap water), and standard chow. The Peg3 targeted allele (Li et al., 1999) was crossed into the 129S2/SvHsd (Harlan, 129) strain and Peg3 deficient fetuses were generated by crossing WT females with heterozygous Peg-/+ (inherited targeted maternal allele; phenotypically wild type) males.
Weighing Studies, in situ Hybridization, Histological Analyses, and LacZ staining
Fetal and placental wet weights were taken at the stated time point after a discernible plug, and normalized as previously described (Tunster et al., 2010). Genotyping and sex chromosome typing was obtained from yolk sac DNA as previously described (John et al., 2001), using primers 5′-TGCCACTCCCACTGTCCTTT and 5-GCACACAGCCTCTGCTCTGA for the Peg3 targeted allele and 5′-TGGTCTGGACCCAAACGCTGTCCACA and 5′-GGCAGCAGCCATCACATAATCCAGATG for the X and Y chromosome Ube1 gene. Placentas were fixed overnight in phosphate-buffered 4% paraformaldehyde, paraffin-embedded and 6 micron sections taken through the midline. Riboprobe preparation, in situ hybridization, H&E and PAS staining, and glycogen quantifications were performed as previously described (Tunster et al., 2010).
Calculation of Area and Cell Number
Midline areas were calculated described (Tunster et al., 2010). Cell counts were performed on the same midline sections, using the “Cell Counter” plugin for ImageJ. N = 7 for each group (total N = 28).
Quantitative RNA Analysis
RNA was extracted from whole placenta following careful removal of membranes and umbilicus. Quantitative PCR of reverse transcribed RNA (RT-qPCR) was performed and analyzed as described (Tunster et al., 2010). Data at https://osf.io/jhc83/.
RNAscope
RNAscope was performed using RNAscope® Multiplex Fluorescent Reagent Kit v2 (ACD) on FFPE placenta sections, following the manufacturer’s protocol with the following modifications and specifications. After deparaffinization and hydrogen peroxide incubation, slides were added to boiling RNAscope® Target Retrieval for 15 min. Slides were incubated 15 min at 40°C in the HybEZ Oven with Protease Plus. To reduce the autofluorescence background, washes during the amplification steps with 1× Wash Buffer were increased from 2 × 2 min at RT to 3 x 5 min at RT. After amplification steps HRP-C1, HRP-C2, and HRP-C3 signals were developed. C1 corresponds to Pcdh12 probe (ACD Mm-Pcdh12 489891) and TSA®Plus Cyanine 3 (Cy3), was assigned for this channel with a fluorophore concentration of 1:500. C2 corresponds to Prl3b1 probe (ACD Mm-Prl3b1-C2 423671-C2) and TSA®Plus fluorescein was assigned for this channel with a fluorophore concentration of 1:5000. Peg3 88–994 (original probe Mm-Peg3-C3 492581), custom designed Peg3 3775–4659 (Mm-Peg3-C3 528201) were in Channel 3, and TSA®Plus Cyanine 5 (Cy5) was assigned for this channel with a fluorophore concentration of 1:1000. Under our RT-qPCR conditions Prl3b1 peaks at cycle 15, Peg3 peaks at cycle 21, and Pcdh12 peaks at cycle 25 with a 854:48:1 relative ratio of gene expression (whole placenta) and fluorophores concentrations were adjusted with respect to mRNA levels for these genes at E14.5. Slides were counterstained with DAPI and mounted with Prolong Gold Antifade mounting medium.
Imaging and Image Analysis
Whole placenta slides were scanned using Zeiss Axio Scan Z1. Higher resolution images were taken by the Confocal laser scanning microscope (LSM) 880 with Airyscan. Images were analyzed with ZEN 2 (blue edition) program. Fluorescence intensity 3D graphs (Figure 5) were generated with the image processing package Fiji with the interactive 3D service plot.
Statistical Analyses
Statistical significance (probability values) was determined using ANOVA with post hoc analyses applying the Bonferroni correction.
Author Contributions
ST performed the initial experiments, analyzed the data, and contributed to writing the manuscript. RB-S performed RNAscope work and PAS staining. GM collected and performed qPCR analysis on male andfemale samples. SH collected additional samples for glycogen analysis. RB-S and HC was involved in image processing and animal work. RJ and ST conceived and designed the experiments, interpreted the data, and wrote the paper.
Funding
ST wassupported by BBSRC grant BB/J015156. RB-S was supported by BBSRC grant BB/P008623. GM was supported by MRC grant MR/M013960. SH and HC were supported by BBSRC grant BB/P002307.
Conflict of Interest Statement
Since September 2017, GM has been employed by Frontiers. GM declared her affiliation with Frontiers. RJ is chief Specialty editor of Frontiers in Cell and Development Biology.
The handling Editor states that the process nevertheless met the standards of a fair and objective review.
The remaining authors declare that the research was conducted in the absence of any commercial or financial relationships that could be construed as a potential conflict of interest.
Acknowledgments
Prof. Azim Surani kindly provided the Peg3 KO line. We additionally thank Derek Scarborough for histological sections, and Bridget Allen (Wales Gene Park) for support of transgenic breeding.
Supplementary Material
The Supplementary Material for this article can be found online at: https://www.frontiersin.org/articles/10.3389/fcell.2018.00123/full#Supplementary-material
References
Bhattacharyya, S., Lin, J., and Linzer, D. I. (2002). Reactivation of a hematopoietic endocrine program of pregnancy contributes to recovery from thrombocytopenia. Mol. Endocrinol. 16, 1386–1393. doi: 10.1210/mend.16.6.0847
Bouillot, S., Rampon, C., Tillet, E., and Huber, P. (2006). Tracing the glycogen cells with protocadherin 12 during mouse placenta development. Placenta 27, 882–888. doi: 10.1016/j.placenta.2005.09.009
Broad, K. D., Curley, J. P., and Keverne, E. B. (2009). Increased apoptosis during neonatal brain development underlies the adult behavioral deficits seen in mice lacking a functional paternally expressed gene 3 (Peg3). Dev. Neurobiol. 69, 314–325. doi: 10.1002/dneu.20702
Broad, K. D., and Keverne, E. B. (2011). Placental protection of the fetal brain during short-term food deprivation. Proc. Natl. Acad. Sci. U.S.A. 108, 15237–15241. doi: 10.1073/pnas.1106022108
Capellini, I., Venditti, C., and Barton, R. A. (2011). Placentation and maternal investment in mammals. Am. Nat. 177, 86–98. doi: 10.1086/657435
Carter, A. M., and Enders, A. C. (2004). Comparative aspects of trophoblast development and placentation. Reprod. Biol. Endocrinol. 2:46.
Coan, P. M., Conroy, N., Burton, G. J., and Ferguson-Smith, A. C. (2006). Origin and characteristics of glycogen cells in the developing murine placenta. Dev. Dyn. 235, 3280–3294. doi: 10.1002/dvdy.20981
Creeth, H. D. J., McNamara, G. I., Tunster, S. J., Boque-Sastre, R., Allen, B., Sumption, L., et al. (2018). Maternal care boosted by paternal imprinting in mammals. PLoS Biol. 16:e2006599. doi: 10.1371/journal.pbio.2006599
Curley, J. P., Barton, S., Surani, A., and Keverne, E. B. (2004). Coadaptation in mother and infant regulated by a paternally expressed imprinted gene. Proc. Biol. Sci. 271, 1303–1309. doi: 10.1098/rspb.2004.2725
Esquiliano, D. R., Guo, W., Liang, L., Dikkes, P., and Lopez, M. F. (2009). Placental glycogen stores are increased in mice with H19 null mutations but not in those with insulin or IGF type 1 receptor mutations. Placenta 30, 693–699. doi: 10.1016/j.placenta.2009.05.004
Faisal, M., Kim, H., and Kim, J. (2014). Sexual differences of imprinted genes’ expression levels. Gene 533, 434–438. doi: 10.1016/j.gene.2013.10.006
Gasperowicz, M., Surmann-Schmitt, C., Hamada, Y., Otto, F., and Cross, J. C. (2013). The transcriptional co-repressor TLE3 regulates development of trophoblast giant cells lining maternal blood spaces in the mouse placenta. Dev. Biol. 382, 1–14. doi: 10.1016/j.ydbio.2013.08.005
Georgiades, P., Ferguson-Smith, A. C., and Burton, G. J. (2002). Comparative developmental anatomy of the murine and human definitive placentae. Placenta 23, 3–19. doi: 10.1053/plac.2001.0738
Haig, D. (1996). Placental hormones, genomic imprinting, and maternal—fetal communication. J. Evol. Biol. 9, 357–380. doi: 10.1046/j.1420-9101.1996.9030357.x
He, H., Perera, B. P., Ye, A., and Kim, J. (2016). Parental and sexual conflicts over the Peg3 imprinted domain. Sci. Rep. 6:38136. doi: 10.1038/srep38136
He, H., Ye, A., Perera, B. P. U., and Kim, J. (2017). YY1’s role in the Peg3 imprinted domain. Sci. Rep. 7:6427. doi: 10.1038/s41598-017-06817-5
Hiby, S. E., Lough, M., Keverne, E. B., Surani, M. A., Loke, Y. W., and King, A. (2001). Paternal monoallelic expression of PEG3 in the human placenta. Hum. Mol. Genet. 10, 1093–1100. doi: 10.1093/hmg/10.10.1093
Hu, D., and Cross, J. C. (2011). Ablation of Tpbpa-positive trophoblast precursors leads to defects in maternal spiral artery remodeling in the mouse placenta. Dev. Biol. 358, 231–239. doi: 10.1016/j.ydbio.2011.07.036
Janssen, A. B., Capron, L. E., O’donnell, K., Tunster, S. J., Ramchandani, P. G., Heazell, A. E., et al. (2016). Maternal prenatal depression is associated with decreased placental expression of the imprinted gene PEG3. Psychol. Med. 46, 2999–3011. doi: 10.1017/S0033291716001598
John, R., and Hemberger, M. (2012). A placenta for life. Reprod. Biomed. 25, 5–11. doi: 10.1016/j.rbmo.2012.03.018
John, R. M. (2013). Epigenetic regulation of placental endocrine lineages and complications of pregnancy. Biochem. Soc. Trans. 41, 701–709. doi: 10.1042/BST20130002
John, R. M. (2017). Imprinted genes and the regulation of placental endocrine function: pregnancy and beyond. Placenta 56, 86–90. doi: 10.1016/j.placenta.2017.01.099
John, R. M., Ainscough, J. F., Barton, S. C., and Surani, M. A. (2001). Distant cis-elements regulate imprinted expression of the mouse p57(Kip2) (Cdkn1c) gene: implications for the human disorder, Beckwith–Wiedemann syndrome. Hum. Mol. Genet. 10, 1601–1609. doi: 10.1093/hmg/10.15.1601
Kalisch-Smith, J. I., Simmons, D. G., Dickinson, H., and Moritz, K. M. (2017). Review: sexual dimorphism in the formation, function and adaptation of the placenta. Placenta 54, 10–16. doi: 10.1016/j.placenta.2016.12.008
Kim, J., Ekram, M. B., Kim, H., Faisal, M., Frey, W. D., Huang, J. M., et al. (2012). Imprinting control region (ICR) of the Peg3 domain. Hum. Mol. Genet. 21, 2677–2687. doi: 10.1093/hmg/dds092
Kim, J., Frey, W. D., He, H., Kim, H., Ekram, M. B., Bakshi, A., et al. (2013). Peg3 mutational effects on reproduction and placenta-specific gene families. PLoS One 8:e83359. doi: 10.1371/journal.pone.0083359
Lee, S., Ye, A., and Kim, J. (2015). DNA-Binding Motif of the imprinted transcription factor PEG3. PLoS One 10:e0145531. doi: 10.1371/journal.pone.0145531
Li, L., Keverne, E. B., Aparicio, S. A., Ishino, F., Barton, S. C., and Surani, M. A. (1999). Regulation of maternal behavior and offspring growth by paternally expressed Peg3. Science 284, 330–333. doi: 10.1126/science.284.5412.330
Lopez, M. F., Dikkes, P., Zurakowski, D., and Villa-Komaroff, L. (1996). Insulin-like growth factor II affects the appearance and glycogen content of glycogen cells in the murine placenta. Endocrinology 137, 2100–2108. doi: 10.1210/endo.137.5.8612553
McNamara, G. I., Creeth, H. D. J., Harrison, D. J., Tansey, K. E., Andrews, R. M., Isles, A. R., et al. (2017). Loss of offspring Peg3 reduces neonatal ultrasonic vocalisations and increases maternal anxiety in wild type mothers. Hum. Mol. Genet. 27, 440–450. doi: 10.1093/hmg/ddx412
Moore, T., and Dveksler, G. S. (2014). Pregnancy-specific glycoproteins: complex gene families regulating maternal-fetal interactions. Int. J. Dev. Biol. 58, 273–280. doi: 10.1387/ijdb.130329gd
Moore, T., and Haig, D. (1991). Genomic imprinting in mammalian development: a parental tug-of-war. Trends Genet. 7, 45–49. doi: 10.1016/0168-9525(91)90230-N
Muller, H., Liu, B., Croy, B. A., Head, J. R., Hunt, J. S., Dai, G., et al. (1999). Uterine natural killer cells are targets for a trophoblast cell-specific cytokine, prolactin-like protein A. Endocrinology 140, 2711–2720. doi: 10.1210/endo.140.6.6828
Rai, A., and Cross, J. C. (2014). Development of the hemochorial maternal vascular spaces in the placenta through endothelial and vasculogenic mimicry. Dev. Biol. 387, 131–141. doi: 10.1016/j.ydbio.2014.01.015
Rawn, S. M., and Cross, J. C. (2008). The evolution, regulation, and function of placenta-specific genes. Annu. Rev. Cell Dev. Biol. 24, 159–181. doi: 10.1146/annurev.cellbio.24.110707.175418
Riley, P., Anson-Cartwright, L., and Cross, J. C. (1998). The Hand1 bHLH transcription factor is essential for placentation and cardiac morphogenesis. Nat. Genet. 18, 271–275. doi: 10.1038/ng0398-271
Simmons, D. G., Fortier, A. L., and Cross, J. C. (2007). Diverse subtypes and developmental origins of trophoblast giant cells in the mouse placenta. Dev. Biol. 304, 567–578. doi: 10.1016/j.ydbio.2007.01.009
Simmons, D. G., Rawn, S., Davies, A., Hughes, M., and Cross, J. C. (2008). Spatial and temporal expression of the 23 murine Prolactin/Placental Lactogen-related genes is not associated with their position in the locus. BMC Genomics 9:352. doi: 10.1186/1471-2164-9-352
Soares, M. J., Konno, T., and Alam, S. M. (2007). The prolactin family: effectors of pregnancy-dependent adaptations. Trends Endocrinol. Metab. 18, 114–121. doi: 10.1016/j.tem.2007.02.005
Surani, M. A. (1998). Imprinting and the initiation of gene silencing in the germ line. Cell 93, 309–312. doi: 10.1016/S0092-8674(00)81156-3
Thiaville, M. M., Huang, J. M., Kim, H., Ekram, M. B., Roh, T. Y., and Kim, J. (2013). DNA-binding motif and target genes of the imprinted transcription factor PEG3. Gene 512, 314–320. doi: 10.1016/j.gene.2012.10.005
Tunster, S. J., Creeth, H. D., and John, R. M. (2016a). The imprinted Phlda2 gene modulates a major endocrine compartment of the placenta to regulate placental demands for maternal resources. Dev. Biol. 409, 251–260. doi: 10.1016/j.ydbio.2015.10.015
Tunster, S. J., Mcnamara, G. I., Creeth, H. D., and John, R. M. (2016b). Increased dosage of the imprinted Ascl2 gene restrains two key endocrine lineages of the mouse Placenta. Dev. Biol. 418, 55–65. doi: 10.1016/j.ydbio.2016.08.014
Tunster, S. J., Tycko, B., and John, R. M. (2010). The imprinted Phlda2 gene regulates extraembryonic energy stores. Mol. Cell. Biol. 30, 295–306. doi: 10.1128/MCB.00662-09
Tunster, S. J., Van De Pette, M., and John, R. M. (2011). Fetal overgrowth in the Cdkn1c mouse model of Beckwith-Wiedemann syndrome. Dis. Model. Mech. 4, 814–821. doi: 10.1242/dmm.007328
Tunster, S. J., Van De Pette, M., and John, R. M. (2014). Isolating the role of elevated Phlda2 in asymmetric late fetal growth restriction in mice. Dis. Model. Mech. 7, 1185–1191. doi: 10.1242/dmm.017079
Wang, F., Flanagan, J., Su, N., Wang, L. C., Bui, S., Nielson, A., et al. (2012). RNAscope: a novel in situ RNA analysis platform for formalin-fixed, paraffin-embedded tissues. J. Mol. Diagn. 14, 22–29. doi: 10.1016/j.jmoldx.2011.08.002
Westbury, J., Watkins, M., Ferguson-Smith, A. C., and Smith, J. (2001). Dynamic temporal and spatial regulation of the cdk inhibitor p57(kip2) during embryo morphogenesis. Mech. Dev. 109, 83–89. doi: 10.1016/S0925-4773(01)00512-3
Keywords: Peg3, placenta, genomic imprinting, sexually dimorphic phenotype, placental hormones
Citation: Tunster SJ, Boqué-Sastre R, McNamara GI, Hunter SM, Creeth HDJ and John RM (2018) Peg3 Deficiency Results in Sexually Dimorphic Losses and Gains in the Normal Repertoire of Placental Hormones. Front. Cell Dev. Biol. 6:123. doi: 10.3389/fcell.2018.00123
Received: 02 July 2018; Accepted: 06 September 2018;
Published: 27 September 2018.
Edited by:
Marisa Bartolomei, University of Pennsylvania, United StatesReviewed by:
Walfred Tang, University of Cambridge, United KingdomSha Sun, University of California, Irvine, United States
Copyright © 2018 Tunster, Boqué-Sastre, McNamara, Hunter, Creeth and John. This is an open-access article distributed under the terms of the Creative Commons Attribution License (CC BY). The use, distribution or reproduction in other forums is permitted, provided the original author(s) and the copyright owner(s) are credited and that the original publication in this journal is cited, in accordance with accepted academic practice. No use, distribution or reproduction is permitted which does not comply with these terms.
*Correspondence: Rosalind M. John, Sm9oblJNQGNmLmFjLnVr
†Present address: Simon J. Tunster, Centre for Trophoblast Research, Department of Physiology, Development and Neuroscience, University of Cambridge, Cambridge, United Kingdom; Gráinne I. McNamara, Frontiers Media Limited, London, United Kingdom
‡Joint first authors