- 1Muscle Aging and Regenerative Medicine, Tokyo Metropolitan Institute of Gerontology, Tokyo, Japan
- 2Division for Therapies against Intractable Diseases, Institute for Comprehensive Medical Science, Fujita Health University, Toyoake, Japan
- 3Project for Muscle Stem Cell Biology, Graduate School of Pharmaceutical Sciences, Osaka University, Suita, Japan
Adult skeletal muscle has a remarkable ability to regenerate. Regeneration of mature muscle fibers is dependent on muscle stem cells called satellite cells. Although they are normally in a quiescent state, satellite cells are rapidly activated after injury, and subsequently proliferate and differentiate to make new muscle fibers. Myogenesis is a highly orchestrated biological process and has been extensively studied, and therefore many parameters that can precisely evaluate regenerating events have been established. However, in some cases, it is necessary to evaluate the completion of regeneration rather than ongoing regeneration. In this study, we establish methods for assessing the myofiber maturation during muscle regeneration. By carefully comparing expression patterns of several muscle regeneration-related genes, we found that expression of Myozenin (Myoz1 and Myoz3), Troponin I (Tnni2), and Dystrophin (Dmd) is gradually increased as muscle regeneration proceeds. In contrast, commonly used regeneration markers such as Myh3 and Myh8 are transiently upregulated after muscle injury but their expression decreases as regeneration progresses. Intriguingly, upregulation of Myoz1, Myoz3 and Tnni2 cannot be achieved in cultured myotubes, indicating that these markers are excellent indicators to assess myofiber maturity. We also show that analyzing re-expression of Myoz1 and dystrophin in individual fiber during regeneration enables accurate assessment of myofiber maturity at the single-myofiber level. Together, our study provides valuable methods that are useful in evaluating muscle regeneration and the efficacy of therapeutic strategies for muscle diseases.
Introduction
Skeletal muscle consists mainly of myofibers, which are large cylindrical cells with many nuclei. Myofibers are terminally differentiated post-mitotic cells; however, skeletal muscles possess a high ability to regenerate. Regeneration of mature myofibers is dependent on satellite cells. Satellite cells are mononucleated cells located between the plasma membrane of the myofiber and basal lamina. They normally remain in a quiescent state, but are activated upon muscle injury, and then they proliferate and differentiate to regenerate myofibers. Genetically engineered mice in which satellite cells are ablated show a complete lack of regenerative response (Lepper et al., 2011; Murphy et al., 2011; Sambasivan et al., 2011), indicating that satellite cells are absolutely required for muscle regeneration and cannot be compensated by other cell types. Furthermore, single-satellite cell transplantation revealed that these cells indeed possess self-renewal potential, in addition to the ability to differentiate into myofibers (Sacco et al., 2008). Thus, satellite cells are considered as definitive adult muscle stem cells.
Adult myogenesis is a highly ordered process in which satellite cells proliferate, differentiate, and generate new myofibers. Myogenic regulatory factors (MRFs) are important regulators of myogenesis and their expression is tightly regulated. Quiescent satellite cells do not express detectable levels of MyoD but they begin to express high levels of MyoD upon activation (Zammit et al., 2004). Expression of MyoD is maintained during the proliferation phase and continues until the early differentiation phase (Zammit et al., 2004). Myogenin is not expressed in quiescent satellite cells and proliferating undifferentiated myoblasts, but its expression is significantly upregulated when cells begin to differentiate (Bentzinger et al., 2012). Therefore, MyoD and Myogenin are commonly used as activation and differentiation markers of myogenesis, respectively. Expression levels of MRF4 are highest of the MRFs in adult mature muscle and are considered to reflect muscle fiber maturity (Bentzinger et al., 2012; Zammit, 2017). Adult muscle regeneration recapitulates many aspects of embryonic myogenesis, including expression of embryonic- or perinatal-type myosin heavy chain (MyHC) (Sartore et al., 1982). Thus, expression of these embryonic-type contractile proteins is a hallmark of muscle regeneration and is often used to detect activity of regeneration.
Expression of MRFs or embryonic or perinatal MyHC is useful to examine regenerating events. However, the most important goal in tissue regeneration is that the normal condition is restored. From this perspective, expression of the above described regeneration markers reflects conditions where muscle is still abnormal. In certain cases, therefore, assessment of “normality” becomes more important than evaluating regenerating events, especially in studies that examine the efficacy of therapeutic methods for degenerative muscle diseases. If diseased muscle is successfully treated and restored to its healthy state, expression of regeneration markers should be downregulated. Based on this notion, some studies examined downregulation of embryonic MyHC to assess therapeutic efficacy (Guiraud et al., 2019). However, little is known about indicators that directly reflect normality of muscle tissue.
Although experimental muscle regeneration is a highly ordered process, it is not completely synchronized, and thus there is a regional difference in the progression of regeneration within a single muscle. In a regeneration model of grafted muscle, it was reported that a radial gradient of regeneration is formed, with more mature muscle at the periphery and less mature muscle toward the center in the regenerating grafted muscle (Carlson and Gutmann, 1975). Likewise, other muscle regeneration models, including cardiotoxin injury models, do not show completely uniform regeneration, with some regions showing accelerated regeneration while other regions are in a delayed phase of regeneration. Therefore, it is important to develop a reliable method for evaluating muscle regeneration accurately and quantitatively, taking spatial non-uniformity of regeneration into account.
In this study, we carefully examined several regeneration-related markers during muscle regeneration. These analyses revealed that expression of Myozenin (Myoz1 and Myoz3), Troponin I (Tnni2), and Dystrophin (Dmd) correlates very well with the progression of regeneration. Their expression highly reflects myofiber maturity because high expression of these genes can only be achieved in muscle tissue in vivo and not in cultured myotubes in vitro. We also developed a method that can distinguish advanced regenerating areas from delayed regenerating areas within single muscle, which enables accurate and quantitative evaluation of muscle regeneration. Our study provides useful information for the studies of muscle regeneration and therapy for muscle diseases.
Materials and Methods
Mice
C57BL/6 wild type mice were used to isolate satellite cells and to analyze muscle regeneration. DBA/2-mdx (D2-mdx) mice were provided from Central Institute for Experimental Animals in Japan. All animal experiments performed in this report were approved by the Animal Care and Use Committee of Tokyo Metropolitan Geriatric Hospital and Institute of Gerontology.
Muscle Injury
Cardiotoxin (CTX, Sigma) was dissolved in sterile saline at a concentration of 10 μM. Tibialis anterior (TA) muscles of 2 to 3 month old mice were injected with 100 μl CTX. TA muscles were isolated at days 0, 3, 5, 7, and 14 of CTX injury, embedded in tragacanth gum, and frozen in liquid nitrogen-cooled isopentane.
Satellite Cell Isolation
Isolation of mouse satellite cells was reported previously (Uezumi et al., 2016). Hind limb muscles were collected, minced and digested with 0.2% type II collagenase (Worthington) for 60 min at 37°C using a magnetic stirrer. Digested muscles were passed through an 18-gauge needle several times and further digested for 30 min at 37°C. Digested samples were filtered through a 100-μm cell strainer, and then through a 40-μm cell strainer. Cells were resuspended in washing buffer and labeled with APC-eFluor 780-conjugated rat anti-mouse CD45 (1:250) (Invitrogen), PE/Cy7-conjugated rat anti-mouse CD31 (1:250) (Biolegend), biotin-conjugated SM/C-2.6 (1:250) (Fukada et al., 2004), and PE-conjugated goat anti-mouse PDGFRα (15 μl/test) (R&D systems), followed by secondary staining with streptavidin-brilliant violet 421 (Biolegend) (1:250). CD31–CD45–PDGFRα–SM/C-2.6+ cells were sorted and collected as satellite cells with FACSAria II (BD Biosciences).
Cell Culture
After cell sorting, satellite cells were seeded at a density of 1 × 10⁴ cells/well on a 48-well cell culture plate coated with Matrigel (BD Biosciences) in growth medium (GM) consisting of DMEM supplemented with 20% FBS, 1% penicillin-streptomycin, and 2.5 ng/μl bFGF (Katayama Chemical), and cultured at 37°C in 5% CO2 and 3% O2. After 4 days of culture in GM, GM was changed to differentiation medium (DM) consisting of DMEM with 5% horse serum. Then cells were maintained at 37°C in 5% CO2 and 20% O2 for 3 days to induce myogenic differentiation.
RNA Extraction and Quantitative Reverse Transcription-PCR Analysis
Total RNA was extracted from cultured satellite cells and muscles using RNeasy Mini Kit (Qiagen) and miRNeasy Mini Kit (Qiagen), respectively. Pieces of muscle tissues collected from frozen TA muscles were crushed in QIAzol Lysis Reagent (Qiagen) using a Shakeman homogenizer (Bio Medical Science). Complementary DNA (cDNA) was synthesized using QuantiTect Transcription Kit (Qiagen). qRT-PCR was performed with SYBR Premix Ex Taq II (Takara) on a Takara Thermal Cycler Dice Real Time System (Takara) under the following cycling conditions: 94°C for 30 s followed by 40 cycles of amplification (94°C for 5 s, 60°C for 20 s, 72°C for 12 s) and dissociation curve analysis. For gene expression analysis in regenerating TA muscles and differentiating satellite cells, mRNA expression was normalized with Cmas. Relative mRNA expression was then calculated using the 2–ΔΔ method. Specific primers used for qRT-PCR were listed in Supplementary Table 1. Primers for Actb were provided from QuantiTect Primer Assays Kit (Qiagen).
Immunohistochemistry
Frozen transverse sections were cut at the thickness of 8 μm and fixed for 5 min in ice-cooled acetone. After blocking with M.O.M.TM mouse IgG blocking reagent (Vector Laboratories), sections were incubated overnight at 4°C with primary antibodies diluted in M.O.M.TM diluent. After washing with PBS, sections were stained with secondary antibodies. Primary and secondary antibodies used were listed in Supplementary Table 2. Nuclei were counterstained with DAPI (Dojindo), and stained muscles were mounted with SlowFade Diamond anti-fade reagent (Invitrogen). Fluorescent signals were detected with confocal laser scanning microscope systems TCS-SP8 (Leica). The same sections were stained with hematoxylin and eosin (HE) after capturing fluorescent images. HE images were taken with microscope AXIO (Carl Zeiss) equipped with a digital camera, Axiocam ERc 5s (Carl Zeiss).
Quantitative Analysis of Mature Myofibers
Cross-sections were made by cutting at the mid-belly of TA muscle (at the position about 3 mm from proximal end of TA muscle). After immunostaining, fluorescent images of entire cross-sections were captured with fluorescent microscope system BZ-X710 (Keyence). Image recognition and quantification were performed by using the Hybrid Cell Count Application (Keyence). First, entire cross-sectional areas of TA muscle were measured. For quantification of Myoz1-positive area, Myoz1-stained area was recognized based on the intensity of Myoz1 staining by adjusting threshold. For quantification of dystrophin-positive area, dystrophin-stained sarcolemma was first recognized based on the intensity of dystrophin staining by adjusting threshold, and then dystrophin-positive fiber area was recognized by using inversion function. After recognition of Myoz1- and dystrophin-positive areas, the misrecognized small areas were excluded by adjusting lower limit in histogram function. Finally, errors in recognition step were corrected manually, and then Myoz1- and dystrophin-positive areas were measured. Myoz1- or dystrophin-positive area was divided by entire cross-sectional area to calculate percentage of area positive for each marker. Two side unpaired t-test was used to compare two groups.
Statistical Analysis
Statistical significance was evaluated using GraphPad Prism 8.0 (GraphPad Software). One-way analysis of variance (ANOVA) followed by Tukey’s or Dunnett’s test was used to compare more than two groups.
Results
Optimum Internal Control Gene for Gene Expression Analysis During Muscle Regeneration
We first analyzed the expression of several internal control genes by qRT-PCR to determine the optimum control genes for the most accurate gene expression analysis during muscle regeneration. As shown in Figure 1, Gapdh and Actb (also called β-actin), commonly used control genes, were highly variable in their expression during muscle regeneration (Figure 1). Therefore, these genes are not suitable as internal control genes to normalize expression of target genes. One pioneering study on comprehensive gene expression analysis during muscle regeneration had previously pointed out this problem and identified two genes that are stably expressed across all time points during muscle regeneration (Zhao and Hoffman, 2004). Those two genes are Cmas (also called as CMP-N-acetylneuraminic acid synthase) and Eif3c (called as NIPI-like protein). We thus examined the expression of Cmas and found relatively stable expression of this gene during muscle regeneration (Figure 1). Therefore, we decided to use Cmas as an internal control gene for gene expression analysis during muscle regeneration.
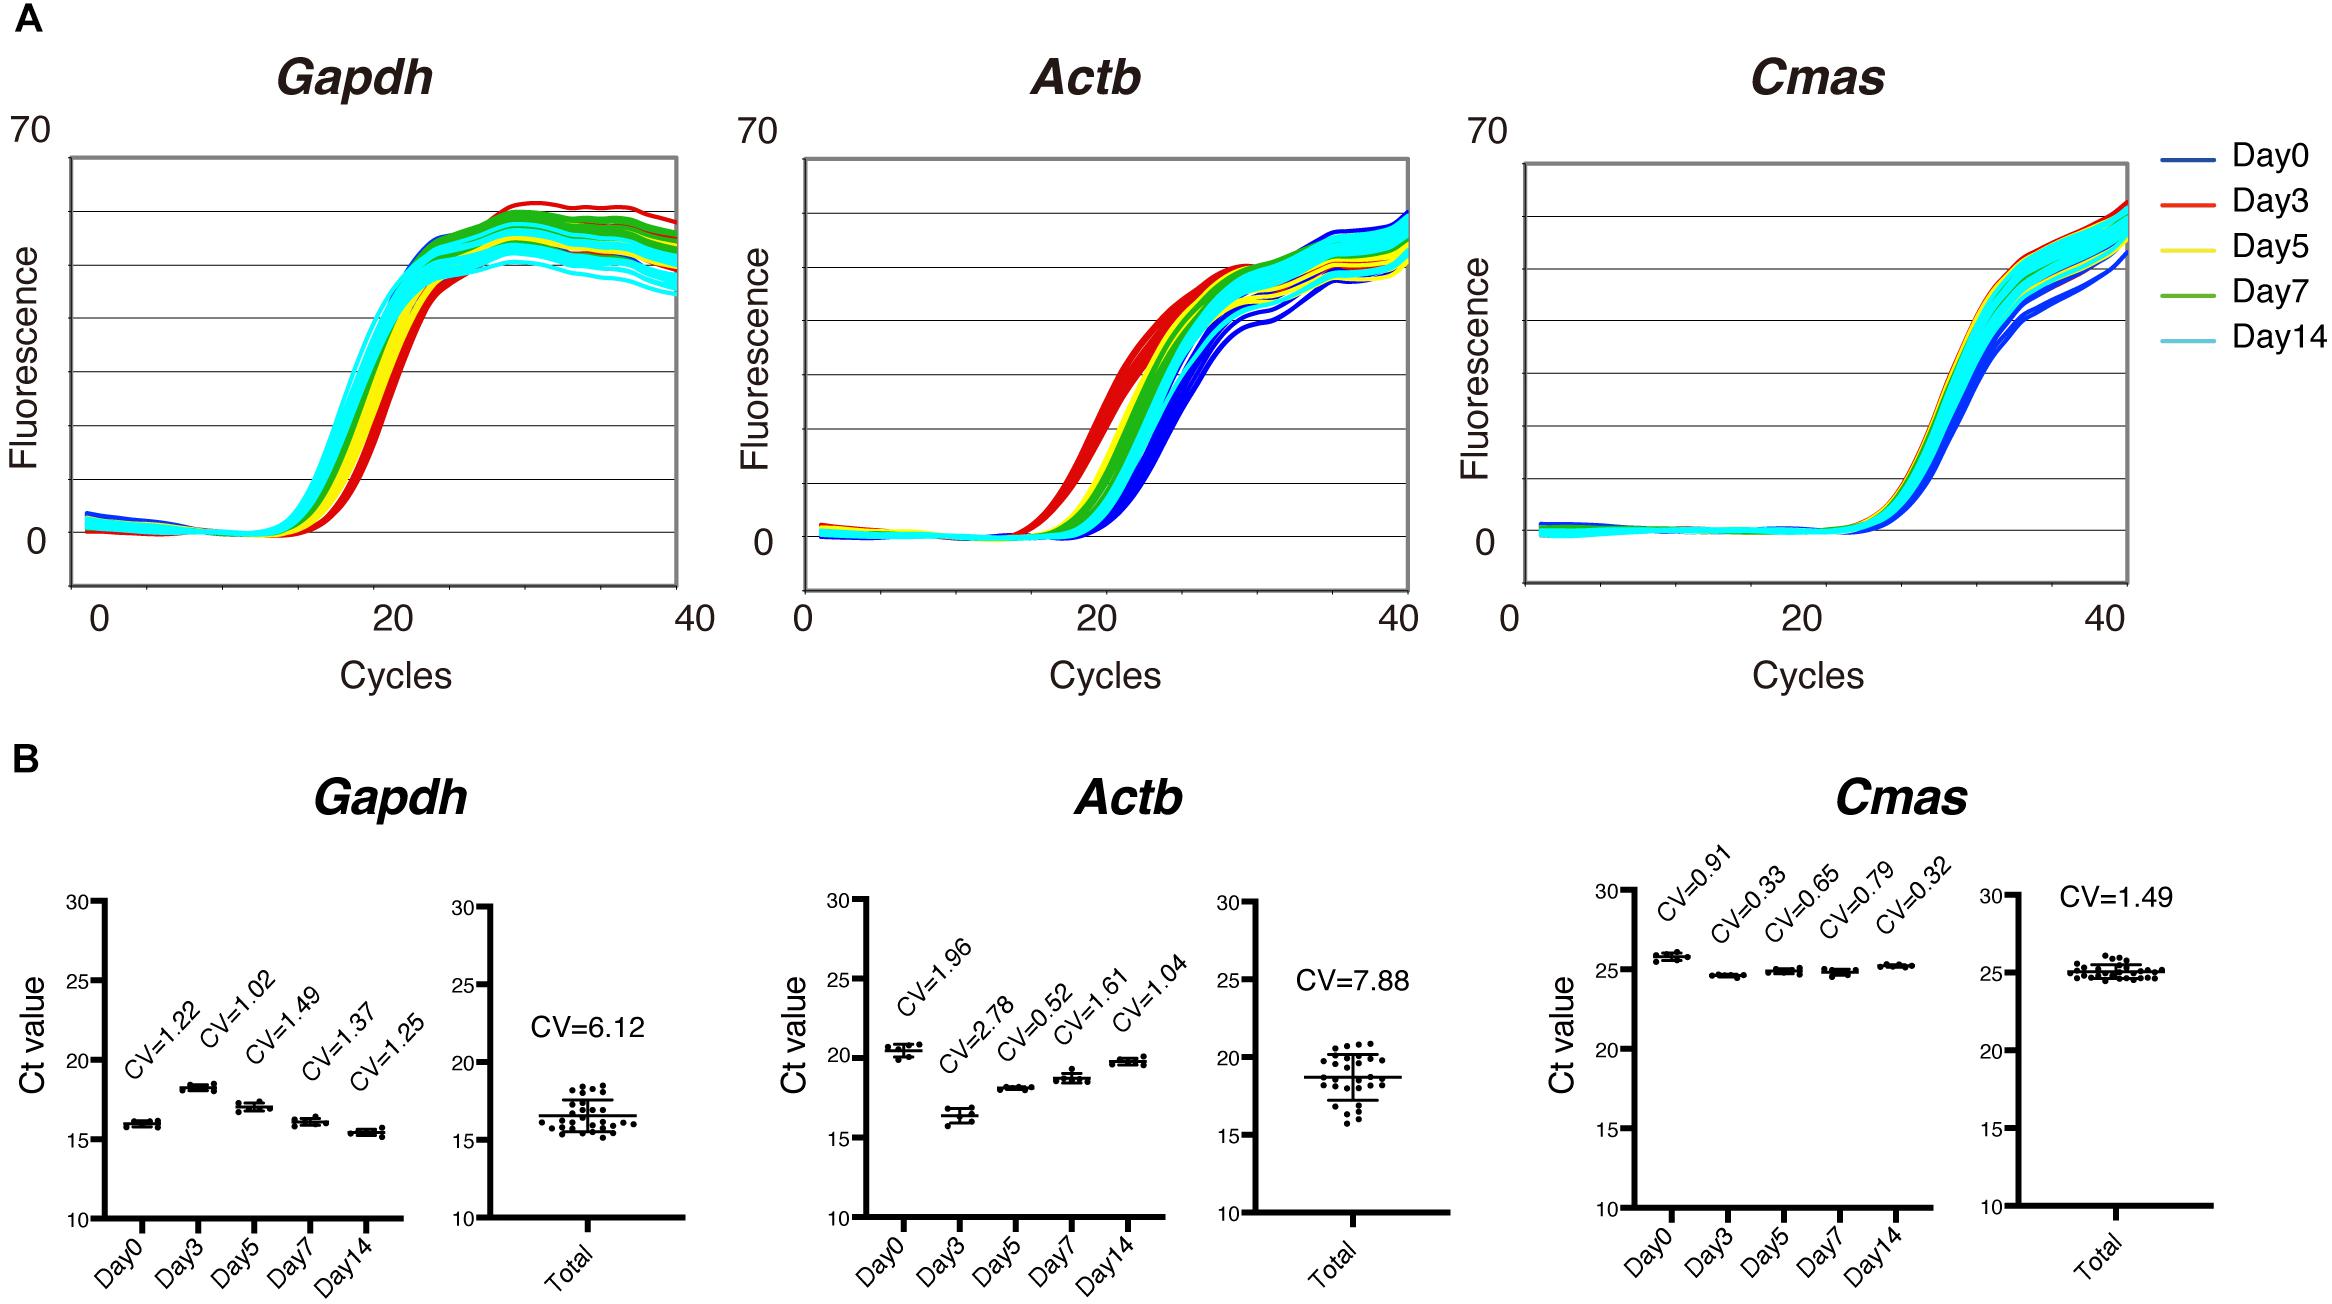
Figure 1. Optimum internal control genes for gene expression analysis during muscle regeneration. (A) Amplification curves of quantitative reverse transcription-PCR (qRT-PCR) for Gapdh, β-actin (Actb), and Cmas using total RNA extracted from intact and regenerating tibialis anterior (TA) muscles 3, 5, 7, and 14 days after CTX injury. (B) Cycle threshold (Ct) values of indicated time points and total data for Gapdh, Actb, and Cmas are shown as mean ± SD of n = 6 mice at each time point. Coefficient of variation (CV) is shown in the graphs. Note that Ct value of Cmas showed smaller CV than that of Gapdh or Actb.
Gradual Upregulation of Myoz1, Myoz3, Tnni2, and Dmd Reflects the Myofiber Maturity During Regeneration
We next examined expression of several regeneration-related genes. As expected, expression of MyoD and Myogenin were highly induced upon muscle injury, and gradually downregulated thereafter (Figure 2A). We also observed similar dynamics in the expression of embryonic-type contractile genes. As shown in Figure 2B, expression of Myh3 and Myh8 was detected at day 3 of muscle injury, reached its peak at day 5, and then decreased to levels comparable to intact muscle. Thus, expression of above-described genes is transient during muscle regeneration and therefore does not reflect completion of regeneration accurately. Zhao et al. (2002) performed temporal gene expression profiling of muscle regeneration and showed that expression of muscle structural component genes is downregulated at early stages and then upregulated at late stages of muscle regeneration. Those include Myozenin, which encodes a Z-disk associated protein myozenin, and Tnni2, which encodes a fast skeletal type troponin I, a protein responsible for the calcium-dependent regulation of muscle contraction. Therefore, we examined expression of these muscle structural component genes. Expression of Myoz1, Myoz3, and Tnni2 was sharply downregulated at day 3 of muscle injury, and then gradually upregulated as regeneration proceeded (Figure 2C), indicating that expression of these genes well reflects the extent of muscle regeneration. We also analyzed expression of Dmd, which encodes a dystrophin protein, and Myh4, which encodes a MyHC-IIb, a predominant type of MyHC expressed in TA muscle (Kammoun et al., 2014). Similar to Myoz1, Myoz3 and Tnni2, expression of Dmd correlated well with the progression of regeneration (Figure 2C). Although Myh4 showed a similar expression pattern, it reflected the extent of regeneration less accurately because there was no statistically significant difference in its expression levels between day 3 and day5, or day 5 and day 7 (Figure 2C). In contrast to these genes, expression of Myoz2 and Myf6 did not reflect muscle maturity (Figure 2D). These results clearly show that Myoz1, Myoz3, Tnni2, and Dmd are excellent markers for the assessment of myofiber maturity during muscle regeneration.
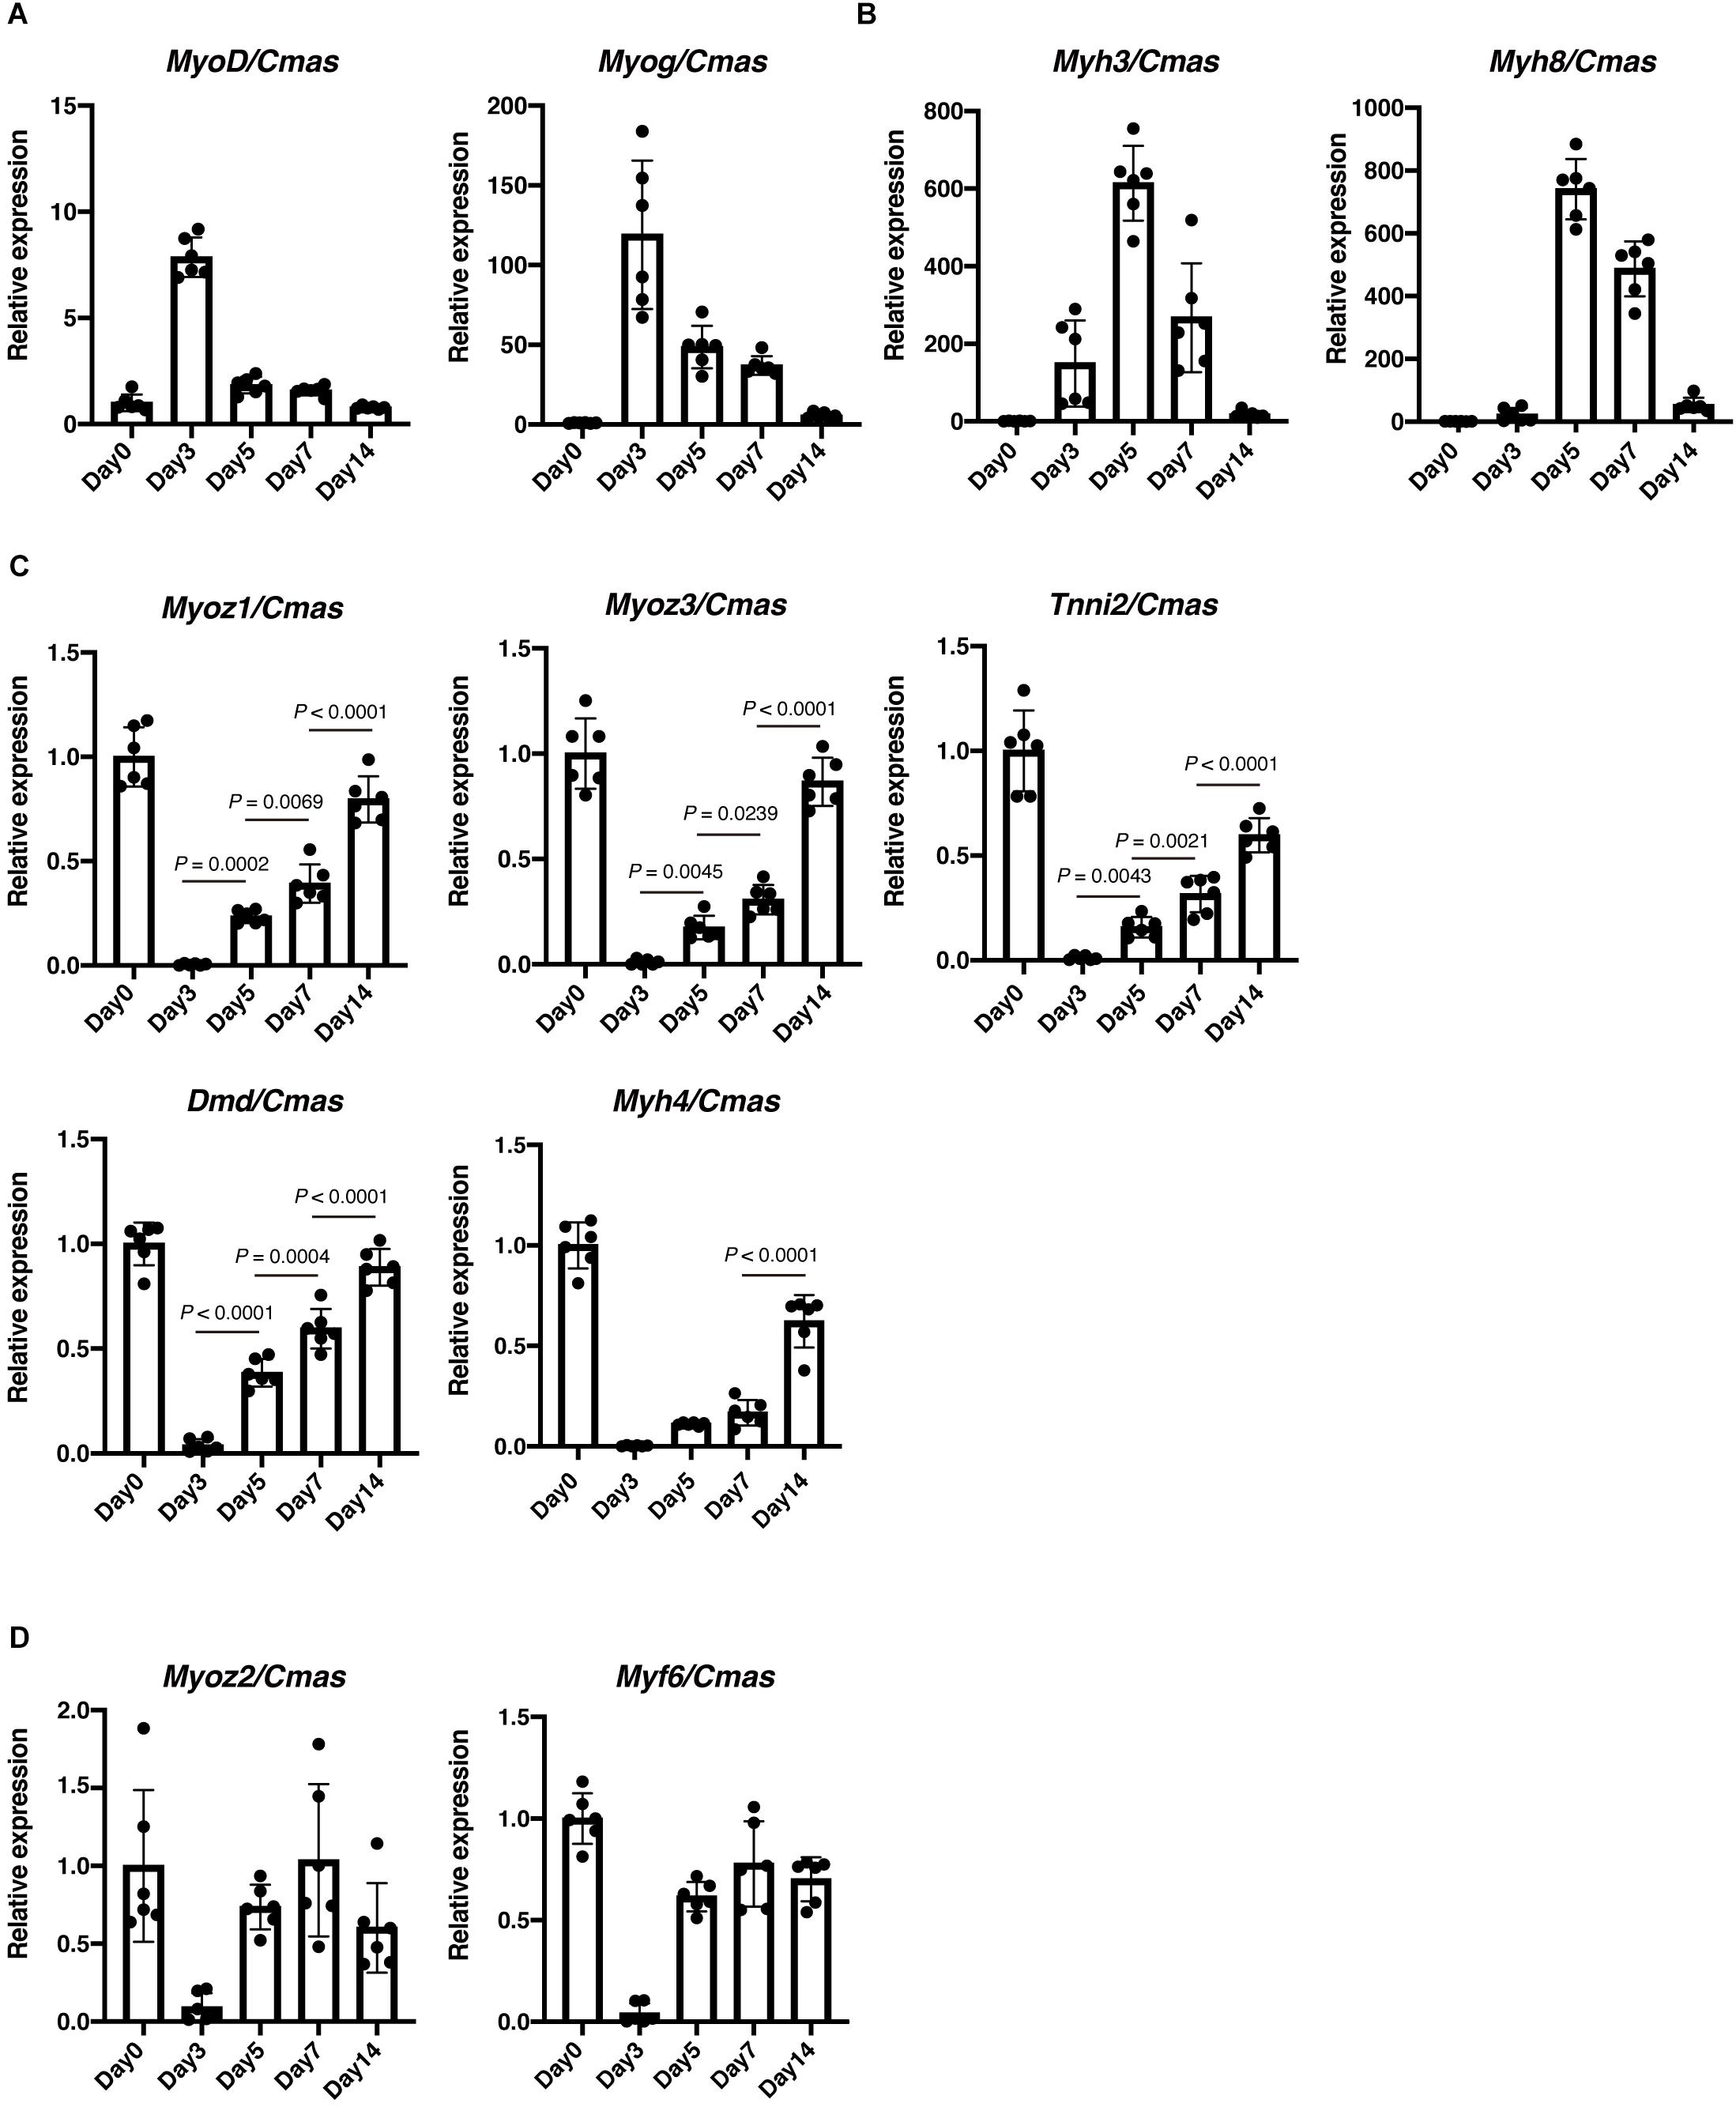
Figure 2. Expression of Myoz1, Myoz3, Tnni2, and Dmd correlates with the progression of muscle regeneration. Expression of MyoD and Myog (A), Myh3 and Myh8 (B), Myoz1, Myoz3, Tnni2, Dmd and Myh4 (C), Myoz2 and Myf6 (D) during muscle regeneration was examined by qRT-PCR. Data are shown as relative value to intact muscle (Day 0) and represent mean ± SD of n = 6 mice at each time point. Data on Myoz1, Myoz3, Tnni2, Dmd, and Myh4 from day 3 to day 14 were analyzed by ANOVA followed by Tukey’s test to evaluate statistical difference.
High Level Expression of Myoz1, Myoz3, and Tnni2 Cannot Be Achieved in Cultured Myotubes
Results described above strongly suggest that expression of Myoz1, Myoz3, Tnni2, and Dmd correlates with myofiber maturity. It is well-known that cultured myotubes cannot mature into myofibers. To further confirm the relationship between expression of Myoz1, Myoz3, Tnni2, and Dmd and myofiber maturity, we examined the expression of these genes during myogenesis of cultured satellite cells. Satellite cells were FACS-sorted from hind limb muscles and cultured in vitro to obtain myotubes (Figure 3A). During the first 4 days of the growth period, satellite cells became activated, and they proliferated extensively (Figure 3B). Upon induction of differentiation, they rapidly formed myotubes at day 5 of culture, and generated numerous myotubes by day 7 as they further differentiated (Figures 3C,D). In CTX muscle regeneration model, satellite cells proliferate extensively within 2 to 3 days of injury and begin to form regenerated myofibers approximately 5 days after injury, and regenerated myofibers mature afterward (Hawke and Garry, 2001). Thus, proliferation period and timing of differentiation of satellite cells are similar between in vitro myogenesis and in vivo regeneration model. As expected, undifferentiated myoblasts expressed very low levels of Myoz1, Myoz3, Tnni2, and Dmd similarly to CTX-injected muscle at day 3 (Figures 2C, 3E). In later time points, expression levels of Myoz1, Myoz3 and Tnni2 remained quite low compared to levels in intact and regenerating (CTX day 5 and day 7) TA muscles in vivo (Figure 3E). Although expression of Dmd remained low levels until day 5 of culture, its expression in myotubes increased to the levels comparable to in vivo regenerating muscle at day 7 (Figure 3E). These data further reinforce the view that expression of Myoz1, Myoz3, and Tnni2 well-reflects myofiber maturity that cannot be achieved in cultured myotubes.
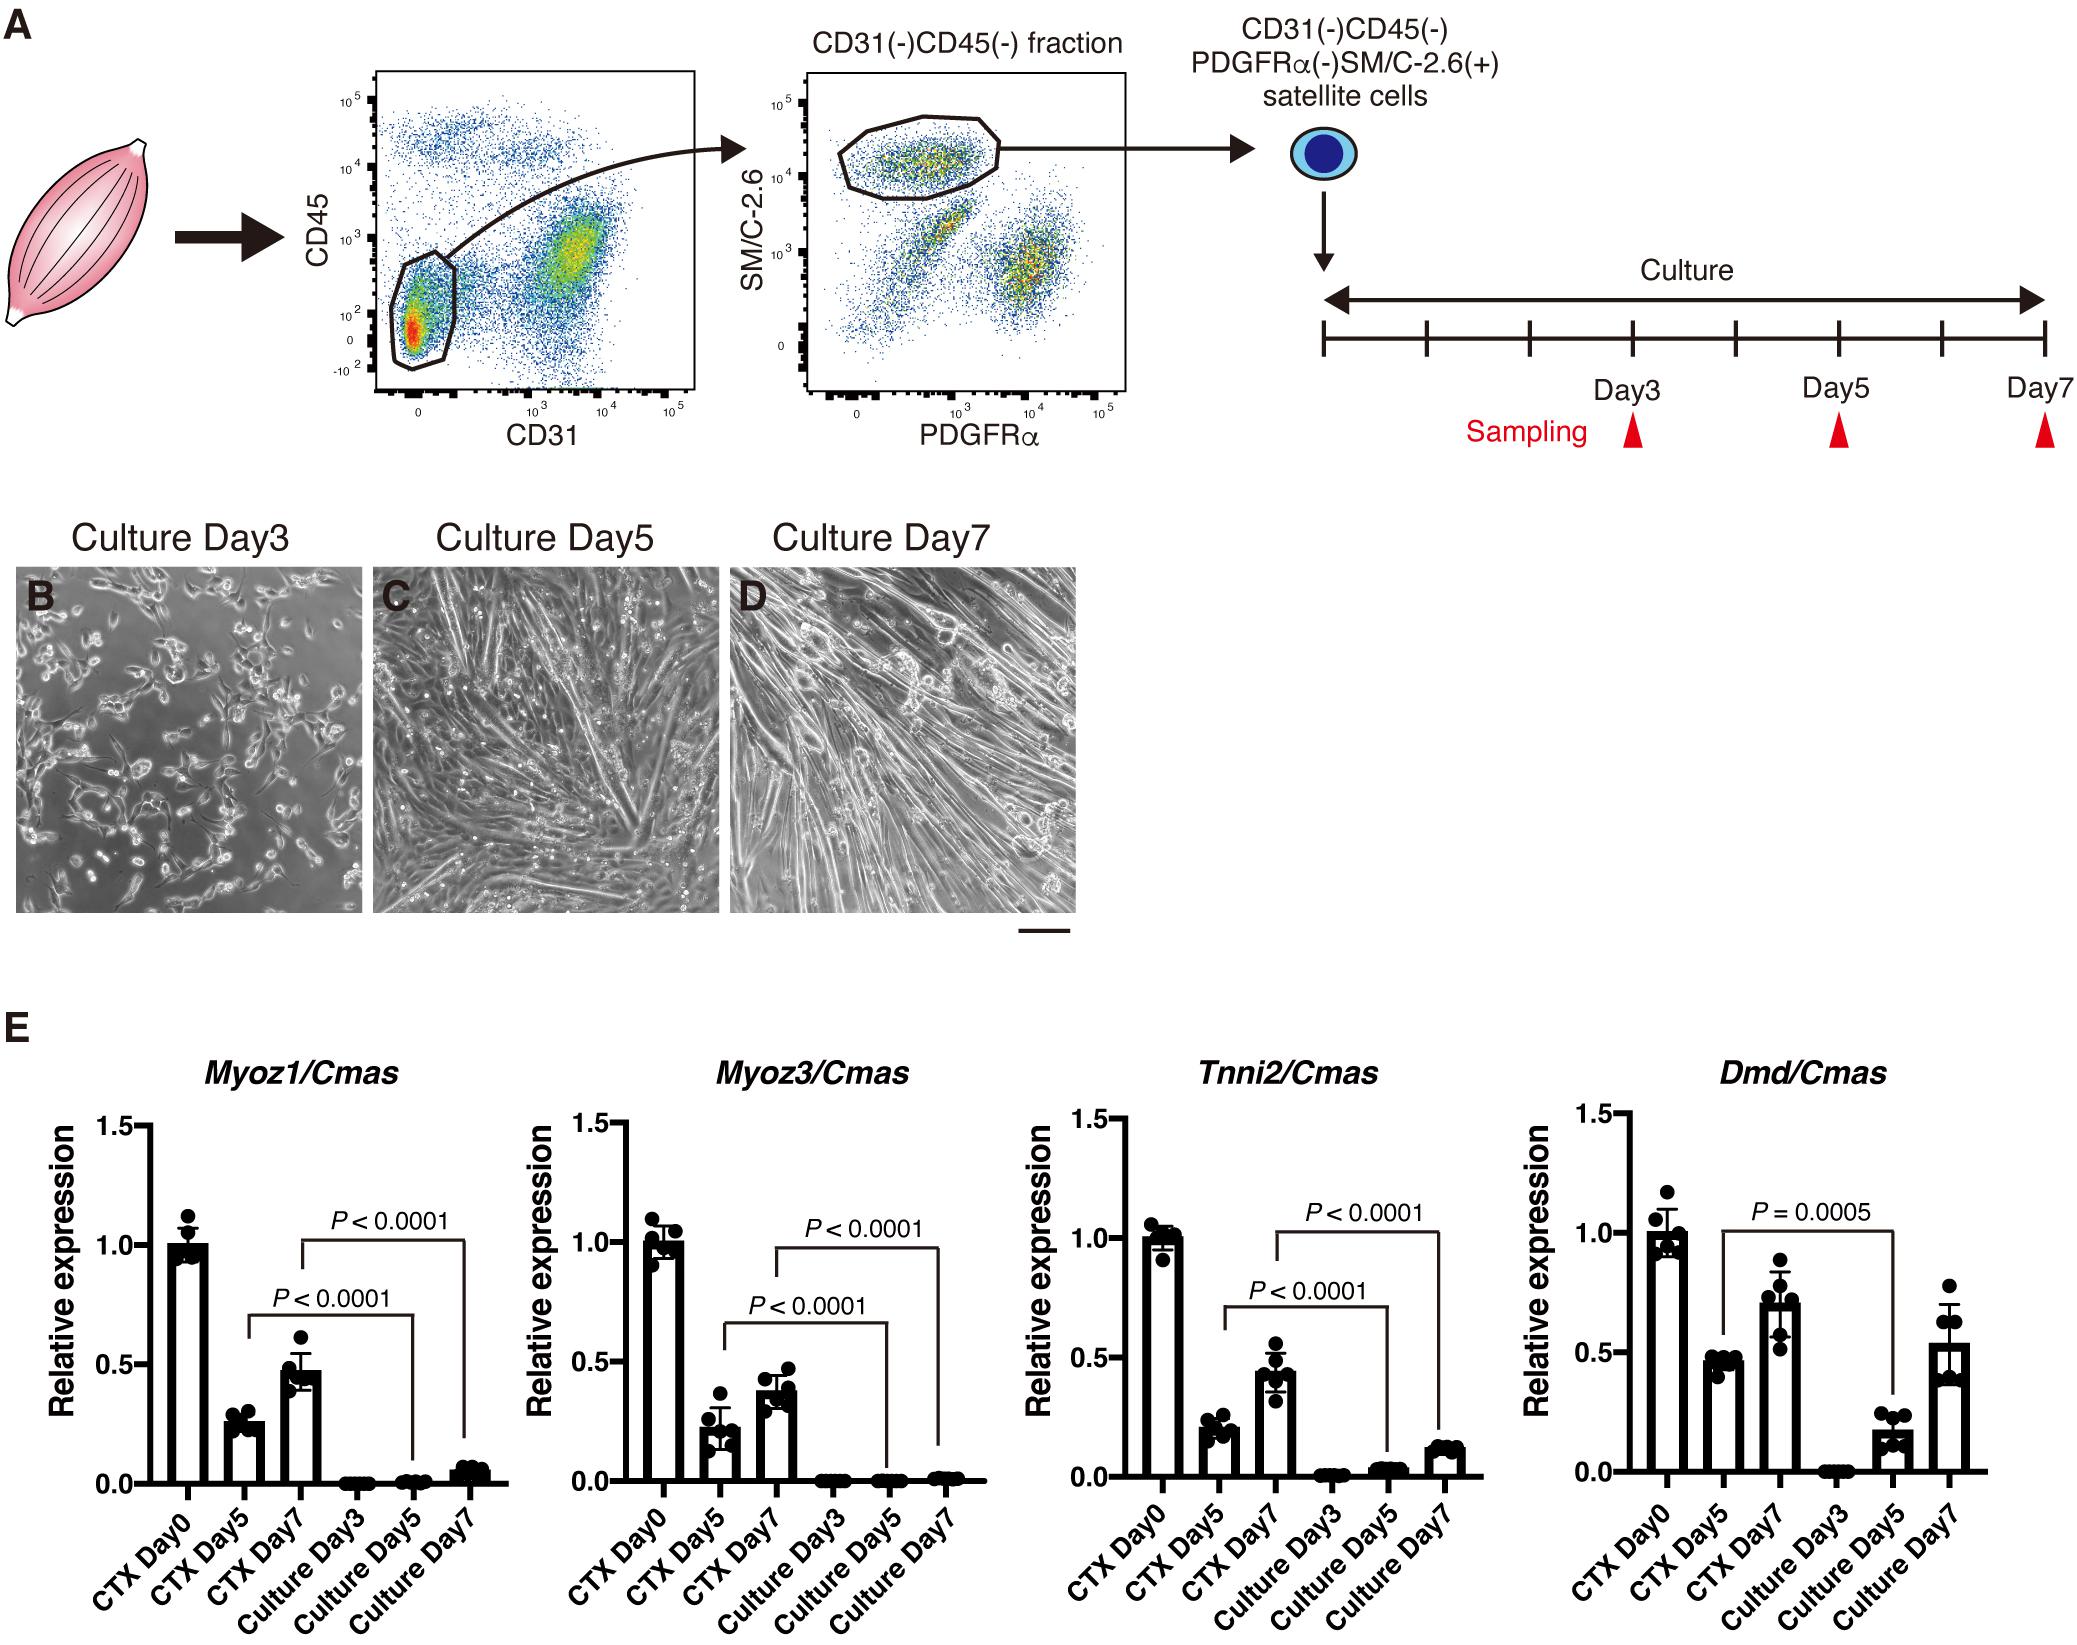
Figure 3. In vitro cultured myotubes do not express high levels of Myoz1, Myoz3, and Tnni2. (A) Scheme of satellite cell isolation and culture. (B–D) Isolated satellite cells were cultured in GM for 4 days, then induced to differentiate into myotubes in DM. Representative images of cultured cells were taken at indicated time points. (E) Expression of Myoz1, 3, Tnni2, and Dmd in intact (CTX Day 0), regenerating TA muscle (CTX Days 5 and 7) and cultured satellite cells was examined by qRT-PCR. Data are shown as relative value to intact TA muscle and represent the mean ± SD from independent experiments (n = 6). Data from regenerating TA muscle (CTX Days 5 and 7) and cultured cells were analyzed by ANOVA followed by Tukey’s test to evaluate statistical difference. Scale bar: 100 μm (B–D).
Centrally Nucleated Fibers With Myoz1 and Dystrophin Expression Identify Areas of Advanced Regeneration
Evaluating Myoz1, Myoz3, Tnni2, and Dmd expression would be very useful for assessing the degree of muscle regeneration at the whole-tissue level. However, in some cases, it is necessary to assess muscle regeneration at the single-myofiber level because muscle regeneration is not a uniform process, with some regions showing advanced regeneration while other regions showing a delayed phase of regeneration. To overcome this problem, we developed a method that can accurately assess this spatial non-uniformity of regeneration. Centrally located nuclei are commonly used as an index of regenerated myofibers. However, central nuclei already exist in nascent myotubes, precluding its use as a reference index when assessing myofiber maturity. Among the markers whose expression correlate well with the progression of regeneration (Myoz1, Myoz3, Tnni2, and Dmd), we could obtain clear staining results for Myoz1 and dystrophin proteins. Because Myoz1 is a Z-disk associated protein, Myoz1-stained muscle showed sarcomere pattern, suggesting the specificity of the antibody used in this study (Supplementary Figure 1). We found that Myoz1 expression disappears upon muscle injury but gradually reappears as muscle regeneration proceeds (Figures 4A,B). Intriguingly, although well-differentiated large centrally nucleated fibers were strongly positive for Myoz1, small basophilic nascent myotubes were scantly positive or negative for Myoz1 even in contiguous areas of the same muscle (Figure 4C). Dystrophin staining resulted in similar expression pattern, although dystrophin re-expression tended to be restricted to more mature myofibers (Figure 5). These results indicate that centrally nucleated myofiber with recovered Myoz1 or dystrophin expression is useful for assessing the spatial non-uniformity of muscle regeneration at single-myofiber level.
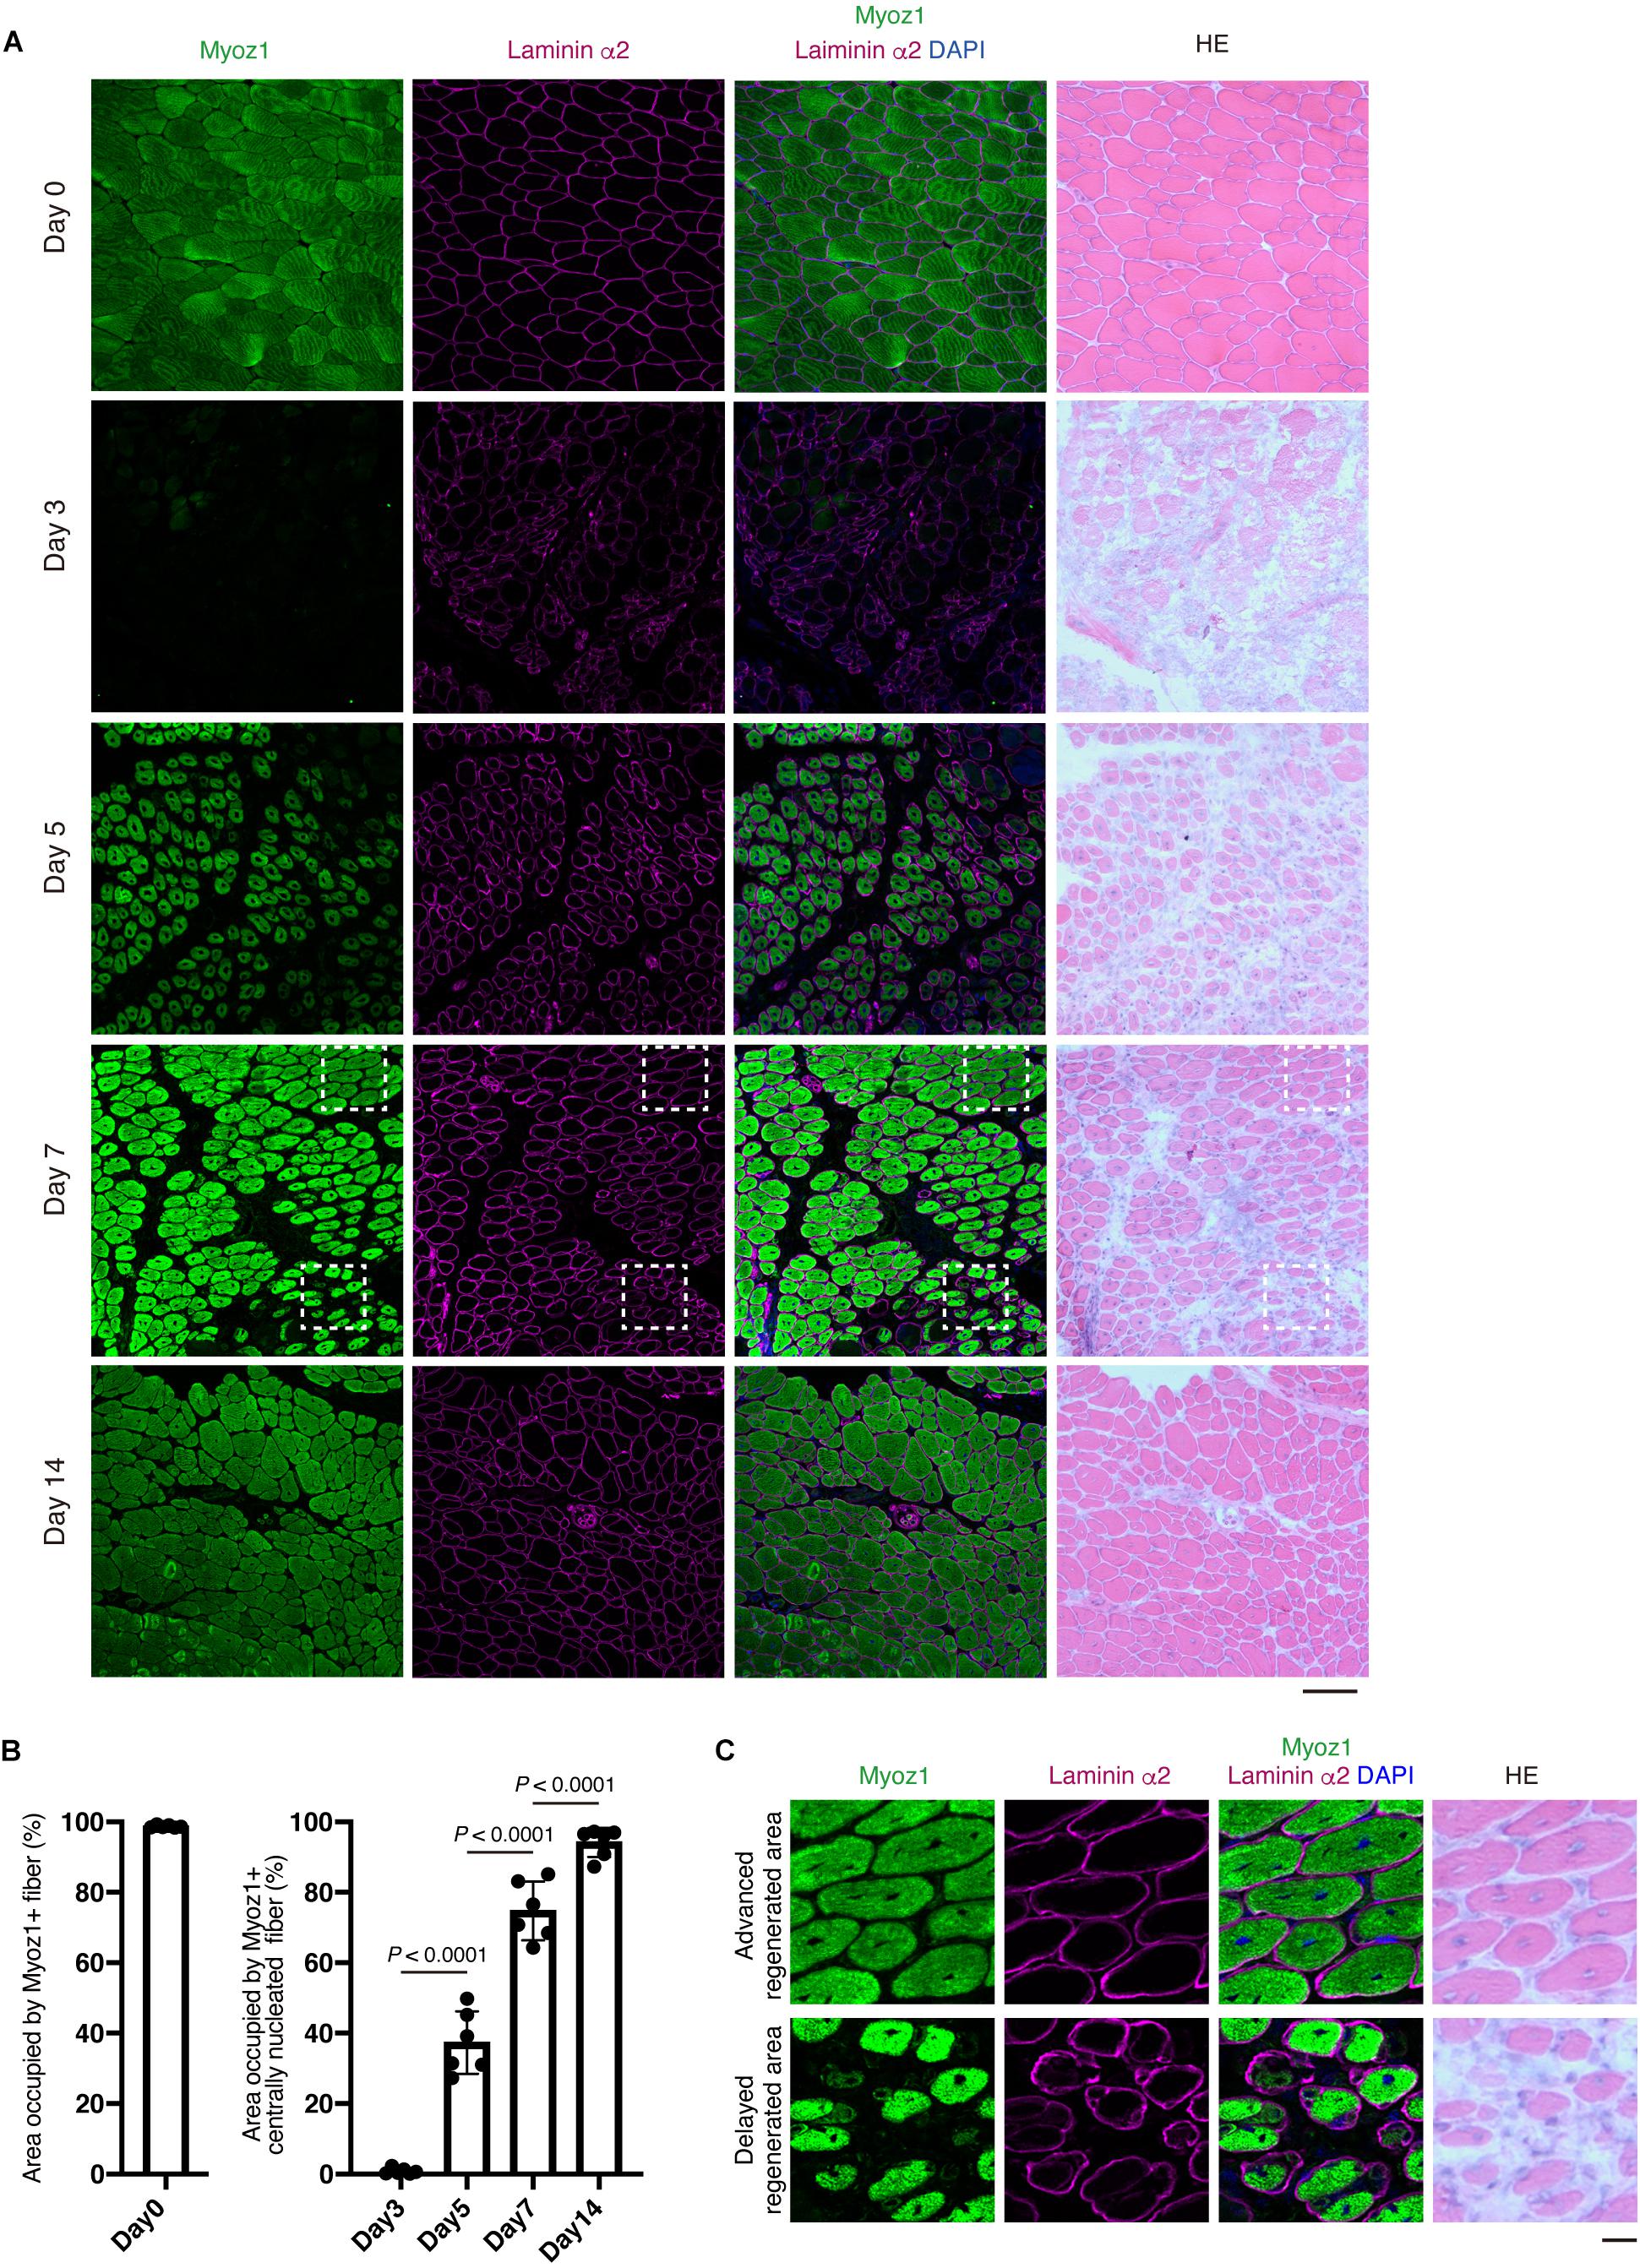
Figure 4. Re-expression of Myoz1 protein is closely associated with the extent of myofiber regeneration. (A) TA muscle sections from the indicated time points were subjected to immunofluorescent staining for Myoz1 (green) and Laminin α2 (magenta) followed by HE staining. (B) Area occupied by Myoz1+ fibers in intact muscle (Day 0) and Myoz1+ centrally nucleated fibers in regenerating muscle was quantified. Data represent the mean ± SD of n = 6 mice at each time point. Data from regenerating muscle (Day 3 to Day 14) were analyzed by ANOVA followed by Tukey’s test to evaluate statistical difference. (C) Magnified images of boxed areas in (A). Upper panels show area with advanced regeneration and lower panels show area with delayed regeneration. Scale bars: 100 μm (A) and 20 μm (C).
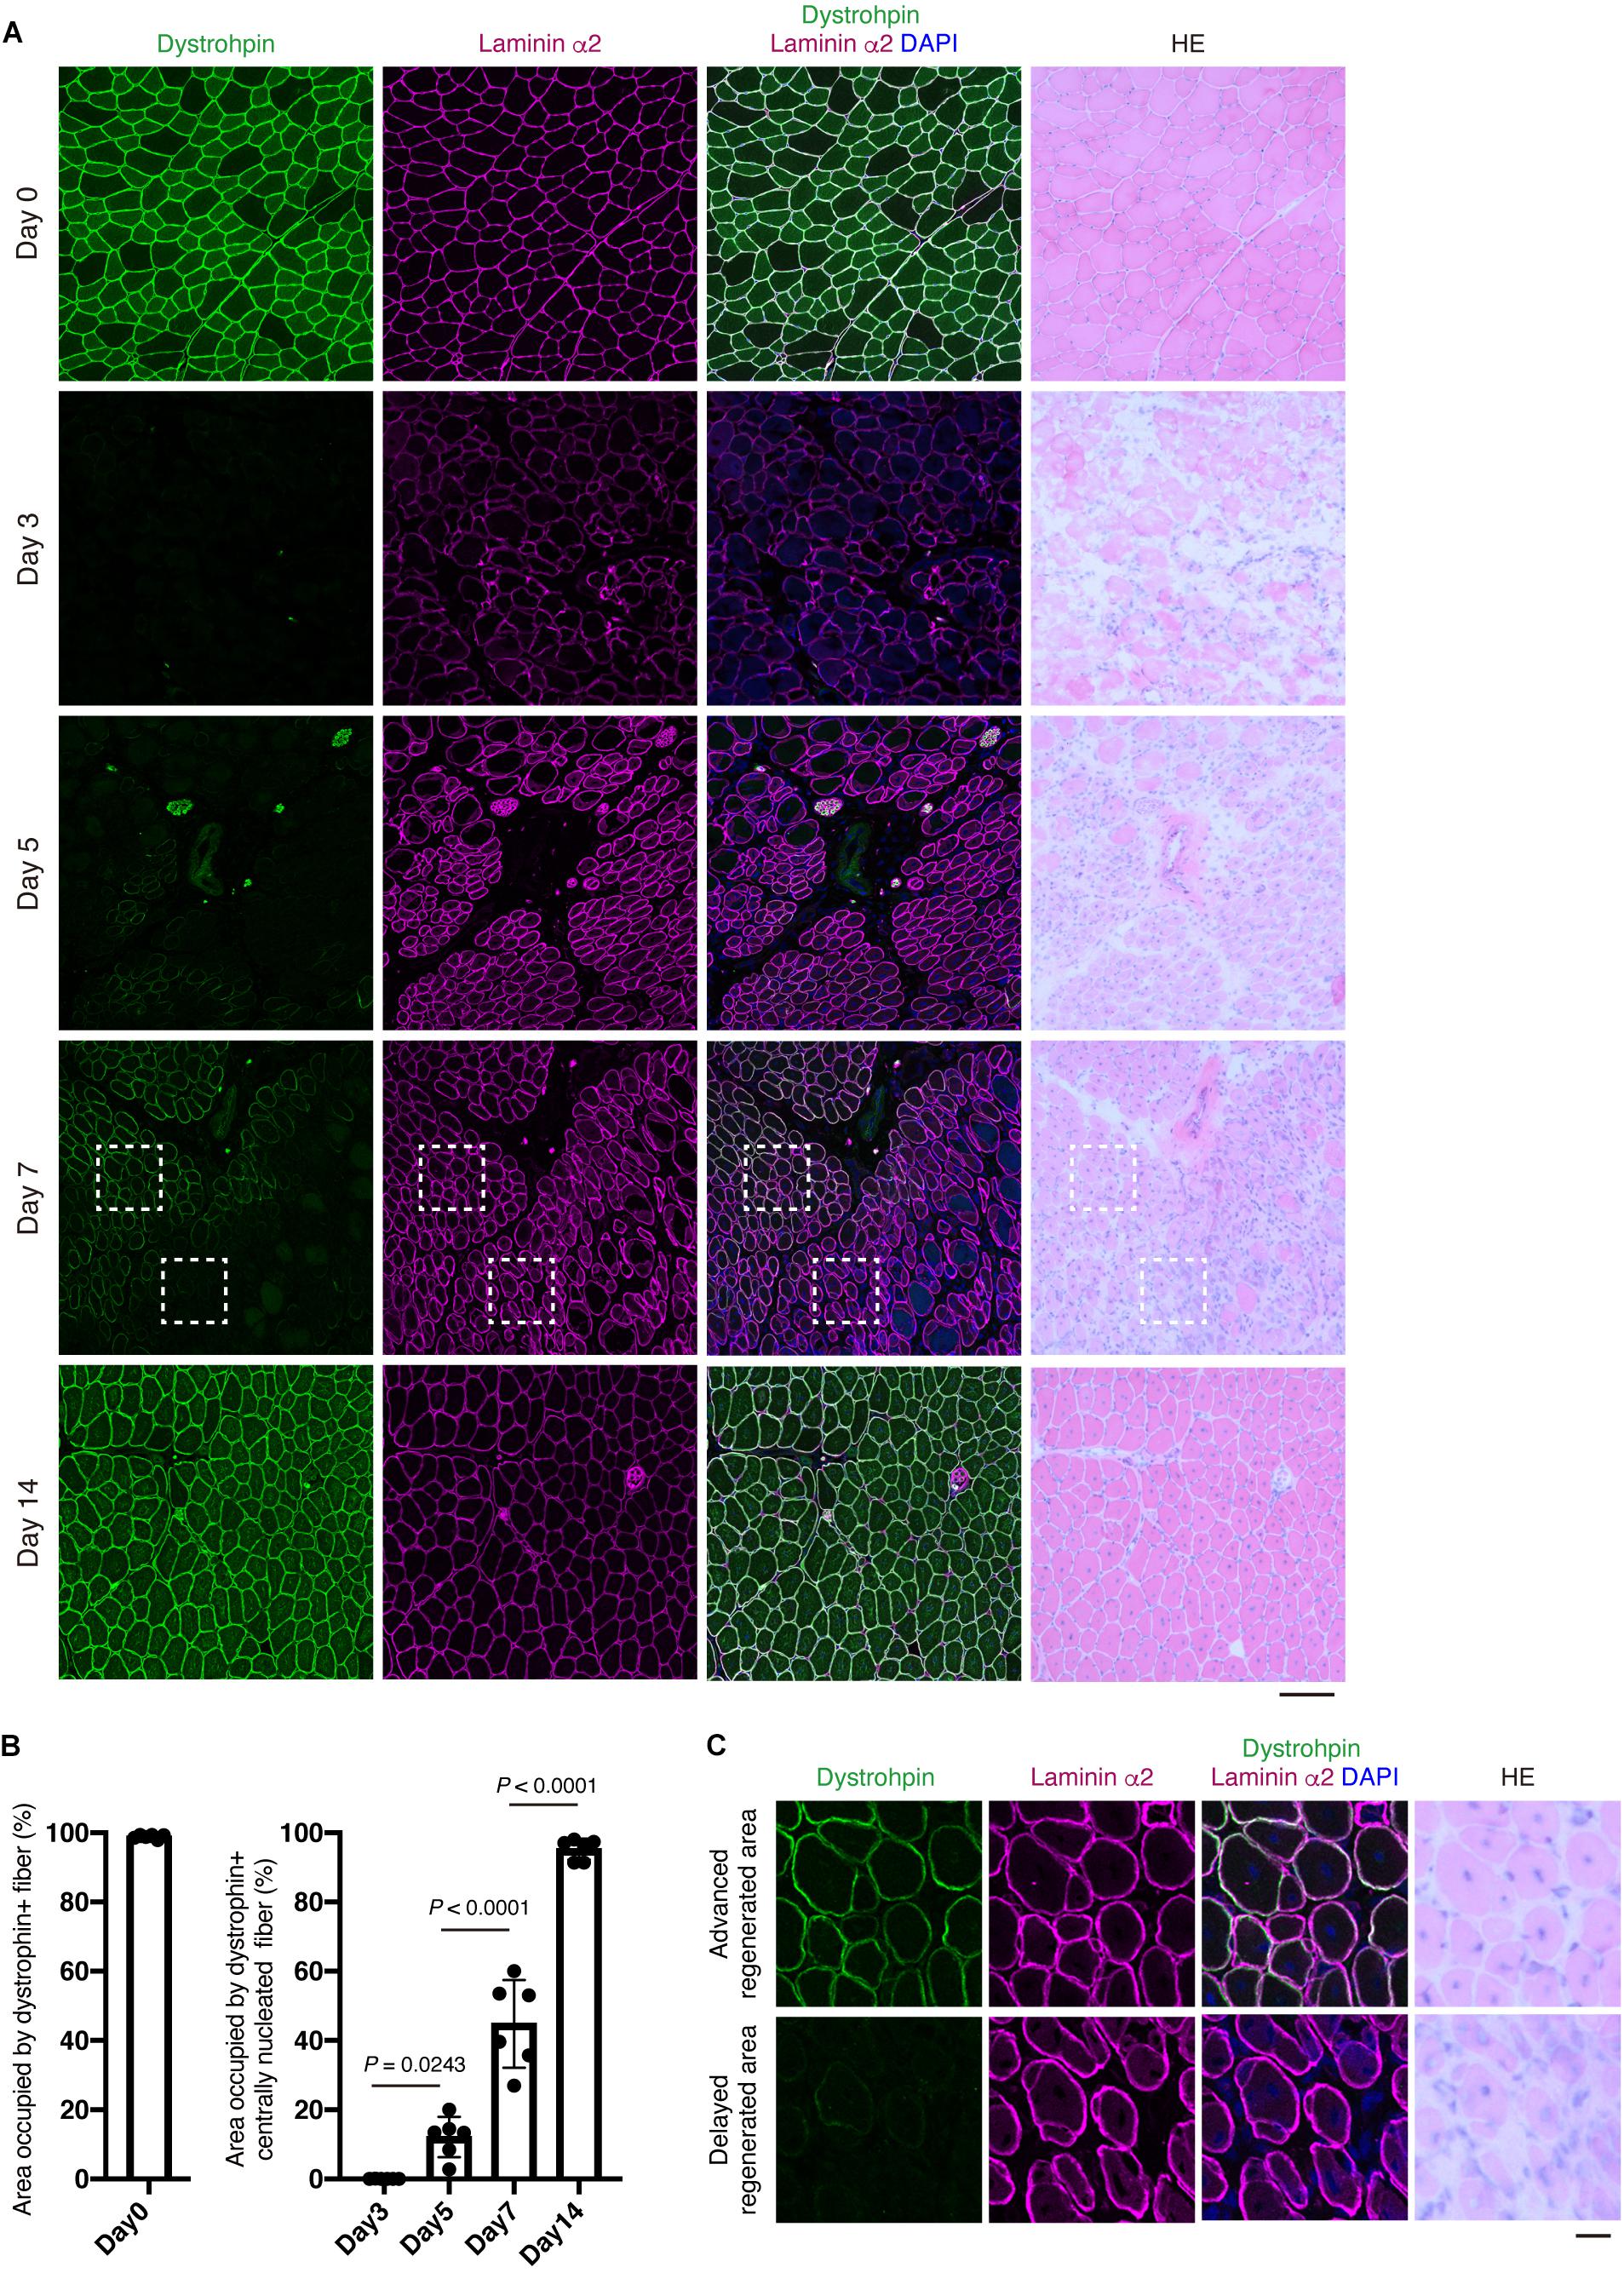
Figure 5. Re-expression of dystrophin protein at the plasma membrane is closely associated the extent of myofiber regeneration. (A) TA muscle sections from the indicated time points were subjected to immunofluorescent staining for Dystrophin (green) and Laminin α2 (magenta) followed by HE staining. (B) Area occupied by Dystrophin+ fibers in intact muscle (Day 0) and Dystrophin+ centrally nucleated fibers in regenerating muscle was quantified. Data represent the mean ± SD of n = 6 mice at each time point. Data from regenerating muscle (Day 3 to Day 14) were analyzed by ANOVA followed by Tukey’s test to evaluate statistical difference. (C) Magnified images of boxed areas in (A). Upper panels show area with advanced regeneration and lower panels show area with delayed regeneration. Scale bars: 100 μm (A) and 20 μm (C).
Re-expression of Myoz1 and Dystrophin Is a Good Indicator of Myofiber Maturity at the Single-Myofiber Level
To further understand the relationship between Myoz1 or dystrophin expression and myofiber maturity, we examined embryonic MyHC (eMyHC) expression, which is transiently upregulated in immature myofibers but downregulated as myofibers mature (d’Albis et al., 1988). Approximately 40 and 90% of eMyHC-positive immature myofibers were negative for Myoz1 and dystrophin, respectively (Figure 6A), indicating that re-expression of these markers occurs in myofibers with advanced maturation stage.
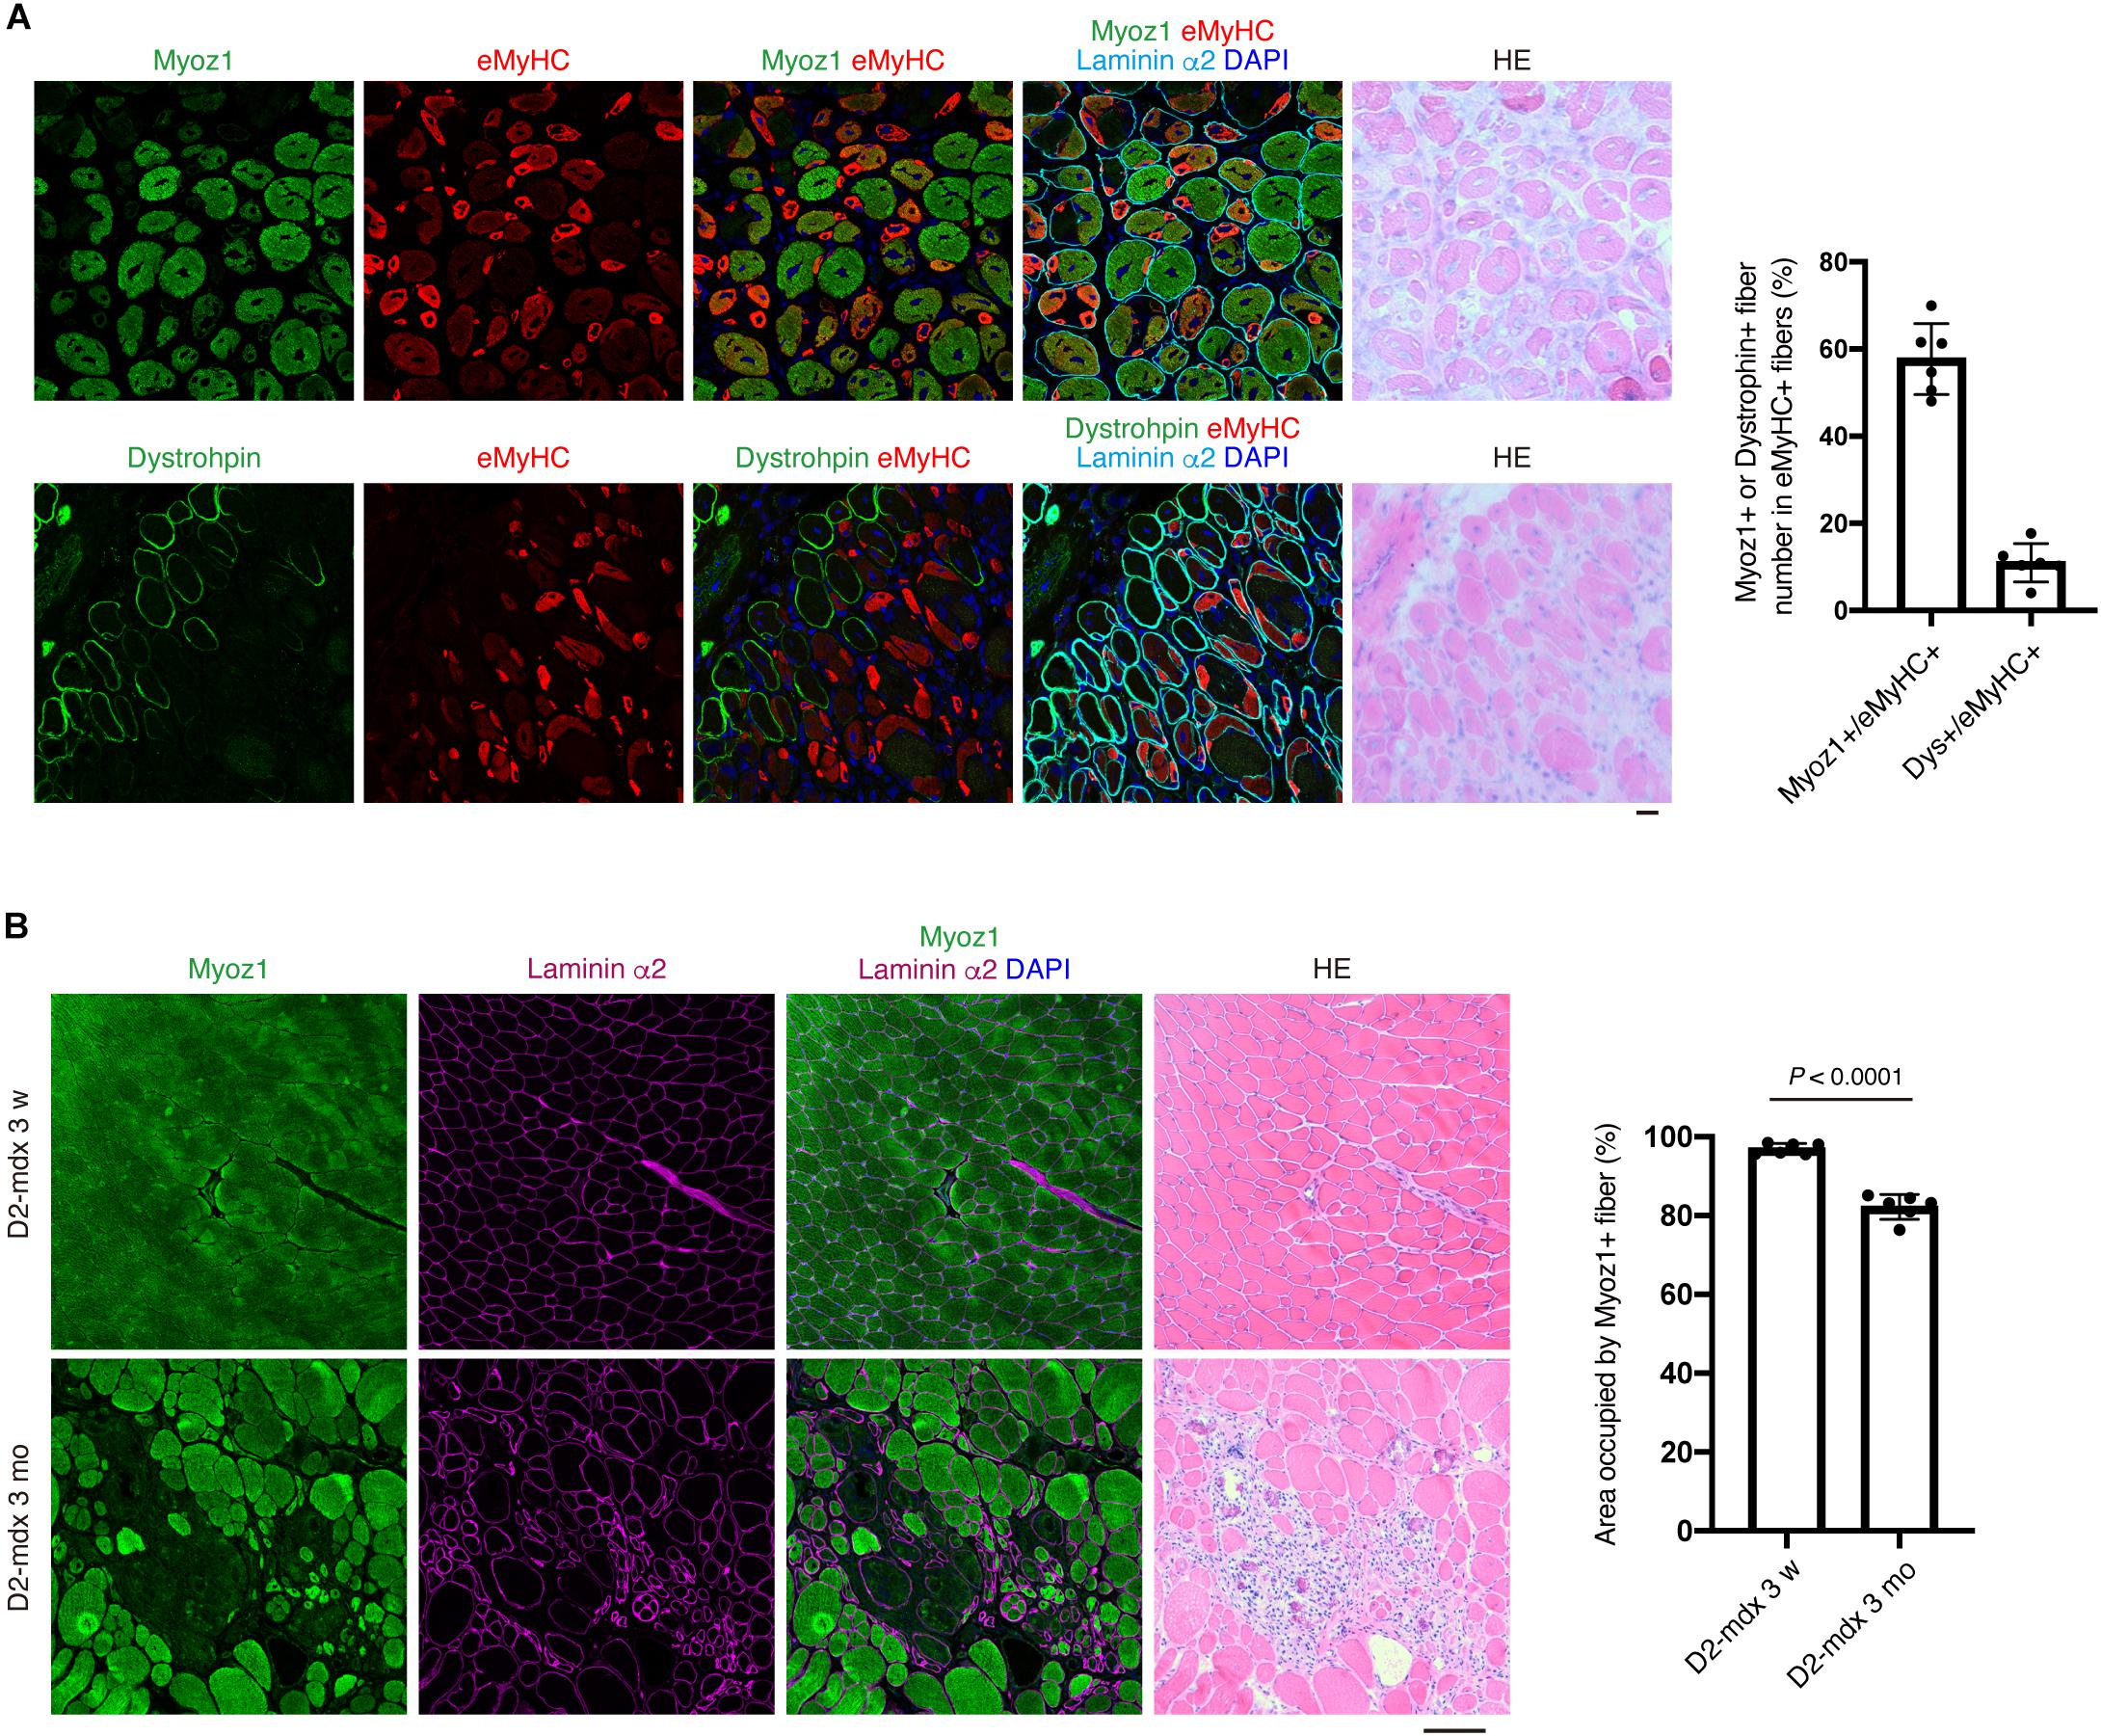
Figure 6. Expression of Myoz1 and dystrophin protein is a good indicator of myofiber maturity at the single-fiber level. (A) TA muscle section from day 7 of CTX injection was subjected to immunofluorescent staining for Myoz1 or Dystrophin (green), eMyHC (red) and Laminin α2 (cyan) followed by HE staining. Graph shows percentage of Myoz1+ or Dystrophin+ fiber number in eMyHC+ fibers. Data represent the mean ± SD of n = 6 mice. (B) Quadriceps muscle section from D2-mdx mice at 3 weeks or 3 months of age was subjected to immunofluorescent staining for Myoz1 (green) and Laminin α2 (magenta) followed by HE staining. Area occupied by Myoz1+ fibers was quantified. Data represent the mean ± SD of n = 6 mice at each time point. Data was analyzed by two-sided unpaired t-test to evaluate statistical difference. Scale bars: 20 μm (A) and 100 μm (B).
We also examined usefulness of these markers in evaluating disease progression of D2-mdx mice, a severe mouse model of Duchenne muscular dystrophy (DMD) (Fukada et al., 2010). Muscle of mdx background appears normal until approximately 3–4 weeks of age, but myofibers undergo massive degeneration afterward (DiMario et al., 1991). Because D2-mdx mice lack dystrophin expression, we examined expression of Myoz1 before and after disease onset. At 3 weeks of age, all myofibers of D2-mdx mice appeared normal and uniformly expressed Myoz1 (Figure 6B). After onset of symptoms, however, small immature myofibers located in degenerated area were scantly positive or negative for Myoz1, and total Myoz1-positive area was significantly decreased in ratio compared with pre-symptomatic stage (Figure 6B). These results indicate that expression of Myoz1 and dystrophin is a good indicator of myofiber maturity and useful for evaluating “normality” of myofiber in pathological conditions.
Discussion
In this study, we describe methods for the assessment of myofiber maturity during skeletal muscle regeneration. Expression of Myoz1, Myoz3, Tnni2, and Dmd significantly correlates with progression of muscle regeneration, and therefore, these genes are quite useful to quantify and evaluate the extent of muscle regeneration at the whole-muscle tissue level. Meanwhile, re-expression of Myoz1 and dystrophin is an excellent indicator for the assessment of myofiber maturity at the single-fiber level.
Myozenin is specifically expressed in striated muscle and localized at Z-disks (Faulkner et al., 2000; Takada et al., 2001). Myozenin is reported to interact with other Z-disk proteins including a-actinin, filamin-C, telethonin and myotilin, and thought to be involved in the connection between the contractile apparatus and the sarcolemma (Faulkner et al., 2000; Frey et al., 2000; Takada et al., 2001; Frey and Olson, 2002; Gontier et al., 2005). In addition to its role as a structural protein, Myoz1 was shown to modulate calcineurin/NFAT activity (Frey et al., 2008), raising the possibility that Myozenin functions as a signaling molecule. In this study, we showed that expression of Myoz1 and Myoz3 is gradually upregulated as myofibers mature during muscle regeneration, and cultured myotubes do not express these genes at high levels. Therefore, it would be reasonable to assume that Myozenin plays some functional role in myofiber maturation.
We demonstrated that dystrophin begins to be re-expressed when myofibers mature in the late phase of muscle regeneration. Therefore, dystrophin re-expression closely reflects myofiber maturity. Although this method will provide a very powerful means of assessing muscle regeneration, there is a certain limitation. Because this evaluation method depends on dystrophin expression, it cannot be used in dystrophin-deficient conditions such as DMD. Evaluating Myoz1 expression offers an alternative method in such a situation as we showed in this study. However, definitive therapy for DMD is restoration of dystrophin expression. Therefore, dystrophin expression is commonly studied in research when evaluating the effects of DMD therapy. If the therapeutic strategy is based on endogenous gene expression machinery (such as exon skipping or gene editing therapy) and not on forced expression, restored dystrophin expression reflects not only proof of principle but also maturity of treated myofibers. Thus, our study provides additional rationale for examining dystrophin expression in DMD therapy research.
Methods described here are based on gene expression and histological analyses, but one of the most important functions of skeletal muscle is to contract for force generation. Therefore, measurement of contractile ability is one of the best ways to evaluate skeletal muscle property. However, evaluating contractile properties is accompanied by some technical difficulties. Our methods presented here are relatively stable and easy to perform. In addition, markers used in our methods seem to be functionally important because myozenin and troponin I are associated with contractile apparatus, and dystrophin is a causative gene for DMD. Thus, we believe that our methods provide convenient opportunity to assess myofiber maturity.
In conclusion, our study provides meaningful information that can be applied for accurate and quantitative assessment of muscle regeneration and effectiveness of therapy for muscle diseases.
Data Availability Statement
All datasets generated for this study are included in the article/Supplementary Material.
Ethics Statement
The animal study was reviewed and approved by The Animal Care and Use Committee of Tokyo Metropolitan Geriatric Hospital and Institute of Gerontology.
Author Contributions
YY performed qPCR, immunostaining and cell culture experiments, and analyzed the data. MI-U and KH induced muscle regeneration and retrieved samples. MI-U performed FACS experiments. AU and SF interpreted results and coordinated the project. AU conceived the whole project and wrote the manuscript.
Funding
YY was funded by Grant-in-Aid for JSPS Research Fellows for FY2019 and The Japanese Society for Bone and Mineral Research Frontier Scientist Grant for FY 2019. MI-U was funded by JSPS KAKENHI Grant Number JP19K09614. AU was funded by JSPS KAKENHI Grant Number JP19H04063, The General Insurance Association of Japan, and Research Fund of Mitsukoshi Health and Welfare Foundation.
Conflict of Interest
The authors declare that the research was conducted in the absence of any commercial or financial relationships that could be construed as a potential conflict of interest.
The reviewer TS declared a shared affiliation, with no collaboration, with the author KH, to the handling Editor, at the time of review.
Acknowledgments
We would like to thank Editage (www.editage.com) for English language editing.
Supplementary Material
The Supplementary Material for this article can be found online at: https://www.frontiersin.org/articles/10.3389/fcell.2020.00267/full#supplementary-material
References
Bentzinger, C. F., Wang, Y. X., and Rudnicki, M. A. (2012). Building muscle: molecular regulation of myogenesis. Cold Spring Harb. Perspect. Biol. 4:a008342. doi: 10.1101/cshperspect.a008342
Carlson, B. M., and Gutmann, E. (1975). Regneration in free grafts of normal and denervated muscles in the rat: morphology and histochemistry. Anat. Rec. 183, 47–62. doi: 10.1002/ar.1091830106
d’Albis, A., Couteaux, R., Janmot, C., Roulet, A., and Mira, J. C. (1988). Regeneration after cardiotoxin injury of innervated and denervated slow and fast muscles of mammals. myosin isoform analysis. Eur. J. Biochem. 174, 103–110. doi: 10.1111/j.1432-1033.1988.tb14068.x
DiMario, J. X., Uzman, A., and Strohman, R. C. (1991). Fiber regeneration is not persistent in dystrophic (MDX) mouse skeletal muscle. Dev. Biol. 148, 314–321. doi: 10.1016/0012-1606(91)90340-9
Faulkner, G., Pallavicini, A., Comelli, A., Salamon, M., Bortoletto, G., Ievolella, C., et al. (2000). FATZ, a filamin-, actinin-, and telethonin-binding protein of the Z-disc of skeletal muscle. J. Biol. Chem. 275, 41234–41242. doi: 10.1074/jbc.M007493200
Frey, N., Frank, D., Lippl, S., Kuhn, C., Kogler, H., Barrientos, T., et al. (2008). Calsarcin-2 deficiency increases exercise capacity in mice through calcineurin/NFAT activation. J. Clin. Invest. 118, 3598–3608. doi: 10.1172/jci36277
Frey, N., and Olson, E. N. (2002). Calsarcin-3, a novel skeletal muscle-specific member of the calsarcin family, interacts with multiple Z-disc proteins. J. Biol. Chem. 277, 13998–14004. doi: 10.1074/jbc.M200712200
Frey, N., Richardson, J. A., and Olson, E. N. (2000). Calsarcins, a novel family of sarcomeric calcineurin-binding proteins. Proc. Natl. Acad. Sci. U.S.A. 97, 14632–14637. doi: 10.1073/pnas.260501097
Fukada, S., Higuchi, S., Segawa, M., Koda, K., Yamamoto, Y., Tsujikawa, K., et al. (2004). Purification and cell-surface marker characterization of quiescent satellite cells from murine skeletal muscle by a novel monoclonal antibody. Exp. Cell Res. 296, 245–255. doi: 10.1016/j.yexcr.2004.02.018
Fukada, S., Morikawa, D., Yamamoto, Y., Yoshida, T., Sumie, N., Yamaguchi, M., et al. (2010). Genetic background affects properties of satellite cells and mdx phenotypes. Am. J. Pathol. 176, 2414–2424. doi: 10.2353/ajpath.2010.090887
Gontier, Y., Taivainen, A., Fontao, L., Sonnenberg, A., van der Flier, A., Carpen, O., et al. (2005). The Z-disc proteins myotilin and FATZ-1 interact with each other and are connected to the sarcolemma via muscle-specific filamins. J. Cell Sci. 118(Pt 16), 3739–3749. doi: 10.1242/jcs.02484
Guiraud, S., Edwards, B., Squire, S. E., Moir, L., Berg, A., Babbs, A., et al. (2019). Embryonic myosin is a regeneration marker to monitor utrophin-based therapies for DMD. Hum. Mol. Genet. 28, 307–319. doi: 10.1093/hmg/ddy353
Hawke, T. J., and Garry, D. J. (2001). Myogenic satellite cells: physiology to molecular biology. J. Appl. Physiol. (1985) 91, 534–551. doi: 10.1152/jappl.2001.91.2.534
Kammoun, M., Cassar-Malek, I., Meunier, B., and Picard, B. (2014). A simplified immunohistochemical classification of skeletal muscle fibres in mouse. Eur. J. Histochem. 58:2254. doi: 10.4081/ejh.2014.2254
Lepper, C., Partridge, T. A., and Fan, C. M. (2011). An absolute requirement for Pax7-positive satellite cells in acute injury-induced skeletal muscle regeneration. Development 138, 3639–3646. doi: 10.1242/dev.067595
Murphy, M. M., Lawson, J. A., Mathew, S. J., Hutcheson, D. A., and Kardon, G. (2011). Satellite cells, connective tissue fibroblasts and their interactions are crucial for muscle regeneration. Development 138, 3625–3637. doi: 10.1242/dev.064162
Sacco, A., Doyonnas, R., Kraft, P., Vitorovic, S., and Blau, H. M. (2008). Self-renewal and expansion of single transplanted muscle stem cells. Nature 456, 502–506. doi: 10.1038/nature07384
Sambasivan, R., Yao, R., Kissenpfennig, A., Van Wittenberghe, L., Paldi, A., Gayraud-Morel, B., et al. (2011). Pax7-expressing satellite cells are indispensable for adult skeletal muscle regeneration. Development 138, 3647–3656. doi: 10.1242/dev.067587
Sartore, S., Gorza, L., and Schiaffino, S. (1982). Fetal myosin heavy chains in regenerating muscle. Nature 298, 294–296. doi: 10.1038/298294a0
Takada, F., Vander Woude, D. L., Tong, H. Q., Thompson, T. G., Watkins, S. C., Kunkel, L. M., et al. (2001). Myozenin: an alpha-actinin- and gamma-filamin-binding protein of skeletal muscle Z lines. Proc. Natl. Acad. Sci. U.S.A. 98, 1595–1600. doi: 10.1073/pnas.041609698
Uezumi, A., Kasai, T., and Tsuchida, K. (2016). Identification, isolation, and characterization of mesenchymal progenitors in Mouse and human skeletal muscle. Methods Mol. Biol. 1460, 241–253. doi: 10.1007/978-1-4939-3810-0_17
Zammit, P. S. (2017). Function of the myogenic regulatory factors Myf5, MyoD, Myogenin and MRF4 in skeletal muscle, satellite cells and regenerative myogenesis. Semin. Cell Dev. Biol. 72, 19–32. doi: 10.1016/j.semcdb.2017.11.011
Zammit, P. S., Golding, J. P., Nagata, Y., Hudon, V., Partridge, T. A., and Beauchamp, J. R. (2004). Muscle satellite cells adopt divergent fates: a mechanism for self-renewal? J. Cell Biol. 166, 347–357. doi: 10.1083/jcb.200312007
Zhao, P., and Hoffman, E. P. (2004). Embryonic myogenesis pathways in muscle regeneration. Dev. Dyn. 229, 380–392. doi: 10.1002/dvdy.10457
Keywords: skeletal muscle, muscle regeneration, muscle differentiation, satellite cells, muscle disease
Citation: Yoshimoto Y, Ikemoto-Uezumi M, Hitachi K, Fukada S and Uezumi A (2020) Methods for Accurate Assessment of Myofiber Maturity During Skeletal Muscle Regeneration. Front. Cell Dev. Biol. 8:267. doi: 10.3389/fcell.2020.00267
Received: 19 January 2020; Accepted: 30 March 2020;
Published: 22 April 2020.
Edited by:
Atsushi Asakura, University of Minnesota Twin Cities, United StatesReviewed by:
Masatoshi Suzuki, University of Wisconsin–Madison, United StatesAshok Kumar, University of Houston, United States
Takahiko Sato, Fujita Health University, Japan
Copyright © 2020 Yoshimoto, Ikemoto-Uezumi, Hitachi, Fukada and Uezumi. This is an open-access article distributed under the terms of the Creative Commons Attribution License (CC BY). The use, distribution or reproduction in other forums is permitted, provided the original author(s) and the copyright owner(s) are credited and that the original publication in this journal is cited, in accordance with accepted academic practice. No use, distribution or reproduction is permitted which does not comply with these terms.
*Correspondence: Akiyoshi Uezumi, dWV6dW1pQHRtaWcub3IuanA=
 Yuki Yoshimoto
 Madoka Ikemoto-Uezumi
 Keisuke Hitachi
 So-ichiro Fukada
 Akiyoshi Uezumi