 Jie Wang1,2†
 Kai Li1,2†Xilin Zhang1,2Guihua Li1,2Tingting Liu1,2Xiaojun Wu1,2
 Stephen L. Brown3
 Li Zhou1,2*
 Qing-Sheng Mi1,2*
- 1Center for Cutaneous Biology and Immunology Research, Department of Dermatology, Henry Ford Health System, Detroit, MI, United States
- 2Immunology Research Program, Henry Ford Cancer Institute, Henry Ford Health System, Detroit, MI, United States
- 3Department of Radiation Oncology, Henry Ford Health System, Detroit, MI, United States
The development of invariant natural killer T (iNKT) cells requires a well-attuned set of transcription factors, but how these factors are regulated and coordinated remains poorly understood. MicroRNA-155 (miR-155) is a key regulator of numerous cellular processes that affects cell development and homeostasis. Here, we found that miR-155 was highly expressed in early iNKT cells upon thymic selection, and then its expression is gradually downregulated during iNKT cell development. However, the mice with miR-155 germline deletion had normal iNKT cell development. To address if downregulated miR-155 is required for iNKT cell development, we made a CD4Cre.miR-155 knock-in (KI) mouse model with miR-155 conditional overexpression in the T cell lineage. Upregulated miR-155 led to interruption of iNKT cell development, diminished iNKT17 and iNKT1 cells, augmented iNKT2 cells, and these defects were cell intrinsic. Furthermore, defective iNKT cells in miR-155KI mice resulted in the secondary innate-like CD8 T cell development. Mechanistically, miR-155 modulated multiple targets and signaling pathways to fine tune iNKT cell development. MiR-155 modulated Jarid2, a critical component of a histone modification complex, and Tab2, the upstream activation kinase complex component of NF-κB, which function additively in iNKT development and in promoting balanced iNKT1/iNKT2 differentiation. In addition, miR-155 also targeted Rictor, a signature component of mTORC2 that controls iNKT17 differentiation. Taken together, our results indicate that miR-155 serves as a key epigenetic regulator, coordinating multiple signaling pathways and transcriptional programs to precisely regulate iNKT cell development and functional lineage, as well as secondary innate CD8 T cell development.
Introduction
Invariant natural killer T (iNKT) cells are innate-like T cells, which possess the properties of both T cells and NK cells, as they coexpress a rearranged T cell receptor (TCR) and several NK cell receptors, including NK1.1. iNKT cells are restricted to the non-classical MHC-I-like molecule CD1d and preferentially use an invariant TCR consisting predominantly of the Vα14-Jα18/Vβ8 pair in mice, endowing iNKT cells with specificity for self or non-self-glycolipid antigens (Bendelac et al., 2007; Das et al., 2010). Classically, iNKT cells undergo four successive developmental stages, including stage 0 (CD24+), stage 1 (CD24–CD44lo), stage 2 (CD44hiNK1.1–), and stage 3 (CD44hiNK1.1+). Unlike conventional T cells, iNKT cells acquire an effector function and differentiate into iNKT1 (PLZFloT-bethi), iNKT2 (PLZFhiRORγt–), and iNKT17 (PLZFintRORγt+) based on transcriptional factors, including T-bet, PLZF, GATA3, and RORγt, before thymic export. Alternatively, iNKT1 cells develop through all stages and finally mature in stage 3, which also highly express cytolytic effectors (such as perforin, granzyme B, granzyme A, and FAS ligand) and specific chemokines (such as CCL5) and their receptors. However, iNKT2 and iNKT17 cells terminate at stage 2. Stage 2 iNKT cells have a high proliferation capability, and most iNKT cells at this stage emigrate to peripheral organs. Upon antigenic stimulation, iNKT1/2/17cells rapidly secrete a broad range of cytokines such as IFN-γ, IL-4, and IL-17, respectively, which mediates functions that link innate and acquired immunity in a broad spectrum of diseases, including infection, cancer, allergy, and autoimmunity (Lee et al., 2013). A core transcription factor network necessary for iNKT cell development and functional lineage differentiation has been described. However, how these transcriptional factors are integrated in posttranscriptional and epigenetic programs and what the detailed underlining molecular networks are remained to be explored.
MicroRNAs (miRNAs), a class of 21- to 25-nt single-stranded non-coding small RNAs are emerging as key regulators of numerous cellular processes that affect cell development, homeostasis, and disease development (Bartel, 2004). MiRNAs repress their target genes post-transcriptionally, and one miRNA can potentially target multiple genes depending on the cellular context. Deletion of miRNAs in T cells through targeting Dicer, the ribonuclease III enzyme required for the processing of mature and functional miRNAs, results in severe defects in iNKT cell development and function (Zhou et al., 2009). Using different approaches, various groups, including ours, have identified roles for specific microRNAs in iNKT cell regulations, such as miR-181a in overall iNKT development via regulating PI3K signaling and global metabolic fitness (Henao-Mejia et al., 2013); miR-150 in iNKT cell maturation through targeting c-Myb (Bezman et al., 2011; Zheng et al., 2012); miR183-96-182 control of iNKT17 function through targeting Foxo1 (Wang et al., 2019); and Lethal-7 (let-7) in iNKT effector function through regulating PLZF expression (Pobezinsky et al., 2015). Global miRNA expression patterns for human and mouse tissues show that miR-155 is prominently expressed in many hematopoietic cell types (Landgraf et al., 2007) and upregulation of miR-155 has been shown to be a consistent feature of the mammalian inflammatory response (Teng et al., 2008; Vigorito et al., 2013). By using genetically engineered mouse models of miR-155, and through identification of endogenous targets of miR-155, a wide spectrum of previous studies have identified the multiple roles of miR-155 in regulating varieties of immune cell differentiation and immune responses, including B cells, CD8 T cells, and CD4 T cells, as well as for T helper type 1 (Th1), Th2, Th17, and regulatory T cells (Seddiki et al., 2014). In addition, some studies suggest that miR-155 plays a role in iNKT cell development and function (Burocchi et al., 2015; Frias et al., 2018). However, the detailed regulatory role of miR-155 in iNKT cell functional lineage differentiation and the detailed molecular mechanisms involved remain largely unresolved.
In the present study, we confirmed the dynamic changes of miR-155 expression during thymic iNKT cell development and differentiation. To explore the potential role of miR-155 in iNKT cell development and differentiation, two distinct but complementary approaches were used. Germline miR-155 deletion in mice did not significantly interrupt iNKT cell development, which is largely consistent with previous report (Frias et al., 2018). However, T cell-specific overexpression of miR-155 resulted in defective iNKT cell development and differentiation, including compromised iNKT1 and iNKT17 cell differentiation, and in augmented IL-4-producing iNKT2 cell differentiation with promotion of secondary thymic innate CD8 T cell development. Mechanistically, miR-155 controlled iNKT cell development, suppressed iNKT1, and promoted iNKT2 differentiation with secondary enhancement of innate CD8 T cell development through targeting Jarid2 and Tab2; whereas miR-155 inhibited iNKT17 differentiation and iNKT survival through targeting Rictor. The multilayer regulation of nuclear factor kappa B (NF-κB) by miR-155 may be the cause of the self-limiting expression of miR-155 during iNKT thymic development. Therefore, the dynamic regulation of miR-155 expression is essential for normal iNKT cell thymic development, differentiation, and homeostasis.
Materials and Methods
Mice
Conventional miR-155 knockout (miR-155KO) mice in a C57BL/6 background and wild-type (WT) C57BL/6 mice were purchased from The Jackson Laboratory (Bar Harbor, ME, United States). Mice carrying the Rosa26 miR-155 knock-in (KI) allele (Jackson Laboratory) were bred with CD4Cre transgenic mice (Jackson Laboratory) to obtain mice expressing CD4Cre with one or two copies of the miR-155 KI allele. Mice with two copies of miR-155 KI allele, miR-155KI mice (CD4Cre+miR-155KI, miR-155KI), and the littermate CD4Cre–miR-155KI [wild-type (WT)] mice served as controls. Mice were 6- to 10-week-old, gender-matched, and housed in a specific pathogen-free barrier unit. Handling of mice and experimental procedures were in accordance with requirements of the Institutional Animal Care and Use Committee.
Flow Cytometry
Single-cell suspensions were washed twice with staining buffer (PBS, 2% FBS) and incubated with Fc block (clone 2.4G2). Cells (2 × 10⁶ per staining well) were stained with antimouse PBS57-loaded CD1d-tetramer and PBS57-unloaded CD1d-tetramer (provided by the NIH Tetramer Core Facility). The following conjugated mAbs were used: TCRβ (H57-597), CD24 (30-F1), CD44 (IM7), CD122 (5H4), CD69 (H1.2F3), NK1.1 (PK136), IL17RB (MUNC33), Slamf1 (TC15-12F12.2), Slamf6 (330-AJ), PLZF (9E12), RORγt (B2D), T-bet (eBio17B7), GATA3 (TWAJ), CD1d (1B1), IL-4 (11B11), IFN-γ (XMG1.2), IL-17a (eBio17B7), CD45.1 (A20), CD45.2 (104), CD4 (GK1.5), CD8 (53-6.7), CXCR3 (CXCR3-173), and Eomes (Dam11mag). All mAbs were purchased from eBioscience, Biolegend, or TOBON. Apoptosis assays were carried out by staining with Annexin V (eBioscience), according to manufacturer’s instructions. Cell surface staining was performed with staining buffer. Intranuclear staining for GZMA, PLZF, T-bet, RORγt, Bcl-2, and Ki-67 was performed with eBioscience Fixation/permeabilization buffer. The flow cytometry assay was performed through BD FACSCelesta, and data were analyzed using FlowJo V10.2 software. Gating strategy: after gating on lymphocyte, doublets were excluded by using forward scatter (FSC) and side scatter (SSC), mouse iNKT cells were then identified as TCRβ+ CD1d-tetramer+ (Supplementary Figures 1A,B).
In vitro Functional Assays
Thymocytes and spleen cells total 4 × 10⁶ from mice were cultured in RPMI-1640 Medium (Sigma, United States) supplemented with 10% FBS, 100 units/ml penicillin, 100 units/ml streptomycin, 25 mM HEPES, 1 mM sodium pyruvate, 1 × non-essential amino acids, 2 mM L-glutamine, and 50 μM 2-mercaptoethanol, in the presence of phorbol 12-myristate 13-acetate (PMA) (50 ng/ml) and ionomycin (1 μM) for a total of 4 hours at 37°C. Brefeldin A was then added in the last 2.5 h at a final concentration of 1 μM. Anti-IFN-γ, anti-IL-4, and anti-IL-17 were detected by intracellular staining and flow cytometry.
Bone Marrow Chimera Transfer Experiments
To generate bone marrow chimeras, 7- to 8-week-old B6.SJL-recipient mice (CD45.1+CD45.2+) were lethally irradiated with 900 rad. Donor bone marrows were harvested from age- and sex-matched SJL (CD45.1+) mice and miR-155KI mice (CD45.2+) by flushing bones with a syringe containing sterile basal tissue culture medium (RPMI 1640 with 10% FBS). After erythrocyte lysis, mature T cells (CD3+) were depleted from bone marrow from each donor mouse by biotin-conjugated antimouse CD3 (BD Biosciences, clone17A2) mAbs and antibiotin magnetic beads (BD Biosciences) using Magni SortTM. Over 90% of mature T cell depletion was confirmed by flow cytometry. CD45.1+ SJL and CD45.2+ miR-155KI or WT control bone marrows were mixed at a 1:1 ratio, and total of 10 × 106 cells per mouse (in a volume of 100 μl) were then injected into the irradiated recipient mice by tail vein injection. The chimeras were analyzed 8 weeks after reconstitution.
iNKT Cells Enrichment and Sorting
Total thymocytes and spleen cells were first prepared at a concentration of 1 × 10⁷/100 μl in staing buffer (PBS, 2% FBS) stained with anti-CD8 biotin Ab (TONBO, clone 53-6.6) for thymocytes or anti-CD8 biotin Ab and anti-B220 biotin Ab (eBioscience, clone RA3-6B2) for spleen cells. CD8+ T cells and B220+ cells were then depleted with antibiotin beads (MagniSortTM) using auto-MACS (Miltenyi Biotec). Negatively selected cells were then stained with anti-TCR-β, anti-CD1d tetramers, anti-NK1.1, and anti-CD44 Abs. Total or different stages of iNKT cells were then sorted by BD FACS Aria II.
RT-qPCR Analysis
iNKT cells from WT controls and miR-155KI mice were sorted, and total RNA was extracted by using the EXIQON isolation. RNA was reverse transcribed using the PrimeScriptTM RT reagent kit, and RT-qPCR was performed on an Applied Biosystems 7900 Real-Time PCR system with the following primer pairs: Jarid2 (Forward: 5′-GACACCAAACCCAATCACCAC-3′ and Reverse: 5′-GTTCAACCTGCCACTGACCTT-3′); Rictor (Forward: 5′-TGAGTACCGTTCTTCTCAC-3′ and Reverse: 5′-TGCAATGGAGGG CGCTTTA-3′); Tab2 (Forward: 5′-GGATAGAATAAGCGAAGCCCGGAA-3′ and Reverse: 5′-CTC TTTGAAGCCGTTCCATCCT-3′). Expression levels of miR-155 were normalized with snoRNU202, and expression levels of Jarid2, Rictor, and Tab2 were normalized with L32. Fold change was calculated using the 2−ΔΔCT method.
RNA-Seq
RNA concentration was determined using the Qubit RNA broad range assay in the Qubit Fluorometer (Invitrogen), and RNA integrity was determined using the Eukaryote Total RNA. Nano Series II ChIP on a 2100 Bioanalyzer (Agilent). Three independent biological replicates were pooled for RNA-seq. RNA-seq libraries were prepared using 4 μg of total RNA with the TruSeq RNA sample prep kit following manufacturer’s protocol (Illumina).
Western Blot and ELISA
Cell lysates were prepared by lysis in RRAP buffer containing protease inhibitor and Western blots were performed using standard methods. Image J1 was used to quantify protein expression levels from digital images of Western blots. IL-4 protein concentration in mouse blood serum was measured using the IL-4 mouse ELISA Ready-Set-Go! Kit (eBioscience) following the manufacturer’s instructions.
Statistical Significance
GraphPad Prism 8.0 was used for statistical analysis (unpaired, two-tailed, t-test with 95% confidence interval). A P-value < 0.05 was considered statistically significant. The processing of RNA-Seq data was performed with R version 3.6.02.
Results
Dynastic Expression of miR-155 During iNKT Cell Development
To gain insight into the role of miR-155 in the development of iNKT cells, we first tested miR-155 expression in sorted thymic iNKT cells that were at different developmental stages. Thymocytes from normal C57BL/6 mice were stained with Abs against TCR-β, CD1d-tetramer, CD44, and NK1.1 to identify and sort stage 1 (CD44loNK1.1–), stage 2 (CD44hiNK1.1–), and stage 3 (CD44hiNK1.1+) iNKT cells. MiR-155 expression was then detected by TaqMan real-time PCR. MiR-155 was detected in all developmental stages of iNKT cells, and expression was dramatically decreased during iNKT cell development, almost to the lowest level at the terminal developmental stage 3 (Figure 1A). These findings indicated that miR-155 is expressed in a stage-specific pattern in iNKT cells and that miR-155 expression is significantly repressed in mature iNKT cells.
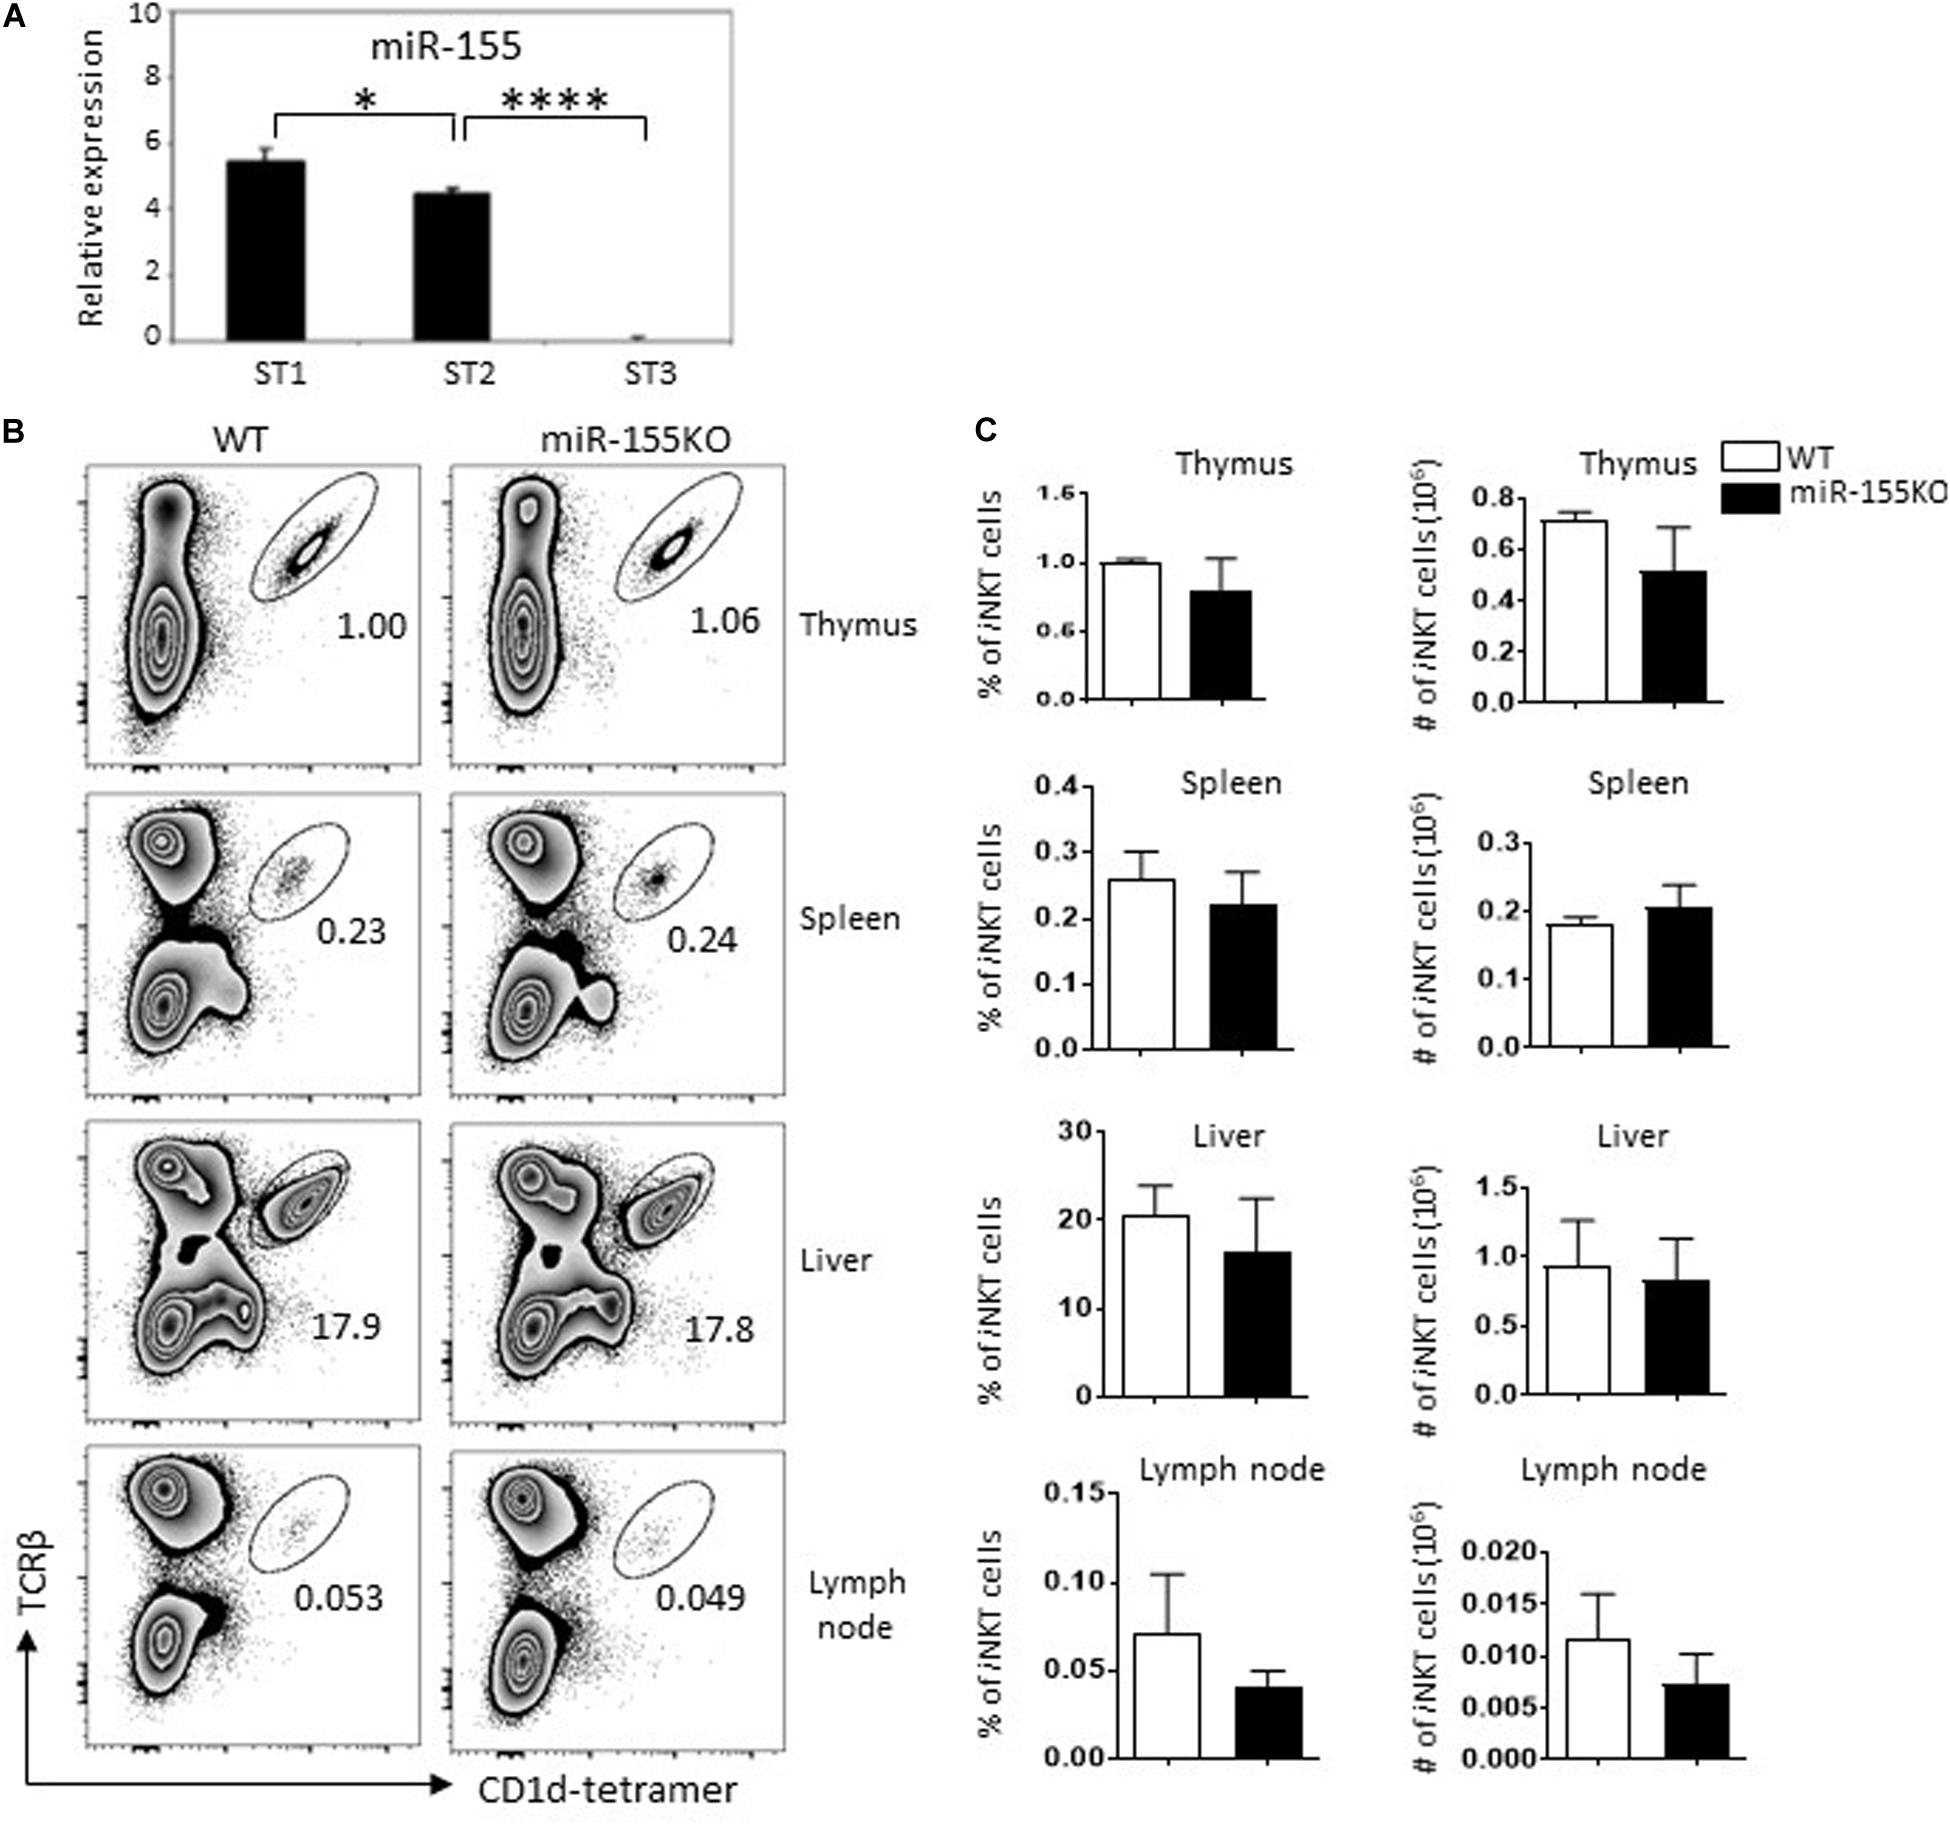
Figure 1. Dynastic expression of miR-155 during iNKT cell development. (A) Expression of miR-155 in different developmental stages of thymic iNKT cells from C57BL/6 mice. Total RNA was obtained from different stages of WT iNKT cells, and miR-155 expression was measured by RT-qPCR (snoRNU202 as quantitative control for normalization, three mice for each group). (B) Representative flow cytometry plots showing iNKT cells (TCRβ+ CD1d-tetramer+) in thymus, spleen, lymph nodes, and liver of miR-155KO mice and WT controls. Numbers adjacent to outlined areas indicate percentage of indicated populations. (C) Bar graphs showing frequencies (left) and the absolute numbers (right) of iNKT cells in indicated organs of miR-155KO and WT controls. Data are from two independent experiments, 4–6 mice for each group, data were analyzed by unpaired t-test. *P < 0.05, ****P < 0.0001.
MiR-155 Deletion Does Not Affect iNKT Cell Development
To assess the role of miR-155 in iNKT cell development, we performed a loss-of-function study using conventional miR-155 knockout (miR-155KO) mice. Nevertheless, we did not observe a significant iNKT cell developmental defect in thymus and peripheral lymph organs in mutant mice. The frequencies and absolute numbers of iNKT cells in thymus, spleen, lymph nodes, and liver peripheral organs were comparable between miR-155KO and WT mice (Figures 1B,C). iNKT cells lacking miR-155 also showed a normal developmental stage (Supplementary Figure 1C), which was consistent with a previous study (Frias et al., 2018), suggesting that early iNKT cell development is not critically dependent on miR-155 expression. Given that miRNA does not exhibit transcriptional activity itself, it acts as a transcriptional inhibitor during the regulation of cellular development. It is possible that the relieved inhibition of target(s) of interested from miR-155 deletion cells in the earliest stages of iNKT cells may not be enough for an obvious interruption of iNKT cell development.
MiR-155 Overexpression Interrupts iNKT Cell Development
The expression of miR-155 was gradually downregulated during iNKT cell differentiation (Figure 1A). To gain further insight into the dynamic regulation of miR-155 during iNKT cell development, a gain-of-function gene targeting approach was used. To generate mice with T cell-specific overexpression of miR-155, mice carrying the Rosa26 miR-155 KI allele were bred with CD4Cre transgenic mice to obtain mice expressing CD4Cre with one or two copies of the miR-155 KI allele. Mice with two copies of the miR-155 KI allele, miR-155KI (CD4Cre+miR-155KI, miR-155KI), and WT littermate control (CD4Cre–miR-155KI, WT) were used in experiments without specific indication (Supplementary Figures 2A–C). To evaluate the magnitude of miR-155 upregulation, both thymus and spleen TCRβ + T cells were sorted, and miR-155 expression was detected and compared with miR-155 KI and littermate WT mice with RT-PCR. As shown in Supplementary Figure 2C, substantial upregulation of miR-155 was observed at about six and three times of WT control T cells in thymus and spleen, respectively.
To assess the role of miR-155 overexpression in iNKT cell development, we first examined the frequency and number of iNKT cells in different immune organs including thymus, spleen, liver, and lymph nodes of cells from 6- to 8-week-old miR-155KI and WT control mice by flow cytometry. As shown in Figures 2A,B, miR-155KI mice exhibited decreased frequencies and absolute numbers of iNKT cells compared with WT mice in thymus, spleen, and liver but not in lymph node. Cell surface markers distinguishing the stages of thymic iNKT cell development are well characterized. The frequencies of stages 0, 1, and 2 iNKT cells were relatively higher in miR-155KI mice and were accompanied with a reduced frequency of stage 3 iNKT cells. However, the absolute numbers of stages 0, 1, and 2 cells in miR-155KI mice were comparable with those in WT mice, whereas stage 3 iNKT cells were dramatically reduced in miR-155KI mice (Figures 2C,D). These data indicate that overexpressing miR-155 impaired iNKT cell development, especially for terminal maturation stage 3 (or iNKT1) cells.
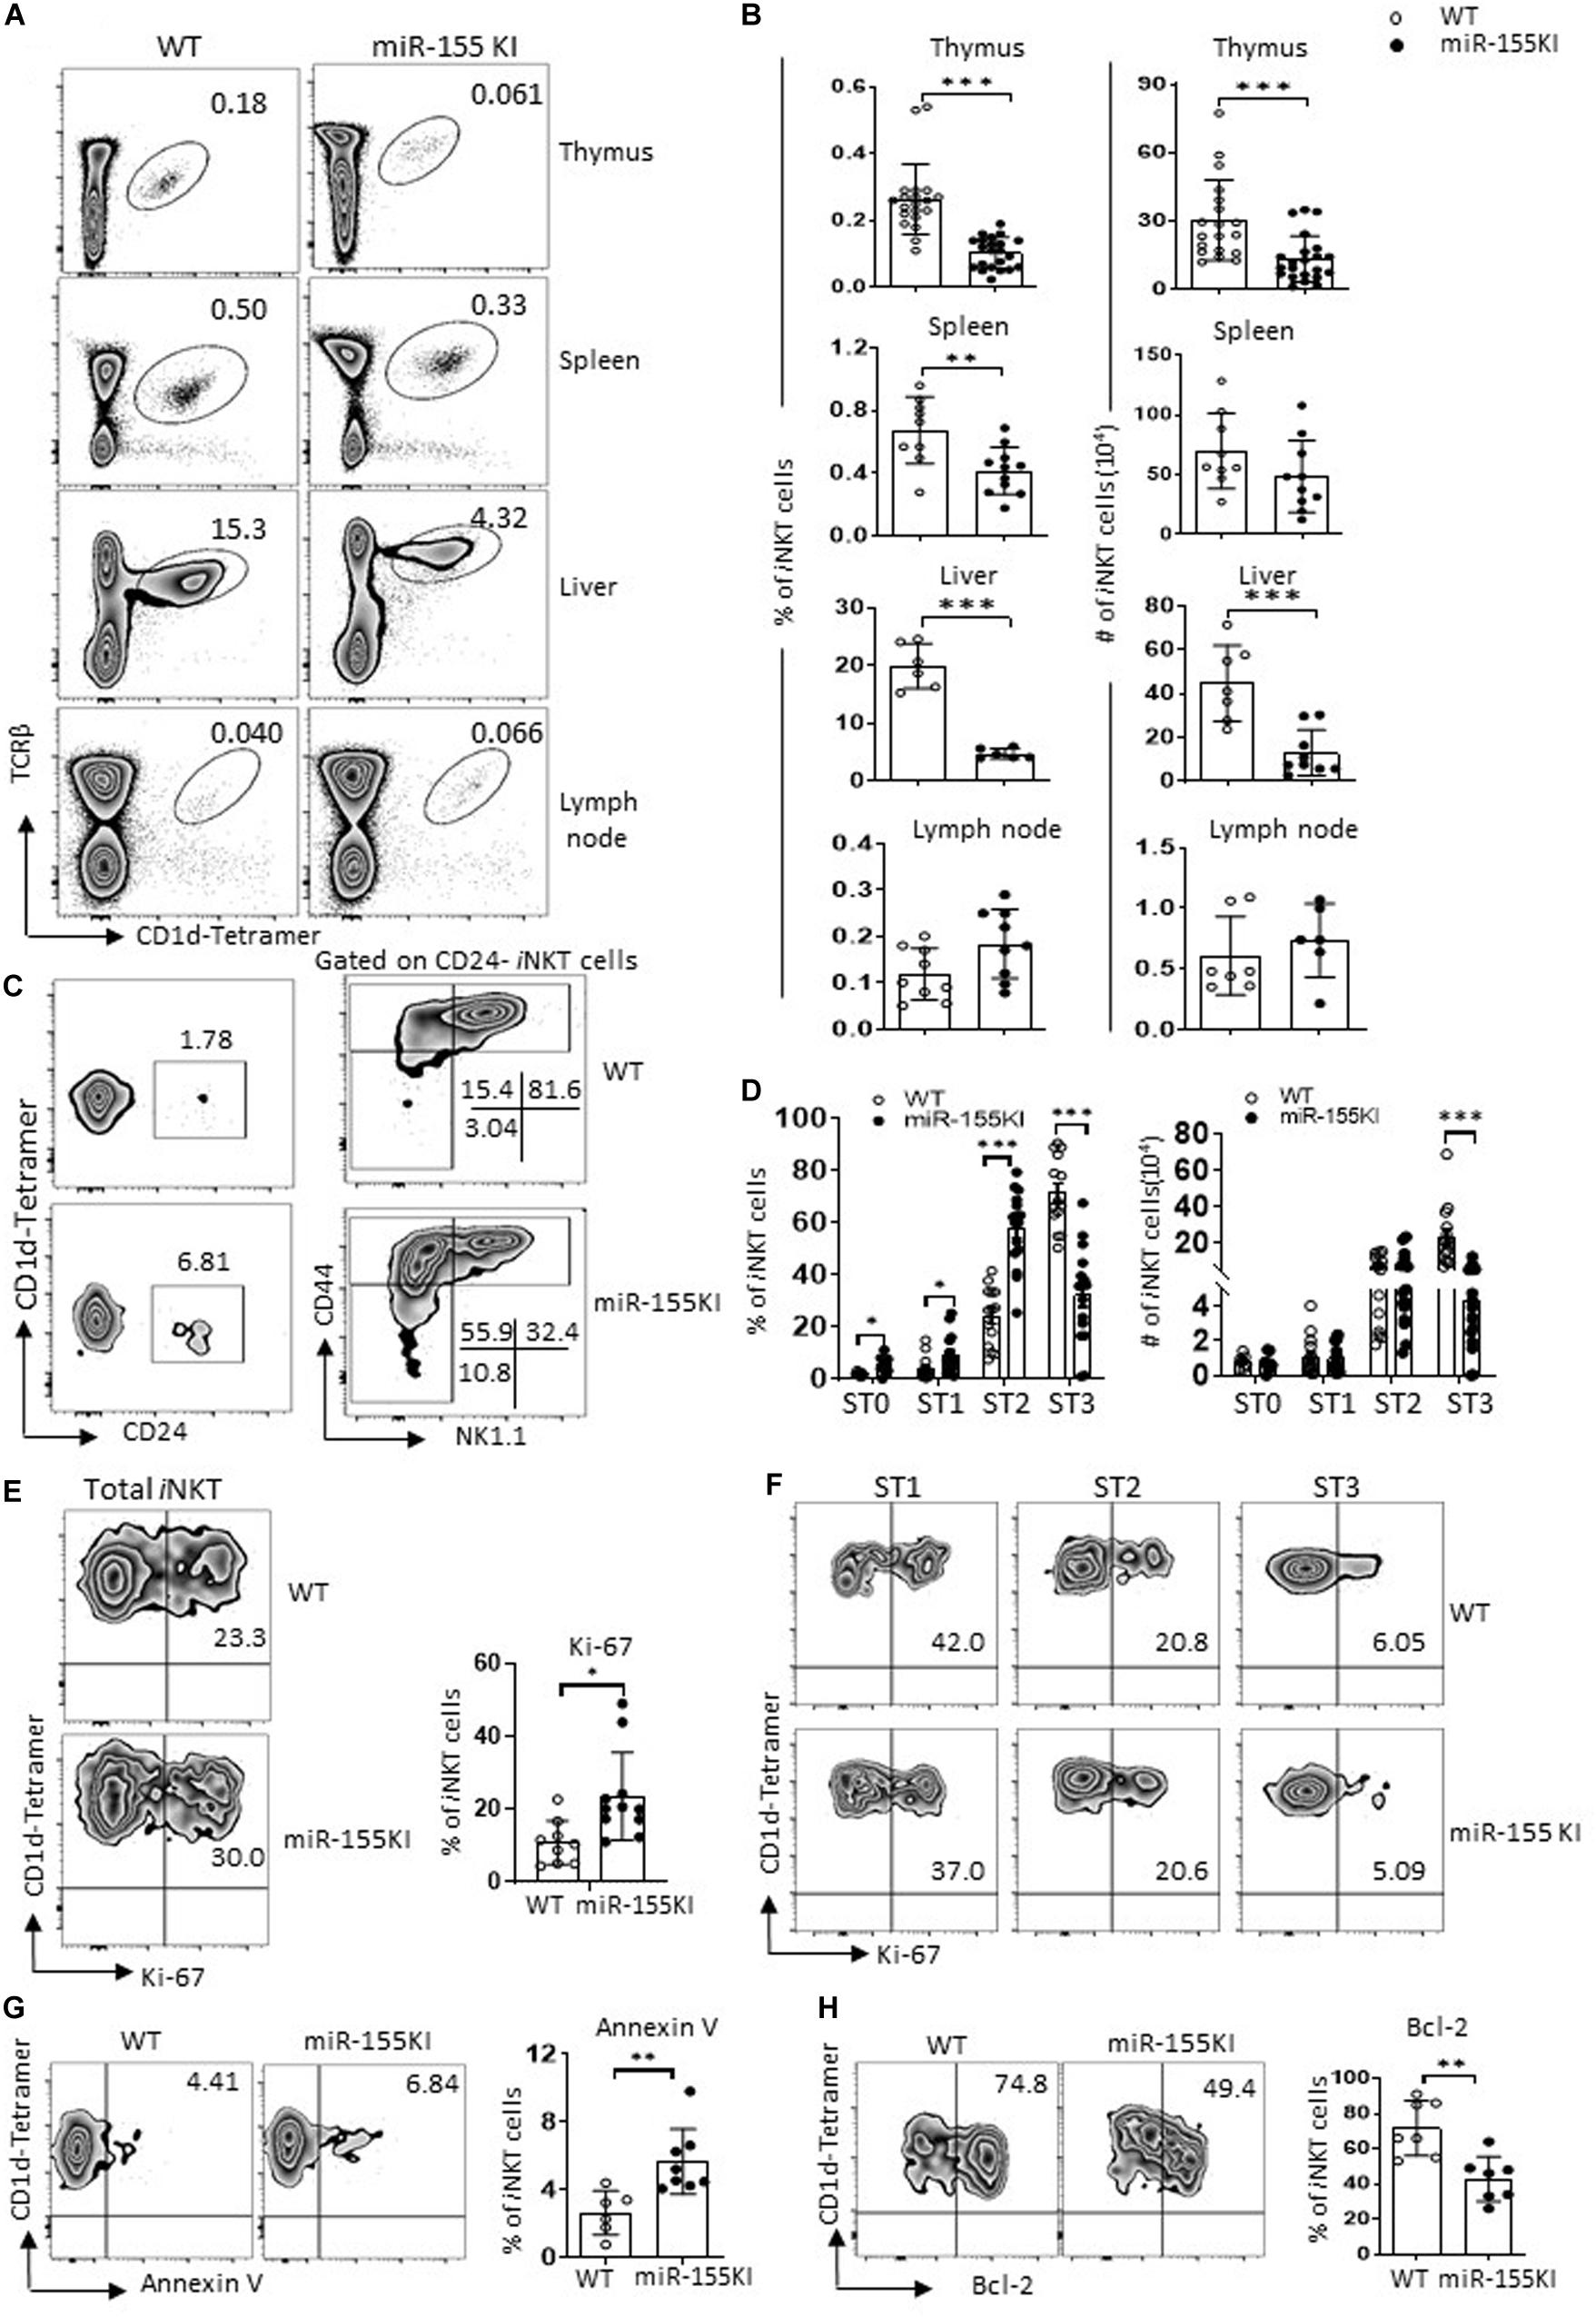
Figure 2. MiR-155 overexpression interrupts iNKT cell development. (A) Representative flow cytometry plots depicting iNKT cells in thymus, spleen, liver, and lymph nodes of WT controls and miR-155KI mice. Numbers adjacent to outlined areas indicate percentage of indicated populations. (B) Bar graphs showing frequencies (left) and absolute numbers (right) of iNKT cells in indicated organs of miR-155KI and WT controls. (C) Representative flow cytometry plots depicting expression of CD24, CD44, and NK1.1 on iNKT cells: stage 0 (ST0, CD24+), stage 1 (ST1, CD24– CD44loNK1.1–), stage 2 (ST2, CD44hiNK1.1–), and stage 3 (ST3, CD44hiNK1.1+) in WT controls and miR-155KI mice. (D) Bar graphs showing frequencies (left) and absolute numbers (right) of iNKT cells in different developmental stages (ST0, ST1, ST2, and ST3) of miR-155KI and WT controls. (E) Representative flow cytometry plots depicting expression of Ki-67 in thymic iNKT cells (left). Bar graph showing frequency of Ki-67+ iNKT cells from miR-155KI and WT controls (right). (F) Representative flow cytometry plots depicting expression of Ki-67 in different stages (ST1, ST2, and ST3) of iNKT cells from miR-155KI and WT controls. (G,H) Representative flow cytometry plots depicting expression of Annexin V (G) and Bcl-2 (H) in thymus iNKT cells (left). Bar graphs showing frequency of Annexin V+ iNKT cells and Bcl-2+ iNKT cells from miR-155KI and WT controls (right). Data are from at least three independent experiments. Each mouse is represented as one dot. Data were analyzed by unpaired t-test. *P < 0.05, **P < 0.01, ***P < 0.001.
To test whether cell homeostasis contributes to iNKT cell developmental defects in miR-155KI mice, we examined the rate of Ki-67 expression to measure iNKT cell proliferation capability. Compared with WT controls, miR-155KI iNKT cells exhibited a higher proliferating status (Figure 2E). A previous study indicated that stages 1/2 iNKT cells proliferate briskly, while stage 3 mature iNKT cells are relatively quiescent (Gapin, 2016). To dissect whether increased Ki-67 expression in overall iNKT cells from miR-155KI mice is merely reflection of their defective maturation phenotype, we then further analyzed Ki-67 expression in different developmental stages. As shown in Figure 2F, the expression of Ki-67 was comparable within the same stages of iNKT cells in miR-155KI and WT mice. These results indicate the largely dispensable role of miR-155 in the proliferation of iNKT cells. However, the staining of fresh thymocytes with the apoptotic marker Annexin V revealed significantly higher levels of apoptotic iNKT cells in miR-155KI mice (Figure 2G). Consistently, we found the antiapoptosis marker Bcl-2 was significantly reduced in miR-155KI iNKT cells compared with WT (Figure 2H). Taken together, these data indicate that miR-155 overexpression impairs survival of iNKT cells, likely contributing to the defect of the overall iNKT cell development.
MiR-155 Overexpression Interrupts iNKT1 Cell Differentiation
iNKT cells at different stages are functionally distinct, where the stage 2 iNKT pool contains well-differentiated iNKT2/17, and immature pre-iNKT1 cells, while stage 3 pools contain largely terminally differentiated iNKT1 cells (Lee et al., 2013). Considering that stage 3 iNKT cells were severely reduced in miR-155KI mice (Figures 2C,D), we therefore analyzed the iNKT1 cell signature T-bet (Tbx21). Normally, T-bet is initially expressed in stage 1/2 and is maximally expressed in stage 3, while PLZF is gradually downregulated along this developmental process. Here, we found that miR-155KI iNKT cells failed to upregulate T-bet at stage 2, resulting in less PLZFhi/int T-bet+ iNKT cells from stage 2 progressing to stage 3 (Figures 3A,B). Therefore, stage 2 iNKT cells from miR-155KI mice contained a smaller proportion of immature iNKT1 cells compared with WT mice (Figure 3B). Consistent with this notion, we found dramatically decreased numbers of other iNKT maturation markers, including CD122 (Il2rb), CD69 (Cd69), and NKG2D (Klrk1) in miR-155KI thymic iNKT cells more specifically, in the NK1.1– counterpart (Figure 3C). In reflection of the thymic iNKT cell maturation defect, peripheral iNKT cells in miR-155KI mice also showed a relatively immature phenotype as judged by reduced NK1.1 expression (Supplementary Figure 3). The maturation defective phenotype observed in miR-155KI iNKT prompted us to further analyze the expression of iNKT cell cytotoxic markers, which were raised from iNKT1 cells. We found that the expression of CCL5 (Ccl5) and GZMA (Gzma) were significantly reduced in the miR-155KI iNKT NK1.1– counterpart, suggesting the downregulated cytotoxic capability of iNKT cells from miR-155KI mice (Figure 3C).
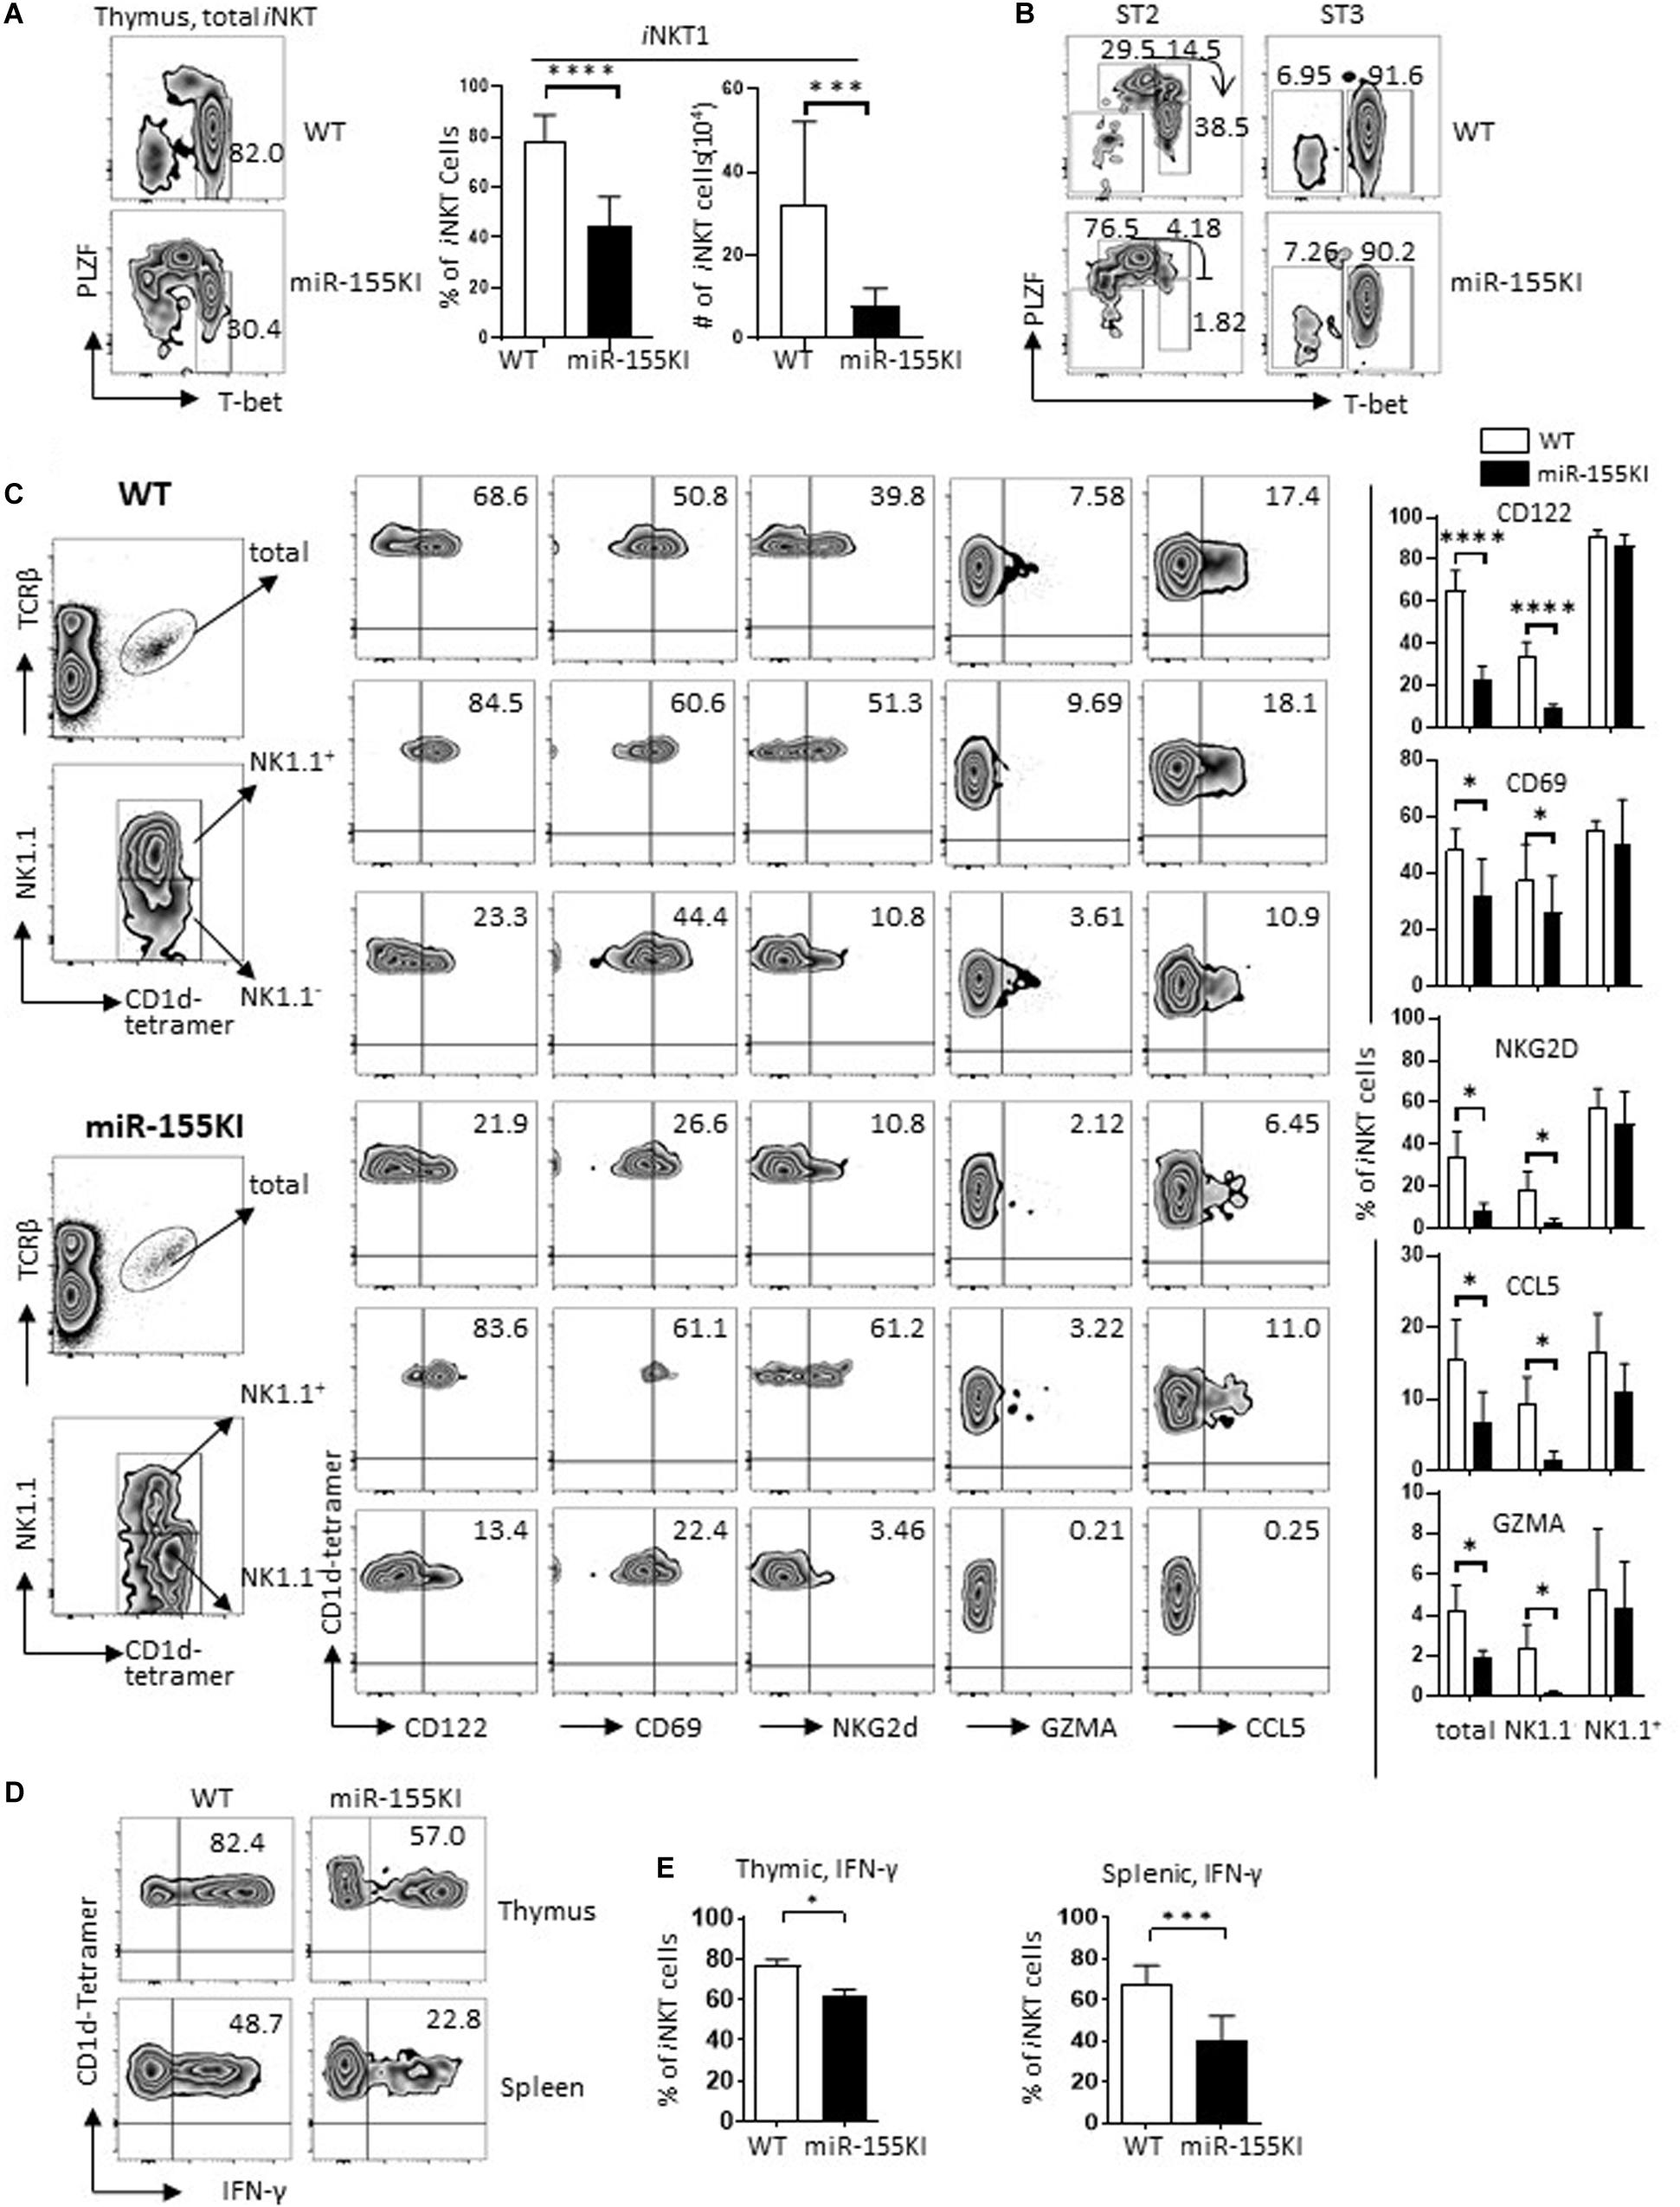
Figure 3. miR-155 overexpression interrupts iNKT1 cell differentiation. (A) Representative flow cytometry plots depicting iNKT1 (PLZFloTbet+) gated on total thymic iNKT cells. Bar graphs showing frequency (left) and absolute number (right) of iNKT1 cells from miR-155KI and WT controls. (B) Representative flow cytometry plots depicting iNKT1 (PLZFloTbet+) gated on stage 2 (ST2) and stage 3 (ST3) iNKT cells from miR-155KI mice and WT controls. (C) Representative flow cytometric plots depicting CD122, CD69, NKG2D, GZMA, and CCL5 expression in total thymic iNKT cells (top panel), NK1.1+ iNKT cells (middle panel), and NK1.1-iNKT cells (bottom panel) from miR-155KI mice (bottom) and WT controls (top). Bar graphs showing frequencies of CD122, CD69, NKG2D, GZMA, and CCL5 expression in indicated iNKT subsets from miR-155KI mice and WT controls. (D) Representative flow cytometry plots depicting IFN-γ production in thymic iNKT cells (top) and splenic iNKT cells (bottom) from miR-155KI mice and WT controls. (E) Bar graphs showing frequency of IFN-γ producing iNKT cells in thymus (left) and spleen (right) from miR-155KI and WT controls. Data are from at least five independent experiments. Data were analyzed by unpaired t-test. *P < 0.05, **P < 0.01, ***P < 0.001, ****P < 0.001.
To characterize the function of iNKT cells, total thymocytes and splenocytes from miR-155KI and WT mice were stimulated with PMA/Ionomycin for 4 hours in vitro. Consistent with their differentiation phenotype, IFN-γ production was significantly reduced in both thymic and splenic iNKT cells from miR-155KI mice (Figures 3D,E). Overall, iNKT cells with miR-155 overexpression showed remarkably suppressed iNKT1 cell differentiation and maturation. Therefore, the downregulation of miR-155 during thymic iNKT cell development is essential for iNKT1 cell differentiation and maturation.
MiR-155 Overexpression Promotes iNKT2 Cell Differentiation
iNKT2 cells (PLZFhi) are typically located in stages 1/2 iNKT cell pool. Compared with WT, thymic iNKT cells from miR-155KI mice exhibited a significant increased PLZF level (Figure 4A). However, the increased level of PLZF could merely reflect an increased frequency of iNKT cells stuck at stages 1/2 (Figures 2C,D). To address this possibility, we evaluated PLZF expression at different developmental stages of iNKT cells. We found that PLZF was increased in all individual developmental stages (Figure 4B), ruling out the possibility that the increased PLZF level could be secondary to the accumulation of cells in stages 1/2, indicating that miR-155 overexpression promotes PLZF expression during iNKT cell development. Consistently, other iNKT2 cell signatures including GATA3 (Gata3) and IL17RB (Il17rb) (Lee et al., 2013; Kwon and Lee, 2017) were also increased in miR-155KI iNKT cells, especially in the stage 1/2 (NK1.1–) iNKT cell pool (Figures 4C,D). Given that iNKT2 cells in steady status have the ability to produce copious amounts of IL-4 (Lee et al., 2013), we then evaluated serum IL-4 level via ELISA. As expected, serum IL-4 levels was increased in miR-155KI mice (Figure 4E). In addition, upon PMA/Ionocymin in vitro stimulation, IL-4 production from thymic iNKT cells was significantly increased in miR-155KI mice compared with WT controls. However, IL-4 production was similar in splenic iNKT cells (Figures 4F,G). Even though a majority of iNKT2 cells produce IL-4, mature iNKT1 cells have the ability to produce IL-4 and IFN-γ simultaneously, and the comparable IL-4 production could be due to the compensatory result from dramatically increased iNKT2 and reduced iNKT1 cells in the miR-155KI spleen. In support of this possibility, we found that splenic iNKT cells producing only IL-4 were increased, while IL-4 and IFN-γ double producing splenic iNKT cells were reduced in miR-155KI, even though the overall IL-4 producing splenic iNKT cells were comparable between miR-155KI and WT mice (Figure 4H). The iNKT cell maturation defect that was identified in PLZF transgenic mice closely resembles the defective iNKT1 but elevated iNKT2 differentiation phenotypes that we observed in our miR-155KI mice (Savage et al., 2008). Therefore, our data indicate that miR-155 overexpression elevates PLZF expression, promoting iNKT2 differentiation but blocking iNKT1 differentiation and maturation.
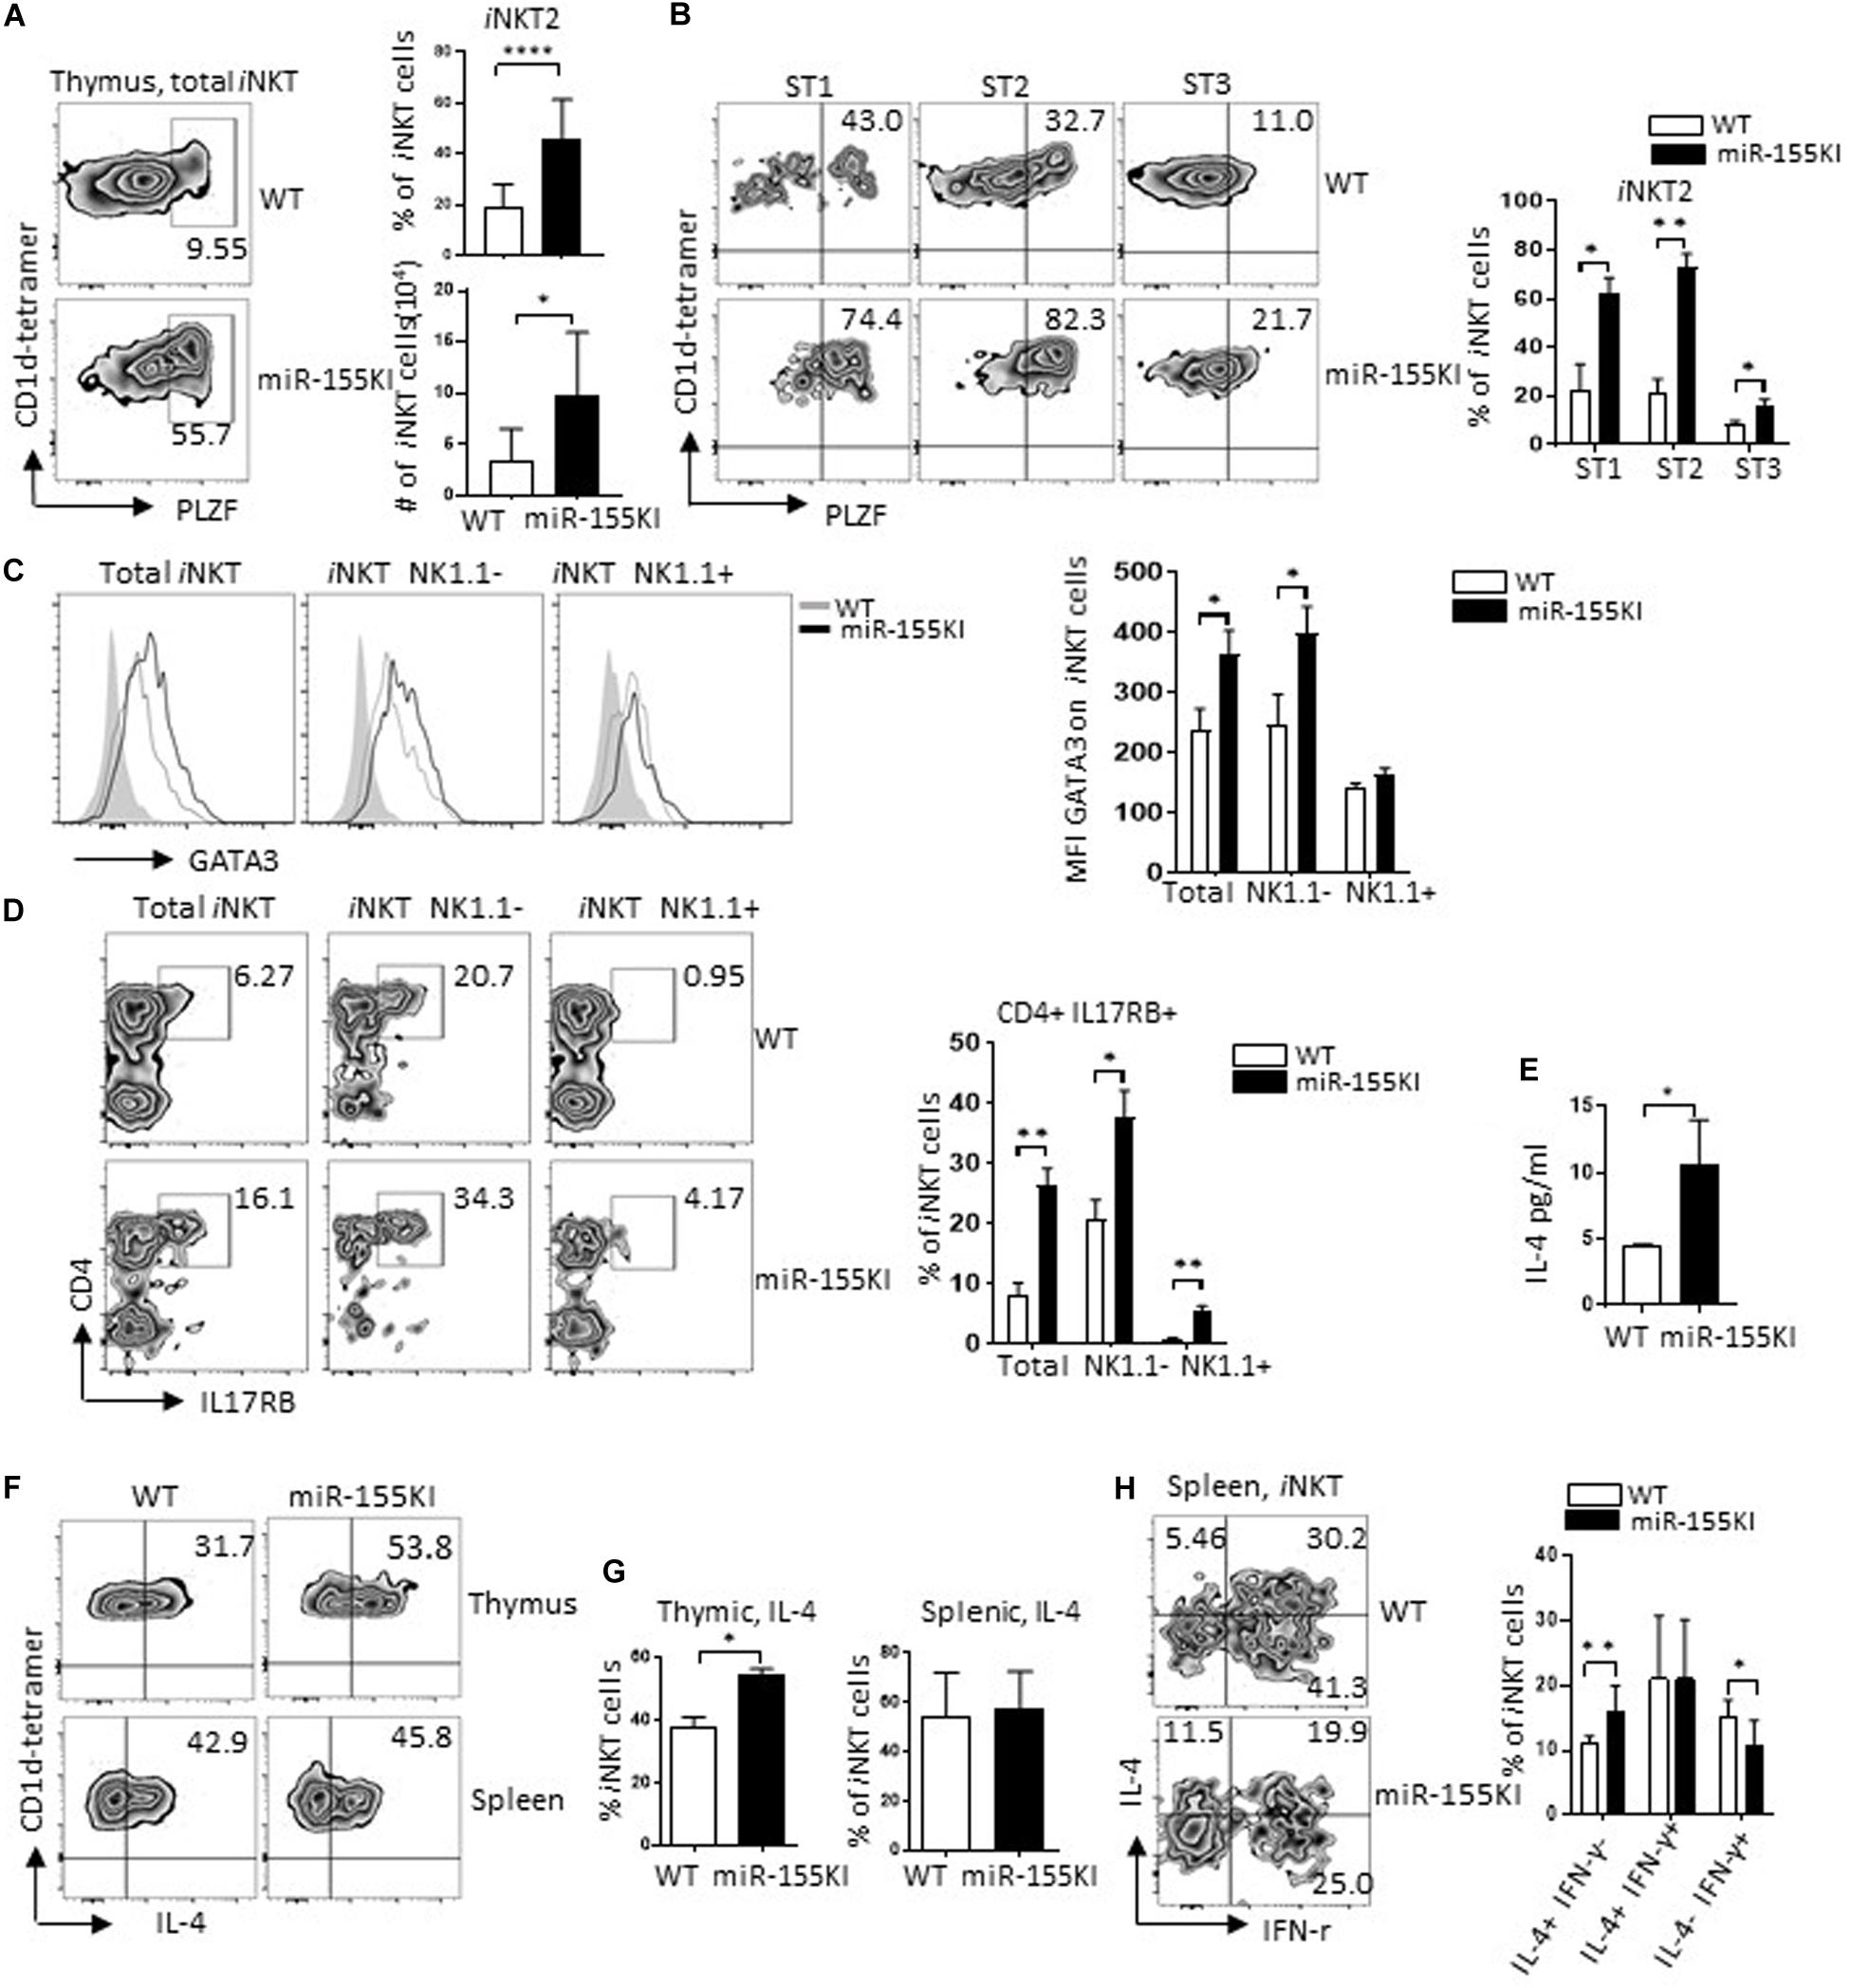
Figure 4. MiR-155 overexpression promotes iNKT2 cell differentiation. (A) Representative flow cytometry plots depicting iNKT2 (PLZFhi) in total thymic iNKT cells from miR-155KI and WT mice (left). Bar graphs showing frequency and absolute number of iNKT2 cells from miR-155KI and WT mice (right). (B) Representative flow cytometry plots depicting PLZFhi iNKT cells (iNKT2) in different developmental stages of iNKT cell development from miR-155KI and WT mice (left). Bar graphs showing frequency of PLZFhi iNKT cells (iNKT2) in stage 1 (ST1), stage 2 (ST2), and stage 3 (ST3) of iNKT cells from miR-155KI mice and WT controls (right). (C) Representative flow histogram depicting of GATA3 expression in total iNKT cells, NK1.1–, and NK1.1+ iNKT cells from miR-155KI (black line without shading) and WT (gray line without shading) mice (left). Bar graph showing mean fluorescence intensity (MFI) of GATA3 in indicated iNKT subsets from miR-155KI and WT mice. (D) Representative flow cytometry plots depicting CD4+ IL17RB+ iNKT cells, total iNKT cells, NK1.1– and NK1.1+ iNKT cells from miR-155KI and WT mice (left). Bar graph showing frequency of CD4+ IL17RB+ iNKT cells in indicated iNKT subsets from miR-155KI and WT mice. (E) Bar graph showing IL-4 secretion in serum in miR-155KI and WT mice from one of two experiments and three mice from each group. (F) Representative flow cytometry plots depicting IL-4 production in thymic iNKT cells (top) and splenic iNKT cells (bottom) from miR-155KI and WT mice. (G) Bar graph shows frequency of IL-4 producing iNKT cells in thymus (left) and spleen (right) from miR-155KI and WT mice. (H) Representative flow cytometry plots depicting IL-4 and IFN-γ production in splenic iNKT cells from miR-155KI and WT mice. Bar graph shows frequencies of IL4+ IFN-γ–, IL-4+ IFN-γ+, and IL4-IFN-γ+ splenic iNKT cells from miR-155KI and WT mice. Data were from five independent experiments and analyzed by unpaired t-test. *P < 0.05, **P < 0.01, ****P < 0.0001.
MiR-155 Overexpression Interrupts iNKT17 Cell Differentiation
iNKT17 is a distinct subset of iNKT cells characterized by the expression of transcription factor RORγt (Rorc) (Constantinides and Bendelac, 2013). These cells differ from their classical iNKT1/2 counterparts by undergoing an alternative thymic pathway. The developmental stage at which iNKT17 cells and iNKT1/2 cells drift apart seems to be as early as CD4+CD8+ DP stage 0 (Michel et al., 2008). Here, we found that iNKT17 cells were dramatically reduced in miR-155KI mice, which can be observed at as early as stage 1 (Figures 5A,B). We then evaluated iNKT17 cells in lymph nodes due to the dramatic enrichment of iNKT17 cells in lymph node tissues. Consistent with the thymic iNKT17 phenotype, miR-155KI mice showed diminished iNKT17 cell frequencies in lymph nodes (Figure 5C). In support of the diminished thymus and peripheral iNKT17 phenotypes, IL-17 production induced by in vitro PMA/ionomycin stimulation was reduced significantly in both thymus and spleen iNKT cells from miR-155KI cells compared with WT (Figures 5D,E). These data indicate that overexpression of miR-155 interrupts iNKT17 lineage differentiation and IL-17 production.
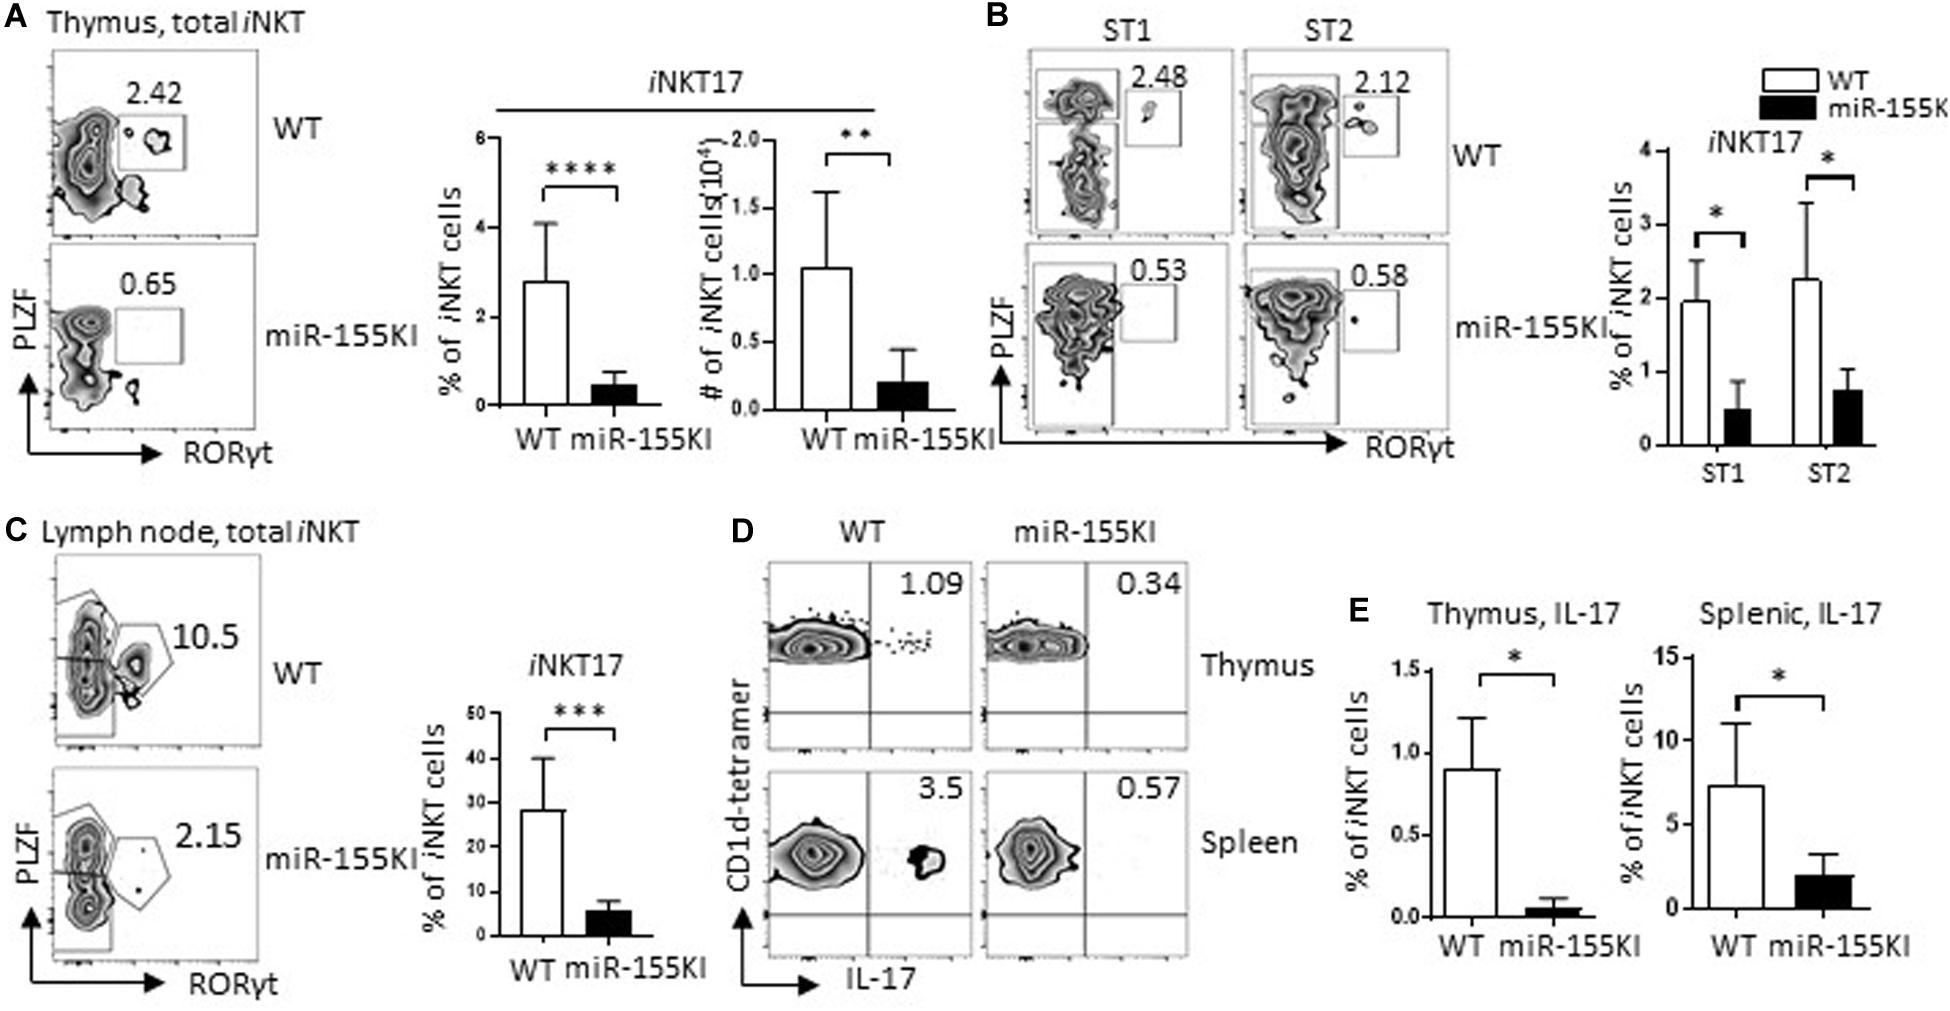
Figure 5. MiR-155 overexpression interrupts iNKT17 cell differentiation. (A) Representative flow cytometry plots depicting iNKT17 (PLZFint RORγt+) in total iNKT cells from miR-155KI and WT mice (left). Bar graphs showing frequency and absolute number of iNKT17 cells from miR-155KI and WT mice (right). (B) Representative flow cytometry plots depicting iNKT17 cells in stages 1 (ST1) and 2 (ST2) of iNKT cells from miR-155KI and WT mice (left). Bar graph showing frequency of iNKT17 cells in ST1 and ST2 iNKT cells from miR-155KI and WT mice (right). (C) Representative flow cytometry plots depicting iNKT17 (PLZFint RORγt+) in lymph node iNKT cells from miR-155KI and WT mice (left). Bar graph showing frequency of iNKT17 cells in lymph node from miR-155KI and WT mice (right). (D) Representative flow cytometry plots depicting IL-17 production in thymic iNKT cells (top) and splenic iNKT cells (bottom) from miR-155KI and WT mice. (E) Bar graphs showing frequency of IL-17 producing iNKT cells in thymus (left) and spleen (right) from miR-155KI and WT mice. Data are from at least three independent experiments. Data were analyzed by unpaired t-test. *P < 0.05, **P < 0.01, ***P < 0.001, ****P < 0.0001.
MiR-155 Overexpression Regulates Innate CD8 T Cell Development
The CD4Cre-mediated gene mutation occurred not only in iNKT cells and precursors but also in conventional T cells. To evaluate the role of miR-155 overexpression in conventional T cell development, we checked on the gross conventional T cell phenotypes with flow cytometry. Interestingly, miR-155KI mice showed increased frequencies and numbers of both CD8 single positive (CD8 SP) and CD4 SP T cells but decreased frequencies and numbers of DP T cells (Supplementary Figure 4A). Further analysis revealed increased regulatory T cell (Treg) frequencies in thymus CD4 SP T cells from miR-155KI mice compared with WT (Supplementary Figure 4B), which is consistent with a previous report (Kohlhaas et al., 2009). More interestingly, thymic CD8 SP T cells from miR-155KI mice contained significantly increased innate CD8 T cells, characterized by a relative high expression of CD44, CD122, CXCR3, and Eomes (Figure 6A and Supplementary Figure 4A), and dramatically higher IFN-γ production upon PMA/ionocymin stimulation (Figure 6B). However, conventional CD8 and innate CD8 T cell phenotypes were only observed in thymus and not in spleen T cells from miR-155 KI mice (Figures 6C,D and Supplementary Figure 4C). Considering that innate CD8 T cells are barely detectable in WT C57BL/6 thymus, their presence in miR-155KI could be attributed to the expansion of small numbers of IL-4-producing iNKT2 cells observed in miR-155KI mice.
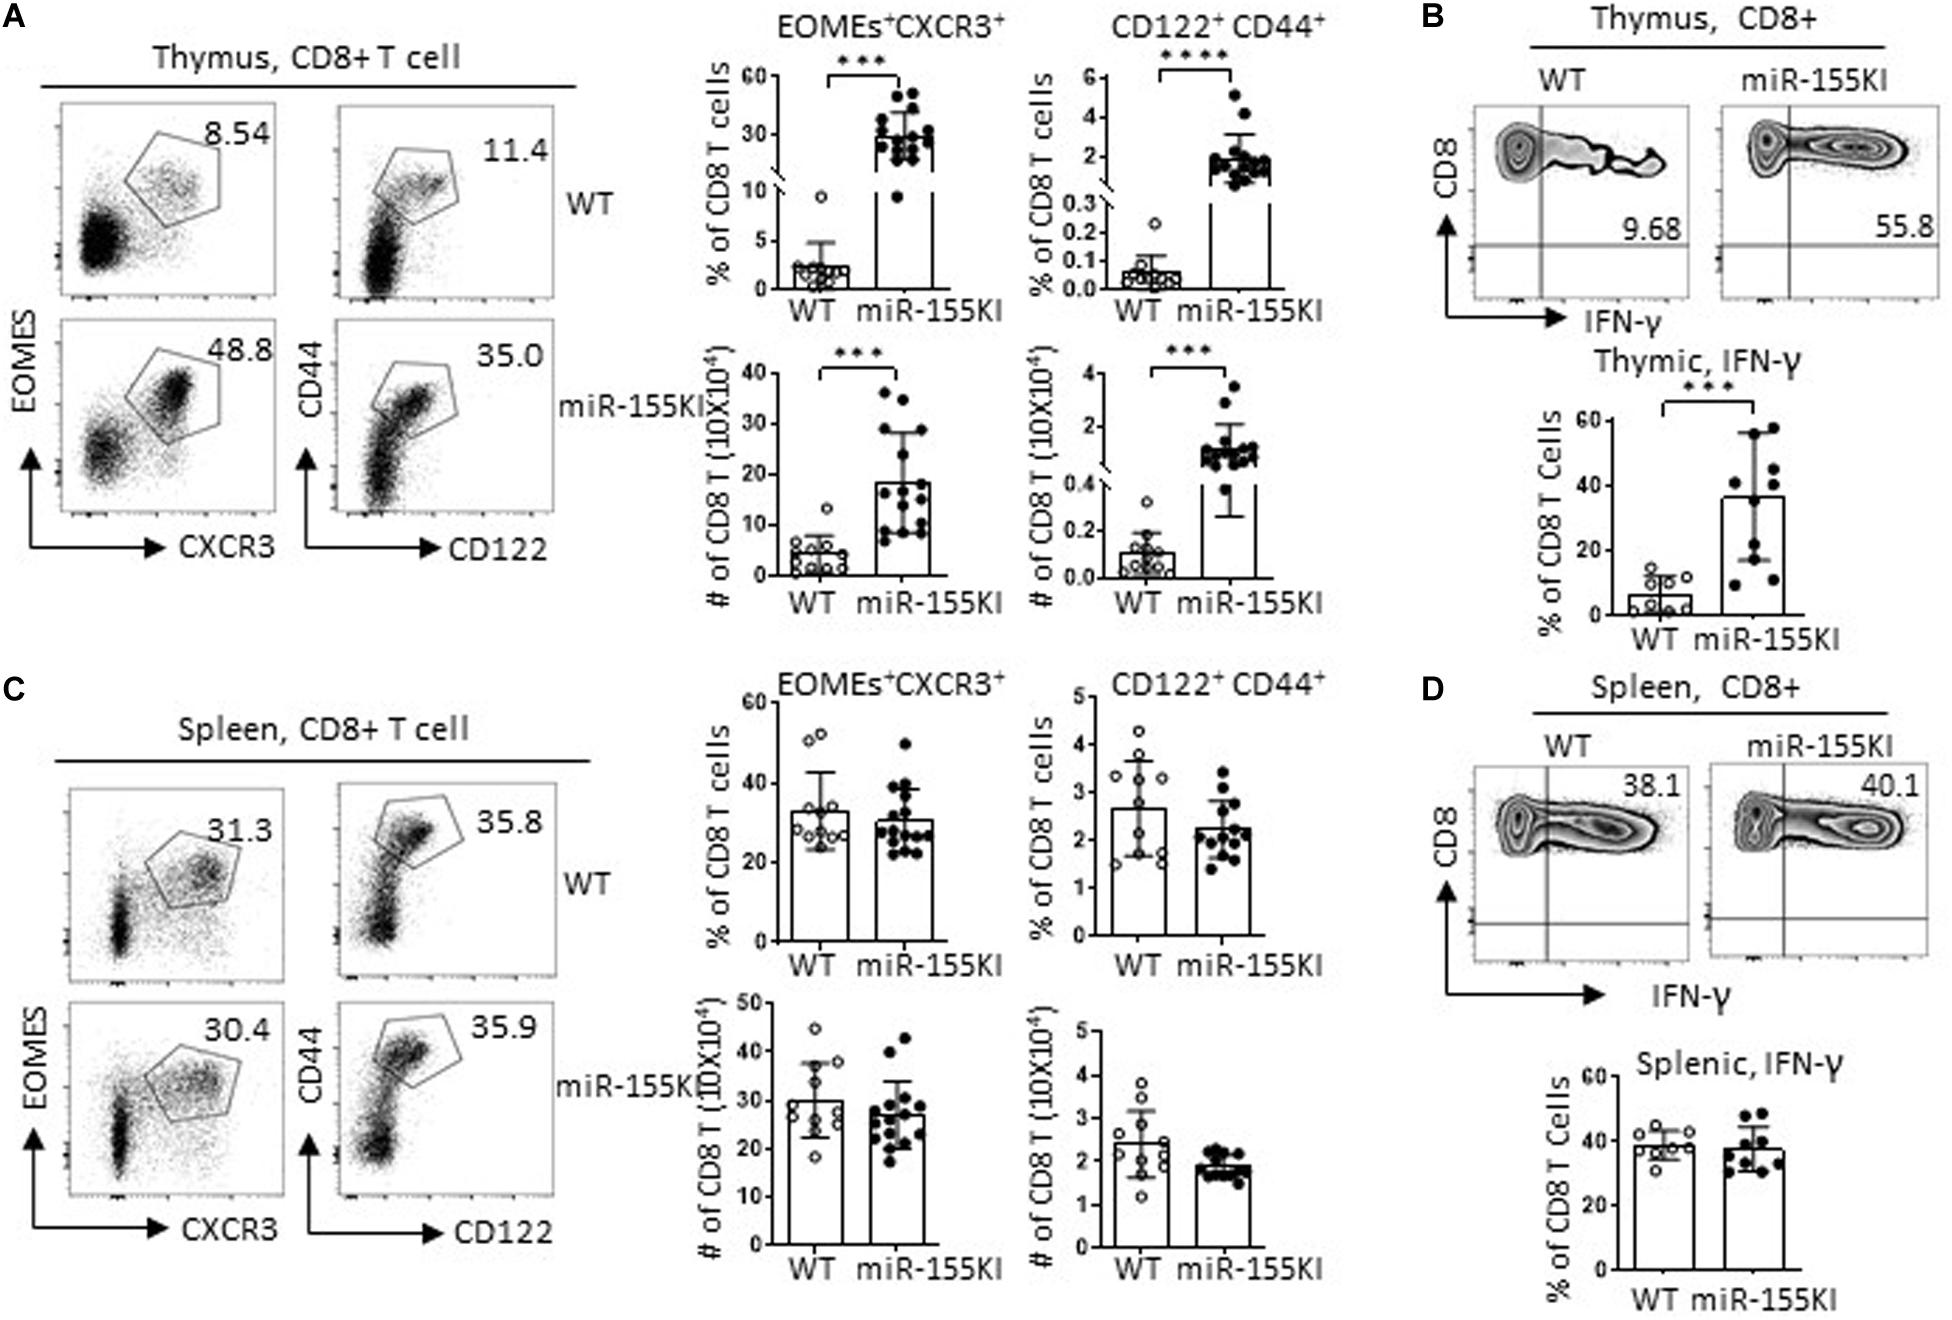
Figure 6. MiR-155 overexpression regulates innate CD8 T cell development. (A,C) Representative flow cytometry plots depicting innate CD8 T cells in thymic CD8 T cells and splenic CD8 T cells; CD8 T cells gating strategy are shown in Supplementary Figure 4. Innate CD8 T cells were identified as CXCR3+Eomes+ and CD44hiCD122+ left in thymus (A) and spleen (C). Bar graphs showing frequency and absolute number of innate CD8 T cells in thymus (A) and spleen (C) from miR-155KI and WT mice (right). (B,D) Representative flow cytometry plots depicting IFN-γ production in thymic (B) and splenic (D) CD8+ T cells from miR-155KI and WT mice. Bar graphs showing frequency of IFN-γ+ CD8 T cells in thymus (B) and spleen (D) from miR-155KI and WT mice. Data are from at least four independent experiments. Each individual mouse is represented by a dot, and the data were analyzed by non-paired t-test. ***P < 0.001, ****P < 0.0001.
Cell-Intrinsic Versus Extrinsic Effects of Defective iNKT Cells and Innate CD8 T Cells With MiR-155 Overexpression
The development of iNKT cells depends on positive selection from signals through glycolipids presented on DP thymocytes by the CD1d, as well as through homotypic interactions with the SLAM family receptors Slamf1 and Slamf6 (Griewank et al., 2007). In addition to the intrinsic factors of the iNKT precursors, the DP T cell-constituted thymic environmental changes induced by miR-155 overexpression may also have an impact on iNKT cell development and differentiation. Here, we found that CD1d, Slamf1, and Slamf6 expression were comparable in thymic DP T cells between miR-155KI and WT mice (Supplementary Figure 5A).
To further rule out the possibility of a thymic environmental defect in miR-155KI mice, we performed a mixed bone marrow (BM) chimera experiment. A 1:1 mixture of SJL (CD45.1+) BM with miR-155KI or WT littermate BM (CD45.2+) was transferred to lethally irradiated SJL/B6-recipient mice (CD45.1+CD45.2+) (Figure 7A). Eight weeks post-BM transfer, iNKT and T cell constitution and phenotypes were evaluated and compared. We found that iNKT cells that had originated from the miR-155 KI BM perfectly mimicked the defective iNKT cell phenotypes identified in primary miR-155 KI mice, as seen by iNKT cell frequency, maturation status, and functional lineage differentiation (Figures 7B–D). These results showed conclusively that the observed defects in iNKT cell development and differentiation were entirely cell intrinsic.
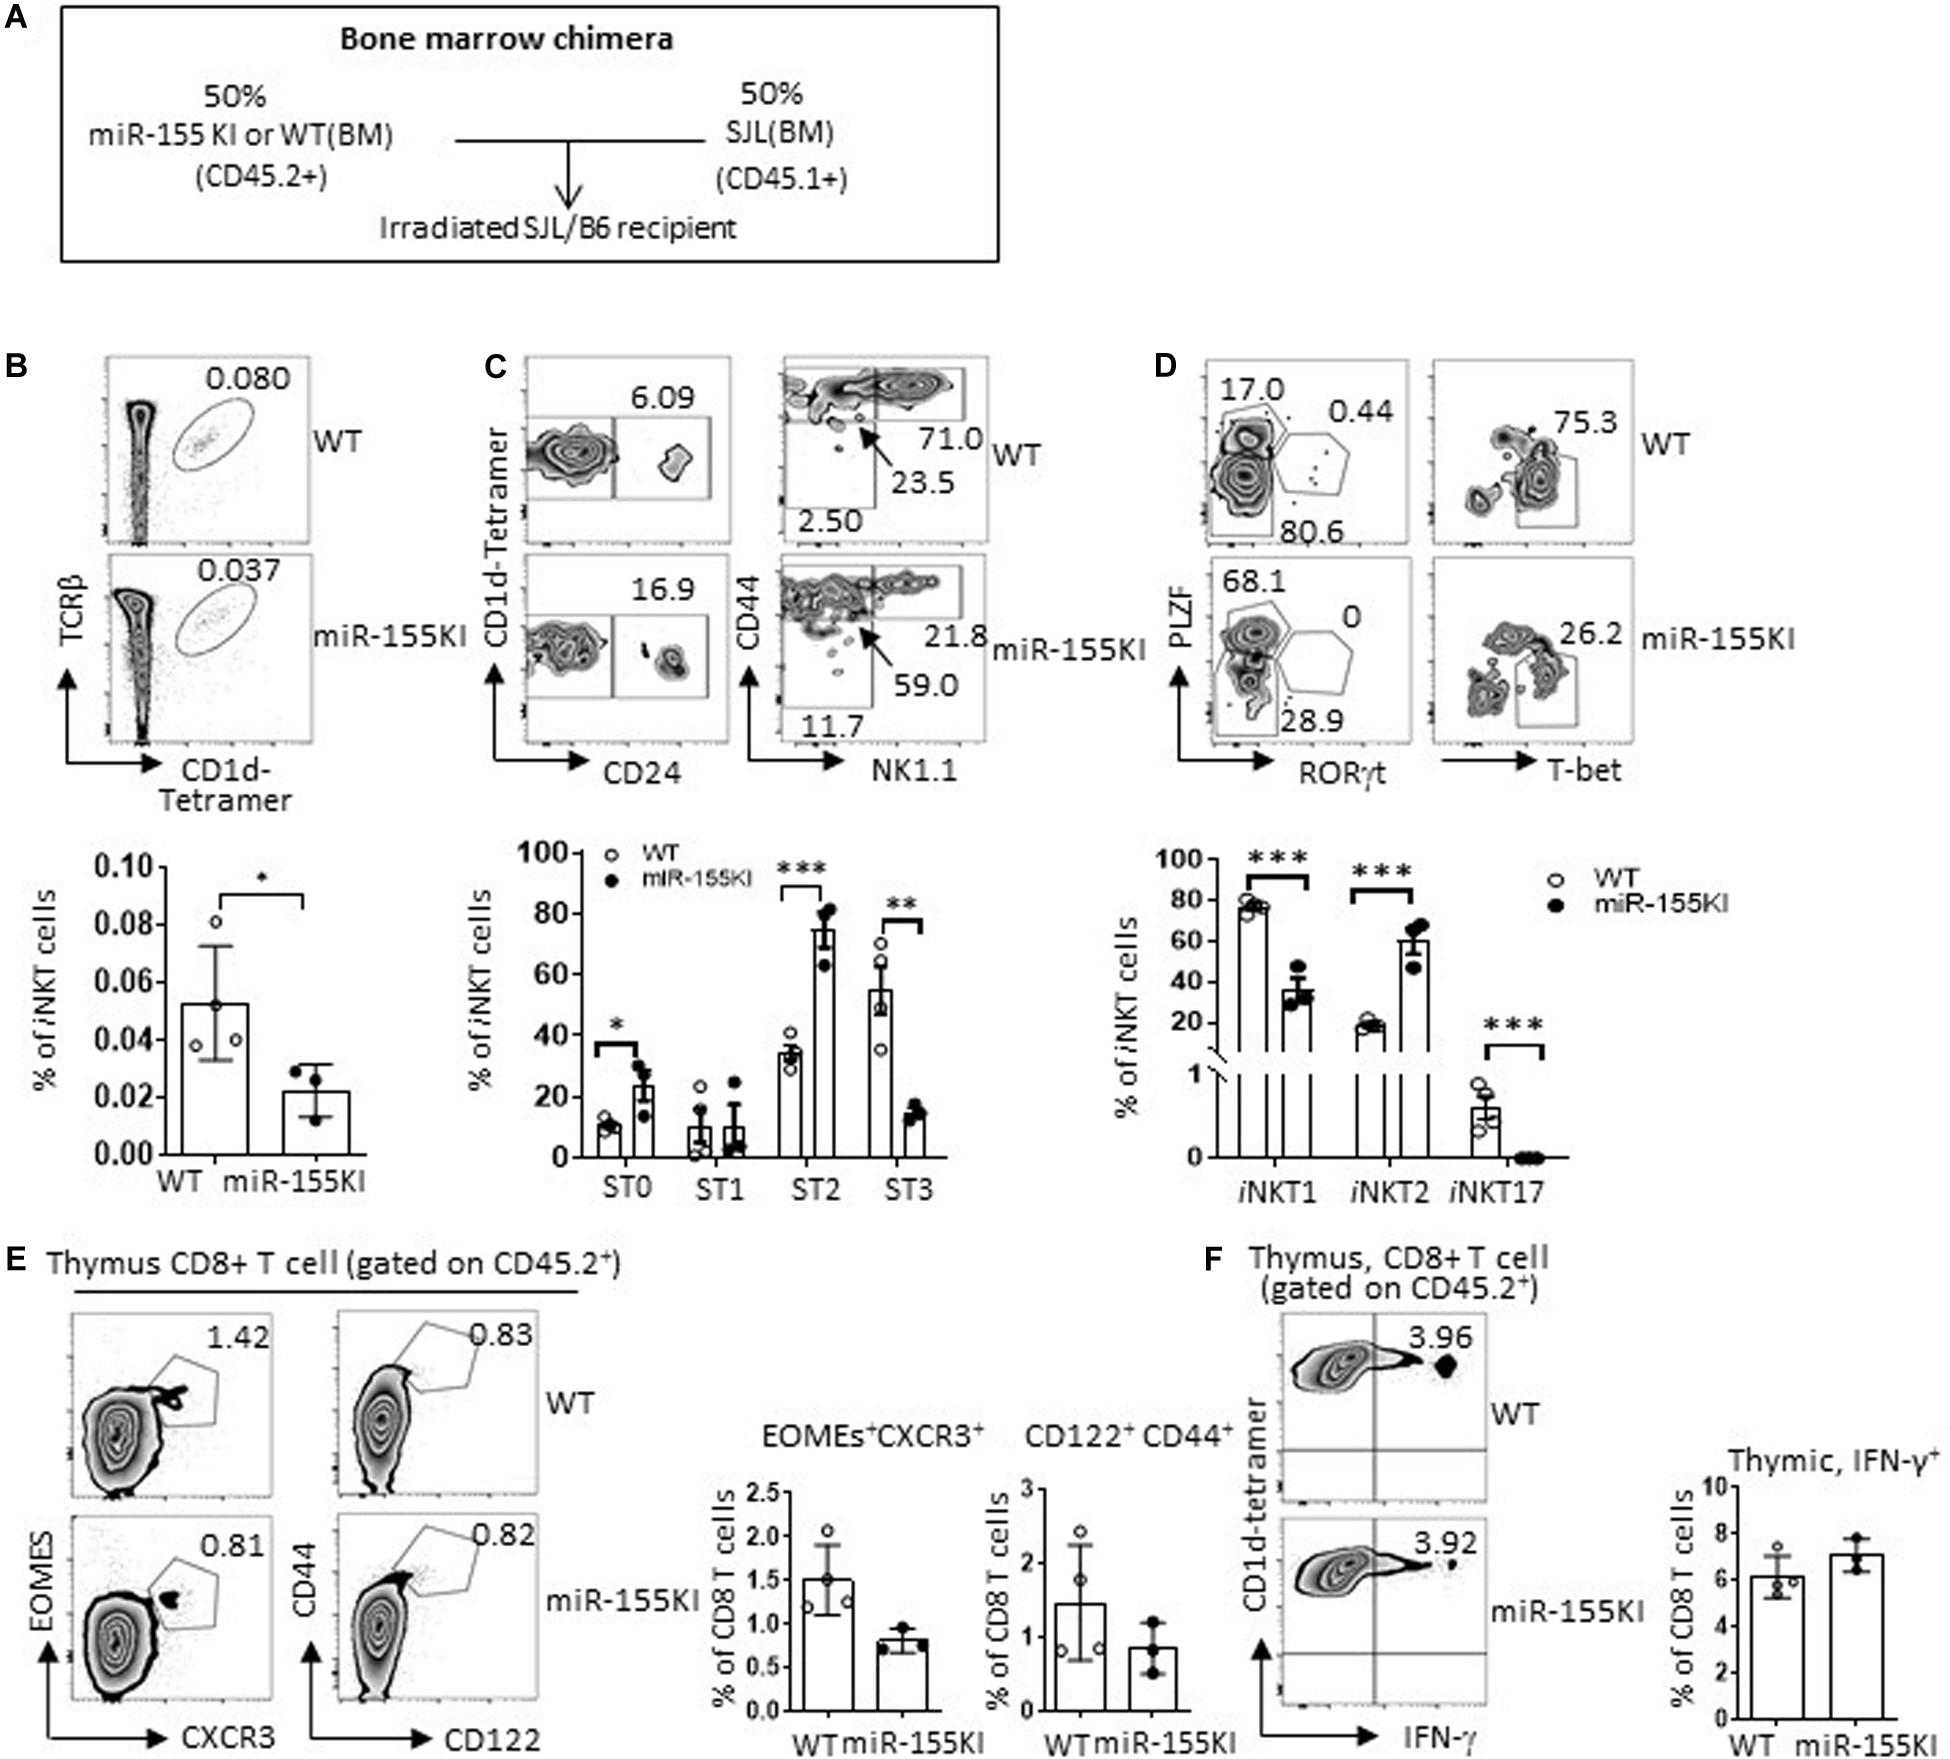
Figure 7. Cell-intrinsic versus extrinsic effects of defective iNKT cell with miR-155 overexpression. (A) Schematic representation of the mixed bone marrow chimera. (B–D) Donor bone marrows (BM) harvested from age- and gender-matched SJL (CD45.1+) mice and miR-155KI (CD45.2+) or WT (CD45.2+) mice with CD3 deletion were cotransferred at 1:1 ratio to 8-week-old B6.SJL recipient mice that were lethally irradiated. (B) Representative flow cytometry plots depicting iNKT cells in thymus derived from CD45.2+ WT and CD45.2+ miR-155KI BM (top), CD45.1 and CD45.2 gating strategy are provided in Supplementary Figure 5B. Bar graph showing frequency of iNKT cells derived from CD45.2+ WT and CD45.2+ miR-155KI BM (bottom). (C) Flow cytometry plots depicting the stage 0 (ST0, CD24+), stage 1 (ST1, CD24– CD44loNK1.1–), stage 2 (ST3, CD24– CD44hiNK1.1–), and stage 3 (ST3, CD24– CD44hiNK1.1+) gated on thymic iNKT cells. Bar graph showing frequencies of different stages of iNKT cells derived from CD45.2+ WT and CD45.2+ miR-155KI BM (bottom). (D) Flow cytometry plots depicting iNKT1 (PLZFloT-bethi), iNKT2 (PLZFhi), and iNKT17 (PLZFintRORγt+) cells (top). Bar graph showing frequencies of different subsets of iNKT cells derived from CD45.2+ WT and CD45.2+ miR-155KI BM (bottom). (E) Representative flow cytometry thymic innate CD8 T cells (CXCR3+Exomes+ and CD44hiCD122+) derived from CD45.2+ WT and CD45.2+ miR-155KI BM (left). Bar graph shows frequency of innate CD8 T cells derived from CD45.2+ WT and CD45.2+ miR-155KI BM (right). (F) Representative flow cytometry depicting IFN-γ production in thymic CD8 T cells derived from CD45.2+ WT and CD45.2+ miR-155KI BM (left). Bar graph showing frequency of IFN-γ+ thymic CD8 T cells derived from CD45.2+ WT and CD45.2+ miR-155KI BM (right). Data are from three independent experiments. Each individual mouse is represented by a dot, and the data were analyzed by unpaired t-test. *P < 0.05, **P < 0.01, ***P < 0.001.
On the other hand, thymic CD8 SP T cells that had originated from miR-155KI BM showed an indistinguishable phenotype compared with WT BM based on the CD8 SP T frequencies, innate CD8 T cell marker expression, and IFN-γ production upon PMA/Ionomycin in vitro stimulation (Figures 7E,F). Therefore, the role of miR-155 in thymic innate CD8 T cell development is entirely cell extrinsic. This cell extrinsic feature of thymic innate CD8 T cell development is in perfect agreement with the observed enhanced thymic iNKT2 differentiation and IL-4 production, which is supported by multiple previous studies that showed that defective iNKT cell end-stage maturation is accompanied by an enhanced thymic innate CD8 T cell development (Lee et al., 2011).
MiR-155 Regulates iNKT Cell and Innate CD8 T Cell Development by Targeting Multiple Genes
To identify the target molecules of miR-155 during iNKT thymic development and differentiation, we then performed an unbiased RNA-Seq analysis of sorted stage1/2 NK1.1– iNKT cells and stage 3 NK1.1+ iNKT cells from miR-155KI and WT littermate mice. Differential gene expression analysis revealed 248 down- and 234 upregulated genes (among 11,636 variables) in the NK1.1– iNKT cell pool, and 26 down- and 52 upregulated genes (among 10,263 variables) in the NK1.1+ iNKT cell pool (Figure 8A). A vast number of genes in the NK1.1– iNKT cell pool were dysregulated.
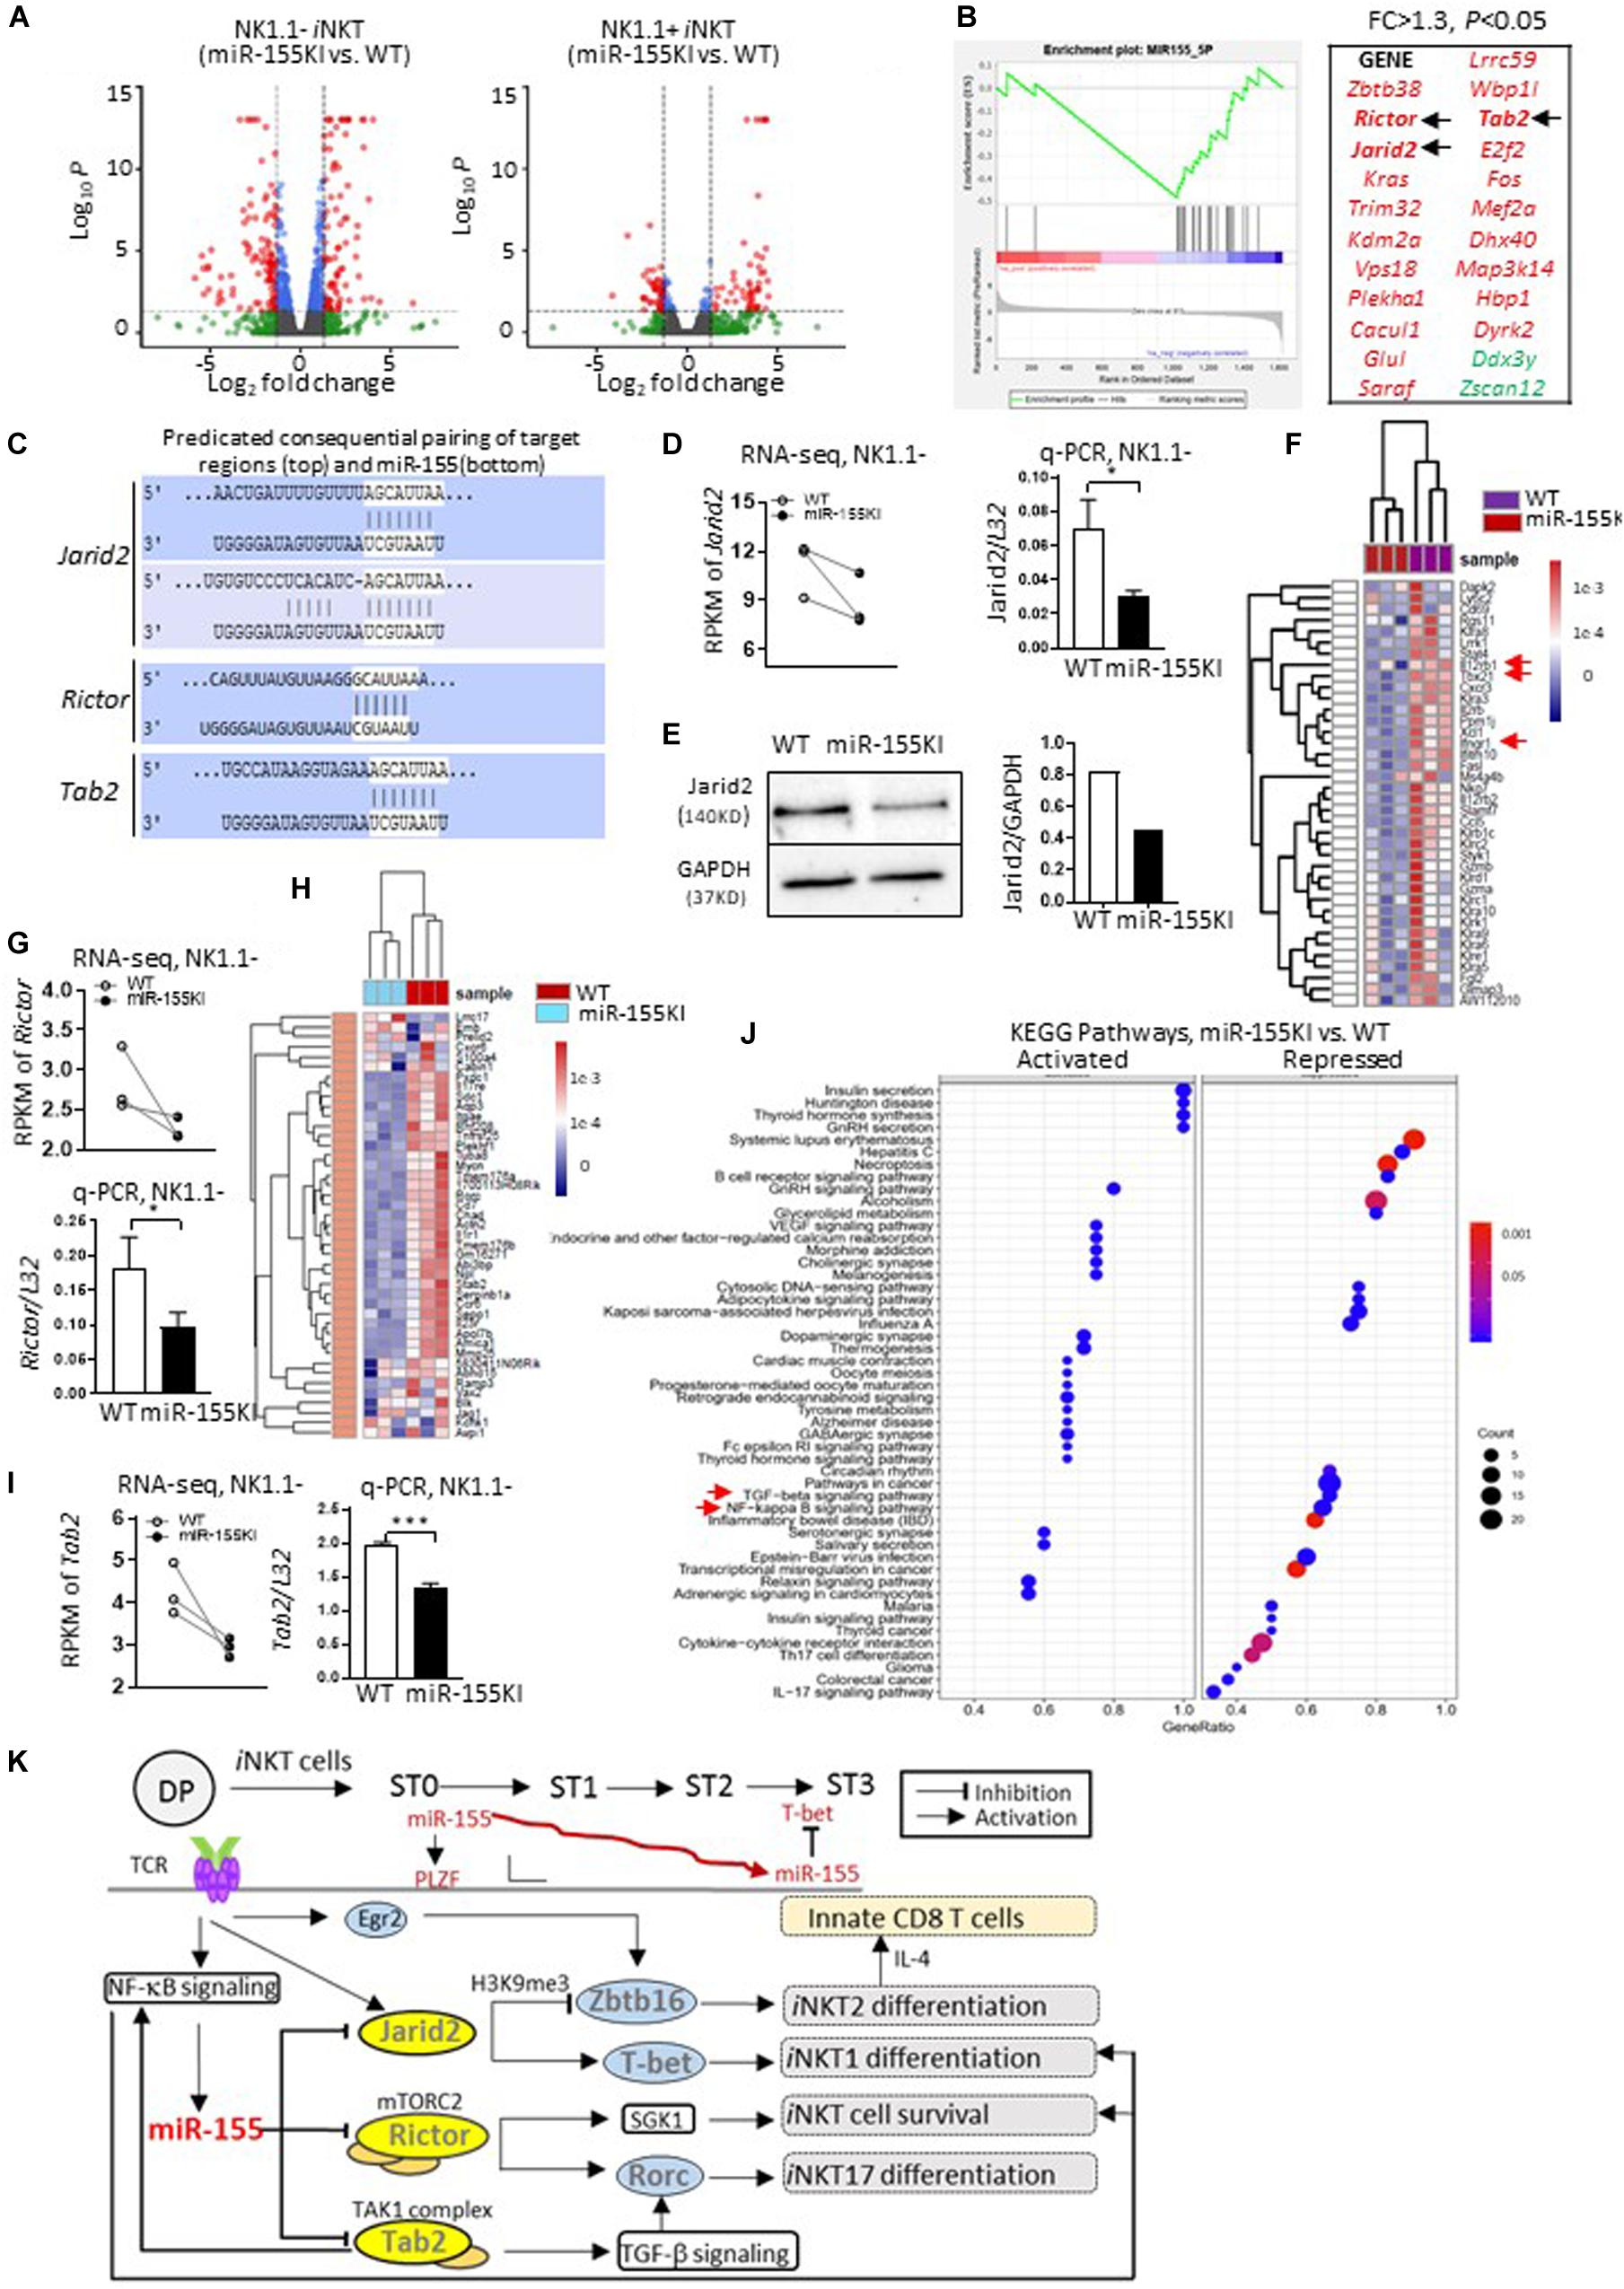
Figure 8. MiR-155 regulates iNKT cell and innate CD8 T cell development by targeting multiple genes. (A) Volcano plot shows significant differentially expressed genes from NK1.1– (miR-155 KI vs. WT, left) and NK1.1+ (miR-155 KI vs. WT, right) RNA pools. (B) GSEA plot demonstrates enrichment of miR-155 target genes in miR-155KI cells. The x-axis represents the rank ordering (miR-155KI vs. WT) of all genes. A running GSEA enrichment score for miR-155 target genes is plotted along the rank order. MiR-155 target genes are individually identified with a black tick marker at their rank positions (also listed on the right in red). (C) The schematic representation of Jarid2 (top), Rictor, and Tab2 (bottom) binding sites with miR-155. (D) RPMK of Jarid2 differences in WT and miR-155KI iNKT cells from RNA-seq. Each dot represents one sample (left). Jarid2 relative expression in WT and miR-155KI iNKT cells from q-PCR (right). (E) Western blot analysis of Jarid2 protein in total thymocytes from miR-155KI and WT mice (left). Cropped images of Jarid2 and GAPDH have been used and the full scans of the entire original blots are available in the Supplementary Figure 6. Bar graph shows relative Jarid2 expression in miR-155 KI and WT mice (right). The experiment was reproduced two times with similar results. (F) Heat map comparing gene signatures for iNKT1 in iNKT cells from miR-155KI and WT mice: among these, Il12rb1, Tbx21, and Ifngr1 are highlighted with red arrows. (G) RPMK of Rictor differences in WT and miR-155KI iNKT cells from RNA-seq. Each dot represents one sample (top). Rictor relative expression in WT and miR-155KI iNKT cells from q-PCR (bottom). (H) Heat map comparing gene signatures for iNKT17 in iNKT cells from miR-155KI and WT mice. (I) RPMK of Tab2 differences in WT and miR-155KI iNKT cells from RNA-seq. Each dot represents one sample (left). Tab2 relative expression in WT and miR-155KI iNKT cells from q-PCR (right) and data were analyzed by unpaired t-test. *P < 0.05, ***P < 0.001. (J) KEGG pathway analysis in NK1.1– RNA pools (miR-155KI vs. WT). Left panel shows activated signaling pathways in miR-155KI iNKT cells; right panel showing repressed signaling pathways in miR-155KI iNKT cells. The TGF-β signaling pathway and NF-κB signaling pathway are highlighted with red arrows. (K) A schematic, speculative model of miR-155 regulation of iNKT cell and innate CD8 T cell development through targeting of multiple signaling molecules and pathways. miR-155, which is probably induced by TCR activation via NF-κB signaling, is gradually downregulated during iNKT cell maturation. At early stages, high levels of miR-155 further promote PLZF expression (via repressing Jarid2) on the basis of high levels of PLZF, which was initially induced by Egr2. Additionally, as iNKT cells develop, reduced miR-155 could release the repression of T-bet (via relieving Jarid2). On the other hand, miR-155 simultaneously inhibits Tab2 and NF-κB signaling pathways, therefore forming a negative feedback loop controlling iNKT1/2 differentiation. Meanwhile, reduced miR-155 could relieve the suppression of Rictor and TGF-β signaling pathways, which cooperate additively for the differentiation of the iNKT17 lineage and regulation of overall iNKT homeostasis.
To confirm a global dysregulation of miR-155 targets in miR-155KI mice, a FPKM-rank-ordered (miR-155KI vs. WT) list of genes was prepared and used as input for a preranked GSEA analysis (Subramanian et al., 2005) against an MsigDB miRNA target gene set (C3 miRNA v3.0; MSigDB). The significant association (p < 0.05; Kolmogorov–Smirnov test) was identified for genes within the miR-155 target gene set and confirmed a transcriptome-wide reduction of gene expression in miR-155KI NK1.1– and NK1.1+ iNKT cell pools. With this strategy, we identified 21 predicted miR-155 targets that were significantly repressed in miR-155KI NK1.1– iNKT cells (Figure 8B and Supplementary Table 1). However, no predicted miR-155 targets were identified in the NK1.1+ iNKT cell pool (data not shown). It is important to point out that neither Itk nor Ets1 were in the downregulated gene list for both NK1.1– and NK1.1+ iNKT cells in miR-155KI mice, even though both were previously reported as potential targets of miR-155 during iNKT cell development (Burocchi et al., 2015). Therefore, in subsequent experiments, we focused on the NK1.1– iNKT cell pool for mechanistic analysis. Among these predicted target genes, we were particularly intrigued by the genes Jarid2, Rictor, and Tab2, all of which were shown to be significantly decreased in miR-155KI iNKT cells based on RNA-Seq data (Figure 8B). In support of the roles of Jarid2, Rictor, and Tab2 as targets of miR-155, there are two predicted miR-155 binding sites in the 3′ UTR of Jarid2; one predicated miR-155 sites in the 3′ UTR of Rictor; and one predicated miR-155 sites in the 3′ UTR of Tab2 (Dianalab algorithm, Figure 8C).
Jarid2 is a member of the JmjC domain-containing protein family, a novel component of polycomb repressive complex 2 (PRC2). A previous study confirmed that Jarid2 is a negative regulator of Zbtb16 (encode PLZF) mediated by H3K9me3 demethylation (Pereira et al., 2014). Indeed, iNKT cells from miR-155KI mice showed down regulated expression of Jarid2, which was verified via q-PCR (Figure 8D), but increased expression of PLZF (Figures 4A,B). In support of decreased Jarid2 expression in iNKT cells, thymocytes from miR-155KI mice showed a pronounced reduction in Jarid2 protein levels (Figure 8E and Supplementary Figures 6A,B). More importantly, the iNKT phenotype of T cell-specific Jarid2 deletion closely resembled what was observed in miR-155KI mice, as judged by the disturbed iNKT1/2 cells differentiation and increased thymic innate CD8 T cell development (Pereira et al., 2014). Consistently, RNA-seq showed that a cluster of iNKT1 signature genes were downregulated in miR-155KI iNKT cells (Figure 8F). Among these, we found that iNKT cells with miR-155 KI showed interrupted Ifngr1 and Il12rb1 expression (Figure 8F). Given that IFN-γ and IL-12 signaling promote T-bet expression during Th1 differentiation (Zhu et al., 2012), the impaired IFN-γ and IL-12 signaling pathway may be the direct molecular mechanism for the interrupted T-bet expression and iNKT1 differentiation.
These data suggested that miR-155 inhibits Jarid2, which negatively regulates PLZF expression to control iNKT development, iNKT1/2 lineage differentiation, and secondary innate CD8 T cell development. Even though the data overwhelmingly supported the dominant target role of Jarid2 in the defective iNKT cell phenotypes in miR-155KI mice, the downregulation of Jarid2 does not explain all the iNKT phenotypes observed in miR-155KI mice, such as defective iNKT cell survival and diminished iNKT17 lineage differentiation. As one miRNA could target multiple genes in one cell setting, Rictor attracted our attention as another potential target of miR-155 in iNKT cells (Figures 8B,C). Rictor is an obligatory component of mechanistic target of rapamycin (mTOR) complex 2 mTORC2 (Laplante and Sabatini, 2009). Here, we found that Rictor expression was dramatically reduced in miR-155KI iNKT cells, and this result was verified via q-PCR (Figure 8G). The deletion of Rictor selectively abolished the iNKT17 lineage, as indicated by a marked reduction of RORγt and IL-17 expression (Wei et al., 2014; Sklarz et al., 2017). Alternatively, iNKT cells with Rictor deletion have been shown to have defective survival during development (Sklarz et al., 2017). Interestingly, these defective iNKT phenotypes are highly reminiscent of what was observed in miR-155KI mice, particularly with regard to diminished iNKT17 lineage differentiation. Of interest, the global iNKT17 signature genes were significantly downregulated in miR-155KI iNKT cells (Figure 8H). Strikingly, the expression of Sgk1, a cell survival kinase and the downstream molecule of Rictor/mTORC2 (Lang and Cohen, 2001; Loffing et al., 2006), was found to be significantly reduced in miR-155KI iNKT cells, as determined by RNA-Seq (data not shown). These data strongly support the idea that miR-155 inhibits iNKT17 lineage differentiation and controls iNKT survival through targeting Rictor. Thus, downregulation of miR-155 to derepress Rictor during iNKT thymic development may be necessary for overall iNKT development and iNKT17 lineage differentiation.
Furthermore, we found that Tab2 (TGF-β activated kinase 1-binding protein 2), one of the predicted targets of miR-155, was also repressed in miR-155 KI iNKT cells (Figures 8B,C,I). Tab2 is required for transforming growth factor-β-activated kinase 1 (TAK1)-dependent signaling pathways, including the transforming growth factor-β (TGF-β) signaling pathway and the NF-κB signaling pathway (Takaesu et al., 2000; Kanayama et al., 2004; Hu et al., 2014; Tan et al., 2015), both of which are critical for iNKT cell development at multiple levels (Sivakumar et al., 2003; Vallabhapurapu et al., 2008; Havenar-Daughton et al., 2012). In support of this notion, our KEGG pathway analysis revealed that both the NF-κB and the transforming growth factor-β (TGF-β) signaling pathways were partially inhibited in miR-155KI iNKT cells (Figure 8J and Supplementary Figures 7A,B). Taken together, it is fair to conclude that miR-155 regulates iNKT1/2 cell differentiation and secondary innate CD8 T cell development by targeting Jarid2 and controls iNKT17 differentiation and iNKT homeostasis by targeting Rictor. Additionally, miR-155 modulates the NF-κB signaling pathway and TGF-β signaling pathway during iNKT cell maturation and cell function (Figure 8K).
Discussion
MiR-155 was one of the first discovered mammalian miRNAs and is expressed in a variety of immune cells. Extensive studies have revealed the complex and versatile functions of miR-155 in different immune cells. In B cells, miR-155 overexpression leads to the transformation and development of lymphoma (Costinean et al., 2006), which is correlated with the role of miR-155 in human hematopoietic cancers (Eis et al., 2005; Kluiver et al., 2007). In T cells, miR-155 has been reported to regulate cell lineage decisions, where it suppresses Th2 differentiation (Rodriguez et al., 2007), promotes autoimmune inflammation by enhancing inflammatory T cell development (O’Connell et al., 2010), enhances the effector CD8 T cell immunity, and restrains central memory CD8 differentiation in response to viruses and during cancer (Almanza et al., 2010; Tsai et al., 2013). In the current study, we showed the essential role of dynamic miR-155 expression in the development, differentiation, and homeostasis of iNKT cells. Overexpression of miR-155 perturbed iNKT1 but promoted iNKT2 differentiation by targeting Jarid2, the component of a negative epigenetic regulator of PLZF, while miR-155 restrained iNKT17 differentiation by targeting Rictor, an obligatory component of mTORC2. Our discovery adds further complexities of miR-155-mediated immune regulation and emphasizes the cell type, developmental, and differentiation stage-specific regulation characteristics and molecular mechanisms of miR-155-mediated immune regulation.
PLZF is a signature transcription factor of the iNKT cell lineage. PLZF directs the iNKT cell effector program, lineage differentiation, and function and affects cell migratory properties (Kovalovsky et al., 2008; Savage et al., 2008). Previous studies have revealed the molecular network regulating PLZF expression. Egr2, one of the earliest transcription factors induced by TCR signaling, directly binds to and activates the PLZF promoter, resulting in PLZF expression that provides a link between TCR signaling and cell fate determination in iNKT cells (Seiler et al., 2012). During thymic iNKT development, the dynamic upregulation of let-7 miRNA is involved in the gradual downregulation of PLZF and iNKT1 differentiation and maturation (Pobezinsky et al., 2015). Our current study indicates that miR-155 regulates iNKT cell lineage differentiation through targeting Jarid2, which epigenetically restricts the expression of PLZF, further expanding the complexity of the molecular networks in controlling PLZF and iNKT cell differentiation and maturation. Previous studies have indicated that either Egr2 or Jarid2 and miR-155 are upregulated by TCR activation (Seiler et al., 2012; Pereira et al., 2014), and that Jarid2 and Egr2 may counter-regulate PLZF expression in iNKT cells. Nevertheless, the magnitude of the exponential surge of Egr2 expression far outweighs the slight upregulation of Jarid2 after TCR activation, which indicates the dominant regulatory role of Egr2 in the initial PLZF transcriptional boost and in the early stages of iNKT cell development and effector programs (Pereira et al., 2014). However, epigenetic regulation, including Jarid2 elevation resulting from miR-155 downregulation and IL-15-promoted Let-7 expression are critically involved in the gradual downregulation of PLZF, which is essential for iNKT1 differentiation and maturation (Pobezinsky et al., 2015). These may also explain why knockdown of miR-155 does not significantly interrupt PLZF expression or development and differentiation of iNKT cells, in which miR-155 deletion-mediated Jarid2 elevation may not be enough to perturb the early PLZF boost dominated by the Egr2 surge.
MiR-155 transcription was reported to be positively regulated through NF-κB signaling pathway. Therefore, the upregulation of miR-155 after TCR activation during the early iNKT developmental stage may be mediated through the NF-κB signaling pathway. Nevertheless, iNKT cells with miR-155 overexpression showed downregulated NF-κB signaling pathway, possibly through directly targeting Tab2, the upstream activation kinase complex component of NF-κB (Kanayama et al., 2004; Gatto et al., 2008). Nevertheless, a positive regulatory role of miR-155 on NF-κB signaling pathway was reported in a B cell lymphoma cell line, which may indicate the cell-context-specific regulatory role of miR-155 (Jablonska et al., 2015). Furthermore, mTORC2 positively regulates NF-κB signaling pathway through AKT (Sarbassov et al., 2005; Cheng et al., 2011). Hence, miR-155 can suppress the NF-κB signaling pathway indirectly through targeting Rictor. The NF-κB signaling pathway is known to be critical for iNKT cell differentiation. NF-κB-deficient mice, including NF-κB1, c-Rel, and RelA KO mice, have shown perturbed iNKT maturation: especially in RelA KO mice (Stankovic et al., 2011), which closely resembles the defective iNKT1 phenotypes in miR-155KI mice, particularly with regard to interrupted stage 3. Thus, the defective NF-κB signaling pathway in iNKT cells with miR-155 overexpression may cooperate additively with the perturbed Jarid2 and derepression of PLZF in the overall defective iNKT1 phenotype of miR-155KI mice. On the other hand, the cell-intrinsic NF-κB activity was shown to be essential for the survival of iNKT cells (Gatto et al., 2008), which could be an additional reason for the interrupted survival of iNKT cells with miR-155 overexpression. Furthermore, the interaction between miR-155 and the NF-κB signaling pathway forms a negative feedback loop, which could be the reason for the transient or self-limiting manner of miR-155 expression induced by TCR activation, such as the gradual downregulation of miR-155 during iNKT thymic development and differentiation identified in the current study.
mTOR signaling integrates immune signals and metabolic cues in orchestrating T cell responses (Chi, 2012; Powell et al., 2012). mTOR signaling consists of two complexes, mTORC1 and mTORC2, which are defined by the respective signature components Raptor and Rictor. Previous studies from two groups have indicated a critical role of mTORC2 in the fate determination of iNKT17 cells and in iNKT homeostasis (Wei et al., 2014; Sklarz et al., 2017). Our results indicated that miR-155 inhibits iNKT17 lineage differentiation and controls iNKT survival through targeting Rictor, the required component of mTORC2. On the other hand, iNKT cells with miR-155 overexpression showed a downregulated TGF-β signaling pathway, while TGF-β signaling, particularly its SMAD4-dependent pathway, is required for both the survival of RORγt+ iNKT cells during their development and IL-17 production (Havenar-Daughton et al., 2012). Therefore, the perturbed mTORC2 activity and downregulated TGF-β signaling pathway may work additively for the defective iNKT17 differentiation and iNKT homeostasis in iNKT cells with miR-155 overexpression. Nonetheless, studies by Escobar et al. (2014) have shown that miR-155 positively regulates cytokine gene expression in Th17 cells through posttranscriptional regulation of Jarid2. These studies, combined with our data, emphasize the spatial, temporal, and delicately balanced characteristics of miR-155-mediated regulation. Our data also bring miRNAs and chromatin modification together by showing how miR-155 targets the chromatin protein Jarid2, which in turn regulates the key transcription factor for iNKT development and effector program, PLZF.
We do realize there are some limitations in our current study, including the dissection of role of miR-155 in iNKT and Treg cell interaction. The number of Tregs cells in thymus was found increased in miR-155KI mice (Supplementary Figure 4B). A previous report indicated that there is a potential across-talk between Tregs and iNKT cells and that Tregs in thymus may suppress the proliferation, cytokine production, and cytotoxic activity of iNKT cells in local environment (La Cava et al., 2006). Our current study is unable to rule out the potential role of Treg cells in the defective iNKT cell development and function, which need to be further investigated.
Overall, the dynamic expression of miR-155 and its regulation in thymic iNKT cells is essential for the development, functional lineage differentiation, and homeostasis of iNKT cells. Even though the early upregulation of miR-155 after iNKT positive selection is not a dominant factor for the initial PLZF transcription boost, the potential miR-155-NF-κB-negative feedback loop controlling miR-155 downregulation is essential for downstream iNKT differentiation and homeostasis. Downregulated miR-155 relief the suppression to Jarid2 and the NF-κB signaling pathway, which further controls PLZF expression and balances iNKT1/iNKT2 differentiation cooperatively. On the other hand, downregulated miR-155 relieves the suppression of Rictor and the TGF-β signaling pathway, additively cooperating for the differentiation of the iNKT17 lineage and promotion of overall iNKT homeostasis. Consequently, the dynamic regulation of miR-155 expression during thymic iNKT cell development is essential, and miR-155 functions as a moderator connecting and coordinating multiple signaling pathways and transcriptional programs for a consolidated regulation of iNKT development, functional lineage differentiation, and secondary innate CD8 T cell development (Figure 8K).
Data Availability Statement
The raw data supporting the conclusions of this article will be made available by the authors, without undue reservation, to any qualified researcher.
Ethics Statement
The animal study was reviewed and approved by Experiments using animal were approved by the Institutional Animal Care and Use Committee of Henry Ford Health System.
Author Contributions
LZ and Q-SM conceived and designed the study. JW, KL, XZ, GL, TL, and XW performed the experiments. JW, KL, and LZ analyzed the data. SB performed mouse irradiation for BM transfer. LZ, JW, and Q-SM wrote the manuscript, which was commented on by all authors.
Funding
This study was supported by Henry Ford Immunology Program grants (T71016 and T71017) to Q-SM and LZ, by the National Institutes of Health (NIH) grants R61AR076803, R01AR063611, R01AR069681, 1R01AI119041 to Q-SM, and RO1AR072046 to LZ.
Conflict of Interest
The authors declare that the research was conducted in the absence of any commercial or financial relationships that could be construed as a potential conflict of interest.
Acknowledgments
We would like to thank the Mi lab members for their support and constructive discussions and NIH Tetramer Core Facility for supplying CD1d tetramers.
Supplementary Material
The Supplementary Material for this article can be found online at: https://www.frontiersin.org/articles/10.3389/fcell.2020.619220/full#supplementary-material
Footnotes
References
Almanza, G., Fernandez, A., Volinia, S., Cortez-Gonzalez, X., Croce, C. M., and Zanetti, M. (2010). Selected microRNAs define cell fate determination of murine central memory CD8 T cells. PLoS One 5:e11243. doi: 10.1371/journal.pone.0011243
Bendelac, A., Savage, P. B., and Teyton, L. (2007). The biology of NKT cells. Annu. Rev. Immunol. 25, 297–336.
Bezman, N. A., Chakraborty, T., Bender, T., and Lanier, L. L. (2011). miR-150 regulates the development of NK and iNKT cells. J. Exp. Med. 208, 2717–2731. doi: 10.1084/jem.20111386
Burocchi, A., Pittoni, P., Tili, E., Rigoni, A., Costinean, S., Croce, C. M., et al. (2015). Regulated expression of miR-155 is required for iNKT cell development. Front. Immunol. 6:140. doi: 10.3389/fimmu.2015.00140
Cheng, J., Phong, B., Wilson, D. C., Hirsch, R., and Kane, L. P. (2011). Akt fine-tunes NF-κB-dependent gene expression during T cell activation. J. Biol. Chem. 286, 36076–36085. doi: 10.1074/jbc.m111.259549
Chi, H. (2012). Regulation and function of mTOR signalling in T cell fate decisions. Nat. Rev. Immunol. 12, 325–338. doi: 10.1038/nri3198
Constantinides, M. G., and Bendelac, A. (2013). Transcriptional regulation of the NKT cell lineage. Curr. Opin. Immunol. 25, 161–167. doi: 10.1016/j.coi.2013.01.003
Costinean, S., Zanesi, N., Pekarsky, Y., Tili, E., Volinia, S., Heerema, N., et al. (2006). Pre-B cell proliferation and lymphoblastic leukemia/high-grade lymphoma in E(mu)-miR155 transgenic mice. Proc. Natl. Acad. Sci. U.S.A. 103, 7024–7029. doi: 10.1073/pnas.0602266103
Das, R., Sant’angelo, D. B., and Nichols, K. E. (2010). Transcriptional control of invariant NKT cell development. Immunol. Rev. 238, 195–215. doi: 10.1111/j.1600-065x.2010.00962.x
Eis, P. S., Tam, W., Sun, L., Chadburn, A., Li, Z., Gomez, M. F., et al. (2005). Accumulation of miR-155 and BIC RNA in human B cell lymphomas. Proc. Natl. Acad. Sci. U.S.A. 102, 3627–3632. doi: 10.1073/pnas.0500613102
Escobar, T. M., Kanellopoulou, C., Kugler, D. G., Kilaru, G., Nguyen, C. K., Nagarajan, V., et al. (2014). miR-155 activates cytokine gene expression in Th17 cells by regulating the DNA-binding protein Jarid2 to relieve polycomb-mediated repression. Immunity 40, 865–879. doi: 10.1016/j.immuni.2014.03.014
Frias, A. B. Jr., Buechel, H. M., Neupane, A., and D’cruz, L. M. (2018). Invariant natural killer T-cell development and function with loss of microRNA-155. Immunology 153, 238–245. doi: 10.1111/imm.12836
Gapin, L. (2016). Development of invariant natural killer T cells. Curr. Opin. Immunol. 39, 68–74. doi: 10.1016/j.coi.2016.01.001
Gatto, G., Rossi, A., Rossi, D., Kroening, S., Bonatti, S., and Mallardo, M. (2008). Epstein-Barr virus latent membrane protein 1 trans-activates miR-155 transcription through the NF-kappaB pathway. Nucleic Acids Res. 36, 6608–6619. doi: 10.1093/nar/gkn666
Griewank, K., Borowski, C., Rietdijk, S., Wang, N., Julien, A., Wei, D. G., et al. (2007). Homotypic interactions mediated by Slamf1 and Slamf6 receptors control NKT cell lineage development. Immunity 27, 751–762. doi: 10.1016/j.immuni.2007.08.020
Havenar-Daughton, C., Li, S., Benlagha, K., and Marie, J. C. (2012). Development and function of murine RORgammat+ iNKT cells are under TGF-beta signaling control. Blood 119, 3486–3494. doi: 10.1182/blood-2012-01-401604
Henao-Mejia, J., Williams, A., Goff, L. A., Staron, M., Licona-Limon, P., Kaech, S. M., et al. (2013). The microRNA miR-181 is a critical cellular metabolic rheostat essential for NKT cell ontogenesis and lymphocyte development and homeostasis. Immunity 38, 984–997. doi: 10.1016/j.immuni.2013.02.021
Hu, M. M., Yang, Q., Zhang, J., Liu, S. M., Zhang, Y., Lin, H., et al. (2014). TRIM38 inhibits TNFalpha- and IL-1beta-triggered NF-kappaB activation by mediating lysosome-dependent degradation of TAB2/3. Proc. Natl. Acad. Sci. U.S.A. 111, 1509–1514. doi: 10.1073/pnas.1318227111
Jablonska, E., Gorniak, P., Prusisz, W., Kiliszek, P., Szydlowski, M., Sewastianik, T., et al. (2015). MiR-155 amplifies AKT and NFkB signaling By targeting multiple regulators of BCR signal in DLBCL. Blood 126:2455. doi: 10.1182/blood.v126.23.2455.2455
Kanayama, A., Seth, R. B., Sun, L., Ea, C. K., Hong, M., Shaito, A., et al. (2004). TAB2 and TAB3 activate the NF-kappaB pathway through binding to polyubiquitin chains. Mol. Cell 15, 535–548. doi: 10.1016/j.molcel.2004.08.008
Kluiver, J., Van Den Berg, A., De Jong, D., Blokzijl, T., Harms, G., Bouwman, E., et al. (2007). Regulation of pri-microRNA BIC transcription and processing in Burkitt lymphoma. Oncogene 26, 3769–3776. doi: 10.1038/sj.onc.1210147
Kohlhaas, S., Garden, O. A., Scudamore, C., Turner, M., Okkenhaug, K., and Vigorito, E. (2009). Cutting edge: the Foxp3 target miR-155 contributes to the development of regulatory T cells. J. Immunol. 182, 2578–2582. doi: 10.4049/jimmunol.0803162
Kovalovsky, D., Uche, O. U., Eladad, S., Hobbs, R. M., Yi, W., Alonzo, E., et al. (2008). The BTB-zinc finger transcriptional regulator PLZF controls the development of invariant natural killer T cell effector functions. Nat. Immunol. 9, 1055–1064. doi: 10.1038/ni.1641
Kwon, D. I., and Lee, Y. J. (2017). Lineage differentiation program of invariant natural killer T cells. Immune Netw. 17, 365–377. doi: 10.4110/in.2017.17.6.365
La Cava, A., Van Kaer, L., and Fu Dong, S. (2006). CD4 + CD25+ Tregs and NKT cells: regulators regulating regulators. Trends Immunol. 27, 322–327. doi: 10.1016/j.it.2006.05.003
Landgraf, P., Rusu, M., Sheridan, R., Sewer, A., Iovino, N., Aravin, A., et al. (2007). A mammalian microRNA expression atlas based on small RNA library sequencing. Cell 129, 1401–1414.
Lang, F., and Cohen, P. (2001). Regulation and physiological roles of serum- and glucocorticoid-induced protein kinase isoforms. Sci. STKE 2001:re17. doi: 10.1126/stke.2001.108.re17
Laplante, M., and Sabatini, D. M. (2009). mTOR signaling at a glance. J. Cell Sci. 122, 3589–3594. doi: 10.1242/jcs.051011
Lee, Y. J., Holzapfel, K. L., Zhu, J., Jameson, S. C., and Hogquist, K. A. (2013). Steady-state production of IL-4 modulates immunity in mouse strains and is determined by lineage diversity of iNKT cells. Nat. Immunol. 14, 1146–1154. doi: 10.1038/ni.2731
Lee, Y. J., Jameson, S. C., and Hogquist, K. A. (2011). Alternative memory in the CD8 T cell lineage. Trends Immunol. 32, 50–56. doi: 10.1016/j.it.2010.12.004
Loffing, J., Flores, S. Y., and Staub, O. (2006). Sgk kinases and their role in epithelial transport. Annu. Rev. Physiol. 68, 461–490. doi: 10.1146/annurev.physiol.68.040104.131654
Michel, M. L., Mendes-Da-Cruz, D., Keller, A. C., Lochner, M., Schneider, E., Dy, M., et al. (2008). Critical role of ROR-gammat in a new thymic pathway leading to IL-17-producing invariant NKT cell differentiation. Proc. Natl. Acad. Sci. U.S.A. 105, 19845–19850. doi: 10.1073/pnas.0806472105
O’Connell, R. M., Kahn, D., Gibson, W. S., Round, J. L., Scholz, R. L., Chaudhuri, A. A., et al. (2010). MicroRNA-155 promotes autoimmune inflammation by enhancing inflammatory T cell development. Immunity 33, 607–619. doi: 10.1016/j.immuni.2010.09.009
Pereira, R. M., Martinez, G. J., Engel, I., Cruz-Guilloty, F., Barboza, B. A., Tsagaratou, A., et al. (2014). Jarid2 is induced by TCR signalling and controls iNKT cell maturation. Nat. Commun. 5:4540.
Pobezinsky, L. A., Etzensperger, R., Jeurling, S., Alag, A., Kadakia, T., Mccaughtry, T. M., et al. (2015). Let-7 microRNAs target the lineage-specific transcription factor PLZF to regulate terminal NKT cell differentiation and effector function. Nat. Immunol. 16, 517–524. doi: 10.1038/ni.3146
Powell, J. D., Pollizzi, K. N., Heikamp, E. B., and Horton, M. R. (2012). Regulation of immune responses by mTOR. Annu. Rev. Immunol. 30, 39–68.
Rodriguez, A., Vigorito, E., Clare, S., Warren, M. V., Couttet, P., Soond, D. R., et al. (2007). Requirement of bic/microRNA-155 for normal immune function. Science 316, 608–611. doi: 10.1126/science.1139253
Sarbassov, D. D., Guertin, D. A., Ali, S. M., and Sabatini, D. M. (2005). Phosphorylation and regulation of Akt/PKB by the rictor-mTOR complex. Science 307, 1098–1101. doi: 10.1126/science.1106148
Savage, A. K., Constantinides, M. G., Han, J., Picard, D., Martin, E., Li, B., et al. (2008). The transcription factor PLZF directs the effector program of the NKT cell lineage. Immunity 29, 391–403. doi: 10.1016/j.immuni.2008.07.011
Seddiki, N., Brezar, V., Ruffin, N., Levy, Y., and Swaminathan, S. (2014). Role of miR-155 in the regulation of lymphocyte immune function and disease. Immunology 142, 32–38. doi: 10.1111/imm.12227
Seiler, M. P., Mathew, R., Liszewski, M. K., Spooner, C. J., Barr, K., Meng, F., et al. (2012). Elevated and sustained expression of the transcription factors Egr1 and Egr2 controls NKT lineage differentiation in response to TCR signaling. Nat. Immunol. 13, 264–271. doi: 10.1038/ni.2230
Sivakumar, V., Hammond, K. J., Howells, N., Pfeffer, K., and Weih, F. (2003). Differential requirement for Rel/nuclear factor kappa B family members in natural killer T cell development. J. Exp. Med. 197, 1613–1621. doi: 10.1084/jem.20022234
Sklarz, T., Guan, P., Gohil, M., Cotton, R. M., Ge, M. Q., Haczku, A., et al. (2017). mTORC2 regulates multiple aspects of NKT-cell development and function. Eur. J. Immunol. 47, 516–526. doi: 10.1002/eji.201646343
Stankovic, S., Gugasyan, R., Kyparissoudis, K., Grumont, R., Banerjee, A., Tsichlis, P., et al. (2011). Distinct roles in NKT cell maturation and function for the different transcription factors in the classical NF-kappaB pathway. Immunol. Cell Biol. 89, 294–303. doi: 10.1038/icb.2010.93
Subramanian, A., Tamayo, P., Mootha, V. K., Mukherjee, S., Ebert, B. L., Gillette, M. A., et al. (2005). Gene set enrichment analysis: a knowledge-based approach for interpreting genome-wide expression profiles. Proc. Natl. Acad. Sci. U.S.A. 102, 15545–15550. doi: 10.1073/pnas.0506580102
Takaesu, G., Kishida, S., Hiyama, A., Yamaguchi, K., Shibuya, H., Irie, K., et al. (2000). TAB2, a novel adaptor protein, mediates activation of TAK1 MAPKKK by linking TAK1 to TRAF6 in the IL-1 signal transduction pathway. Mol. Cell 5, 649–658. doi: 10.1016/s1097-2765(00)80244-0
Tan, B., Mu, R., Chang, Y., Wang, Y. B., Wu, M., Tu, H. Q., et al. (2015). RNF4 negatively regulates NF-kappaB signaling by down-regulating TAB2. FEBS Lett. 589, 2850–2858. doi: 10.1016/j.febslet.2015.07.051
Teng, G., Hakimpour, P., Landgraf, P., Rice, A., Tuschl, T., Casellas, R., et al. (2008). MicroRNA-155 is a negative regulator of activation-induced cytidine deaminase. Immunity 28, 621–629. doi: 10.1016/j.immuni.2008.03.015
Tsai, C. Y., Allie, S. R., Zhang, W., and Usherwood, E. J. (2013). MicroRNA miR-155 affects antiviral effector and effector Memory CD8 T cell differentiation. J. Virol. 87, 2348–2351. doi: 10.1128/jvi.01742-12
Vallabhapurapu, S., Powolny-Budnicka, I., Riemann, M., Schmid, R. M., Paxian, S., Pfeffer, K., et al. (2008). Rel/NF-kappaB family member RelA regulates NK1.1- to NK1.1+ transition as well as IL-15-induced expansion of NKT cells. Eur. J. Immunol. 38, 3508–3519. doi: 10.1002/eji.200737830
Vigorito, E., Kohlhaas, S., Lu, D., and Leyland, R. (2013). miR-155: an ancient regulator of the immune system. Immunol. Rev. 253, 146–157. doi: 10.1111/imr.12057
Wang, J., Li, G., Wu, X., Liu, Q., Yin, C., Brown, S. L., et al. (2019). miR-183-96-182 cluster is involved in invariant NKT cell development, maturation, and effector function. J. Immunol. 203, 3256–3267. doi: 10.4049/jimmunol.1900695
Wei, J., Yang, K., and Chi, H. (2014). Cutting edge: discrete functions of mTOR signaling in invariant NKT cell development and NKT17 fate decision. J. Immunol. 193, 4297–4301. doi: 10.4049/jimmunol.1402042
Zheng, Q., Zhou, L., and Mi, Q. S. (2012). MicroRNA miR-150 is involved in Valpha14 invariant NKT cell development and function. J. Immunol. 188, 2118–2126. doi: 10.4049/jimmunol.1103342
Zhou, L., Seo, K. H., He, H. Z., Pacholczyk, R., Meng, D. M., Li, C. G., et al. (2009). Tie2cre-induced inactivation of the miRNA-processing enzyme Dicer disrupts invariant NKT cell development. Proc. Natl. Acad. Sci. U.S.A. 106, 10266–10271. doi: 10.1073/pnas.0811119106
Keywords: microRNA-155, iNKT cells, innate CD8 T cells, Jarid2, Rictor, Tab2
Citation: Wang J, Li K, Zhang X, Li G, Liu T, Wu X, Brown SL, Zhou L and Mi Q-S (2021) MicroRNA-155 Controls iNKT Cell Development and Lineage Differentiation by Coordinating Multiple Regulating Pathways. Front. Cell Dev. Biol. 8:619220. doi: 10.3389/fcell.2020.619220
Received: 19 October 2020; Accepted: 04 December 2020;
Published: 12 January 2021.
Edited by:
Guangyong Peng, Saint Louis University, United StatesReviewed by:
Deyu Fang, Northwestern University, United StatesJianhua Jianhua, City of Hope National Medical Center, United States
Copyright © 2021 Wang, Li, Zhang, Li, Liu, Wu, Brown, Zhou and Mi. This is an open-access article distributed under the terms of the Creative Commons Attribution License (CC BY). The use, distribution or reproduction in other forums is permitted, provided the original author(s) and the copyright owner(s) are credited and that the original publication in this journal is cited, in accordance with accepted academic practice. No use, distribution or reproduction is permitted which does not comply with these terms.
*Correspondence: Qing-Sheng Mi, UU1JMUBoZmhzLm9yZw==; Li Zhou, bHpob3UxQGhmaHMub3Jn
†These authors have contributed equally to this work