 Gang Liu1†
 Zhenhao Liu
 Yunhe Liu
 Lei Liu
- 1Institute of Biomedical Sciences, Fudan University, Shanghai, China
- 2Key Laboratory of Carcinogenesis and Cancer Invasion, Ministry of Education, Key Laboratory of Carcinogenesis, National Health and Family Planning Commission, Xiangya Hospital, Central South University, Changsha, China
- 3Shanghai Center for Bioinformation Technology, Shanghai, China
DNA methylation dysregulation during carcinogenesis has been widely discussed in recent years. However, the pan-cancer DNA methylation biomarkers and corresponding biological mechanisms were seldom investigated. We identified differentially methylated sites and regions from 5,056 The Cancer Genome Atlas (TCGA) samples across 10 cancer types and then validated the findings using 48 manually annotated datasets consisting of 3,394 samples across nine cancer types from Gene Expression Omnibus (GEO). All samples’ DNA methylation profile was evaluated with Illumina 450K microarray to narrow down the batch effect. Nine regions were identified as commonly differentially methylated regions across cancers in TCGA and GEO cohorts. Among these regions, a DNA fragment consisting of ∼1,400 bp detected inside the HOXA locus instead of the boundary may relate to the co-expression attenuation of genes inside the locus during carcinogenesis. We further analyzed the 3D DNA interaction profile by the publicly accessible Hi-C database. Consistently, the HOXA locus in normal cell lines compromised isolated topological domains while merging to the domain nearby in cancer cell lines. In conclusion, the dysregulation of the HOXA locus provides a novel insight into pan-cancer carcinogenesis.
Introduction
Aberrant DNA methylation during carcinogenesis has been studied for a long period in the past decades. The roles of DNA methylation during carcinogenesis are complex (Patai et al., 2012; Moore et al., 2013; Duruisseaux and Esteller, 2018). A study revealed that gene body DNA methylation systematically enhanced gene expression, as hypermethylation in promoter regions inhibited transcription factor binding and silenced specific genes (Yang et al., 2014). Intergenic DNA methylation influences spurious transcription initiation (Neri et al., 2017). Moreover, DNA methylation in nuclear territories could transform euchromatin into heterochromatin and inhibit gene activation (Bártová and Kozubek, 2006). In addition to gene suppression, some studies also revealed that promoter DNA methylation also recruited specific transcription factors and promoted gene expression (Qiu et al., 2016).
Seeking DNA methylation biomarkers for cancer diagnosis has been emphasized in the past few years (Dor and Cedar, 2018; Pan et al., 2018; Ding et al., 2019; Li et al., 2019b). However, DNA methylation is characterized by tissue heterogeneity. The methylation signatures are maintained from cell-of-origin during carcinogenesis (Zhang and Huang, 2017; Bormann et al., 2018), leading to DNA methylation transformation among cancers that are different. Since the concept that the eight hallmarks of cancer are widely accepted (Hanahan and Weinberg, 2011), it is aimed to find common DNA methylation signatures as biomarkers. Xiaofei et al. (Yang et al., 2017) found four universal hypermethylated CpG sites in DRD5 promoter regions, while only one of them (cg22620090) was differentially methylated in all 15 cancers. Saghafinia et al. (2018) identified hyper- and hypomethylated sites and found converged pathways between genetic and epigenetic alterations. Researchers also developed an algorithm using deep learning for normal-cancer discrimination using DNA methylation sites and achieved about 90% sensitivity and specificity (Liu B. et al., 2019).
However, the past studies focused on the DNA methylation sites shared across cancer types or the DNA methylation pattern of a single gene in some specific cancers (Li et al., 2013, 2019b; Ding et al., 2019). The former cannot give insight into the putative mechanism that how the shared methylation sites occur (Saghafinia et al., 2018), while the latter fails to achieve a pan-cancer signature (Li et al., 2019b). In this study, we identified differentially methylated sites (DMSs) and regions (DMRs) across cancers. Then we analyzed the downstream gene expression and the three-dimensional (3D) chromatin structure to validate the findings. We found that HOXA locus DNA hypermethylation is a commonly shared signature across cancers. The signature causes aberrant chromatin structure and thus influences the co-expression pattern of genes in the HOXA locus.
Materials and Methods
Data Collection
The Cancer Genome Atlas (TCGA) DNA methylation data evaluated by Illumina Human Methylation 450K BeadChip were collected in May 2020 to reduce the batch effect of different platforms. All samples and cohorts were enrolled in this step. The cohorts with a tumor or normal tissues sample size less than 30 were excluded in this step. Only primary tumors were enrolled in tumorous samples, while metastatic or recurrent tumors were omitted to reduce the redundancy with its primary tumor samples.
In Gene Expression Omnibus (GEO) datasets, the datasets were searched with keywords “cancer” or “tumor” and then filtered with Illumina Human Methylation 450K BeadChip. The “Entry type,” “Organisms,” and “Attribute name” were set as “Series,” “Homo Sapiens,” and “Tissue,” respectively, in May 2020. Subsequently, each dataset was annotated manually. The dataset with a sample size of less than 60 was excluded. The datasets that were annotated with the same cancer type but not in the same cohort were combined for further analyses.
Data Pre-processing and Normalization
The data were downloaded in the raw data format. The normalization method was selected as quantile. Due to the large sample size, the normalization step was not performed with current R or python packages, which are not available for the file size. In-house scripts were used in this step. Since all samples originated from TCGA and GEO datasets were evaluated with Illumina Human Methylation 450K BeadChip, the probes used were identical. The average values for each probe were calculated in all samples enrolled. The average probe values were sorted and assigned to each sample according to the ranks of probes.
Differentially Methylated Site and Region Identification
The normalized data were read, and the DMRs were identified using the R package “minfi” (Fortin et al., 2017). The adjusted p values were set as 0.01. Considering that CpG sites in the Illumina Human Methylation 450K BeadChip platform were predetermined and that the DMSs consist of a large proportion of all sites in the platform, another parameter for screening was used. To evaluate the diagnostic value of each CpG site to discriminate the cancerous and normal tissues, the area under the receiver operating characteristic (AUROC) curve (AUC) was employed for further identification. The average threshold AUCs of each probe across cancers were set as 0.75. Regions with over 10 coordinately contiguous CpG sites were identified as DMRs. Since the annotation of Illumina Human Methylation 450K BeadChip is based on hg18, the coordinates were converted to hg19 using the UCSC tool “liftover.”
Gene Expression and Hi-C Data Processing and Visualization
Gene expression data of TCGA cohorts were downloaded from UCSC Xena (Goldman et al., 2020)1 website. Gene expression was estimated as log2(x + 1) transformed RSEM normalized count. The expression values of HOXA genes (HOXA1, HOXA2, HOXA3, HOXA4, HOXA5, HOXA6, HOXA7, HOXA9, HOXA10, HOXA11, and HOXA13) were retrieved. The gene expression correlations of the genes were calculated using the “Pearson” correlation method on the R platform, and the result was visualized with heatmap plotted by R package “pheatmap.” The correlation matrix was plotted for all 11 cancer types.
Hi-C data were retrieved and visualized using “juicebox” (Robinson et al., 2018), which collected the Hi-C data of cell lines and tissues in September 2020. Among these datasets, only human cell lines mapped with the hg19 genome version were used for further analyses. If samples have replicates, the replicates were combined. The target region for display was selected as upstream 200 kb of DMRs to its downstream 200 kb (DMRs ± 200 kb). The normalization method for each sample was used as “Balanced.”
Statistical Analyses and Software
All analyses were performed with R language2 (version 4.0.2, 2020-6-20). The AUCs were calculated using the R package “pROC” (Robin et al., 2011). Survival analyses were implemented using package “survival.” The correlation matrix was plotted with package “pheatmap.” The Manhattan plot was drawn using the R package “qqman.” The Hi-C data were downloaded and visualized with software named “juicebox,” and relative regions of HOXA genes were visualized with UCSC genome browser (Kent et al., 2002). During analyses, p < 0.05 was considered to be statistically significant.
Results
Data Collection
All DNA methylation datasets evaluated by Illumina Human Methylation 450K BeadChip in TCGA cohorts were used in this study. Datasets with a sample size of 30 or more per group (normal and tumor groups) were retained. As a result, 10 cancer types, including breast cancer, colorectal cancer, head and neck carcinoma, kidney clear cell carcinoma, kidney papillary cell carcinoma, liver cancer, lung adenocarcinoma, lung squamous cell carcinoma, prostate cancer, and thyroid cancer cohorts, were enrolled in this study. Only primary tumor and adjacent normal tissues were used, while metastatic and recurrent tissues were excluded. In addition to the TCGA cohort, cancerous datasets from GEO were also collected using keyword searching and manual annotation. The detailed sample size is shown in Table 1.
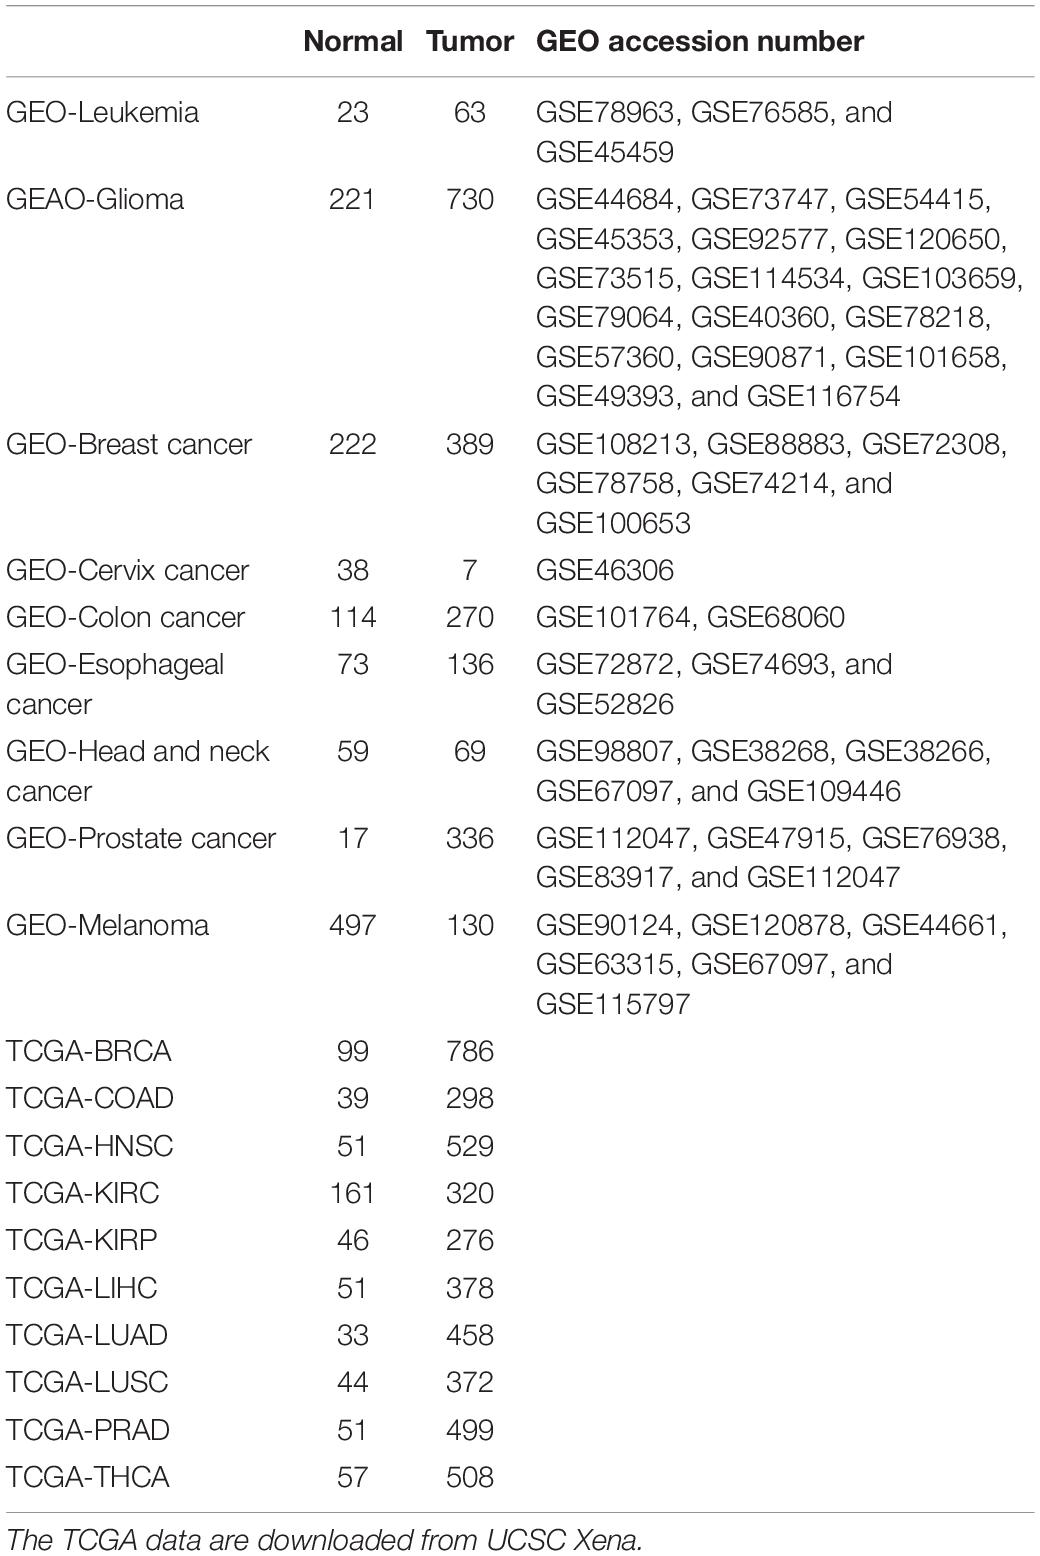
Table 1. Datasets and corresponding sample number in the Cancer Genome Atlas (TCGA) and Gene Expression Omnibus (GEO) enrolled.
Differentially Methylated Site and Region Identification
To reduce the false-positive rate, the normal or cancerous sample size of each cancer type was set to at least 30. The beta values of each CpG were calculated. In each cancer type, the methylation level of each site was compared between normal and cancerous tissues. The DMSs and DMRs were identified. As shown in Figure 1A, some DMRs were commonly shared by different cancer types in TCGA cohorts. The regions could also be detected in the GEO validation cohort (Figure 1B). In addition to the methylation difference, the diagnostic value of each CpG site’s beta value to discriminate the normal and cancerous tissues was evaluated by the AUC (Figures 1C,D). Consistently, these regions were proved to be good discriminators using AUROCs. Detailed information for some regions is shown in Supplementary Figure 1.
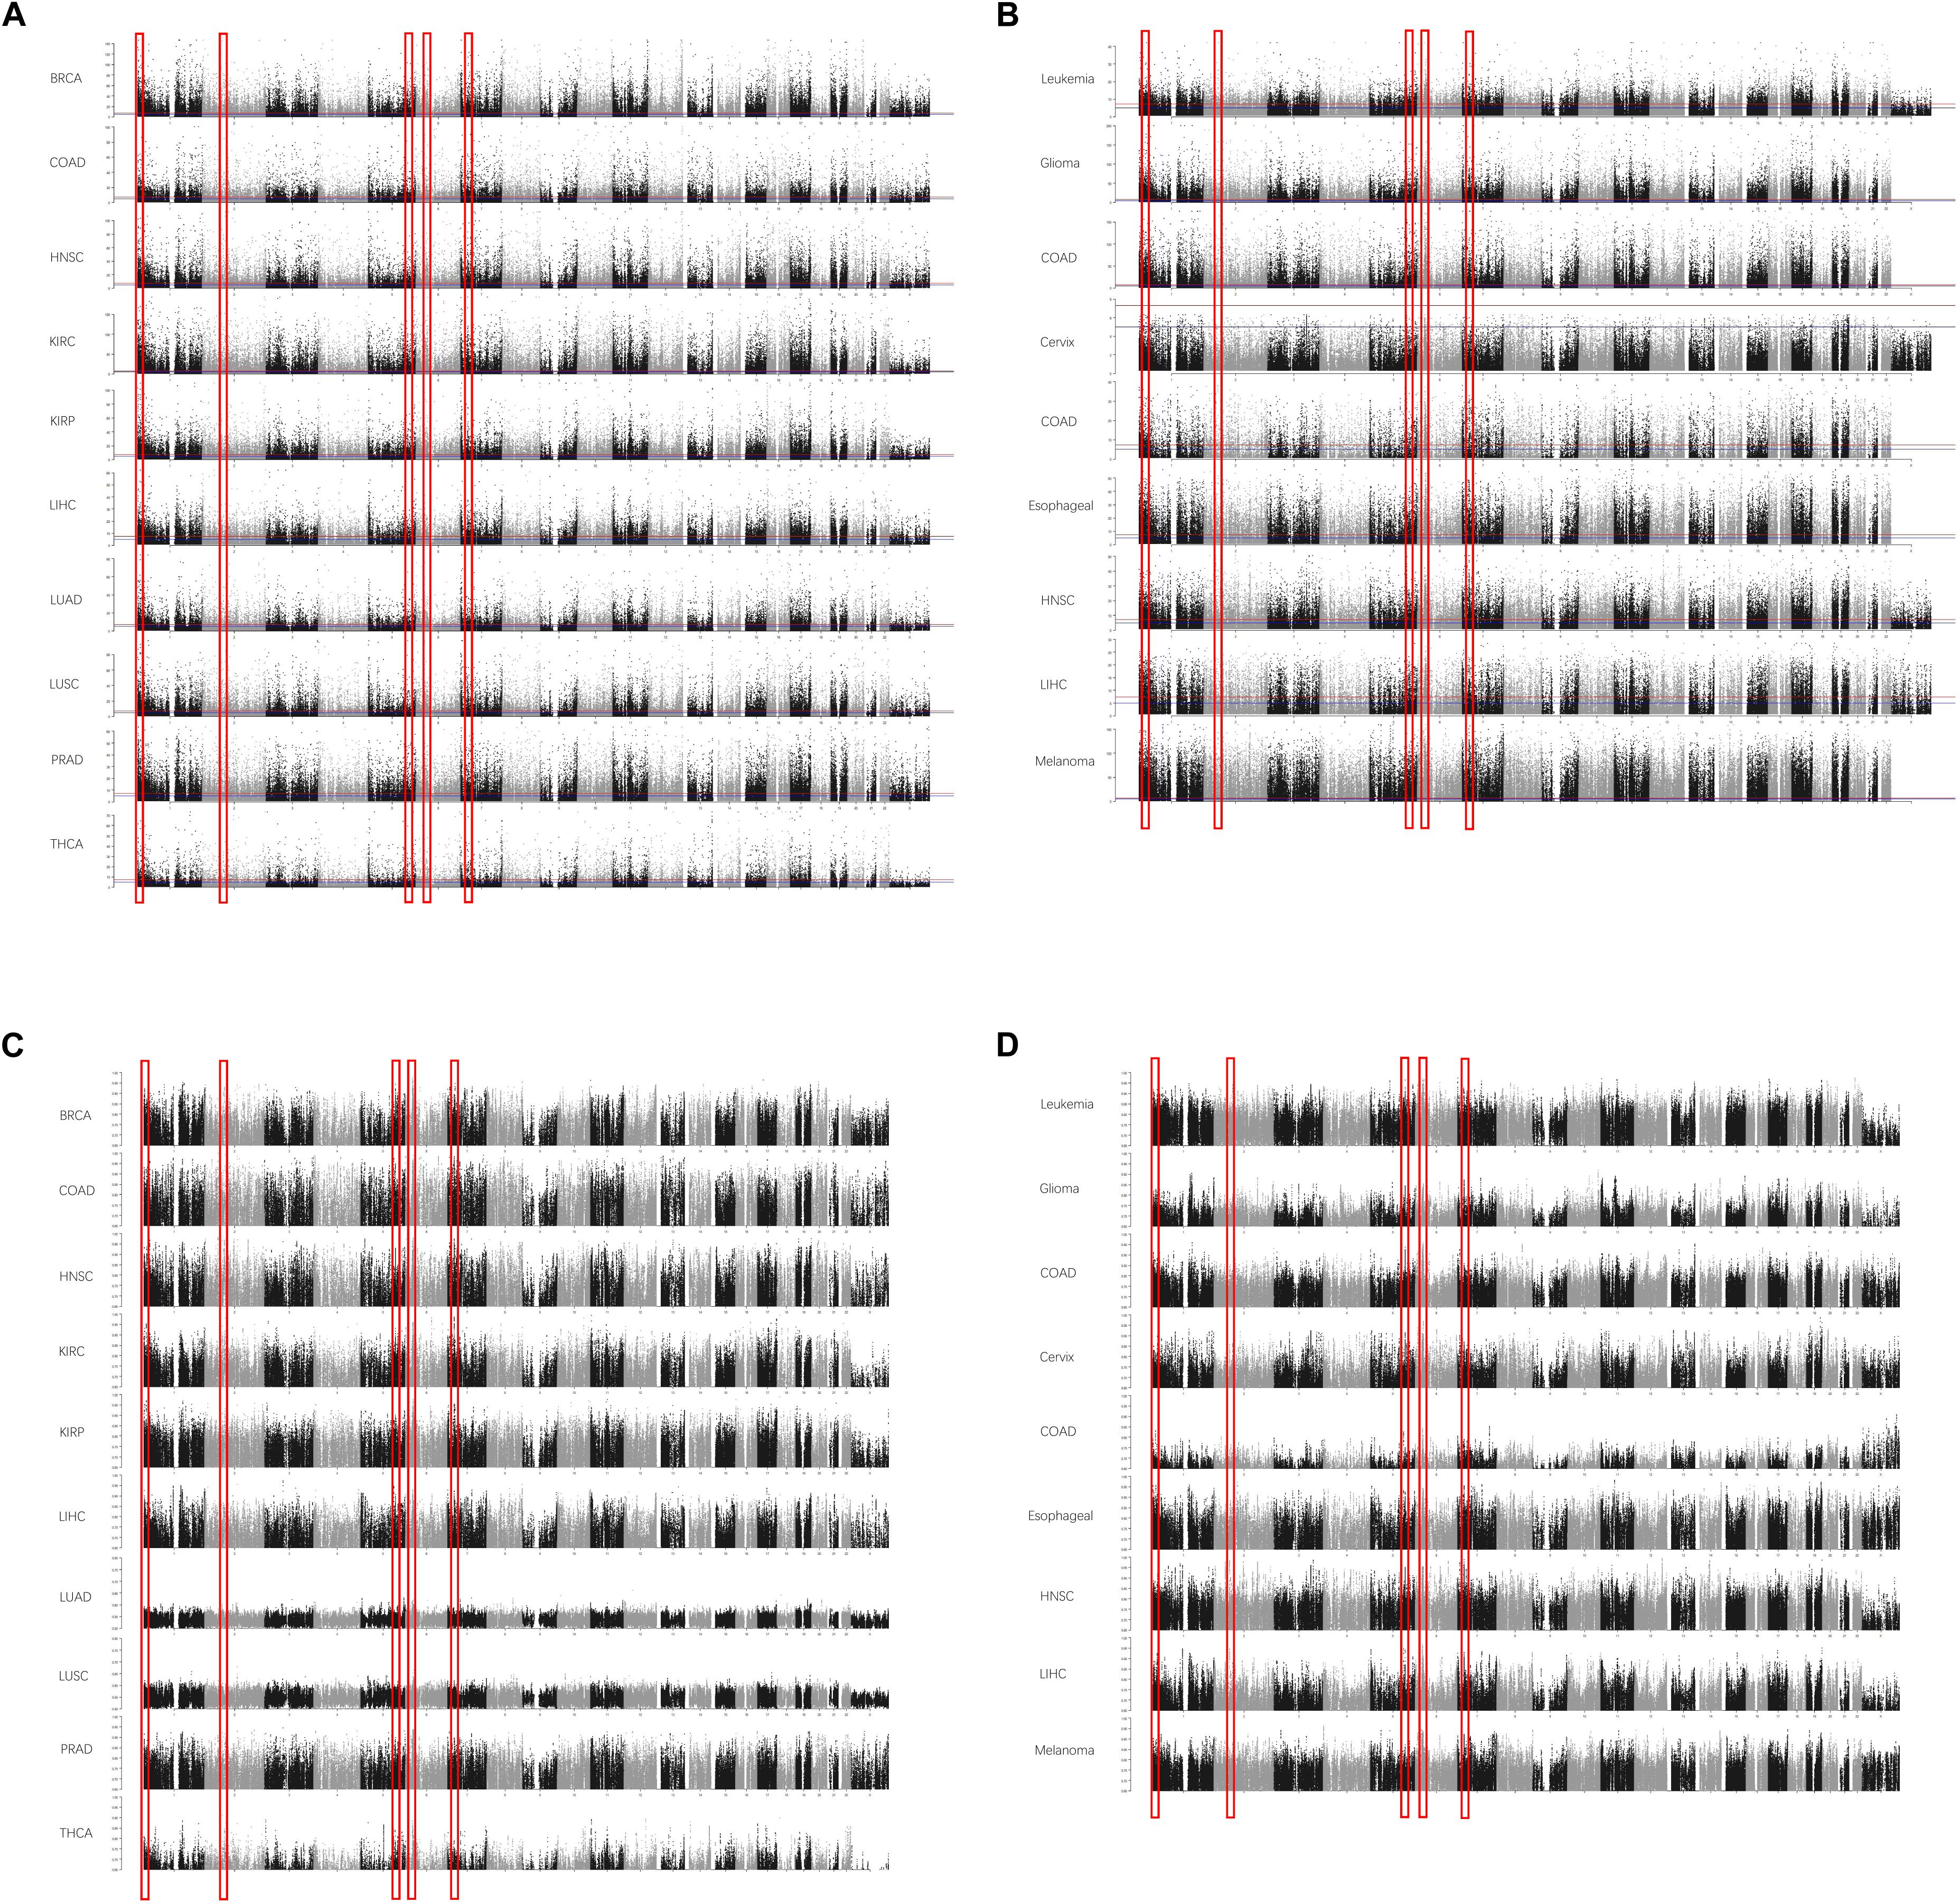
Figure 1. The differentially methylated sites (DMSs) and regions (DMRs) identified in cancers in Manhattan plot. Some DMSs are identified according to the false discovery rate (FDR) in The Cancer Genome Atlas (TCGA) dataset (A) and Gene Expression Omnibus (GEO) dataset (B). The area under the receiver operating characteristic (AUROC) curves (AUCs) are also consistent with this [(C) AUCs in TCGA; (D) AUCs in GEO]. The x-axis is the coordinates in the chromosomes, and the y-axis is the FDR values (A,B) and AUROCs (C,D).
Afterward, the DMRs were also identified according to the AUROCs and DMSs determined by the false discovery rate. The DMRs were defined as at least 10 coordinately continuous DMSs, whose AUROCs on discriminating the normal and cancerous tissues were at least 0.75. The candidate regions should also contain at least three CpG sites per kilobase. Accordingly, nine DMRs were identified (Table 2).
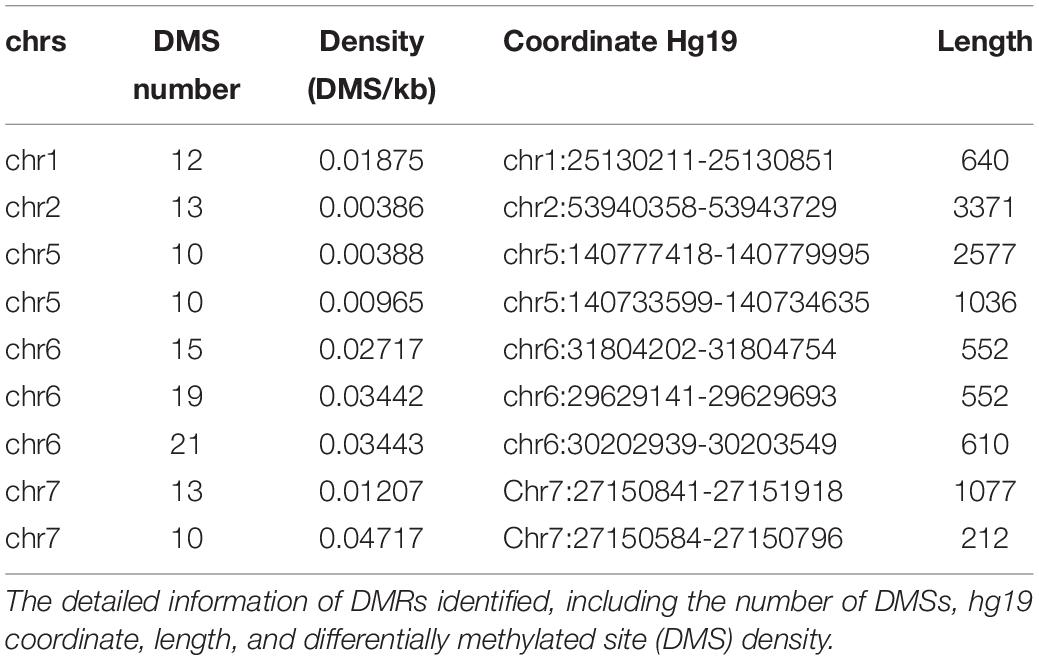
Table 2. Differentially methylated regions (DMRs) identified as common DMRs across cancers.
DNA Hypermethylation at Differentially Methylated Regions
Among the DMRs identified, we noticed that two regions in chromosome 7 were coordinately close. These two regions spanning 1,334 kb, containing 23 DMSs, formed the highest DMS density region (CpG/kb). In the following steps, these regions were combined for further analyses. The methylation levels of CpG sites were compared between normal and cancerous tissues across cancer types. As shown in Figure 2A, CpG sites in this combined region were significantly differentially methylated in TCGA cohorts. These results could also be consistently observed in the GEO cohort (Figure 2B), despite that some cancer types were not overlapping. Most CpG sites in this region were hypermethylated in TCGA cancer cohorts, compared with the normal cohorts. This finding is reproductive in GEO cohorts. These results collectively indicate that aberrant DNA methylation in the selected region is a common signature during carcinogenesis.
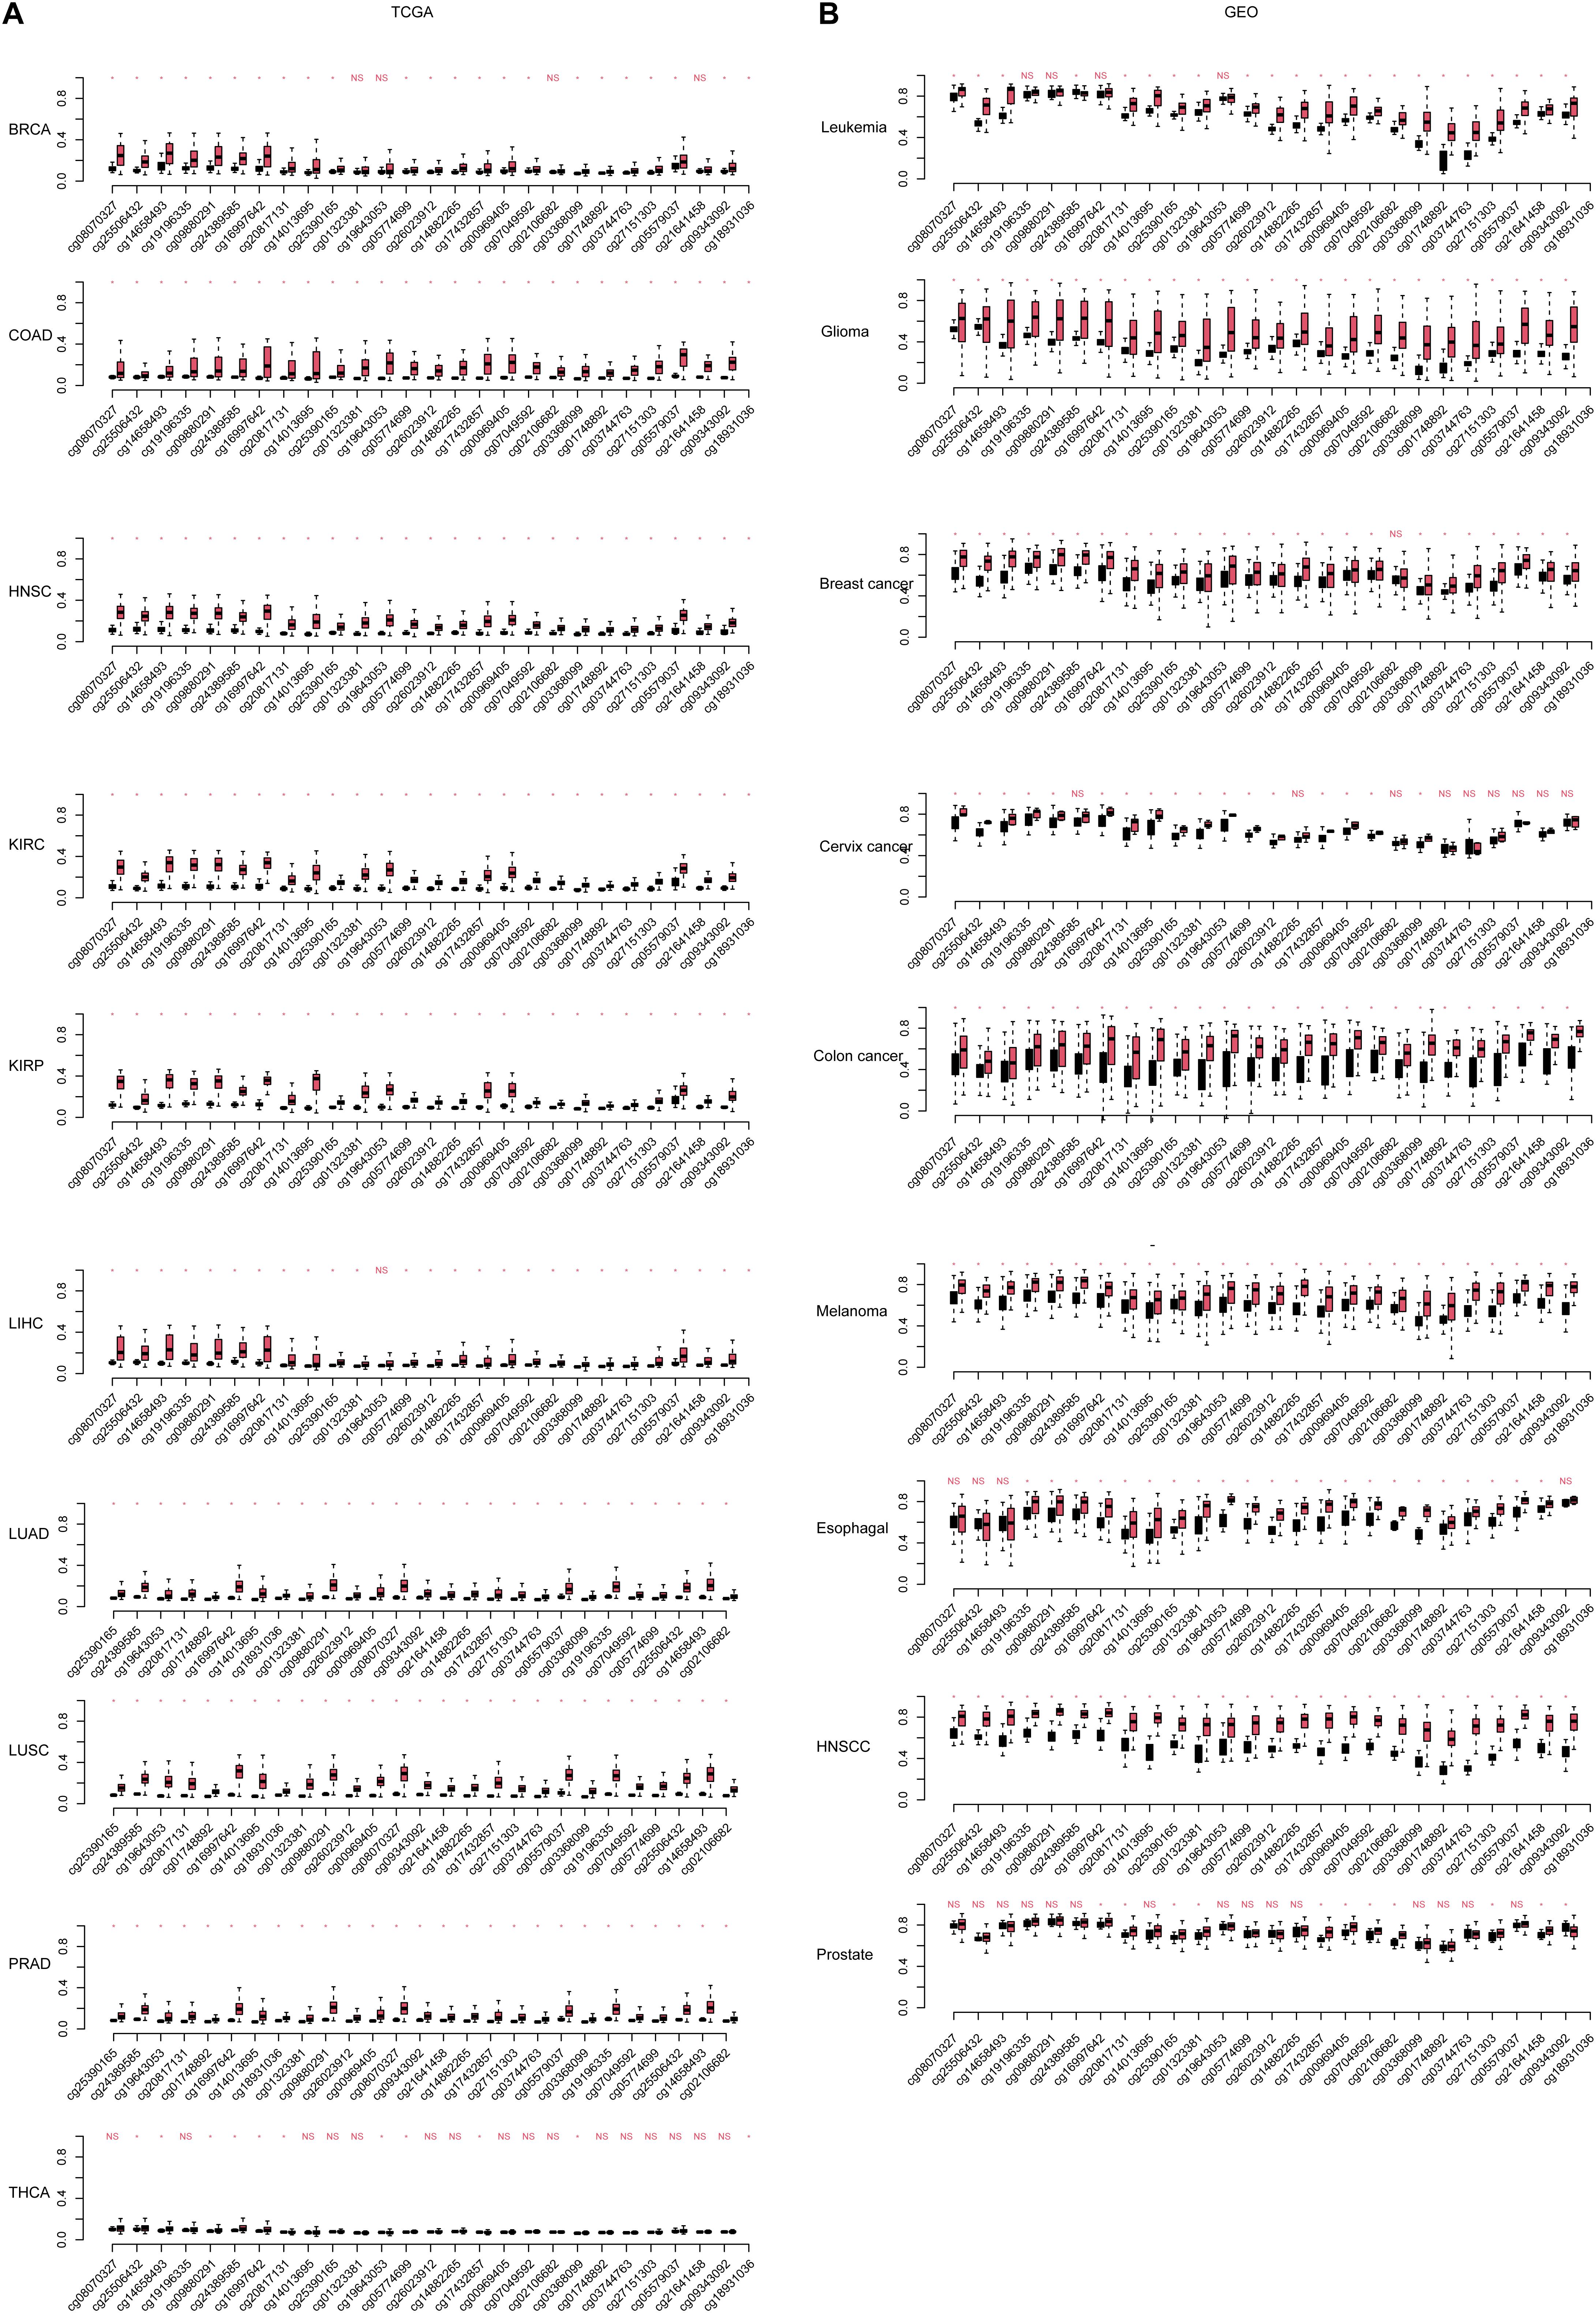
Figure 2. The continuous differentially methylated sites in the HOXA locus across cancers. The significance of each site in each cancer [including (A) The Cancer Genome Atlas (TCGA) and (B) Gene Expression Omnibus (GEO)] is listed. The a-axis is the CpG sites in normal and cancer (black, normal; red, cancer), and the y-axis is the relative beta-values. The CpG sites were sorted according the coordinate. “NS” indicates not significant, and “*” is statistically significant.
Genes Inside HOXA Locus Have Dysregulated Co-expression Pattern
Next, the region was mapped to the human reference genome and was found to be located at the HOXA locus. Interestingly, instead of the HOXA locus boundary, this region was mapped inside the locus (Figure 3A) by separating the HOXA genes into two parts. One part contains HOXA1, HOXA2, HOXA3, HOXA4, and HOXA5, while the other part consists of HOXA7, HOXA9, HOXA10, HOXA11, and HOXA13. The three prime untranslated region (UTR) of HOXA6 is inside this region (Figure 3B).
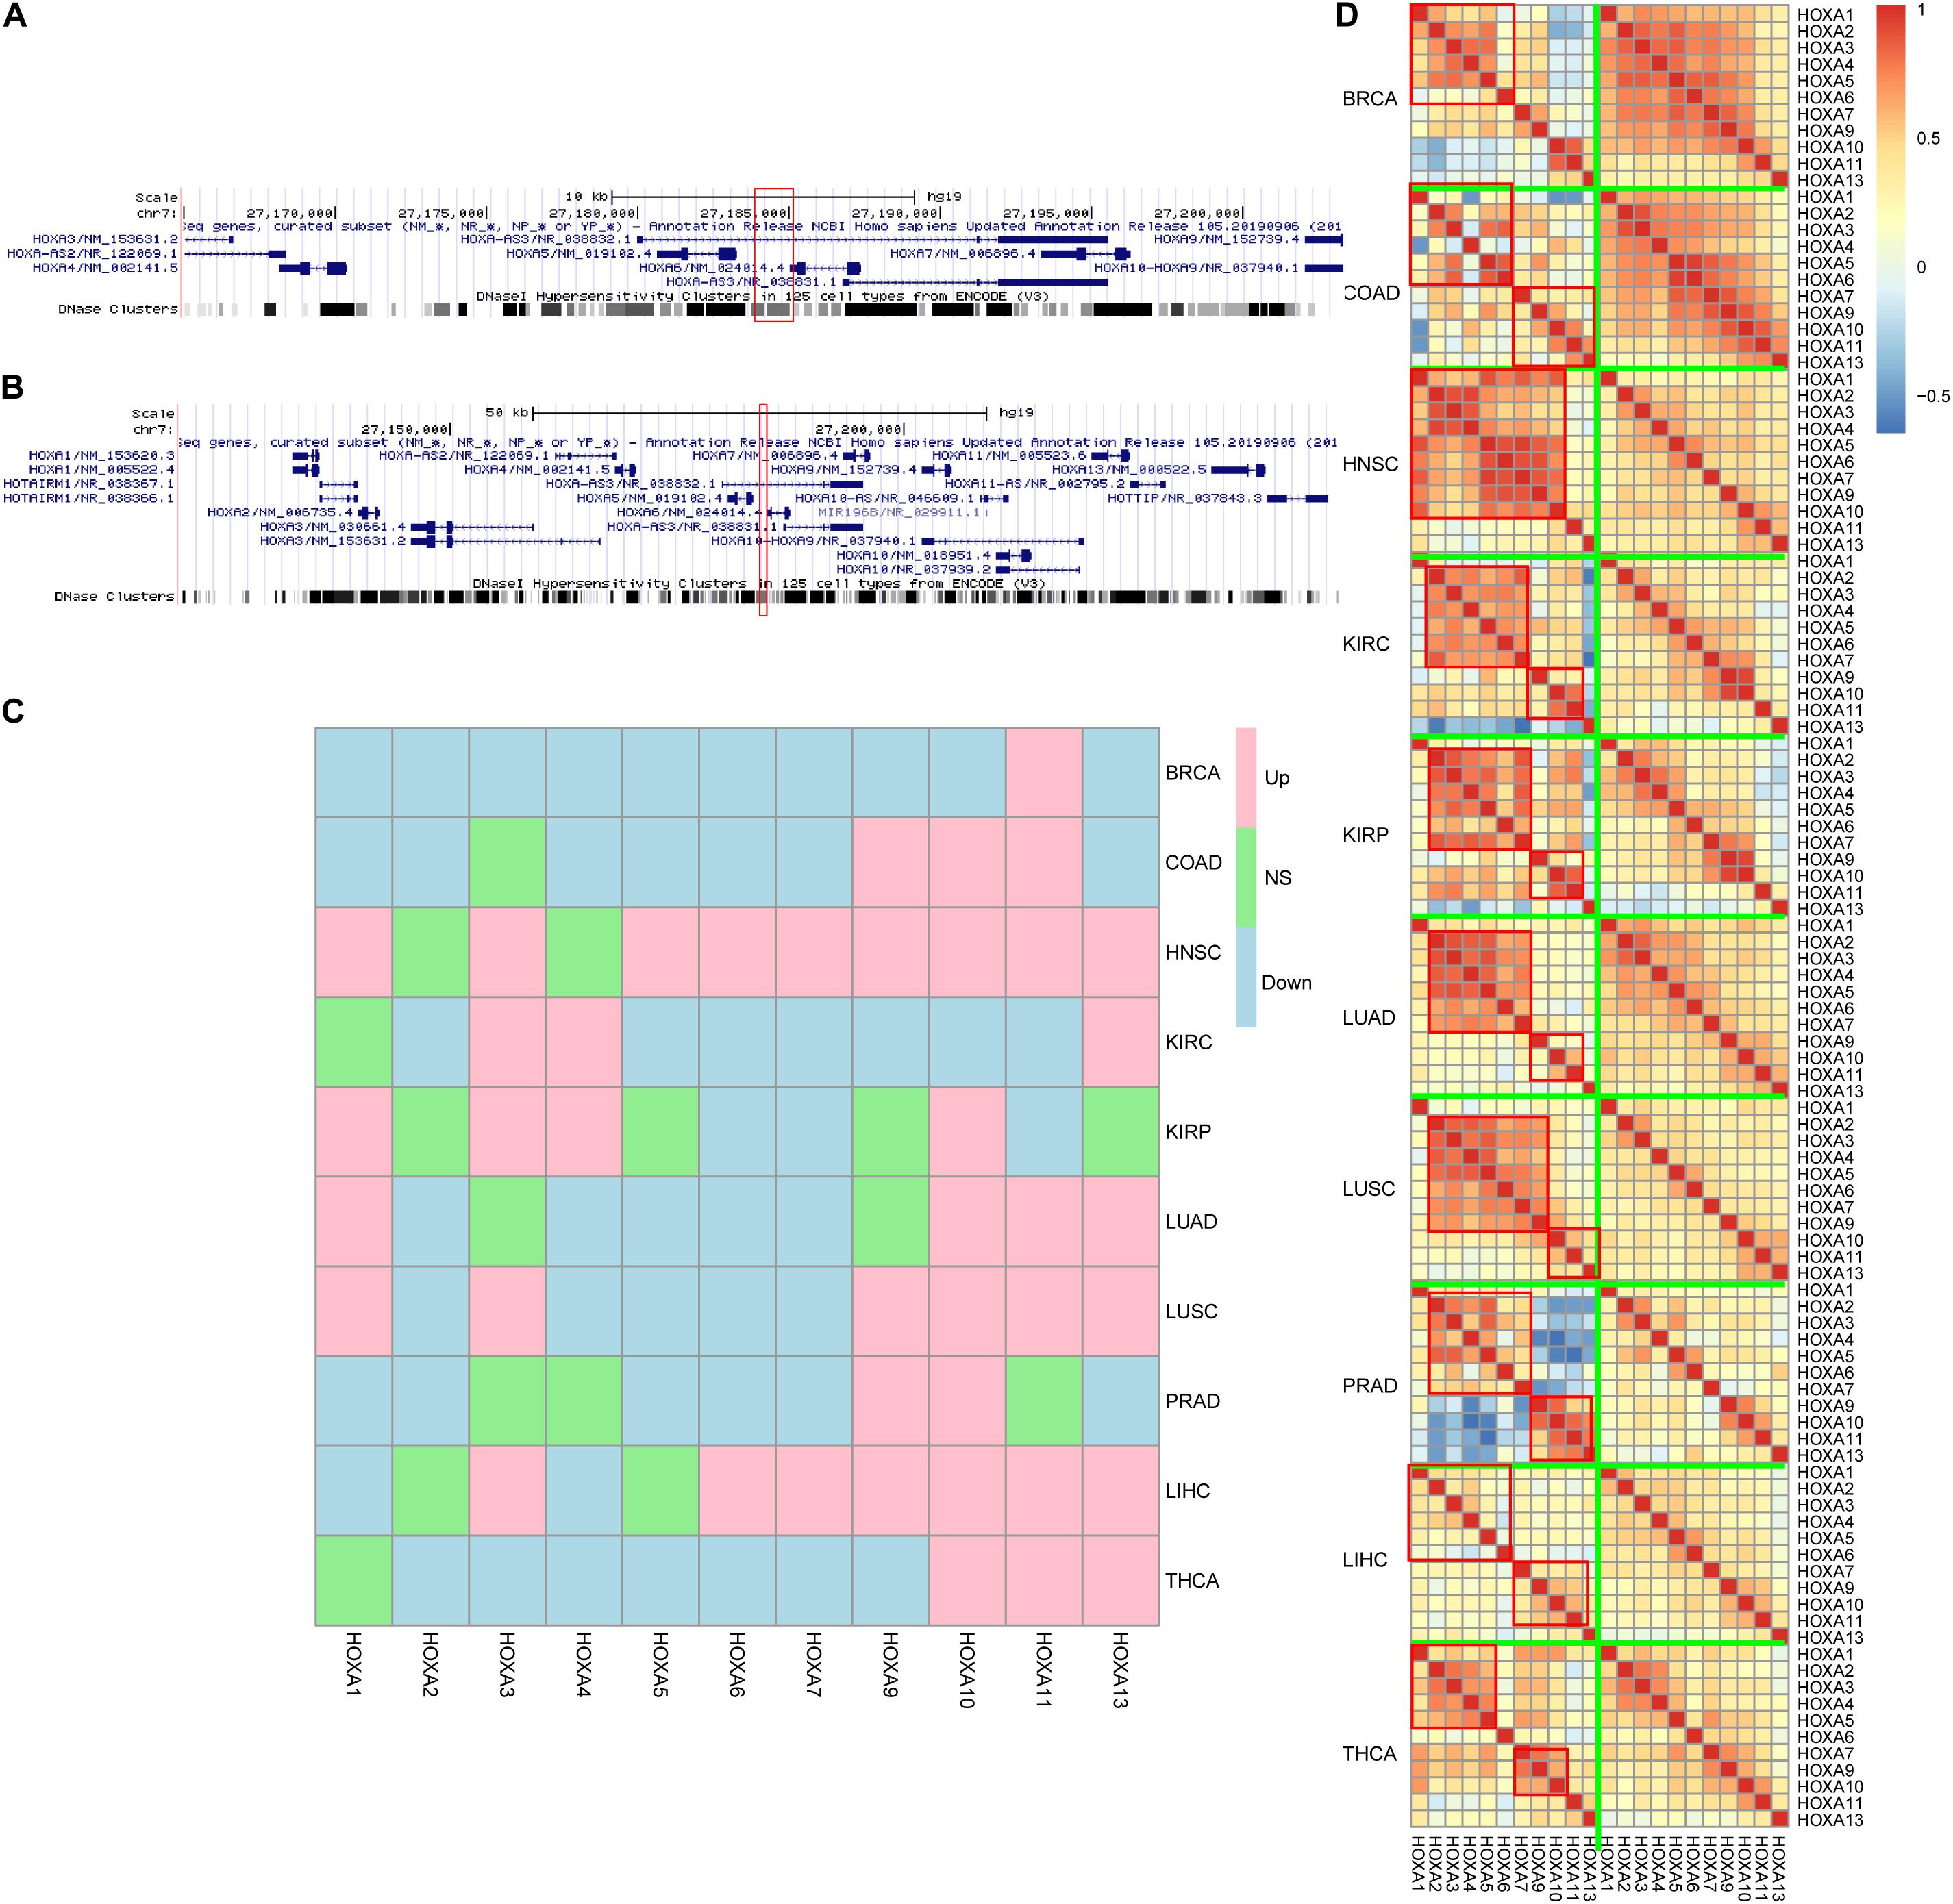
Figure 3. HOXA locus and gene expression. The differentially methylated regions (DMRs) located in the HOXA locus (A,B), between HOXA5 and HOXA6. Despite that the genes were not consistently up- or down-regulated across cancers (C), the co-regulation pattern decreased during carcinogenesis (D). “Down,” “Up,” and “NS” refer to significantly down-regulated, significantly up-regulated, and not significant.
Classically, aberrant DNA methylation is related to dysregulated gene expression. Thus, the gene expression differences between normal and cancers were compared to evaluate the impact of hypermethylation in this region. The results were somewhat controversial. On the one hand, HOXA genes were differently expressed across cancers, which was consistent with the aberrant DNA methylation profile in this region. On the other hand, the gene expression trends during carcinogenesis across cancers were not similar, while some genes were up-regulated and some were down-regulated (Figure 3C) across cancers.
An important role for DNA hypermethylation is euchromatin–heterochromatin transformation, which is reflected by gene co-expression patterns. Thus, gene co-expression patterns of the HOXA locus across cancers were analyzed. As shown in Figure 3D, HOXA gene expression was modularized in normal tissues but transformed to be stochastic in cancerous tissues. In normal tissue, HOXA2, HOXA3, HOXA4, HOXA5, and HOXA6 were strongly co-expressed, and so were HOXA9, HOXA10, HOXA11, and HOXA13. However, the co-expression pattern was disrupted in cancerous tissues. The modularized co-expression clusters were separated at HOXA6 or HOXA7, which was consistent with our finding that UTR of HOXA6 was hypermethylated. Thus, we suspected that DNA hypermethylation of this region disrupted the modularized co-expression pattern in cancers.
3D Chromatin Structure of HOXA Locus During Carcinogenesis
Observing the disrupted modularized co-expression pattern, which may be caused by hypermethylation of this region, we seek to investigate if there exists 3D DNA structure transformation in this region during carcinogenesis of cancers. Several cancer cell lines and normal cell lines from public database were used for validation. As shown in Figure 4A, downstream of the topologically associating domain (TAD) contains a part of the HOXA locus in normal tissues while the other part is not. The boundary between the parts is located at the DMR we identified. However, the boundary inside the HOXA locus cannot be detected in cancerous tissues. Since the HOXA family locus was combined with the downstream TAD, it was promoted to investigate the co-expression correlation between this gene and the downstream genes. Here, we selected the nearest gene TAX1BP1, locating about ∼700 kb away from the HOXA locus. As shown in Figures 4B,C, the expression of TAX1BP1 was significantly associated with most HOXA family genes across cancers, but not in normal tissues. Besides, the TAD upstream is also changed. These results collectively indicate that the hypermethylation at the HOXA locus affects 3D chromatin structure and regulates gene expression.
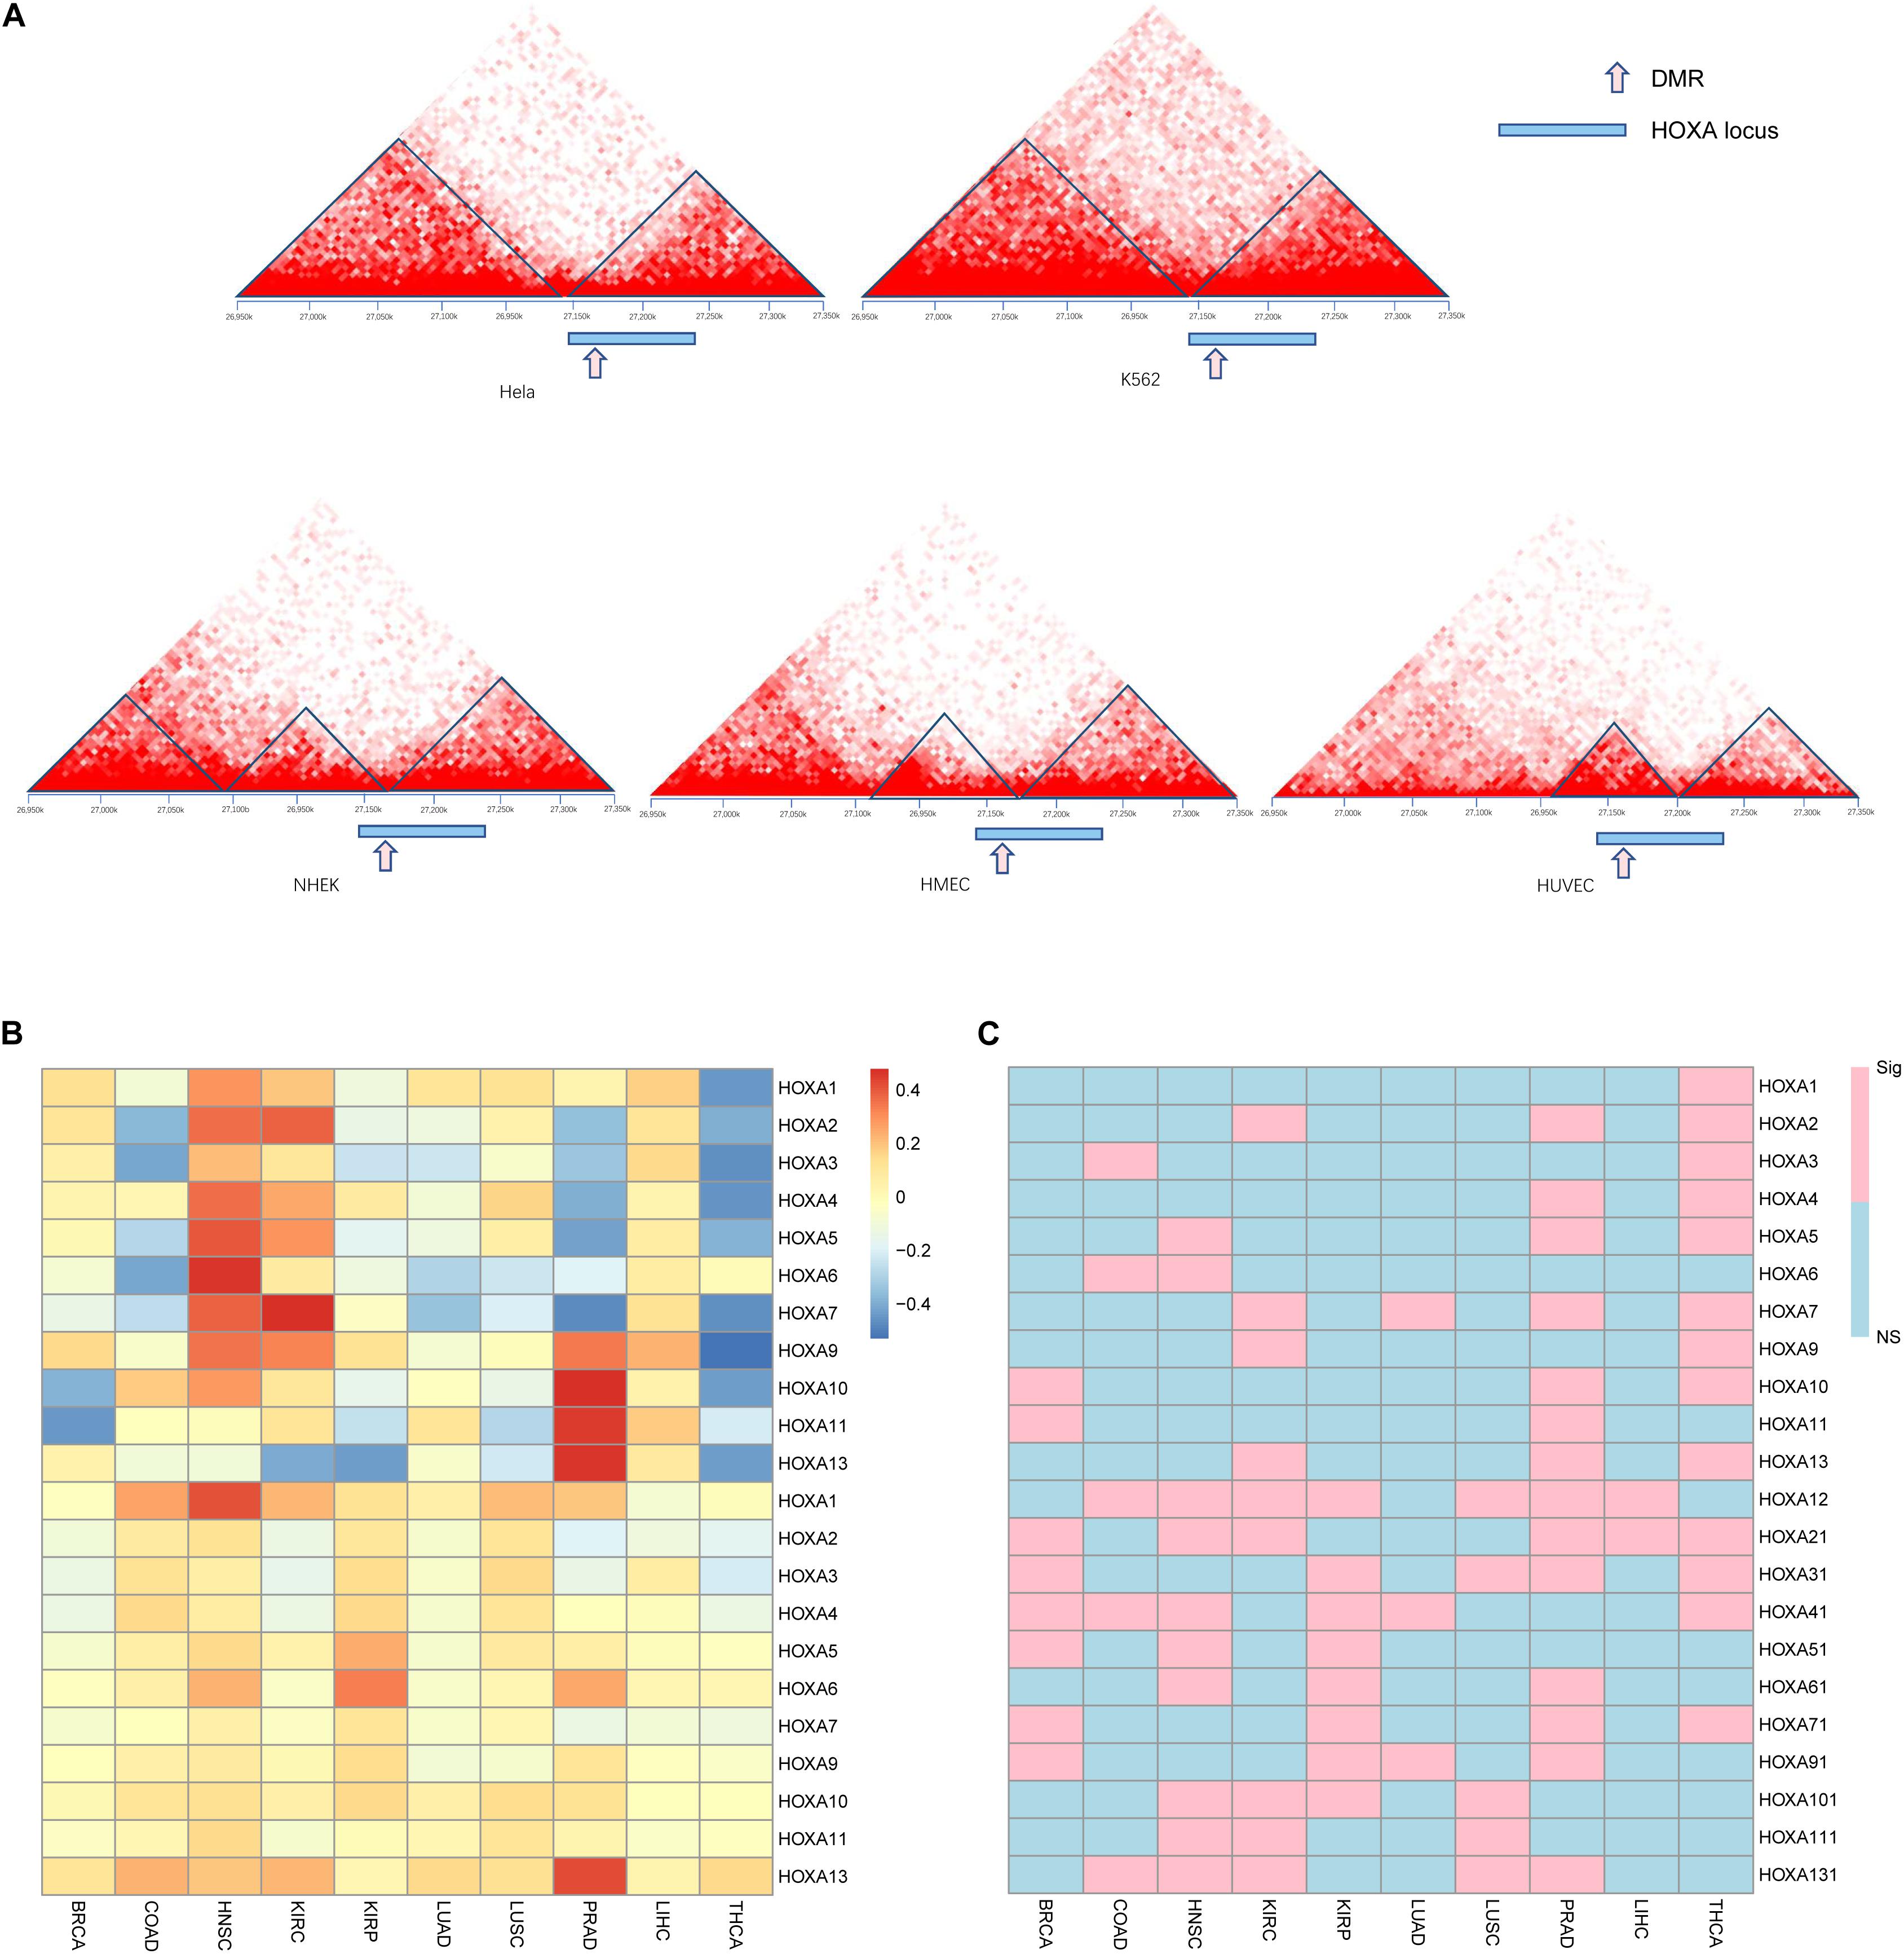
Figure 4. Gene regulation pattern in cancerous and normal cell lines. The topological regions (A), relative sites of differentially methylated regions (DMRs), and the HOXA locus was shown. The upper panel is cancer cell lines, and the lower panel is normal cell lines. The Pearson correlation between TAX1BP1 (B) and p values (C) is shown. “NS” indicates not significant and “Sig” statistically significant.
Discussion
DNA alterations are considered to be a driving force for carcinogenesis. The correlation between genetic alteration and 3D nuclear structure has been investigated. The spatially proximate somatic co-mutations tend to affect cancer driver genes and benefit cancer cells in growth and metastasis (Shi et al., 2016). Further classifying somatic mutations into active and inactive domains help discover the interplay between 3D genome organization and carcinogenesis (Akdemir et al., 2020). In addition to genetic alterations, epigenetic alterations are also reported to re-configure nuclear territories (Lee et al., 2019; McLaughlin et al., 2019). This study aims to find commonly altered methylation regions during carcinogenesis.
HOXA family has been widely reported for their prognostic role in tumorigenesis. For example, HOXA1 gene expression level is reported to enhance proliferation and metastasis in prostate cancer (Wang et al., 2015), breast cancer (Liu J. et al., 2019), and gastric cancer (Yuan C. et al., 2016) and predict poor prognosis in non-small-cell carcinoma (Zhang Y. et al., 2018). Abnormal DNA methylation of HOXA2 promoter regions causes dysregulation of gene expression, therefore influencing the invasion, prognosis, and clinical characteristics of colorectal cancer, glioma, and nasopharyngeal carcinoma (Li et al., 2013, 2019a; Liu et al., 2020). The reports regarding HOXA3 are controversial across cancers. It is shown to promote tumor growth in colon cancer (Zhang X. et al., 2018). However, it is down-regulated in lung cancer during carcinogenesis (Gan et al., 2018). In the meantime, abnormal promoter DNA methylation was also reported. Similarly, the role of HOXA4 gene expression during carcinogenesis, prognosis, and drug resistance is also different among cancers (Bhatlekar et al., 2018; Miller et al., 2018; Tang et al., 2019). The gene expressions and functions of HOXA5 (Ordóñez-Morán et al., 2015; Zhang et al., 2017; Peng et al., 2018), HOXA6 (Wu et al., 2018, 2019), HOXA7 (Tang et al., 2016), HOXA9 (Fu et al., 2017; de Bock et al., 2018), HOXA10 (Chen et al., 2019; Hatanaka et al., 2019), and HOXA11 (Zhang R. et al., 2018) are also controversial across cancers, except for HOXA13 (He et al., 2017). Specifically, 3′ non-coding HOXA mutation was detected in acute myeloid leukemia (Akdemir et al., 2020). In this work, our results revealed that the inconsistency resulted from a universal 3D chromatin transformation in the HOXA locus that may be caused by hypermethylation in this region.
The epigenetic alteration may be used as a biomarker for cancer diagnosis. In recent years, epigenetics, especially DNA methylation, has been emphasized (Tsou et al., 2002; Hao et al., 2017). Due to the tissue-specific pattern, DNA methylation was used to discriminate the tissue of origin for cancers (Yuan Y. et al., 2016; Kang et al., 2017), along with genomic signatures (Yuan et al., 2018). However, cancer alert is an essential step for an accurate diagnosis. Thus, the pan-cancer biomarker is still a crucial issue for cancer diagnosis. Our study may be used for cancer alert if the ctDNA of HOXA regions can be detected in the plasma.
One of the limitations of this study is that the direct causality between DNA methylation and chromatin structure cannot be validated due to current technology limitations. Another limitation is that despite global DNA methylation normalization among batches, the batch effect caused by operations during experiments, especially in the same cancer type derived from the GEO database, in which a cohort may consist of several datasets, cannot be removed.
Data Availability Statement
The original contributions presented in the study are included in the article/supplementary material, further inquiries can be directed to the corresponding author/s.
Author Contributions
LL, GL, and ZL designed the study. GL, YL, and XX analyzed the data. GL, XS, and LL interpreted the results. GL and XX visualized the results. All authors wrote and revised the manuscript.
Funding
This study was supported by the Shanghai Committee of Science and Technology, China (Grant No. 18511102704), National Key Research and Development Program of China (No. 2018YFC0910700), National Key Research and Development Program of China (No. 2018YFC0910700), and National Natural Science Foundation of China (#91846302) to LL.
Conflict of Interest
The authors declare that the research was conducted in the absence of any commercial or financial relationships that could be construed as a potential conflict of interest.
Supplementary Material
The Supplementary Material for this article can be found online at: https://www.frontiersin.org/articles/10.3389/fcell.2021.649168/full#supplementary-material
Footnotes
References
Akdemir, K. C., Le, V. T., Kim, J. M., Killcoyne, S., King, D. A., Lin, Y. P., et al. (2020). Somatic mutation distributions in cancer genomes vary with three-dimensional chromatin structure. Nat. Genet. 52, 1178–1188. doi: 10.1038/s41588-020-0708-0
Bártová, E., and Kozubek, S. (2006). Nuclear architecture in the light of gene expression and cell differentiation studies. Biol. Cell 98, 323–336. doi: 10.1042/bc20050099
Bhatlekar, S., Viswanathan, V., Fields, J. Z., and Boman, B. M. (2018). Overexpression of HOXA4 and HOXA9 genes promotes self-renewal and contributes to colon cancer stem cell overpopulation. J. Cell Physiol. 233, 727–735. doi: 10.1002/jcp.25981
Bormann, F., Rodríguez-Paredes, M., Lasitschka, F., Edelmann, D., Musch, T., Benner, A., et al. (2018). Cell-of-Origin DNA methylation signatures are maintained during colorectal carcinogenesis. Cell Rep. 23, 3407–3418. doi: 10.1016/j.celrep.2018.05.045
Chen, W., Wu, G., Zhu, Y., Zhang, W., Zhang, H., Zhou, Y., et al. (2019). HOXA10 deteriorates gastric cancer through activating JAK1/STAT3 signaling pathway. Cancer Manag. Res. 11, 6625–6635. doi: 10.2147/cmar.S201342
de Bock, C. E., Demeyer, S., Degryse, S., Verbeke, D., Sweron, B., Gielen, O., et al. (2018). HOXA9 cooperates with activated JAK/STAT signaling to drive leukemia development. Cancer Discov. 8, 616–631. doi: 10.1158/2159-8290.Cd-17-0583
Ding, W., Chen, G., and Shi, T. (2019). Integrative analysis identifies potential DNA methylation biomarkers for pan-cancer diagnosis and prognosis. Epigenetics 14, 67–80. doi: 10.1080/15592294.2019.1568178
Dor, Y., and Cedar, H. (2018). Principles of DNA methylation and their implications for biology and medicine. Lancet 392, 777–786. doi: 10.1016/s0140-6736(18)31268-6
Duruisseaux, M., and Esteller, M. (2018). Lung cancer epigenetics: from knowledge to applications. Semin. Cancer Biol. 51, 116–128. doi: 10.1016/j.semcancer.2017.09.005
Fortin, J. P., Triche, T. J. Jr., and Hansen, K. D. (2017). Preprocessing, normalization and integration of the illumina HumanMethylationEPIC array with minfi. Bioinformatics 33, 558–560. doi: 10.1093/bioinformatics/btw691
Fu, Z., Chen, C., Zhou, Q., Wang, Y., Zhao, Y., Zhao, X., et al. (2017). LncRNA HOTTIP modulates cancer stem cell properties in human pancreatic cancer by regulating HOXA9. Cancer Lett. 410, 68–81. doi: 10.1016/j.canlet.2017.09.019
Gan, B. L., He, R. Q., Zhang, Y., Wei, D. M., Hu, X. H., and Chen, G. (2018). Downregulation of HOXA3 in lung adenocarcinoma and its relevant molecular mechanism analysed by RT-qPCR, TCGA and in silico analysis. Int. J. Oncol. 53, 1557–1579. doi: 10.3892/ijo.2018.4508
Goldman, M. J., Craft, B., Hastie, M., Repeèka, K., McDade, F., Kamath, A., et al. (2020). Visualizing and interpreting cancer genomics data via the Xena platform. Nat. Biotechnol. 38, 675–678. doi: 10.1038/s41587-020-0546-8
Hanahan, D., and Weinberg, R. A. (2011). Hallmarks of cancer: the next generation. Cell 144, 646–674. doi: 10.1016/j.cell.2011.02.013
Hao, X., Luo, H., Krawczyk, M., Wei, W., Wang, W., Wang, J., et al. (2017). DNA methylation markers for diagnosis and prognosis of common cancers. Proc. Natl. Acad. Sci. U.S.A. 114, 7414–7419. doi: 10.1073/pnas.1703577114
Hatanaka, Y., de Velasco, M. A., Oki, T., Shimizu, N., Nozawa, M., Yoshimura, K., et al. (2019). HOXA10 expression profiling in prostate cancer. Prostate 79, 554–563. doi: 10.1002/pros.23761
He, Y. X., Song, X. H., Zhao, Z. Y., and Zhao, H. (2017). HOXA13 upregulation in gastric cancer is associated with enhanced cancer cell invasion and epithelial-to-mesenchymal transition. Eur. Rev. Med. Pharmacol. Sci. 21, 258–265.
Kang, S., Li, Q., Chen, Q., Zhou, Y., Park, S., Lee, G., et al. (2017). CancerLocator: non-invasive cancer diagnosis and tissue-of-origin prediction using methylation profiles of cell-free DNA. Genome Biol. 18:53. doi: 10.1186/s13059-017-1191-5
Kent, W. J., Sugnet, C. W., Furey, T. S., Roskin, K. M., Pringle, T. H., Zahler, A. M., et al. (2002). The human genome browser at UCSC. Genome Res. 12, 996–1006. doi: 10.1101/gr.229102
Lee, D. S., Luo, C., Zhou, J., Chandran, S., Rivkin, A., Bartlett, A., et al. (2019). Simultaneous profiling of 3D genome structure and DNA methylation in single human cells. Nat. Methods 16, 999–1006. doi: 10.1038/s41592-019-0547-z
Li, D., Bai, Y., Feng, Z., Li, W., Yang, C., Guo, Y., et al. (2019a). Study of promoter methylation patterns of HOXA2, HOXA5, and HOXA6 and its clinicopathological characteristics in colorectal cancer. Front. Oncol. 9:394. doi: 10.3389/fonc.2019.00394
Li, D., Zhang, L., Liu, Y., Sun, H., Onwuka, J. U., Zhao, Z., et al. (2019b). Specific DNA methylation markers in the diagnosis and prognosis of esophageal cancer. Aging 11, 11640–11658. doi: 10.18632/aging.102569
Li, H. P., Peng, C. C., Chung, I. C., Huang, M. Y., Huang, S. T., Chen, C. C., et al. (2013). Aberrantly hypermethylated Homeobox A2 derepresses metalloproteinase-9 through TBP and promotes invasion in Nasopharyngeal carcinoma. Oncotarget 4, 2154–2165. doi: 10.18632/oncotarget.1367
Liu, B., Liu, Y., Pan, X., Li, M., Yang, S., and Li, S. C. (2019). DNA methylation markers for pan-cancer prediction by deep learning. Genes 10:778. doi: 10.3390/genes10100778
Liu, J., Liu, J., and Lu, X. (2019). HOXA1 upregulation is associated with poor prognosis and tumor progression in breast cancer. Exp. Ther. Med. 17, 1896–1902. doi: 10.3892/etm.2018.7145
Liu, Z., Shen, F., Wang, H., Li, A., Wang, J., Du, L., et al. (2020). Abnormally high expression of HOXA2 as an independent factor for poor prognosis in glioma patients. Cell Cycle 19, 1632–1640. doi: 10.1080/15384101.2020.1762038
McLaughlin, K., Flyamer, I. M., Thomson, J. P., Mjoseng, H. K., Shukla, R., Williamson, I., et al. (2019). DNA methylation directs polycomb-dependent 3D genome re-organization in naive pluripotency. Cell Rep. 29, 1974.e6–1985.e6. doi: 10.1016/j.celrep.2019.10.031
Miller, K. R., Patel, J. N., Zhang, Q., Norris, E. J., Symanowski, J., Michener, C., et al. (2018). HOXA4/HOXB3 gene expression signature as a biomarker of recurrence in patients with high-grade serous ovarian cancer following primary cytoreductive surgery and first-line adjuvant chemotherapy. Gynecol. Oncol. 149, 155–162. doi: 10.1016/j.ygyno.2018.01.022
Moore, L. D., Le, T., and Fan, G. (2013). DNA methylation and its basic function. Neuropsychopharmacology 38, 23–38. doi: 10.1038/npp.2012.112
Neri, F., Rapelli, S., Krepelova, A., Incarnato, D., Parlato, C., Basile, G., et al. (2017). Intragenic DNA methylation prevents spurious transcription initiation. Nature 543, 72–77. doi: 10.1038/nature21373
Ordóñez-Morán, P., Dafflon, C., Imajo, M., Nishida, E., and Huelsken, J. (2015). HOXA5 counteracts stem cell traits by inhibiting Wnt signaling in colorectal cancer. Cancer Cell 28, 815–829. doi: 10.1016/j.ccell.2015.11.001
Pan, Y., Liu, G., Zhou, F., Su, B., and Li, Y. (2018). DNA methylation profiles in cancer diagnosis and therapeutics. Clin. Exp. Med. 18, 1–14. doi: 10.1007/s10238-017-0467-0
Patai, A. V., Molnár, B., Kalmár, A., Schöller, A., Tóth, K., and Tulassay, Z. (2012). Role of DNA methylation in colorectal carcinogenesis. Dig. Dis. 30, 310–315. doi: 10.1159/000337004
Peng, X., Zha, L., Chen, A., and Wang, Z. (2018). HOXA5 is a tumor suppressor gene that is decreased in gastric cancer. Oncol. Rep. 40, 1317–1329. doi: 10.3892/or.2018.6537
Qiu, L., Xu, L., Chang, G., Guo, Q., Liu, X., Bi, Y., et al. (2016). DNA methylation-mediated transcription factors regulate Piwil1 expression during chicken spermatogenesis. J. Reprod. Dev. 62, 367–372. doi: 10.1262/jrd.2016-3
Robin, X., Turck, N., Hainard, A., Tiberti, N., Lisacek, F., Sanchez, J. C., et al. (2011). pROC: an open-source package for R and S+ to analyze and compare ROC curves. BMC Bioinform. 12:77. doi: 10.1186/1471-2105-12-77
Robinson, J. T., Turner, D., Durand, N. C., Thorvaldsdóttir, H., Mesirov, J. P., and Aiden, E. L. (2018). Juicebox.js Provides a Cloud-Based Visualization System for Hi-C Data. Cell Syst. 6, 256.e1–258.e1. doi: 10.1016/j.cels.2018.01.001
Saghafinia, S., Mina, M., Riggi, N., Hanahan, D., and Ciriello, G. (2018). Pan-cancer landscape of aberrant DNA methylation across human tumors. Cell Rep. 25, 1066.e8–1080.e8. doi: 10.1016/j.celrep.2018.09.082
Shi, Y., Su, X. B., He, K. Y., Wu, B. H., Zhang, B. Y., and Han, Z. G. (2016). Chromatin accessibility contributes to simultaneous mutations of cancer genes. Sci. Rep. 6:35270. doi: 10.1038/srep35270
Tang, B., Qi, G., Sun, X., Tang, F., Yuan, S., Wang, Z., et al. (2016). HOXA7 plays a critical role in metastasis of liver cancer associated with activation of Snail. Mol. Cancer 15:57. doi: 10.1186/s12943-016-0540-4
Tang, X., Jiang, J., Zhu, J., He, N., and Tan, J. (2019). HOXA4-regulated miR-138 suppresses proliferation and gefitinib resistance in non-small cell lung cancer. Mol. Genet. Genomics 294, 85–93. doi: 10.1007/s00438-018-1489-3
Tsou, J. A., Hagen, J. A., Carpenter, C. L., and Laird-Offringa, I. A. (2002). DNA methylation analysis: a powerful new tool for lung cancer diagnosis. Oncogene 21, 5450–5461. doi: 10.1038/sj.onc.1205605
Wang, H., Liu, G., Shen, D., Ye, H., Huang, J., Jiao, L., et al. (2015). HOXA1 enhances the cell proliferation, invasion and metastasis of prostate cancer cells. Oncol. Rep. 34, 1203–1210. doi: 10.3892/or.2015.4085
Wu, F., Wu, S., Tong, H., He, W., and Gou, X. (2019). HOXA6 inhibits cell proliferation and induces apoptosis by suppressing the PI3K/Akt signaling pathway in clear cell renal cell carcinoma. Int. J. Oncol. 54, 2095–2105. doi: 10.3892/ijo.2019.4789
Wu, S., Wu, F., and Jiang, Z. (2018). Effect of HOXA6 on the proliferation, apoptosis, migration and invasion of colorectal cancer cells. Int. J. Oncol. 52, 2093–2100. doi: 10.3892/ijo.2018.4352
Yang, X., Gao, L., and Zhang, S. (2017). Comparative pan-cancer DNA methylation analysis reveals cancer common and specific patterns. Brief. Bioinform. 18, 761–773. doi: 10.1093/bib/bbw063
Yang, X., Han, H., De Carvalho, D. D., Lay, F. D., Jones, P. A., and Liang, G. (2014). Gene body methylation can alter gene expression and is a therapeutic target in cancer. Cancer Cell 26, 577–590. doi: 10.1016/j.ccr.2014.07.028
Yuan, C., Zhu, X., Han, Y., Song, C., Liu, C., Lu, S., et al. (2016). Elevated HOXA1 expression correlates with accelerated tumor cell proliferation and poor prognosis in gastric cancer partly via cyclin D1. J. Exp. Clin. Cancer Res. 35:15. doi: 10.1186/s13046-016-0294-2
Yuan, Y., Shi, Y., Li, C., Kim, J., Cai, W., Han, Z., et al. (2016). DeepGene: an advanced cancer type classifier based on deep learning and somatic point mutations. BMC Bioinform. 17(Suppl. 17):476. doi: 10.1186/s12859-016-1334-9
Yuan, Y., Shi, Y., Su, X., Zou, X., Luo, Q., Feng, D. D., et al. (2018). Cancer type prediction based on copy number aberration and chromatin 3D structure with convolutional neural networks. BMC Genomics 19(Suppl. 6):565. doi: 10.1186/s12864-018-4919-z
Zhang, H., Zhao, J. H., and Suo, Z. M. (2017). Knockdown of HOXA5 inhibits the tumorigenesis in esophageal squamous cell cancer. Biomed. Pharmacother. 86, 149–154. doi: 10.1016/j.biopha.2016.12.012
Zhang, J., and Huang, K. (2017). Pan-cancer analysis of frequent DNA co-methylation patterns reveals consistent epigenetic landscape changes in multiple cancers. BMC Genomics 18(Suppl. 1):1045. doi: 10.1186/s12864-016-3259-0
Zhang, R., Zhang, T. T., Zhai, G. Q., Guo, X. Y., Qin, Y., Gan, T. Q., et al. (2018). Evaluation of the HOXA11 level in patients with lung squamous cancer and insights into potential molecular pathways via bioinformatics analysis∗. World J. Surg. Oncol. 16:109. doi: 10.1186/s12957-018-1375-9
Zhang, X., Liu, G., Ding, L., Jiang, T., Shao, S., Gao, Y., et al. (2018). HOXA3 promotes tumor growth of human colon cancer through activating EGFR/Ras/Raf/MEK/ERK signaling pathway∗. J. Cell Biochem. 119, 2864–2874. doi: 10.1002/jcb.26461
Zhang, Y., Li, X. J., He, R. Q., Wang, X., Zhang, T. T., Qin, Y., et al. (2018). Upregulation of HOXA1 promotes tumorigenesis and development of non-small cell lung cancer: a comprehensive investigation based on reverse transcription-quantitative polymerase chain reaction and bioinformatics analysis∗. Int. J. Oncol. 53, 73–86. doi: 10.3892/ijo.2018.4372
Keywords: pan-cancer, DNA methylation, biomarker, Hi-C, hox, carcinogenesis
Citation: Liu G, Liu Z, Sun X, Xia X, Liu Y and Liu L (2021) Pan-Cancer Genome-Wide DNA Methylation Analyses Revealed That Hypermethylation Influences 3D Architecture and Gene Expression Dysregulation in HOXA Locus During Carcinogenesis of Cancers. Front. Cell Dev. Biol. 9:649168. doi: 10.3389/fcell.2021.649168
Received: 04 January 2021; Accepted: 01 February 2021;
Published: 18 March 2021.
Edited by:
Tao Huang, Shanghai Institute of Nutrition and Health (CAS), ChinaReviewed by:
Yi Shi, Shanghai Jiao Tong University, ChinaHui Lu, Shanghai Jiao Tong University, China
Copyright © 2021 Liu, Liu, Sun, Xia, Liu and Liu. This is an open-access article distributed under the terms of the Creative Commons Attribution License (CC BY). The use, distribution or reproduction in other forums is permitted, provided the original author(s) and the copyright owner(s) are credited and that the original publication in this journal is cited, in accordance with accepted academic practice. No use, distribution or reproduction is permitted which does not comply with these terms.
*Correspondence: Lei Liu, bGl1bGVpX3NpYnNAMTYzLmNvbQ==
†These authors have contributed equally to this work