 Suhua Guan1
 Dongmei Zhu
 Zexia Gao
 Han Liu
- 1Key Lab of Agricultural Animal Genetics, Breeding and Reproduction of Ministry of Education / Key Laboratory of Freshwater Animal Breeding, Ministry of Agriculture and Rural Affairs, College of Fisheries, Huazhong Agricultural University, Wuhan, China
- 2Hubei Hongshan Laboratory, Engineering Research Center of Green Development for Conventional Aquatic Biological Industry in the Yangtze River Economic Belt, Ministry of Education, Wuhan, China
Olfaction is essential for the survival and reproduction of fish, as it facilitates foraging, food localization, mate selection, and breeding. The in vitro cultured olfactory epithelial cells will provide an important resource for research on how fish use olfaction to detect odor molecules in their environment. In this study, olfactory epithelial cells from Megalobrama amblycephala were cultured in vitro to investigate their responses to various odors, amino acids, and prostaglandin F2α (PGF2α). Initially, the olfactory epithelial cells were cultured in vitro using the explant method and collagenase digestion technique. Based on observations of in vitro growth characteristics, collagenase digestion demonstrated superior growth stability and morphological features of ciliated neurons. The presence of olfactory neurospheres was identified through scanning electron microscopy (SEM). Immunofluorescence analysis revealed that most of the cells cultured were labeled with NEUN antibody. Additionally, the expression of olfactory receptors (ORs) was detected in the in vitro cultured olfactory epithelial cells using fluorescence in situ hybridization (FISH) and reverse transcription PCR (RT-PCR). Stimulation with amino acids mixture and PGF2α significantly increased the number of olfactory epithelial cells labeled with pERK. RNA-seq analysis revealed that 1,276 differentially expressed genes (DEGs) were identified following PGF2α stimulation, with pathways related to olfaction and reproduction being significantly enriched. Collectively, this study successfully established an in vitro model of the olfactory epithelium cells in M. amblycephala and preliminarily investigated its response to odorant molecules, providing a valuable platform for research on fish olfactory function.
1 Introduction
Olfaction plays a crucial role in the sensory system of vertebrates, encompassing a wide range of intricate functions (Hughes et al., 2018). In fish behavior, it is essential for foraging, mating, predator evasion, and migratory activities. The detection of odors relies on the expression of olfactory receptors (ORs) in olfactory sensory neurons (OSNs) (Bazáes et al., 2013; Hughes et al., 2018). OSNs utilize axons to perceive odor molecules and transmit impulses to the brain, thereby integrating olfactory functions (Firestein, 2001; Soelter et al., 2020).
OSNs express ORs that have evolved to detect odorants relevant to behavior. Throughout vertebrate evolution, ORs have undergone significant expansion (Policarpo et al., 2024). This increasing diversity is exemplified by the growth from an estimated 159 ORs in zebrafish to 2,000 ORs in African elephants (Niimura et al., 2014). Importantly, each functional ORs selectively identifies a unique odorant molecule (Braubach et al., 2012), while individual OSNs persistently express a singular OR (Andrew et al., 1994). Furthermore, OSNs possess a unique regenerative capability that distinguishes them from other types of neural cells in mammals (Suzuki and Takeda, 1993), playing a vital role in the sense of smell. However, culturing OSNs in vitro presents significant challenges. Some studies suggest that the viability and functional integrity of mature OSNs may be adversely affected by enzyme digestion during their cultivation (Schwarzenbacher et al., 2005; Lacroix et al., 2008). Previous studies have established primary culture systems using cells derived from embryonic, neonatal or adult mice for cultivation of OSNs (Micholt et al., 2012). Cultured olfactory stem cells have been successfully obtained from cloned mice (Peterson et al., 2019) and human neurospheres (Murrell et al., 2005). However, the differentiation of these cells into mature OSNs has presented a significant challenge. The COVID-19 pandemic has sparked significant interest in the investigation and cultivation of OSNs (Hao et al., 2020; Wu et al., 2023). Researchers have developed chemically and mechanically-based models to explore the crucial functions of OSNs in mammals (Ren et al., 2021). Considering that viruses can inflict damage on the olfactory system (Hou et al., 2020; Ahn et al., 2021), extensive research efforts have been dedicated to investigating their impact, leading to enhanced comprehension. For example, found that the virus attaches to motile cilia via the ACE2 receptor (Wu et al., 2023). Recent studies have challenged the conventional belief that OSNs cannot survive outside an organism, thereby overturning this long-standing notion (Gao et al., 2021; Ren et al., 2021). Simultaneously, we acknowledge the imperative of cultivating OSNs for studying olfactory function.
Fish, which constitute one of the largest categories in vertebrates, account for approximately half of all known species. They primarily rely on detecting water-soluble odorant molecules such as amino acids, prostaglandin F2α (PGF2α), and bile acids to ensure their survival in aquatic environments (Cong et al., 2019). Moreover, there is an increasing recognition that the olfactory capabilities of fish are intricately linked to their dietary habits and reproduction (Liu et al., 2021). However, the ability to culture fish OSNs remains relatively limited. As a representative herbivorous fish species, the Megalobrama amblycephala possesses a considerable number of ORs (Liu et al., 2021). In this study, we focused on M. amblycephala, a fish species of economic importance. We employed a combination of Collagenase I + IV and trypsin to isolate olfactory epithelium from M. amblycephala. This method effectively reduces the damage to neuronal cilia. Through the synergistic application of these three enzymes, we achieved targeted and thorough digestion of distinct olfactory epithelium regions, enhancing its applicability. This work represents a preliminary exploration of culturing olfactory epithelial cells in aquatic organisms.
2 Materials and methods
2.1 Sample collection and maintenance
Cells isolated from five M. amblycephala, both females and males, were used simultaneously. Twelve-month-old M. amblycephala, with an average body weight of 300 ± 50 g, were sourced from the Ezhou Aquaculture Base in Wuhan and subsequently housed in the recirculating aquaculture system at the Huazhong Agricultural University Aquaculture Base. Individuals exhibiting excellent health underwent a preventive treatment involving a 20 min immersion in water containing potassium permanganate at a concentration of 0.5 ppm before being introduced into the recirculatory system. Throughout the maintained period, dissolved oxygen levels were maintained at 8 ± 3 mg/L, and the water temperature was regulated to be within the range of 24 °C ± 4 °C.
2.2 Explant isolation of olfactory epithelium
Prior to performing aseptic procedures, M. amblycephala specimens were euthanized using anesthesia and exsanguinated. The carcasses were then disinfected with alcohol to prevent bacterial and fungal contamination. On a sterile workbench, the olfactory epithelium tissues were meticulously excised using sterilized tweezers and forceps before being transferred to a sterile culture dish. Any remaining mucus tissue was removed through two consecutive rinses with PBS.
The olfactory epithelium tissues were incubated in Antibiotic incubation medium (Table 1) for 2 h, followed by meticulous dissection using sterilized knives and scissors on a sterile Petri dish. Approximately thirty tissue fragments, each measuring 1–2 mm3, were evenly distributed in a T25 culture flask and then the growth medium was added. The flask was positioned vertically for 2 h, then tilted horizontally for 30 min to facilitate tissue adhesion. Subsequently, 3 mL of the growth medium was introduced. Cultures were maintained at 28 °C, with the growth medium refreshed every 3 days. Daily assessment of fragment adherence, dispersion, and proliferation was facilitated using an inverted phase contrast microscope.
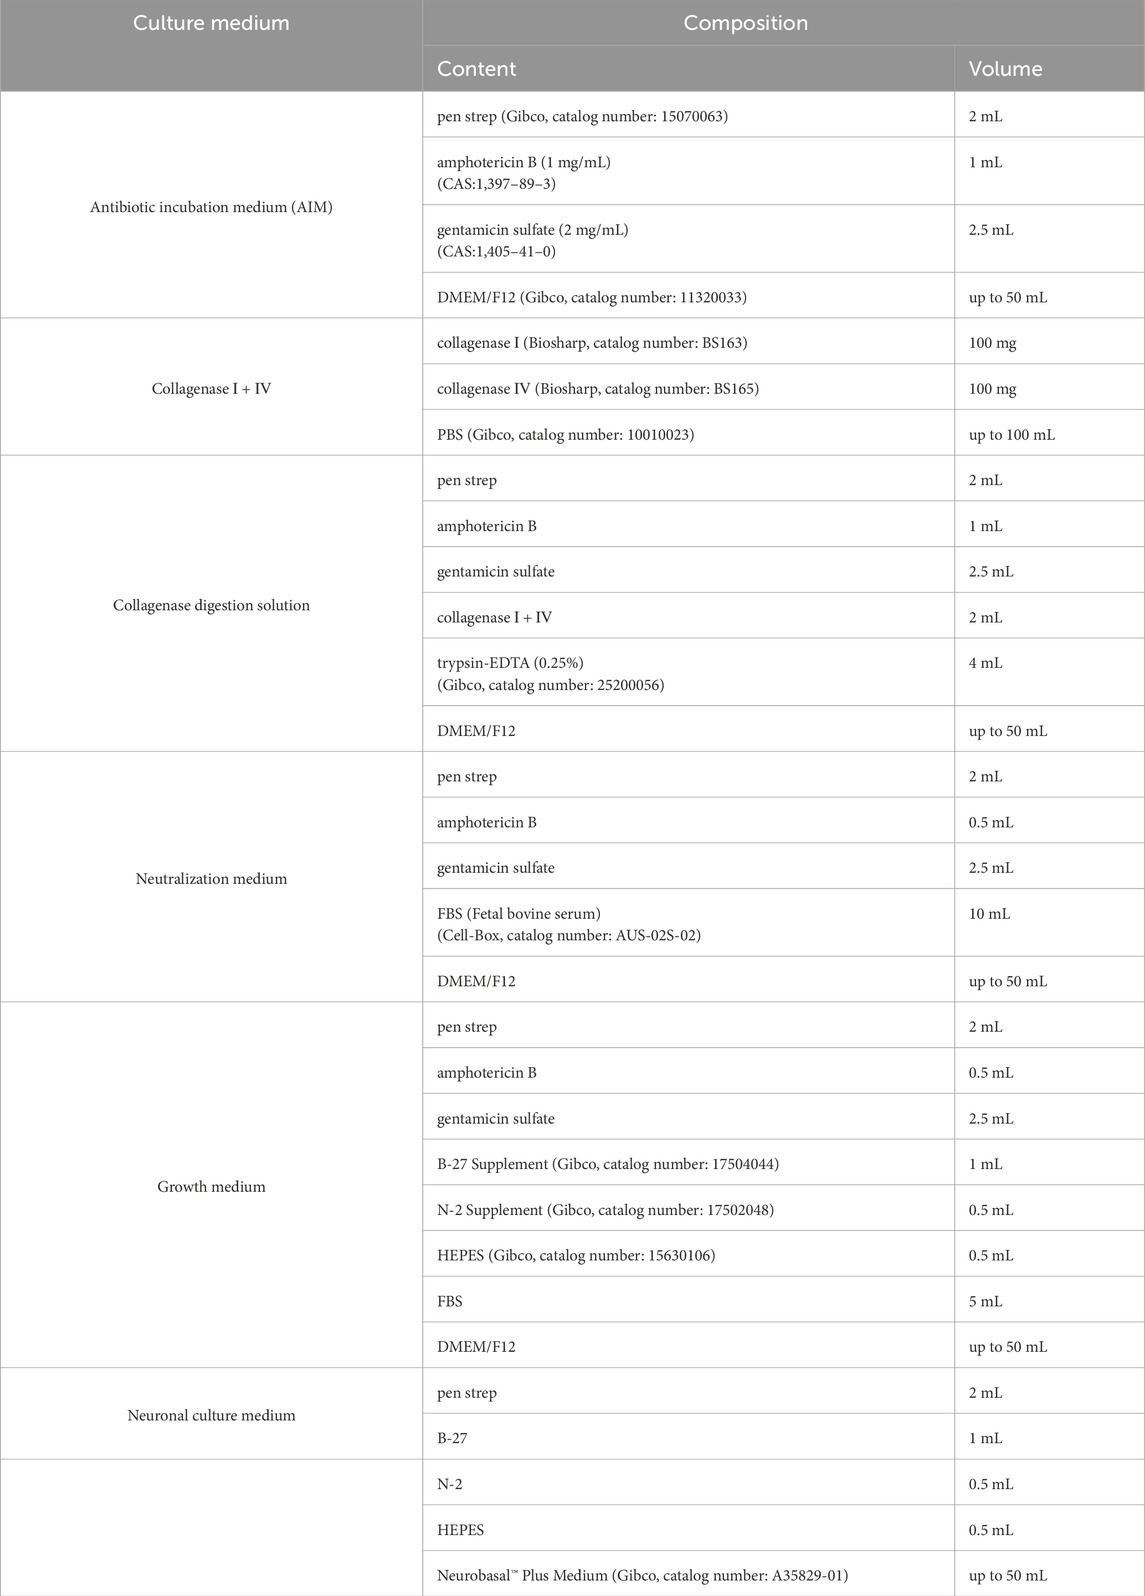
Table 1. Medium composition.
2.3 Collagenase isolation of olfactory epithelium
The olfactory epithelium tissue was incubated in AIM within a 50 mL centrifuge tube for 2 h to ensure complete saturation. Subsequently, the surrounding mucus was eliminated by treating the tissue with trypsin-EDTA (0.25%) for 5 min. After trypsinization, a neutralization medium was added to halt enzymatic activity, and then the supernatant was discarded. The tissue was then gently pipetted in the presence of collagenase working solution to facilitate further digestion. This enzymatic treatment lasted for 6 min, following which neutralization medium was introduced and the supernatant containing dissociated cells was collected while retaining the tissue for subsequent processing. The digestion was repeated four times to ensure thorough tissue disintegration thoroughly, with additional digestion performed as necessary until complete digestion confirmation of digestion. All supernatants were filtered through a 100 μm cell strainer to remove undigested materials and subsequently centrifuged for cell isolation. The resulting cells were washed in neutralization medium within a 15 mL centrifuge tube and passed through a 70 μm cell strainer. Following a second centrifugation step, the cells were resuspended in growth medium, and their concentration was determined using an automated cell counter. Finally, the cells were plated at a density of 1 × 10⁶ cells/mL in sterile six-well plates and incubated in a 28 °C incubator with 5% CO2 (Figure 1). After 24 h, the initial growth medium was replaced with neuronal cell culture medium, repeating this replacement process every 3 days. Table 1 presents the formulation of all culture media.
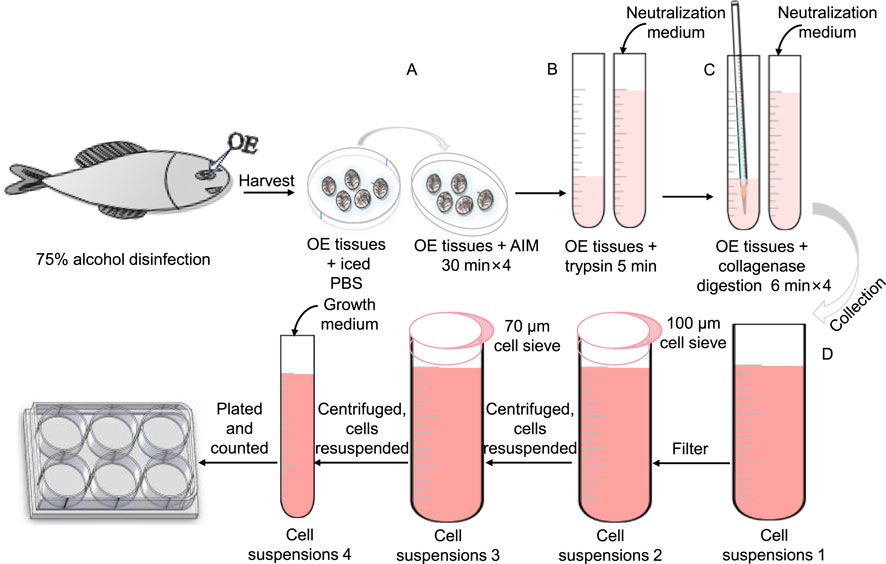
Figure 1. Schematic representation of the collagenase isolation protocol for olfactory epithelium (OE). (A) OE tissues were rinsed with PBS and subsequently immersed in AIM solution for thorough sterilization. (B) Digestion with trypsin-EDTA (0.25%) was performed to remove the surrounding mucus. (C) Collagenase digestion solution was applied to the OE tissues, followed by gentle pipetting with a 5 mL transfer pipette to enhance dissociation, with this process being repeated four times. (D) The cell suspension was collected and placed on ice, followed by filtration and subsequent inoculation.
2.4 Morphology and vitality assay of olfactory epithelial cells
The morphology of olfactory epithelial cells during the growth phase was monitored using inverted phase contrast microscopy, with initial observations commencing on the first day of growth and continuing twice daily. For detailed morphology assessment, olfactory epithelial cells were analyzed using Scanning Electron Microscopy (SEM). Samples designated for SEM analysis were fixed overnight at 4 °C in 2.5% glutaraldehyde (EM Grade) and subsequently underwent a secondary fixation in 2% osmium tetroxide (OsO4) for 2 h at room temperature. Following fixation, samples were progressively dehydrated through a series of ethanol immersions at concentrations of 30%, 50%, 70%, 95%, and finally 100%. They were then critically point dried using hexamethyldisilazane (HMDS). The dry specimens were metal-coated and examined with a Field Emission Scanning Electron Microscope (FESEM).
The proliferation activity of olfactory epithelial cells was assessed using the Cell Counting Kit-8 (CCK-8) assay. Cells were seeded at a concentration of 1 × 10⁶ cells/mL in a 96-well plate and divided into seven groups with ten replicate wells per group. Proliferation was monitored over 7 days, with daily medium refreshment. At specified time points, each well was incubated with 10 µL of CCK-8 solution for 4 h, followed by absorbance measurement at 450 nm using a microplate reader (Envision).
2.5 Neuronal nuclei (NEUN) detection in Vitro cultured olfactory epithelial cells
On the sixth day of culturing olfactory epithelial cells on adhesive glass coverslips with a diameter of 8.5 mm, the culture medium was discarded, and cells were washed with PBS to remove residual medium and impurities. The olfactory epithelial cells were fixed in 4% paraformaldehyde for 15 min, followed by another wash with PBS. Permeabilization was achieved by treating the cells with 0.1% Triton X-100 for 20 min. Subsequently, the cells were blocked for 1 h in PBS containing 0.01% Triton X-100, enriched with 2.5% goat serum, 2.5% donkey serum, and 20 mM glycine. An overnight incubation at 4 °C followed using a rabbit NeuN antibody (GeneTex, catalog number: 43,579) diluted to a concentration of 1:1,000 in the blocking solution. The following day, cells were acclimatized to room temperature for 30 min, washed with PBS, and then incubated in darkness for 1 h with Alexa Fluor 488-conjugated secondary antibody (Donkey anti-rabbit at 1:500 dilutions, AntGene, catalog number: 1650451008). After washing, cells were stained with DAPI for 5 min to visualize nuclei and rinsed to remove excess stain. Finally, the cell slips were treated with antifade mounting medium and examined using a laser confocal microscope.
2.6 Detection of olfactory receptors (ORs)
To determine whether olfactory epithelial cells in vitro express ORs, fluorescence in situ hybridization (FISH) and RT-PCR were utilized for detection. The entire coding sequence of the OR-β11 from M. amblycephala was amplified from cDNA, cloned into the pcDNA3.1 (+) vector, and sequenced. Probes for OR-β11 were generated by amplifying the gene fragment from the cloning vector using primers listed in Supplementary Table S1. An antisense cRNA probe targeting OR-β11 was synthesized in vitro using T7 RNA polymerase and enhanced with a DIG RNA labeling mixture. Cell slides were fixed with 4% PFA for 15 min. After washing with PBST, they were treated with 0.1% Triton X-100 for 10 min. Following another PBST wash, slides were pre-hybridized at 65 °C for 1 h in hybridization buffer (50% formamide, 5×SSC, 0.05 mg/mL heparin, 0.5 mg/mL tRNA, 0.1% Tween-20, 0.01 M citric acid, DEPC-treated). The OR-β11 probe (5 ng/μL) was then added and hybridized at 65 °C for 12–16 h. After hybridization, slides were washed in Wash Solution I (25% formamide, 1×SSC, 0.1% Tween-20) for 2 × 30 min, in Wash Solution II (1×SSC, 0.1% Tween-20) for 2 × 15 min, and in Wash Solution III (0.2×SSC, 0.1% Tween-20) for 2 × 30 min. Slides were cooled to room temperature and incubated with Anti-DIG POD Fab fragments (1:500, Roche) at 4 °C for 16–18 h, followed by PBST washes for 3 × 5 min. Then the slides were processed using the Tyramide Signal Amplification (TSA) Cy3 Kit (Akoya Biosciences) according to the manufacturer’s instructions. Following a 10 min incubation with Cy3-conjugated tyramide (diluted 1:50 in amplification buffer) at room temperature, the slides were subjected to 3 × 5 min washes in PBST. Finally, slides were stained with DAPI (5 μg/mL) for 10 min and mounted with an anti-fade mounting solution. After examination under a confocal microscope (Nikon), all cell slides were scanned using a high-resolution slide scanning system (3DHISTECH Ltd.).
RNA was extracted from olfactory epithelial cells cultured in vitro for 6 days using trizol (TaKaRa, catalog number: 9,108). Subsequently, the RNA was reverse transcribed into cDNA using the Prime Script RT Reagent Kit with gDNA Eraser (TaKaRa, catalog number: RR047A) as the template for RT-PCR. The reaction volume was 10 μL, containing 5 μL of 2 × Rapid Taq Master Mix (Vazyme, catalog number: P222-01), 0.2 mM primer, and cDNA template. The cycling program was as follows: initial denaturation at 95 °C for 3 min, denaturation at 95 °C for 15 s, annealing at 58 °C for 15 s, extension at 72 °C for 3 s, repeated for 35 cycles. Finally, the RT-PCR products were analyzed by 1% agarose gel electrophoresis.
2.7 Detection of pERK in vitro cultured olfactory epithelial cells after exposure to odorant molecules
The odorants were sourced from Sigma-Aldrich with a purity level of 97%. The amino acids mixture, used as food odor, was based on the composition of amino acids in water grass, as shown in Supplementary Table S1. Each experimental session began with a freshly prepared solution containing the mixture. PGF2α, as a sex pheromone, was dissolved in DMSO to achieve a concentration of 1 × 10⁻¹ M and stored at −80 °C for future use. Fresh neural cell culture medium was replaced for the six-day-old olfactory epithelial cells 12 h prior to initiating the odor exposure experiment. Subsequently, an appropriate amount of the amino acid mixture solution and PGF2α were added to reach a final concentration of 1 × 10⁻⁵ M. The olfactory epithelial cells were then incubated at 28 °C in a culture chamber. After a 10 min exposure period, ERK phosphorylation was confirmed using rabbit anti-pERK1/2 monoclonal antibody (1:500, Cell Signaling Technology, catalog number: 4,370). Three biological replicates were set up for each experiment. The experimental procedures were as described in section 2.5. Subsequent quantification was performed using ImageJ software (v1.53t) under standardized parameters. For nuclear enumeration, DAPI-stained nuclei were counted. pERK+ cells were identified as those exceeding the intensity threshold (mean + 2SD of controls). The positivity rate was calculated using the formula: % pERK+ = (pERK+ cells/total nuclei) × 100. Each group included a minimum of three replicates.
2.8 RNA-seq and analysis
After a 2 h exposure to a solution containing amino acid mixture and PGF2α at final concentration of 1 × 10⁻⁵ M, the olfactory epithelial cells were collected for total RNA extraction and subjected to quality evaluation. High-quality total RNA was utilized for constructing an RNA-seq library. The RNA was purified, reverse transcribed, and libraries were constructed following the manufacturer’s instructions (Illumina, San Diego, CA). Briefly, the transcriptome library for olfactory epithelial cells was prepared using the Illumina Stranded mRNA Prep Kit with 1 μg of total RNA. Subsequently, messenger RNA was isolated through a poly A selection method employing oligo (dT) beads and fragmented using a fragmentation buffer. Next, double-stranded cDNA synthesis was performed utilizing the Super Script Double-Stranded cDNA Synthesis Kit (Invitrogen, CA) with Illumina random hexamer primers. The synthesized cDNA underwent end repair, phosphorylation, and “A” base addition according to Illumina’s library construction protocol. Size selection of the resulting cDNA libraries targeted fragments of 300 bp on 2% Low Range Ultra Agarose gel followed by PCR amplification consisting of 15 cycles using Phusion DNA Polymerase from NEB. After quantification with the Qubit 4.0 Fluorometer, paired-end RNA-seq sequencing library was sequenced using the Nova Seq 6,000 sequencer. The raw data underwent filtration to remove sequencing reads containing adapters, poly-N sequences, and low-quality sequences (Q < 20). The remaining reads were defined as “clean reads” and utilized for subsequent analysis. Subsequently, the clean reads were mapped to the reference genome of M. amblycephala (PRJNA343584) using HISAT. Following this, the RSEM program was employed to quantify gene expression, with gene expression levels presented in the form of transcripts per million (TPM).
To identify differentially expressed genes (DEGs) between two groups, we utilized the transcripts per million reads (TPM) method to quantify the expression level of each transcript. Gene abundances were quantified using RSEM. Subsequently, differential expression analysis was conducted using DESeq2. Genes with |log2FC|≥1 and FDR <0.05 (DESeq2) were considered as significantly differentially expressed genes. Furthermore, functional enrichment analysis for Gene Ontology (GO) and Kyoto Encyclopedia of Genes and Genomes (KEGG) was conducted to identify significantly enriched DEGs in GO terms and metabolic pathways, respectively. The Bonferroni-corrected p-value of 0.05 was used compared to the whole-transcriptome background. Goatools and Python scipy were employed for conducting the GO functional enrichment and KEGG pathway analysis, respectively.
2.9 Quantitative real-time PCR (qPCR)
Real-time quantitative PCR (qPCR) was performed using an ABI real-time qPCR system (Foster City, CA, United States of America) with a 20 μL reaction volume containing 10 μL SYBR Green PCR Master Mix (TaKaRa, code No. RR820A), 0.4 mM primers and the cDNA template. The cycling program consisted of an initial denaturation for 5 min at 95 °C, followed by 40 cycles of 95 °C for 20 s and 60 °C for 25 s β-actin was utilized as a reference gene, using its expression level as a standard to measure the relative expression levels of the target gene. Subsequently, a comparison of the relative expression levels among samples was conducted, with DMSO stimulation serving as the control group. The dataset was systematically organized and analyzed utilizing Microsoft Excel 2010, employing the 2−ΔΔCt method (Schmittgen and Livak, 2008) for the quantitative analysis of the data. The primers utilized in this study can be found in Supplementary Table S2.
2.10 Statistical analyses
The results were expressed as the mean ± standard deviation (mean ± SD) across three independent experimental replicates. After normalization, the data underwent one-way analysis of variance (One-Way ANOVA) using SPSS 19.0 software. Subsequently, multiple comparisons were performed using the Scheffé method. Statistical significance was determined at P < 0.05 and P < 0.01, indicating significant and highly significant differences, respectively.
3 Results
3.1 Cells derived from explants exhibit distinct in vitro growth characteristics
In the explant culture system, we observed two distinct phenomena. On day 7 of culturing, a subset of the explants exhibited simultaneous radial outgrowth of both neuronal-like and paving-stone like cells, albeit with slow cell proliferation. By day 15, the number of bipolar neuron-like cells ceased to increase, while the number of dead cells began to rise (Supplementary Figure S1A). In contrast, another set of explants, there was a profusion of paving-stone like cells appearing by day 3. These cells started detaching by day 5, and notably, there was no migration of neuronal-like cells during the subsequent culture period (Supplementary Figure S1B).
3.2 Olfactory epithelial cells isolated using collagenase exhibit stable growth in vitro
Olfactory epithelium tissues from five M. amblycephala specimens were completely digested using a collagenase digestion solution. The resulting cells were resuspended in growth medium and seeded into a six-well culture dish at a concentration of 1 × 10⁶ cells/mL. After approximately 24 h of seeding, most majority olfactory epithelial cells adhered to the surface of Petri dishes (Figure 2A). By the third day, cell proliferation occurred with some displaying typical bipolar neuronal morphology. This bipolar morphology exhibited a significant increase by the fifth day and persisted for approximately 72 h. However, on day nine, there was a decline in the abundance of bipolar neurons coinciding with an increase in round cells. Concurrently, cell viability as determined by the CCK-8 assay demonstrated a substantial decrease on day eight (Figure 2B). The exponential phase of cell growth occurred on day five, reaching peak viability on day six. Notably, by day eight, there was a significant reduction in viability which corroborated morphological assessments of the cells. SEM conducted on day six revealed olfactory neurospheres featuring filamentous extensions resembling cilia encircling them (Figure 2C).
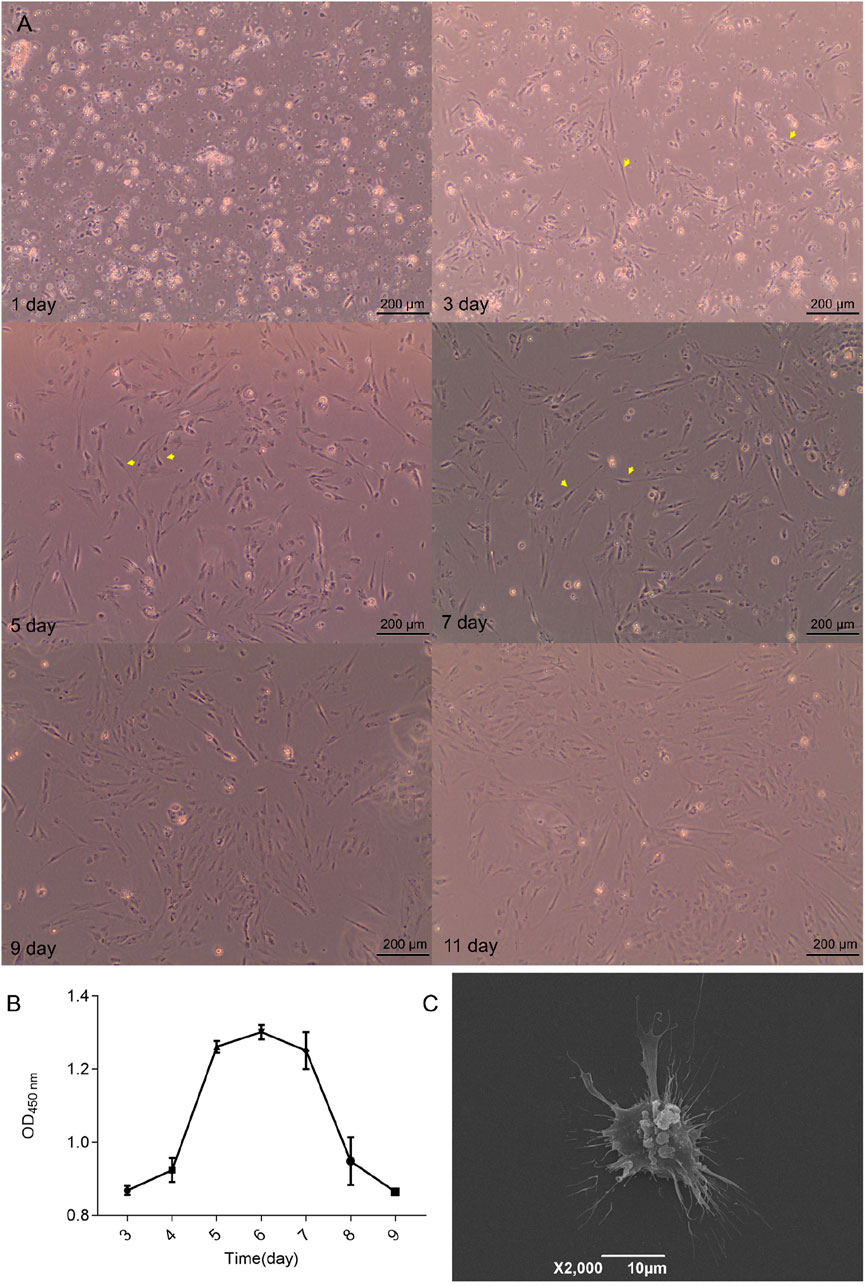
Figure 2. Characteristics of olfactory epithelial cells. (A) The growth conditions of cells observed via phase-contrast microscopy. (B) Cell viability was evaluated systematically over seven consecutive days utilizing the CCK-8 assay. (C) Examination of cell morphology utilizing SEM.
3.3 Olfactory epithelial cells were labeled with the NEUN antibody and expressed ORs
To detect neurons within the olfactory epithelial cells, labeling was performed using the NEUN antibody, a specific marker for neuronal nuclei. The olfactory epithelial in fish primarily consists of neurons, supporting cells, and basal cells, all crucial for the development and signal transduction processes within OSNs. It was hypothesized that these cellular components would be present in the cultured olfactory epithelial cells. Therefore, NeuN antibodies were utilized to selectively label cells. The results demonstrated that the nuclei of majority of cells were bright green fluorescently labeled, suggesting a significant presence of neurons in the cultured olfactory epithelium cells (Figure 3). The unlabeled cells were non-neuronal, such as basal cells.
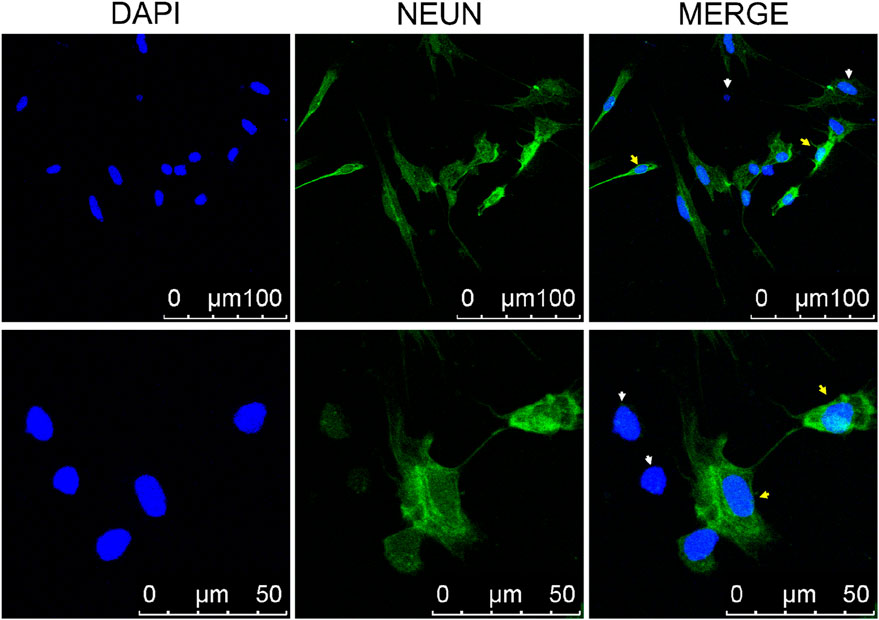
Figure 3. Laser Scanning Confocal Microscope of immunofluorescence staining of neuronal cells. The neurons were labeled with anti-NEUN antibodies, which appear green in the nucleus (indicated by yellow arrows). Cells nuclear were stained with DAPI (blue). The white arrow indicates non-neuronal cells.
Following the identification of neurons within the cultured olfactory epithelial cells, the expression of ORs was assessed. Initially, FISH revealed the presence of OR-β11 (OR114-1) (Supplementary Figure S2A). Subsequently, RT-PCR detected the expression of multiple ORs, including OR-β1, OR-β2, OR-β9, OR-β10, OR-β11, OR-β12, OR-β7, OR-β8, and OR-β15 (Supplementary Figure S2B).
3.4 Olfactory epithelial cells are activated by amino acid mixture and PGF2α
To investigate the potential activation of olfactory epithelium cells by amino acids mixture and PGF2α, phosphorylated ERK (pERK) was utilized as a neuronal activation marker (Cui et al., 2025; Masuda et al., 2024; Wakisaka et al., 2017). Olfactory epithelium cells were exposed to odor molecules in the culture medium and subsequently incubated in a 28 °C 5% CO2 incubator for 10 min. Each odor molecule was tested with three biological replicates, while DMSO served as the control odor. The results revealed that the amino acid mixture produced the highest number of labeled cells, approximately 20%, while PGF2α elicited a moderate response, with the proportion of labeled cells remaining below 20%. Therefore, exposure to the amino acid mixture and PGF2α significantly increased the number of olfactory epithelium cells labeled with pERK (P < 0.01), indicating that the cultured olfactory epithelium cells possess olfactory recognition function when activated by these specific stimuli (Figure 4).
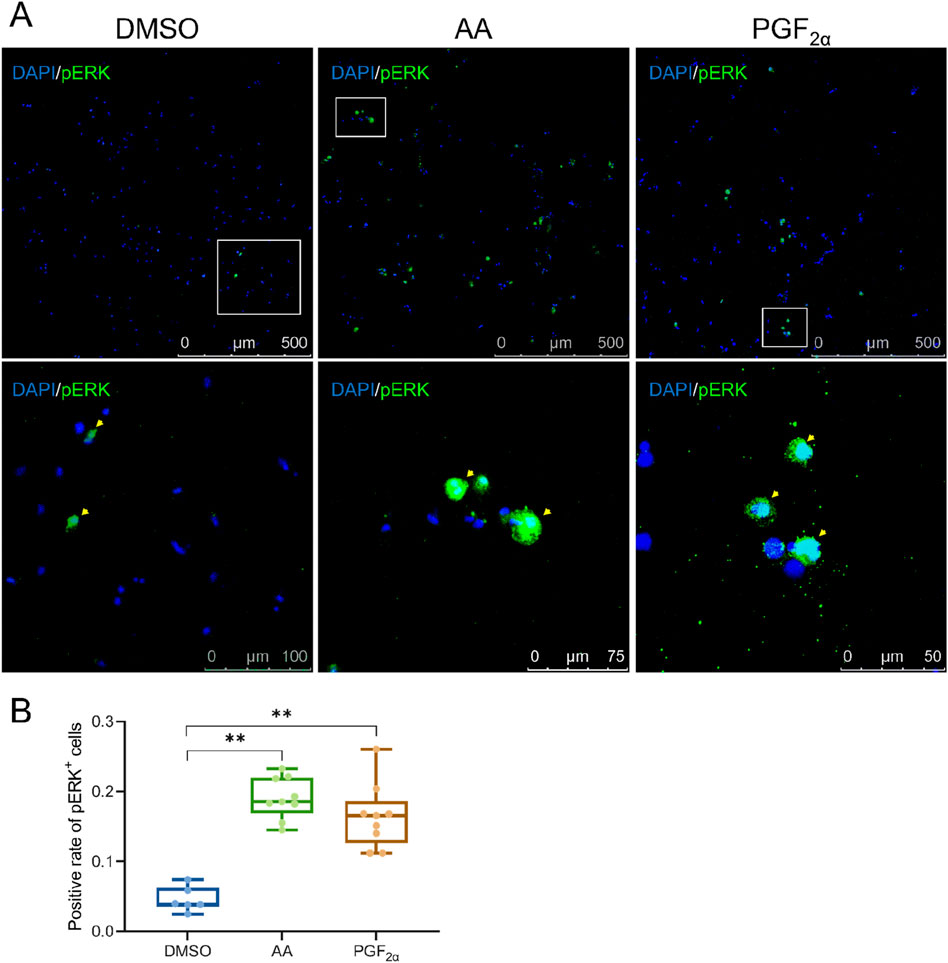
Figure 4. A small number of cells activated by the amino acid mixture and PGF2α were present among the olfactory epithelium cells. (A) Antibody staining of pERK in olfactory epithelium cells exposed to DMSO, AA (amino acid mixture), and PGF2α, respectively. (B) Quantification of activated olfactory epithelium cells. Odors with statistical significance are marked with * (P < 0.05) and highly significant by ** (P < 0.01).
3.5 Distinct molecular characteristics of the cultured olfactory epithelial cells exposed to PGF2α
Following exposure to odor molecules, total RNA from cultured olfactory epithelium cells was extracted in three independent biological replicates for each odor (a total of 9 samples, n = 3). Each sample yielded an average of 6.09 GB clean data. These high-quality reads were successfully aligned to the genome of M. amblycephala with a mapping success rate surpassing 95%. PCA analysis (Supplementary Figure S3A) confirmed acceptable reproducibility within each treatment group and highlights discernible differences, particularly in the PGF2α group. The distribution of gene expression levels in each sample and the degree of data dispersion were analyzed (Supplementary Figure S3B). The results demonstrated that the distribution of gene expression levels in the nine samples exhibited a reasonable pattern. Transcriptome analysis revealed that exposure to the amino acid mixture is with only 25 DEGs identified (Supplementary Figure S3C). In contrast, exposure to PGF2α significantly differs from DMSO, resulting in a total of 1,267 DEGs (P < 0.05), including 647 upregulated and 620 downregulated genes (Figure 5A). KEGG pathway enrichment analysis revealed that 1,267 differentially expressed genes were significantly enriched in 59 pathways (P < 0.05), with the top 30 pathways shown (Figure 5B). Among these pathways, ovarian steroidogenesis, GnRH signaling pathway, and oxytocin signaling pathway are closely associated with reproduction. Ovarian steroidogenesis involves 20 DEGs, the GnRH signaling pathway involves 21 DEGs, and the oxytocin signaling pathway involves 27 DEGs, with a total of 33 non-redundant DEGs across these three reproductive pathways (Figure 5C). Specifically, the expression levels of PLCβ and ARTISt were downregulated, while the expression levels of HB-EGF, EGFR, p38MAPK, PLA2, AC, cPLA, and COX-2 were upregulated. GO annotations indicated these genes are primarily involved in intracellular signal transduction and prostaglandin-endoperoxide synthase activity. Furthermore, the genes ptgs2b, ptgs2a, ptges related to prostaglandin E synthesis and PGE receptor ptger1a were also significantly upregulated (P < 0.01) (Table 2). The cAMP and cGMP-PKG signaling pathways are involved in the process of ORs binding with ligands. The genes prkg1b, rgs2, and ncalda which play an important role in the olfactory transduction, were upregulated after PGF2α simulation (Supplementary Figure S4). To assess the reliability of sequencing and subsequent data analysis, 7 DGEs were randomly selected for validation through qPCR experiments. The qPCR verification results were in accordance with the RNA-Seq data, thus confirming the accuracy and dependability of RNA-Seq measurements (Figure 5D).
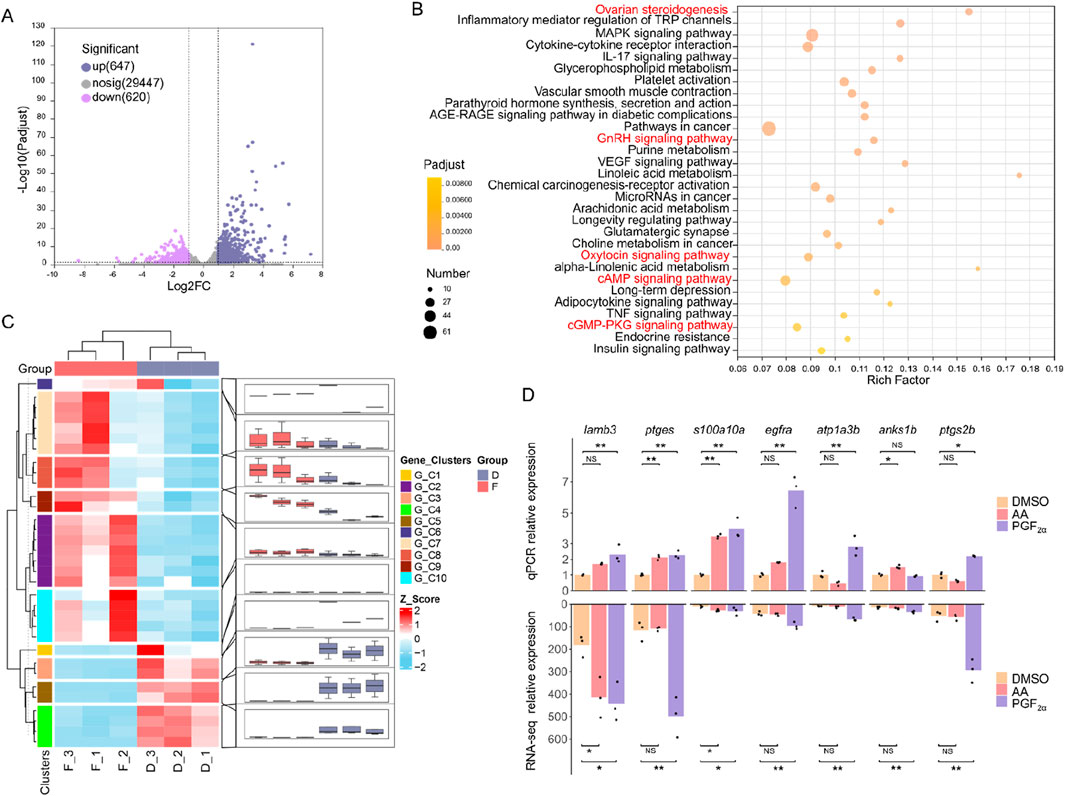
Figure 5. Transcriptome analysis of olfactory epithelium cells after exposure to PGF2α. (A) Log2-fold changes between DEGs after exposure to PGF2α and DMSO, plotted based on their log10 FDR. (B) KEGG pathway enrichment of differentially expressed genes between PGF2α and DMSO. Red shading indicates significant enrichment in key pathways associated with reproduction processes and olfactory signal transduction. (C) Heatmap depicting expression profiles of all 33 differentially expressed genes across three reproduction-associated pathways, clustered according to expression patterns. (D) The qPCR analysis quantified the expression of 7 DEGs. Data were normalized to β-actin as reference and presented as fold changes (mean ± SE) between the DMSO and amino acid mixture (AA) or PGF2α. Statistically significant differences are indicated by * (P < 0.05) and highly significant by ** (P < 0.01).
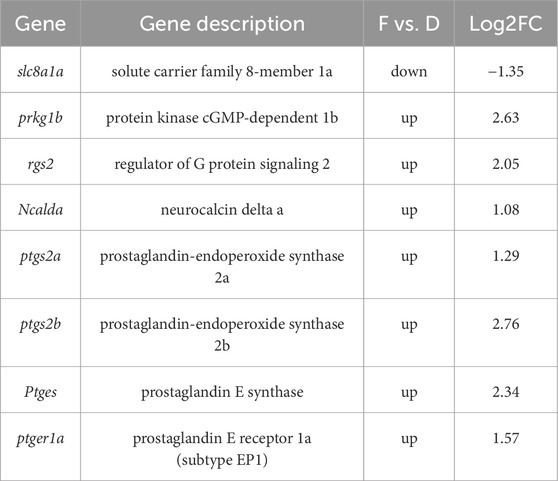
Table 2. Genes related to olfactory signal transduction after PGF2α simulation.
The olfactory epithelium cells exposed to PGF2α, DEGs was significantly enriched in ovarian steroidogenesis, GnRH signaling pathway, and oxytocin signaling pathway, all of which are highly interconnected. Consequently, we linked these pathways primarily through DEGs (Figure 6). We supposed that this pathway linkage elucidates the increased expression of PGE2 synthase and PGE receptors.
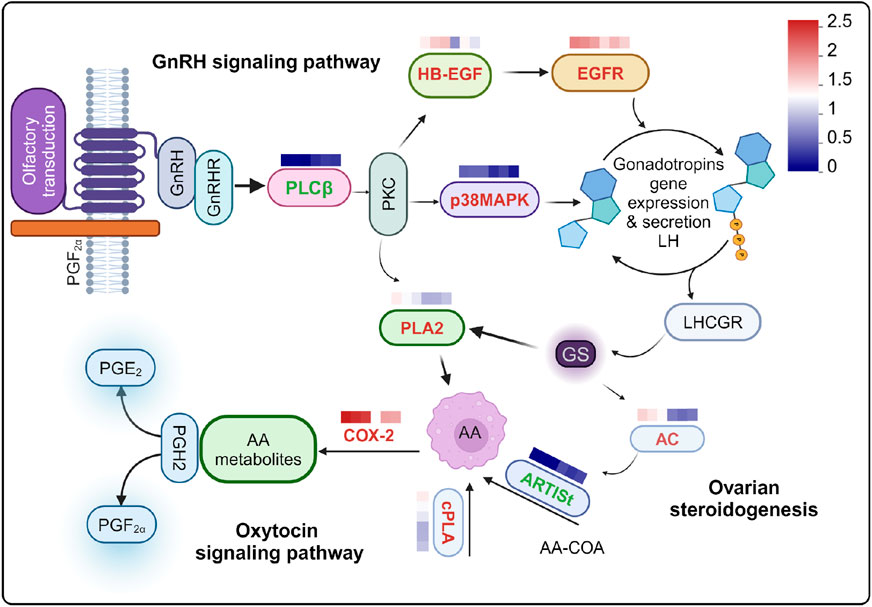
Figure 6. Relationships among reproductive-related pathways were examined following stimulation with PGF2α. Differentially expressed genes (DEGs) are indicated in bold font, with upregulated genes highlighted in red and downregulated genes highlighted in green. The heat map values represent log10 transformed absolute abundance. AA: Arachidonic acid. The heat map provides a comparison between PGF2α and DMSO.
4 Discussion
Culturing mammalian OSNs in vitro poses an ongoing challenge in neurobiological research. Previous studies suggest that OSNs have limited proliferation and differentiation capacity in vitro (Kicic et al., 2006; Martinovich et al., 2017). The prevalence of immature OSNs in culture is believed to impair their odor detection capabilities, resulting in limited research on the cultivation of OSNs in vitro. However, recent findings by Huang et al. (2022) have revealed the previously unrecognized potential of immature OSNs to perceive odors, leading many researchers to reassess the value of cultivating OSNs in vitro (Huang et al., 2022). The processing capability of immature OSNs at high odor concentrations is crucial for odor-guided behavior essential for survival, particularly when olfactory function is compromised (Huang et al., 2022). Additionally, single-cell RNA sequencing results indicate that 55% of human OSNs are immature (Durante et al., 2020), highlighting the significance of immature OSNs in the olfactory system and emphasizing increased research attention and substantial progress made towards understanding mammalian olfaction. Research conducted in mammalian systems has revealed a direct correlation between the olfactory sensitivity of animals and the quantity of functional ORs they possess (Niimura and Nei, 2006). Additionally, there is a growing interest in studying the expression and function of ORs in other tissues (Wu et al., 2024). However, the research on OSNs in fish species remains relatively scarce compared to mammals. To enhance our understanding of fish olfaction recognition mechanisms through improved OSNs cultivation techniques, we selected the economically significant fish species M. amblycephala for the in vitro cultivation of olfactory epithelial cells.
In cell culture, explant and enzyme digestion are two commonly used techniques. The explant technique allows for continuous extraction of new cells from each explant, thereby significantly reducing harm to animal models. When utilizing the explant technique to cultivate olfactory epithelial cells of M. amblycephala, some neurons migrated out from the explants, exhibiting a morphology consistent with OSNs cultivated from mammal embryos (Micholt et al., 2012; Martinovich et al., 2017). However, the small number of cells derived from the explants resulted in a lack of cellular contact. Additionally, this phenomenon lacks consistency, as certain explants do not possess the capacity to migrate cells outward. Furthermore, through repeated experiments, we have confirmed that the olfactory epithelial explants of M. amblycephala do not exhibit neuronal migration. We posit that these differences in characteristics during in vitro culture stem from variances in tissue fragments originating from distinct regions of the olfactory epithelium. Due to differences in tissue and cellular specificity, it is speculated that culturing M. amblycephala OSNs using explants may not be suitable. We observed that the explant method exhibited a significantly higher contamination rate. This is likely due to the direct exposure of fish olfactory epithelial tissue to the aquatic environment, which presents a considerable challenge for explant culture.
Trypsinization exerts detrimental proteolytic effects, including the disruption of membrane protein integrity, alteration of cytoplasmic composition, and potential induction of cell death (Lordon et al., 2024). In mammals, collagenase I is primarily employed for dissociating epithelial cells (Lin et al., 2016), while collagenase IV is used for dissociating neurons. In the present study, we utilized a combination of collagenase I, collagenase IV, and trypsin-EDTA (0.25%) for the dissociation of olfactory epithelium cells (Lan et al., 2022). Prior to dissociation using collagenase, we excised the olfactory mucosa to minimize cell contamination (Randell et al., 2001). Following dissociation, olfactory epithelium cells were cultured in a growth medium containing 20% FBS for 24–36 h. The high concentration of FBS enhances cell adhesion (Fan and Karino, 2008). After adhesion, changing the neuronal culture medium facilitates neuronal growth. Upon observation, we discovered that olfactory epithelium cells obtained through collagenase digestion exhibit robust stability, accelerated growth, and distinctive neuronal morphological characteristics. SEM also revealed cells exhibiting the morphology of olfactory neurospheres (Li et al., 2018). In the olfactory epithelium tissue, sensory neurons constitute approximately 80% of the cell population (Bettina et al., 1999). NEUN is an antibody used as a maker for the identification of neuronal cells (Jiang et al., 2024). Most labeled cells are identified as neurons by this antibody staining method, while unlabeled cells are recognized as non-neuronal. Non-neuronal cells play a crucial role in promoting the growth and differentiation of OSNs (Dietz et al., 2023). OSNs express ORs, enabling them to recognize odor molecules (Buck and Axel, 1991; Niimura et al., 2014). FISH and RT-PCR detected the native expression of ORs in cultured cells derived from fish olfactory epithelial tissue, indicating that the cultured olfactory epithelial cells retain the ability to recognize odors.
Compared to DMSO, exposure to the amino acid mixture and PGF2α significantly augmented the population of pERK-labeled olfactory epithelial cells. We propose that a subset of these labeled cells is stimulated by odor molecules, akin to the observations made in piscine olfactory organs (Wakisaka et al., 2017). Additionally, the RNA-seq results revealed the upregulation of the expression levels of prkg1b, slc8a1a, ncalda and rgs2, which play crucial roles in the olfactory transduction (Supplementary Figure S4). Previous studies have indicated that upon recognition of odor molecules by ORs, three key signal transduction pathways, namely, cAMP (Sands and Palmer, 2008), IP3(Fadool and Ache, 1992), and cGMP (Meyer et al., 2000), are activated. These activated specific signaling pathways reflect the characteristics of OSNs. In zebrafish, stimulation with PGF2α has been observed to activate ciliated OSNs (Yabuki et al., 2016). Following activation, the G protein α subunit Golf converts intracellular ATP to cyclic adenosine monophosphate (cAMP) (Bakalyar and Reed, 1990). Elevated levels of intracellular cAMP then function as a secondary messenger, which triggers neural impulse generation within these cells (Restrepo et al., 1996; Sands and Palmer, 2008). However, some ciliated OSNs lack functional components required for the cAMP signaling pathway like Golf. In such cases, the cGMP signaling pathway serves as a crucial second messenger (Ma, 2007). Both pathways exhibit significant enrichment in the present study, leading us to speculate that PGF2α activates the cultured OSNs.
PGF2α acts as a sex pheromone (Lim and Sorensen, 2011; Sorensen et al., 2018), exerting influence on courtship behaviors in male zebrafish through the olfactory system (Yabuki et al., 2016). After exposure to PGF2α, there is an increase in PGE2 synthase and PGE receptor expression upon exposure to PGF2α. Recent findings indicate that PGE2 plays a role in synchronizing lunar-regulated beach-spawning behavior in grass puffers (Chen et al., 2022).
In summary, we employed collagenase digestion effectively to culture fish olfactory epithelial cells, and their morphological characteristics were validated using SEM. Following neuronal cell labeling with NEUN antibody, FISH and RT-PCR assays confirmed the expression of ORs. Although olfactory responsiveness was assessed within a relatively short time frame in cultured olfactory epithelial cells, this methodology represents a notable advancement in teleost olfactory research. It offers an alternative strategy to mitigate stress responses associated with in vivo fish experiments, establishes a novel platform for high-throughput receptor screening, and serves as a crucial foundation for conducting single-cell patch-clamp electrophysiology to study olfactory function in vitro. Future studies will focus on establishing continuous cell lines of fish OSNs to further enhance our understanding of their importance in survival and reproduction.
Data availability statement
The data presented in the study are deposited in the NCBI repository, accession number PRJNA1311481 at: https://dataview.ncbi.nlm.nih.gov/object/PRJNA1311481?reviewer=skf6gieokua7h11o64ukc9ifhr.
Ethics statement
The animal study was approved by Institutional Animal Care and Use Committee (IACUC) at Huazhong Agricultural University (Approval number: HZAUFI-2018–008). The study was conducted in accordance with the local legislation and institutional requirements.
Author contributions
SG: Data curation, Formal Analysis, Investigation, Methodology, Writing – original draft. XH: Data curation, Formal Analysis, Resources, Writing – review and editing. DZ: Data curation, Formal Analysis, Writing – review and editing. ZG: Writing – review and editing. HL: Conceptualization, Funding acquisition, Writing – review and editing.
Funding
The author(s) declare that financial support was received for the research and/or publication of this article. This work was financially supported by the National Natural Science Foundation of China (32273109 and 32341062), the Fundamental Research Funds for the Central Universities, and the China Agriculture Research System of MOF and MARA (No. CARS-45–01).
Acknowledgments
The authors would like to acknowledge the College of Fisheries at Huazhong Agricultural University for providing all the facilities necessary for this research. We express our gratitude to all the participants in this study.
Conflict of interest
The authors declare that the research was conducted in the absence of any commercial or financial relationships that could be construed as a potential conflict of interest.
Generative AI statement
The author(s) declare that no Generative AI was used in the creation of this manuscript.
Any alternative text (alt text) provided alongside figures in this article has been generated by Frontiers with the support of artificial intelligence and reasonable efforts have been made to ensure accuracy, including review by the authors wherever possible. If you identify any issues, please contact us.
Publisher’s note
All claims expressed in this article are solely those of the authors and do not necessarily represent those of their affiliated organizations, or those of the publisher, the editors and the reviewers. Any product that may be evaluated in this article, or claim that may be made by its manufacturer, is not guaranteed or endorsed by the publisher.
Supplementary material
The Supplementary Material for this article can be found online at: https://www.frontiersin.org/articles/10.3389/fcell.2025.1587151/full#supplementary-material
References
Ahn, J. H., Kim, J., Hong, S. P., Choi, S. Y., Yang, M. J., Ju, Y. S., et al. (2021). Nasal ciliated cells are primary targets for SARS-CoV-2 replication in the early stage of COVID-19. J. Clin. Invest 131, e148517. doi:10.1172/JCI148517
Andrew, C., Itamar, S., Howard, C., and Axel, R. (1994). Allelic inactivation regulates olfactory receptor gene expression. Cell 78 (5), 823–834. doi:10.1016/s0092-8674(94)90562-2
Bakalyar, H. A., and Reed, R. R. (1990). Identification of a specialized adenylyl cyclase that may mediate odorant detection. Science. 250 (4986), 1403–1406. doi:10.1126/science.2255909
Bazáes, A., Olivares, J., and Schmachtenberg, O. (2013). Properties, projections, and tuning of teleost olfactory receptor neurons. J. Chem. Ecol. 39 (4), 451–464. doi:10.1007/s10886-013-0268-1
Bettina, M., Junzo, H., Takaaki, S., and Buck, L. B. (1999). Combinatorial receptor codes for odors. Cell 96 (5), 713–723. doi:10.1016/s0092-8674(00)80581-4
Braubach, O. R., Fine, A., and Croll, R. P. (2012). Distribution and functional organization of glomeruli in the olfactory bulbs of zebrafish (Danio rerio). J. Comp. Neurol. 520 (11), 2317–2339. doi:10.1002/cne.23075
Buck, L., and Axel, R. (1991). A novel multigene family may encode odorant receptors: a molecular basis for odor recognition. Cell 65 (1), 175–187. doi:10.1016/0092-8674(91)90418-x
Chen, J., Katada, Y., Okimura, K., Yamaguchi, T., Guh, Y.-J., Nakayama, T., et al. (2022). Prostaglandin E2 synchronizes lunar-regulated beach spawning in grass puffers. Curr. Biol. 32 (22), 4881–4889.e5. doi:10.1016/j.cub.2022.09.062
Cong, X., Zheng, Q., Ren, W., Chéron, J.-B., Fiorucci, S., Wen, T., et al. (2019). Zebrafish olfactory receptors ORAs differentially detect bile acids and bile salts. J. Biol. Chem. 294 (17), 6762–6771. doi:10.1074/jbc.RA118.006483
Cui, X., Chen, L., Tao, B., Zhang, X., Song, Y., Chen, J., et al. (2025). Olfactory GnRH3 crypt sensory neurons transduce sex pheromone signals to induce male courtship behavior in zebrafish. Sci. China Life Sci. 68, 2191–2205. doi:10.1007/s11427-025-2917-5
Dietz, A., Senf, K., Karius, J., Stumm, R., and Neuhaus, E. M. (2023). Glia cells control olfactory neurogenesis by fine-tuning CXCL12. Cells 12 (17), 2164. doi:10.3390/cells12172164
Durante, M. A., Kurtenbach, S., Sargi, Z. B., Harbour, J. W., Choi, R., Kurtenbach, S., et al. (2020). Single-cell analysis of olfactory neurogenesis and differentiation in adult humans. Nat. Neurosci. 23 (3), 323–326. doi:10.1038/s41593-020-0587-9
Fadool, D. A., and Ache, B. W. (1992). Plasma membrane inositol 1,4,5-Trisphosphate-Activated channels mediate signal transduction in lobster olfactory receptor neurons. Neuron 9 (5), 907–918. doi:10.1016/0896-6273(92)90243-7
Fan, L., and Karino, T. (2008). Effect of serum concentration on adhesion of monocytic THP-1 cells onto cultured EC monolayer and EC-SMC co-culture. J. Zhejiang Univ. Sci. B 9 (8), 623–629. doi:10.1631/jzus.B0820046
Firestein, S. (2001). How the olfactory system makes sense of scents. Nature 413, 211–218. doi:10.1038/35093026
Gao, K., Gao, F., Li, J., He, C., Liu, M., Zhu, Q., et al. (2021). Biomimetic integrated olfactory sensory and olfactory bulb systems in vitro based on a chip. Biosens. Bioelectron. 171, 112739. doi:10.1016/j.bios.2020.112739
Hao, S., Ning, K., Kuz, C. A., Vorhies, K., Yan, Z., and Qiu, J. (2020). Long-term modeling of SARS-CoV-2 infection of in vitro cultured polarized human airway epithelium. mBio 11 (6), e02852–20. doi:10.1128/mBio.02852-20
Hou, Y. J., Okuda, K., Edwards, C. E., Martinez, D. R., Asakura, T., Dinnon, K. H., et al. (2020). SARS-CoV-2 reverse genetics reveals a variable infection gradient in the respiratory tract. Cell 182 (2), 429–446. doi:10.1016/j.cell.2020.05.042
Huang, J. S., Kunkhyen, T., Rangel, A. N., Brechbill, T. R., Gregory, J. D., Winson-Bushby, E. D., et al. (2022). Immature olfactory sensory neurons provide behaviourally relevant sensory input to the olfactory bulb. Nat. Commun. 13 (1), 6194. doi:10.1038/s41467-022-33967-6
Hughes, G. M., Boston, E. S. M., Finarelli, J. A., Murphy, W. J., Higgins, D. G., and Teeling, E. C. (2018). The birth and death of olfactory receptor gene families in mammalian niche adaptation. Mol. Biol. Evol. 35 (6), 1390–1406. doi:10.1093/molbev/msy028
Jiang, H.-C., Park, S. J., Wang, I.-H., Bear, D. M., Nowlan, A., and Greer, P. L. (2024). CD20/MS4A1 is a mammalian olfactory receptor expressed in a subset of olfactory sensory neurons that mediates innate avoidance of predators. Nat. Commun. 15 (1), 3360. doi:10.1038/s41467-024-47698-3
Kicic, A., Sutanto, E. N., Stevens, P. T., Knight, D. A., and Stick, S. M. (2006). Intrinsic biochemical and functional differences in bronchial epithelial cells of children with asthma. Am. J. Respir. Crit. Care Med. 174 (10), 1110–1118. doi:10.1164/rccm.200603-392OC
Lacroix, M. C., Badonnel, K., Meunier, N., Tan, F., Poupon, S. L., Durieux, D., et al. (2008). Expression of insulin system in the olfactory epithelium: first approaches to its role and regulation. J. Neuroendocrinol. 20 (10), 1176–1190. doi:10.1111/j.1365-2826.2008.01777.x
Lan, Y.-X., Yang, P., Zeng, Z., Yadav, N., Zhang, L.-J., Wang, L.-B., et al. (2022). Gene and protein expression profiles of olfactory ensheathing cells from olfactory bulb versus olfactory mucosa. Neural Regen. Res. 17 (2), 440–449. doi:10.4103/1673-5374.317986
Li, S. T., Young, T. H., Wang, C. T., and Huang, T. W. (2018). Chitosan films promote formation of olfactory neurospheres and differentiation of olfactory receptor neurons. Rhinology 56 (4), 336–342. doi:10.4193/Rhin17.155
Lim, H., and Sorensen, P. W. (2011). Polar metabolites synergize the activity of prostaglandin F2α in a species-specific hormonal sex pheromone released by ovulated common carp. J. Chem. Ecol. 37 (7), 695–704. doi:10.1007/s10886-011-9976-6
Lin, J., Yang, L., Silva, H. M., Trzeciak, A., Choi, Y., Schwab, S. R., et al. (2016). Increased generation of Foxp3+ regulatory T cells by manipulating antigen presentation in the thymus. Nat. Commun. 7, 10562. doi:10.1038/ncomms10562
Liu, H., Chen, C., Lv, M., Liu, N., Hu, Y., Zhang, H., et al. (2021). A chromosome-level assembly of blunt snout bream (Megalobrama amblycephala) genome reveals an expansion of olfactory receptor genes in freshwater fish. Mol. Biol. Evo 38 (10), 4238–4251. doi:10.1093/molbev/msab152
Lordon, B., Campion, T., Gibot, L., and Gallot, G. (2024). Impact of trypsin on cell cytoplasm during detachment of cells studied by terahertz sensing. Biophys. J. 123 (16), 2476–2483. doi:10.1016/j.bpj.2024.06.011
Ma, M. (2007). Encoding olfactory signals via multiple chemosensory systems. Crit. Rev. Biochem. Mol. 42 (6), 463–480. doi:10.1080/10409230701693359
Martinovich, K. M., Iosifidis, T., Buckley, A. G., Looi, K., Ling, K.-M., Sutanto, E. N., et al. (2017). Conditionally reprogrammed primary airway epithelial cells maintain morphology, lineage and disease specific functional characteristics. Sci. Rep. 7 (1), 17971. doi:10.1038/s41598-017-17952-4
Masuda, M., Ihara, S., Mori, N., Koide, T., Miyasaka, N., Wakisaka, N., et al. (2024). Identification of olfactory alarm substances in zebrafish. Cur Biol. 34 (7), 1377–1389.e7. doi:10.1016/j.cub.2024.02.003
Meyer, M. R., Angele, A., Kremmer, E., Kaupp, U. B., and Müller, F. (2000). A cGMP-signaling pathway in a subset of olfactory sensory neurons. Proc. Natl. Acad. Sci. U.S.A. 97 (19), 10595–10600. doi:10.1073/pnas.97.19.10595
Micholt, E., Jans, D., Callewaert, G., Bartic, C., Lammertyn, J., and Nicolai, B. (2012). Primary culture of embryonic rat olfactory receptor neurons. Vitro Cell Dev. Biol. 48 (10), 650–659. doi:10.1007/s11626-012-9560-6
Murrell, W., Féron, F., Wetzig, A., Cameron, N., Splatt, K., Bellette, B., et al. (2005). Multipotent stem cells from adult olfactory mucosa. Dev. Dyn. 233 (2), 496–515. doi:10.1002/dvdy.20360
Niimura, Y., and Nei, M. (2006). Evolutionary dynamics of olfactory and other chemosensory receptor genes in vertebrates. J. Hum. Genet. 51, 505–517. doi:10.1007/s10038-006-0391-8
Niimura, Y., Matsui, A., and Touhara, K. (2014). Extreme expansion of the olfactory receptor gene repertoire in African elephants and evolutionary dynamics of orthologous gene groups in 13 placental mammals. Genome Res. 24 (9), 1485–1496. doi:10.1101/gr.169532.113
Peterson, J., Lin, B., Barrios-Camacho, C. M., Herrick, D. B., Holbrook, E. H., Jang, W., et al. (2019). Activating a reserve neural stem cell population in vitro enables engraftment and multipotency after transplantation. Stem Cell Rep. 12 (4), 680–695. doi:10.1016/j.stemcr.2019.02.014
Policarpo, M., Baldwin, M. W., Casane, D., and Salzburger, W. (2024). Diversity and evolution of the vertebrate chemoreceptor gene repertoire. Nat. Commun. 15 (1), 1421. doi:10.1038/s41467-024-45500-y
Randell, S. H., Walstad, D. L., Schwab, U. E., Yankaskas, G. J. R., and Yankaskas, J. R. (2001). Isolation and culture of airway epithelial cells from chronically infected human lungs. Vitro Cell Dev. Biol. Anim. 37 (8), 480–489. doi:10.1290/1071-2690(2001)037<0480:iacoae>2.0.co;2
Ren, W., Wang, L., Zhang, X., Feng, X., Zhuang, L., Jiang, N., et al. (2021). Expansion of murine and human olfactory epithelium/mucosa colonies and generation of mature olfactory sensory neurons under chemically defined conditions. Theranostics 11 (2), 684–699. doi:10.7150/thno.46750
Restrepo, D., Teeter, J. H., and Schild, D. (1996). Second messenger signaling in olfactory transduction. J. Neurobiol. 30 (1), 37–48. doi:10.1002/(SICI)1097-4695(199605)30:1<37::AID-NEU4>3.0.CO;2-H
Sands, W. A., and Palmer, T. M. (2008). Regulating gene transcription in response to cyclic AMP elevation. Cell Signal 20 (3), 460–466. doi:10.1016/j.cellsig.2007.10.005
Schmittgen, T. D., and Livak, K. J. (2008). Analyzing real-time PCR data by the comparative CT method. Nat. Protoc. 3 (6), 1101–1108. doi:10.1038/nprot.2008.73
Schwarzenbacher, K., Fleischer, J., and Breer, H. (2005). Formation and maturation of olfactory cilia monitored by odorant receptor-specific antibodies. Histochem Cell Biol. 123 (4-5), 419–428. doi:10.1007/s00418-005-0790-5
Soelter, J., Schumacher, J., Spors, H., and Schmuker, M. (2020). Computational exploration of molecular receptive fields in the olfactory bulb reveals a glomerulus-centric chemical map. Sci. Rep. 10 (1), 77. doi:10.1038/s41598-019-56863-4
Sorensen, P. W., Appelt, C., Stacey, N. E., Goetz, F.Wm., and Brash, A. R. (2018). High levels of circulating prostaglandin F2α associated with ovulation stimulate female sexual receptivity and spawning behavior in the goldfish (Carassius auratus). Gen. Comp. Endocrinol. 267, 128–136. doi:10.1016/j.ygcen.2018.06.014
Suzuki, Y., and Takeda, M. (1993). Basal cells in the mouse olfactory epithelium during development: immunohistochemical and electron-microscopic studies. Brain Res. Dev. Brain Res. 73 (1), 107–113. doi:10.1016/0165-3806(93)90052-c
Wakisaka, N., Miyasaka, N., Koide, T., Masuda, M., Hiraki-Kajiyama, T., and Yoshihara, Y. (2017). An adenosine receptor for olfaction in fish. Cur Biol. 27 (10), 1437–1447. doi:10.1016/j.cub.2017.04.014
Wu, C.-T., Lidsky, P. V., Xiao, Y., Cheng, R., Lee, I. T., Nakayama, T., et al. (2023). SARS-CoV-2 replication in airway epithelia requires motile cilia and microvillar reprogramming. Cell 186 (1), 112–130.e20. doi:10.1016/j.cell.2022.11.030
Wu, C., Xu, M., Dong, J., Cui, W., and Yuan, S. (2024). The structure and function of olfactory receptors. Trends Pharmacol. Sci. 45 (3), 268–280. doi:10.1016/j.tips.2024.01.004
Keywords: Megalobrama amblycephala, olfactory epithelium cells, in vitro culture, collagenase dissociation, olfactory receptors (ORs), prostaglandin F2α (PGF2α)
Citation: Guan S, Huang X, Zhu D, Gao Z and Liu H (2025) In vitro culture of olfactory epithelial cells from Megalobrama amblycephala and their response to amino acid mixtures and prostaglandin F2α. Front. Cell Dev. Biol. 13:1587151. doi: 10.3389/fcell.2025.1587151
Received: 25 March 2025; Accepted: 20 August 2025;
Published: 11 September 2025.
Edited by:
Warren W. Burggren, University of North Texas, United StatesReviewed by:
Doaa M. Mokhtar, Assiut University, EgyptSharath Belame Shivakumar, Mayo Clinic, United States
Copyright © 2025 Guan, Huang, Zhu, Gao and Liu. This is an open-access article distributed under the terms of the Creative Commons Attribution License (CC BY). The use, distribution or reproduction in other forums is permitted, provided the original author(s) and the copyright owner(s) are credited and that the original publication in this journal is cited, in accordance with accepted academic practice. No use, distribution or reproduction is permitted which does not comply with these terms.
*Correspondence: Han Liu, bGl1aGFuQG1haWwuaHphdS5lZHUuY24=