 Ron George Philip
 Priyanka Bhatia
 Yojet Sharma
 Padinjat Raghu
- 1Centre for Doctoral Studies, Manipal Academy of Higher Education, Manipal, India
- 2National Centre for Biological Sciences-TIFR, Bangalore, India
Lowe syndrome (LS) is an X-linked, recessive disease with a characteristic clinical triad of eye, brain, and kidney defects. LS results from mutations in the OCRL gene that encodes for inositol polyphosphate 5-phosphatase enzyme. The OCRL protein has been localized to multiple subcellular organelles including the plasma membrane and endo-lysosomal system, but the relevance of these to disease phenotypes is unclear. Previous studies have reported severe hypotonia at birth in LS patients along with structural changes in the mitochondria in muscle biopsies. These mitochondrial changes have been proposed to be secondary to renal tubular acidosis seen in LS patients. In this study, we find that neural stem cells and neurons differentiated from OCRL-depleted induced pluripotent stem cells (iPSCs) show mild defects in mitochondrial structure and function, whereas such defects are not seen in the iPSCs themselves. These mitochondrial phenotypes in neural stem cells and neurons were associated with modest changes in the mitochondrial transcriptome. Overall, our results indicate that loss of OCRL leads to mild cell autonomous defects in mitochondrial structure and function that is cell type-dependent.
Introduction
The oculo-cerebro-renal syndrome of Lowe, also known as Lowe syndrome (LS), is a rare, autosomal recessive genetic disorder characterized by the clinical triad of eye, brain, and kidney abnormalities. Most patients are born with congenital cataracts, which can be surgically corrected within the first few months of infancy, and some also develop glaucoma. The nervous system and renal symptoms can vary among patients. Clinical features include intellectual disability, developmental delay, growth delay, hypotonia, and seizures. Abnormal renal function manifests as a proximal renal tubule dysfunction that worsens over time and can lead to renal failure (LOWE et al., 1952; Schoen, 1959; Sagel et al., 1970). The prevalence of LS is estimated to be approximately 1 in 500,000 individuals worldwide (Loi, 2006).
LS is a monogenic disorder caused by mutations in the OCRL gene, which encodes the inositol polyphosphate 5-phosphatase enzyme, OCRL. The OCRL protein predominantly dephosphorylates phosphatidylinositol 4,5 bisphosphate [PI(4,5)P2] to phosphatidylinositol 4 phosphate [PI4P](Attree et al., 1992; Olivos-Glander et al., 1995). OCRL also shows activity toward other polyphosphates, including [PI(3,4,5)P3]. OCRL is a multi-domain enzyme with a catalytic 5-phosphatase domain, an N-terminal, inactive PH domain, a RhoGAP, and an ASH domain toward the C-terminal. These domains render domain-specific functions, broadly placing OCRL in pathways regulating endo-lysosomal and actin cytoskeletal homeostasis [reviewed in (Mehta et al., 2014)]. In cells, OCRL has been localized to multiple subcellular locations, including the plasma membrane, Golgi apparatus, the endo-lysosomal system, and the primary cilia (Mehta et al., 2014).
There are a few reports of patients presenting with clinical features of renal tubular acidosis, which, on further investigation by electron microscopy, exhibited swollen mitochondria and disruption of mitochondrial cristae in renal tubular cells isolated from patients. These patients were later diagnosed to have LS, and the significance of the abnormal mitochondria was ascribed to a mere association (Schoen, 1959; Sagel et al., 1970). To ascertain the relationship of the mitochondria in LS, isolated mitochondria from muscle biopsies of an LS patient were analyzed using biochemical tests of respiration. These results indicated defective oxidative phosphorylation in the isolated mitochondria (Gobernado et al., 1984). The clinical presentation of LS was thereby associated with having some characteristics like mitochondrial disorders. Patients initially suspected to have a mitochondrial disease from clinical evaluation were later found to have an OCRL mutation from whole-exome sequencing, while having no mutations indicative of a mitochondrial disorder, highlighting the potential link between LS and mitochondrial function (Craigen et al., 2013; Dumic et al., 2020).
To date, no study has thoroughly addressed the pathophysiological basis of the mitochondrial defects detected in assays of clinical samples from LS patients. A recent study of induced neurons (iN) generated from induced pluripotent stem cells derived from LS patients and an OCRLKO line showed defective oxidative phosphorylation along with elevated levels of 8-oxo-Dg, a cellular ROS indicator (Lo et al., 2024). While the defective oxidative phosphorylation in LS-derived neural cells recapitulates reports of defective mitochondrial function in LS patient-derived renal and muscle samples, the state of mitochondria in these cells is not known, and the levels of 8-oxo-DG, reported to be elevated in this study, do not directly correlate to mitochondrial ROS species.
The mitochondria are autonomous organelles that can modulate their structure and function in response to changes in the intracellular environment. One notable feature of these changes is their ability to undergo fission and fusion reactions. Fusion enables the complementation of defective mitochondria with healthy ones, while fission promotes the elimination of sub-optimally performing components through mitophagy. This dynamic process allows the mitochondria to adopt various morphologies, ranging from networked to fragmented structures. Each morphological subtype signifies a change in the stable homeostasis of the fission/fusion balance (Youle and van der Bliek, 2012). There is limited evidence for the presence of phosphatidylinositol (PI) on the mitochondrial membrane or for the mitochondria as a primary site for the synthesis of phosphoinositides. However, the mitochondria do form membrane contact sites with the endoplasmic reticulum, the primary site of PI synthesis, and it has been suggested that phosphoinositides may be transferred to the mitochondria following synthesis on other organelle membranes [reviewed in (Lourdes et al., 2024)]. This may result in secondary or indirect effects on mitochondrial structure and function in cells with altered phosphoinositide metabolism and may also explain the mitochondrial defects reported in LS patient-derived samples (see above). As many mitochondrial disorders are associated with dysfunction of the central nervous system (Pei and Wallace, 2018), we used CRISPR-Cas9-mediated OCRL knockout (OCRLKO) in iPSC-derived neural stem cells (NSCs) and neurons to characterize mitochondrial structure and function in OCRL-deleted cells. We found mild defects in mitochondrial structure and function in OCRLKO NSC and neurons, but not in iPSCs, that likely arise from changes secondary to defects in other organelles where OCRL is localized.
Materials and methods
Cell lines and culture conditions
hiPSC
The generation and characterization of the NCRM5 hiPSCs, which were used as the control, have previously been described (Baghbaderani et al., 2015). The hiPSCs were cultured on hESC-qualified Matrigel-coated plates (Corning, # 354277) and maintained in Stemflex medium (Gibco, #A3349401) at 37 °C and 5% CO2 throughout. Routine passaging was done with EDTA (Sigma, #E8008), and the cultures were screened for mycoplasma contamination using the Lonza Mycoplasma detection kit (#LT-07 318).
Generation of OCRLKO iPSC
The generation and characterization of the OCRL Knockout iPSC line (OCRLKO) have previously been described (Sharma et al., 2024). In brief, the iPSC line was generated using CRISPR-Cas9 gene editing in the NCRM5 iPSC line, using two sgRNAs, OCRL-688-G1 and OCRL-688-G2, which were designed to target OCRL exon 8 to result in a null mutation, truncating the protein before the catalytic domain.
Karyotyping
Chromosomal integrity of hiPSCs and NSCs was confirmed using karyotyping. For metaphase preparation, cells were arrested in the log phase by treating with 0.1 μg/mL Colcemid™ (Gibco, #15212-012) for 45 min at 37 °C. Cells were harvested in fresh Carnoy’s fixative (methanol: glacial acetic acid at 3:1), and G-banding karyotype analysis was performed at a National Accreditation Board for Testing and Calibration Laboratories, India (NABL) accredited facility.
Generation of NSC
NSCs were generated from the NCRM5 and OCRLKO iPSC lines as previously described (Akhtar et al., 2022) with a few modifications. Briefly, the iPSCs were cultured in suspension to form embryoid bodies (EB) in E6 medium. Once healthy EBs were formed, 10 μM SB (SB431542 hydrate, Sigma, 301,836-41-9) and 100 nM LDN (LDN 193189 Hydrochloride, Sigma, 1062368-24-4) were added to E6 and maintained for 5 days. Following this, the EBs were transferred to Neural Induction Media (NIM) with 10 μM SB and 100 nM LDN and maintained for another 5 days. The EBs were then plated onto hESC-Matrigel-coated plates (Corning, # 354277). Primary rosettes formed were then manually cut under a dissection microscope to obtain secondary rosettes. These were further purified by selection to obtain tertiary rosettes. They were then cultured as a monolayer of NSCs in Neural Expansion Medium (NEM). The NSCs were subsequently purified for enrichment and to remove neural crest cells (NCCs) using FACS (Cheng et al., 2017; Mukherjee et al., 2019). The NSCs were enzymatically dissociated using Stempro Accutase (Gibco, #A11105-01), pelleted down, and washed in PBS, following which they were immunolabeled using CD133-PE conjugated primary antibody (Abcam, #ab253271) at 10 μL antibody/million cells and CD271-AF647 conjugated antibody (Proteogen, #560326) at 15 μL antibody/million cells for 30 min at room temperature in the dark. Cells were then washed with PBS and resuspended in sorting media [(1XDMEM/F12-without phenol red (Gibco, #21041025), 1% FBS (Gibco, #16000-044)+Penicillin–Streptomycin (Gibco, #15140-122)] at a concentration of 2 million cells/mL sorting media to obtain efficient sorting. The cells were FACS-sorted using the Aria-III instrument (BD Biosciences). Forward and side scatter parameters were adjusted to eliminate cell clumps and debris. CD133+ and CD271- cells were sorted. Cells with the highest fluorescence intensity were collected and plated on Matrigel at a concentration of 0.5 million cells per well of a 12-well tissue culture plate in NEM and expanded. Cells were periodically checked for bacterial or mycoplasma contamination. NSCs were further characterized by immunofluorescence and neuronal differentiation.
Generation of terminally differentiated neurons
Terminal differentiation of NSCs into cortical neurons was done as previously described (Sharma et al., 2020). Briefly, ∼30,000-50,000 NSCs were plated in confocal dishes coated with poly-L-ornithine/laminin and maintained in neural differentiation medium (NDM) supplemented with 10 ng/mL BDNF (Gibco # PHC7074), GDNF (Gibco #PHC7041), IGF (Gibco, #PHG0078) ascorbic acid (50 μM, Sigma # A4544), and dbcAMP (1000μM, Sigma #D0627). During the first 14 days after plating, cells were treated with 2 μM DAPT (Sigma-Aldrich #D5942) to synchronize the neuronal maturation process. The neurons were differentiated until days in vitro (DIV) 30 and 40.
Mitochondrial morphology and network characteristics
The morphology of the mitochondria was quantified by live cell staining with MitoTracker™ Green FM (Invitrogen™, #M7514). iPSCs/NSCs were seeded at 1 × 10⁵ cells/dish in confocal dishes (Biofil, #BDD011035) and kept overnight. The following day, the cells (iPSCs, NSCs) were incubated with 20 nM MitoTracker™ Green FM for 30 min at 37 °C, followed by washing once with PBS. Then, 1 μg/mL Hoechst (Invitrogen™, #33342) was added to the cells for the last 10 min of the MitoTracker™ Green FM incubation window to stain the nucleus. The cells were then immediately analyzed on the Olympus FV3000 confocal microscope with a 60X oil immersion objective. Hoechst was excited using the 405 laser, and emission bands were collected at 460 nm. MitoTracker™ Green FM was excited with the 488 laser and data collected at the ∼515 nm range. For each genotype, 3–4 dishes were imaged, with 5–6 images collected per dish and approximately 15–20 cells per image. Images were analyzed on ImageJ (National Institute of Health, USA, http://imagej.nih.gov/ij). A Z-stack (maximum intensity projection) of each image was taken, and ROIs were drawn to mark the cell boundary per cell from the background signal of the MTG channel. Images were then cropped using the ROIs to obtain images of each cell. These single-cell images were then analyzed using the Mitochondria Analyser Plugin, and thresholding and contrast optimization were adjusted automatically. Parameters of mitochondrial morphology and network characteristics were then obtained from the plugin analysis.
Mitochondrial membrane potential (MMP)
Imaging measurement
Mitochondrial membrane potential was measured using tetramethylrhodamine methyl ester (TMRM) (Invitrogen™, #T668). Briefly, the cells (iPSCs, NSCs) were seeded at 1 × 10⁵ cells/dish in confocal dishes (Biofil, #BDD011035) and kept overnight. The following day, they were incubated with 20 nM TMRM for 30 min at 37 °C. Then, 1 μg/mL Hoechst (Invitrogen™, #33342) was added to the cells for the last 10 min of incubation. The cells were then washed once with PBS and immediately analyzed on the Olympus FV3000 confocal microscope with a 60X oil immersion objective. Hoechst was excited using the 405 laser, and emission bands collected at 460 nm. TMRM was excited with the 561 laser, and data were collected at ∼575 nm. For each genotype, 3–4 dishes were imaged, with 5–6 images collected per dish and approximately 15–20 cells per image. Images were analyzed on ImageJ (National Institute of Health, USA, http://imagej.nih.gov/ij). A z-stack of the images was taken for analysis. ROIs of equal area were drawn over pools of the mitochondria in the TMRM channel. Mean Fluorescence Intensity Units (MFU) per ROI was then used for measurements. For measurement of MMP in neurons, NSCs were differentiated to neurons at DIV30, DIV40 in confocal dishes and subsequently stained with 20 nM TMRM for 30 min at 37 °C and 1 μg/mL Hoechst for the last 10 min, following which they were immediately taken for analysis on confocal microscopy. MFU per ROI drawn across pools of the mitochondria were analyzed on ImageJ, similar to the analysis of NSC, iPSC.
Flow cytometry measurement
For the flow cytometry-based analysis, the cells were initially dissociated using EDTA (Sigma, #E8008) for iPSCs and Stempro Accutase (Gibco, #A11105-01) for NSCs, following which they were pelleted down and resuspended in TMRM at 20 nM concentration in either Stemflex or NEM media, respectively, for 30 min at 37 °C. FCCP (10 μM) was added as a control to the respective cells for the last 5 min. Cells were then washed with PBS once and resuspended in PBS at two million cells/mL and transferred to FACS tubes for analysis on the BD Fortessa instrument. Forward and side scatter parameters were adjusted to remove cell debris and clumps. TMRM was excited using the 561 laser and fluorescence intensity collected at the ∼575 nm range. Gating was used to mark the fluorescence intensity range of the control cells. Comparatively, the percentage of cells falling within the set gate was measured for the OCRLKO cells. Two biological replicates were kept for each genotype under each condition. Approximately 10,000 cells were measured from each replicate.
Seahorse assay measurement of cellular respiration
Mitochondrial stress assays, oxygen consumption rate (OCRs), and glycolytic stress assay (extracellular acidification rate, ECAR) were measured using the Seahorse XFe24 Extracellular Flux analyzer (Agilent). The drug cartridges were kept for overnight incubation in XF Calibrant solution in a non-CO2 incubator at 37 °C. The cartridges were taken out 1 h before the assay, and the injection ports were loaded with the adequate drugs at their appropriate concentrations. Control and OCRLKO NSCs were seeded at 1 × 10⁵ cells/well in NEM at five wells/genotype and grown overnight at 37 °C with 5% CO2. One hour before measurement, the culture medium was removed and replaced by Agilent Seahorse XF Base Medium complemented with 10 mM glucose, 1 mM sodium pyruvate, and 200 mM L-glutamine, and incubated at 37 °C, without CO2. Basal oxygen consumption was measured three times, followed by three measurement cycles after each addition of 1.5 μM oligomycin A, 0.5 μM carbonyl cyanide 4-(trifluoromethoxy) phenylhydrazone (FCCP), and 1 μM rotenone and antimycin A. After overnight incubation of cells seeded for ECAR measurements, at five wells/genotype, the culture medium was removed and replaced with Agilent Seahorse XF Base medium complemented with 200 mM L-glutamine, and incubated at 37 °C for 1 hour before measurement. Basal ECAR was measured three times, followed by three measurement cycles after each addition of 10 mM glucose, 3 μM oligomycin, and 50 mM 2-DG. One measurement cycle consisted of 3 min of incubation and 3 min of measurement. After completion of OCR and ECAR measurements, the culture medium was removed, and RIPA buffer with a protease inhibitor was used to make protein lysates from each well for protein estimation. Total protein from each well was quantified using the Pierce™ BCA protein assay kit (Thermo Scientific™, #23227). The OCR and ECAR readings were normalized to the total protein content of each well in the Wave controller software and data exported to Excel.
NGS sequencing
Total RNA was extracted from well-characterized iPSCs, NSCs, and 30-day-old neurons of control and OCRLKO lines using TRIzol (Ambion, Life Technologies, #5596018) according to the manufacturer’s protocol in three biological replicates. RNA was isolated using the chloroform extraction method. The RNA was quantified using a Qubit4 dsDNA HS Assay Kit (Thermo Fisher Scientific, #Q32854) and run on a Bio-analyzer chip (Agilent High Sensitivity DNA Chip, #5067-4626) to assess integrity. rRNA depletion was done using the NEBNext® rRNA Depletion Kit v2 (Human/Mouse/Rat) with RNA Sample Purification Beads (Catalog no-E7405L). NEBNext® Ultra™ II Directional RNA Library Prep with Sample Purification Beads (Catalog no-E7765L) (RIN values > 9) was used per sample for the library preparation. The libraries were then sequenced on the Illumina Novaseq 6000 sequencing platform using a 2 × 100 bp sequencing format.
Bioinformatics analysis
Illumina-sequenced paired-end reads were obtained from sequencing as mentioned above. The quality of processed reads (adapter removal and trimming) was evaluated using FastQC. The RNA-seq reads were then mapped onto the human reference genome (hg38) using HISAT2 (version: 2.2.1), and the resulting BAM files containing the aligned reads were provided to HTSeq (version: 2.0.9) to obtain a gene-level read count table using the reference annotation file (GTF format). Read counts data were then transformed using the regularized log(rlog) transformation method that is implemented in DESeq2. Differential gene expression comparisons were made with NCRM5 as the control, with a log2FC threshold as indicated for NSCs/neurons. Functional analysis of the differentially expressed genes (DEGs) was made from the “Biological process” terms from the GO database. For over-representation analysis (ORA), GO term enrichment was made using the topGO R package (version 2.52.0) (Alexa and Rahnenfuhrer, 2023). For gene set enrichment analysis, GO term enrichment was made from the “Biological process” terms from the GO database using the clusterProfiler R package (version 4.8.3) (Wu et al., 2021). PCA distance map and dotplots were generated using the ggplot2 R package (version 3.5.1), and heatmaps of differential gene expression were made using the ComplexHeatmap R package (version 2.16.0).
Statistics
Appropriate t-tests were used to compare datasets of two groups. All statistical analyses were done on GraphPad Prism (version 9). Throughout the text, N = number of biological replicates; n = number of cells analyzed.
Results
Loss of OCRL results in mitochondrial fragmentation
To test the potential function of OCRL in mitochondrial structure and function, we utilized iPSCs engineered to create OCRL loss-of-function (OCRLKO) (Sharma et al., 2024). OCRLKO was generated from the control iPSC NCRM5 (https://commonfund.nih.gov/stemcells/stem-cell-lines-scl), which was used as the isogenic control (hereafter referred to as “control”). OCRLKO and control iPSCs were differentiated into neural stem cells, which were then purified and characterized by immunocytochemistry (Supplementary Figure S1A). We visualized the morphology of the mitochondria in control and OCRLKO NSCs through live cell staining with MitoTracker™ Green FM (MTG), which selectively accumulates in the mitochondrial matrix and covalently binds to mitochondrial proteins (Figures 1A,B). Using an automated image analysis pipeline with the mitochondria analyzer plugin on Fiji (Chaudhry et al., 2020), we screened several parameters of mitochondrial morphology on a per-cell basis. The mitochondria in the OCRLKO NSC displayed a slight reduction in the area and perimeter (Figures 1C,D), which are size-related parameters, indicating smaller mitochondria. Shape parameters, including Aspect Ratio (AR) and Form Factor (FF), were also moderately diminished in the OCRLKO cells compared to the control (Figures 1E,F), indicating increased sphericity. The branching of mitochondrial tubules to form a network facilitates faster dynamics and improved functionality (Viana et al., 2020; Chuphal et al., 2024; Holt et al., 2024). OCRLKO cells exhibited a slightly reduced branch length per mitochondrion compared to the control (Figure 1G), suggesting a reduced mitochondrial network. Overall, our morphological characterization of the mitochondria indicates that loss of OCRL leads to moderately smaller, spherical mitochondria with comparatively reduced branching.
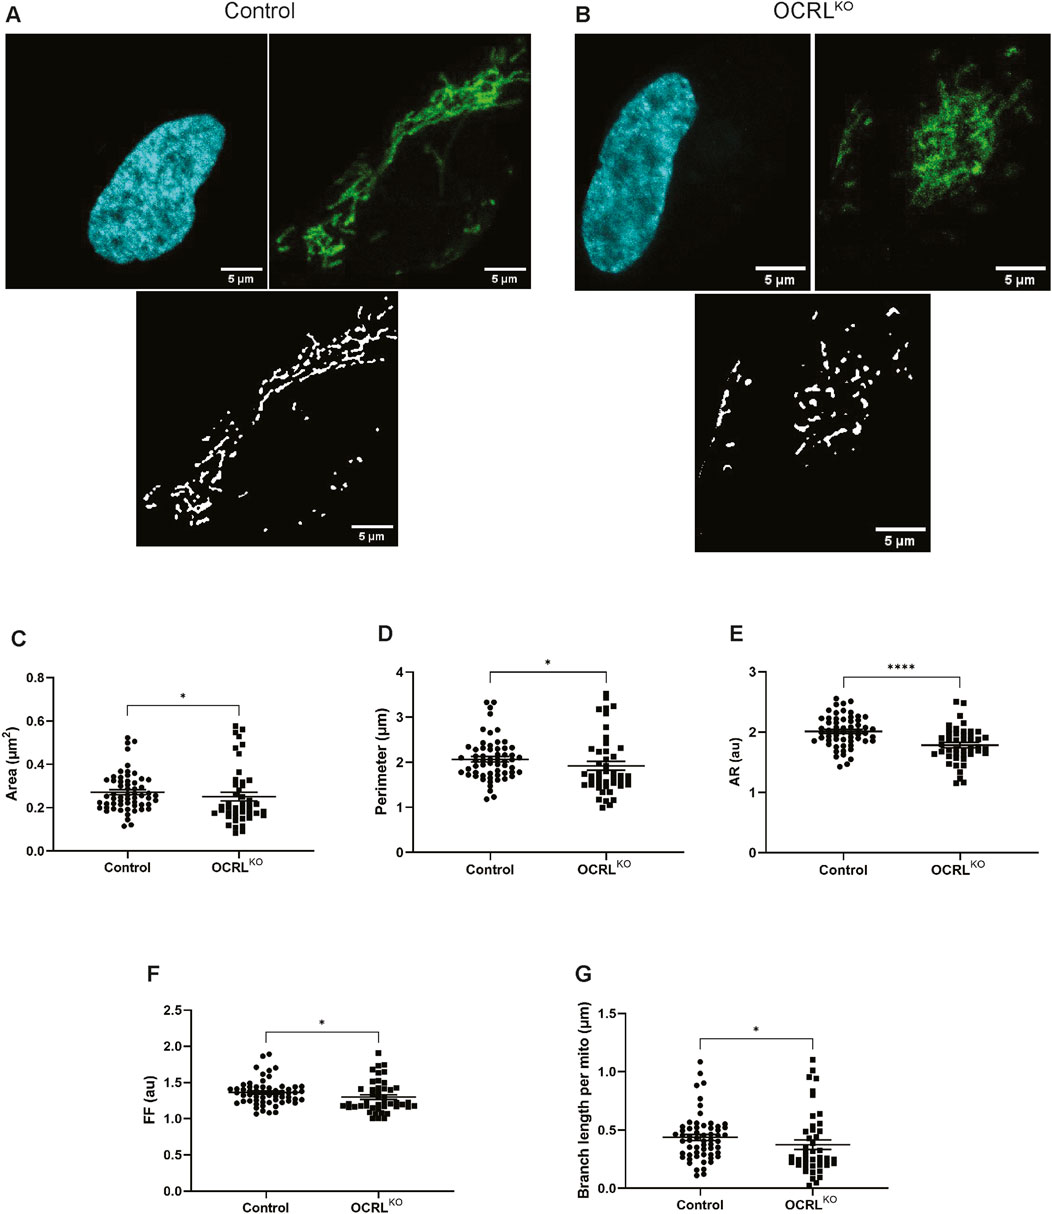
Figure 1. Loss of OCRL results in smaller, spherical mitochondria in NSCs: (A–G) Automated Image analysis via Mitochondria Analyser plugin (Fiji) characterizing the mitochondrial morphology of Control and OCRLKO NSCs. Each dot represents measurements of the corresponding mitochondrial parameter from a single cell. [A,B] Representative z-stack maximum intensity projections of the mitochondria in single cells stained with Hoechst (cyan), MitoTracker Green (MTG) dye (green), and their corresponding segmented images post-image processing (black, white) of control (A) and OCRLKO NSCs (B). The following parameters were measured: (C) mean area; (D) mean perimeter; (E) aspect ratio (AR); (F) form factor (FF); (G) branch length per mitochondrion. All panels’ data represented as mean+/-SEM. Statistical significance calculated using two-tailed Mann-Whitney U test, *P = 0.0175; (N = 3, n∼50).
Mitochondria in OCRLKO NSC show reduced mitochondrial membrane potential
The mitochondrial membrane potential (MMP) is a crucial aspect of mitochondrial respiration, generated by components of the electron transport chain (ETC.), and is essential for ATP synthesis. Movement of electrons across the ETC is responsible for pumping H+ ions across the inner mitochondrial membrane; this difference in concentration of ions generates an electrochemical gradient across the membrane, known as the MMP (Nolfi-Donegan et al., 2020). A highly polarized membrane supports active oxidative phosphorylation, while a depolarized membrane leads to decreased reliance on oxidative phosphorylation, causing cells to shift toward glycolysis (Meacham et al., 2022). We measured the MMP in the OCRLKO and control NSC using tetramethylrhodamine methyl ester (TMRM), a lipophilic cationic dye that accumulates in the mitochondrial matrix in proportion to the membrane potential. NSCs were stained with TMRM, Hoechst was used to mark the nucleus, and cells were imaged using confocal microscopy (Figure 2A). Regions of interest (ROIs) drawn across pools of mitochondria were employed to measure the fluorescence intensity. The data showed a range of TMRM intensities in both genotypes, with cells in the OCRLKO NSC culture exhibiting a modest but significant reduction in signals compared to the control (Figure 2B). To better understand the distribution of OCRLKO NSC with varying MMP, we employed flow cytometry to measure the TMRM intensity. This enabled us to plot the distribution of cells with varying TMRM intensities at the single-cell level. In control NSCs, we observed a single peak of TMRM signal intensity (Figure 2C), indicating that all cells in the culture had approximately the same MMP, reflecting healthy polarized mitochondria. In contrast, OCRLKO NSC displayed at least two sub-populations of cells with different TMRM signal intensities (Figure 2D). Approximately 50% of the cells showed a peak that overlapped with that of control NSC, while approximately 40%–50% of the cells exhibited a peak of lower TMRM intensity. Both control and OCRLKO NSC showed a reduction in the MMP following treatment with FCCP (10 µM) (Figures 2E,F), which served as a positive control to confirm that TMRM effectively labels polarized mitochondria. Taken together, measurement of MMP using both confocal microscopy as well as flow cytometry reveals a mixture of polarized and heterogeneous depolarized mitochondria in OCRLKO NSC.
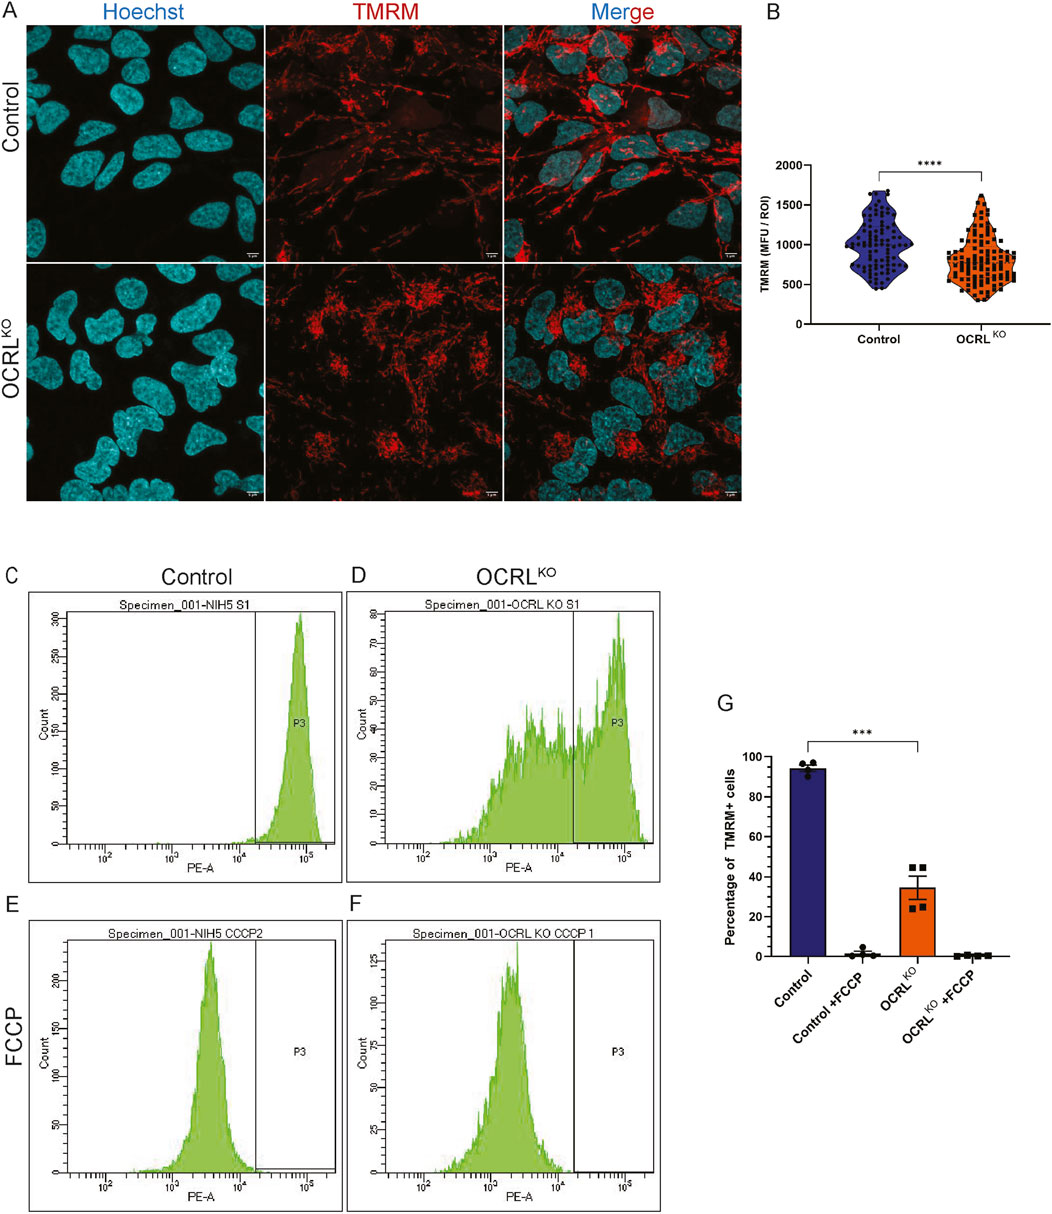
Figure 2. Mitochondria in OCRLKO NSCs show reduced mitochondrial membrane potential: (A,B) Confocal microscopy imaging of TMRM. Control and OCRLKO NSC cultures stained with TMRM dye (20 nM) (red) to mark polarized mitochondria and Hoechst (1 μg/mL) (cyan) to mark the nucleus. (B) Violin plot depicts Mean Fluorescence Units (MFU) of the TMRM signal for each genotype. Each data point corresponds to the MFU of 1 ROI drawn over a pool of mitochondria. Data represented as mean+/-SEM, ****P < 0.0001; two-tailed Mann-Whitney U test; (N = 3, n∼100) (C,G) Flow cytometry-based measurement of TMRM. (C,D) Histogram of TMRM signal intensity per cell of control (C) and OCRLKO (D) NSCs. Gating was used over the histogram (P3) of control NSCs to mark the TMRM signal intensity of control. (E,F) Histogram of TMRM signal intensity per cell of FCCP (10 μM)-treated control (E) and OCRLKO (F) NSCs. (G) Bar graph depicting the percentage of cells in the P3 gate. Each data point represents one biological replicate. Statistical significance calculated using two-tailed paired t-test, ***P < 0.0009; (N = 2, n = 10,000 cells/tube).
Depolarized mitochondria in OCRLKO NSC affect mitochondrial function
More than 95% of cellular energy requirements are supplied by mitochondrial oxidative phosphorylation, the principal process for ATP production. The H+ ions concentrated in the mitochondrial intermembrane space are pumped back into the matrix via the P0/P1 ATP synthase complex, which phosphorylates ADP to generate ATP for the cell. Oxygen consumption represents the terminal step of the oxidative phosphorylation (OXPHOS) process that produces cellular energy (Nolfi-Donegan et al., 2020). Various parameters of this cellular respiration were measured using the Seahorse Assay to assess mitochondrial ATP production (Figure 3A). We found that OCRLKO NSC exhibited slightly decreased basal respiration compared to control (Figure 3B). To assess ATP production, we injected oligomycin and measured the oxygen consumption rate (OCR) and found it to be slightly reduced in OCRLKO NSC (Figure 3C). The FCCP-mediated uncoupling of the proton gradient revealed that maximal respiration was also slightly lower in the OCRLKO NSC (Figure 3D). Taken together, these results could indicate a defect in the OXPHOS pathway at basal levels or a shift in metabolism toward glycolysis. To distinguish between these two, we measured the extracellular acidification rate (ECAR) in these cells (Figure 3E). The OCRLKO NSC demonstrated a significant reduction in glycolysis at basal levels (Figure 3F). Treatment with oligomycin at a higher concentration resulted in a decreased glycolytic capacity in OCRLKO (Figure 3G). Furthermore, treatment with 2DG, a non-metabolizable glucose analog, revealed reduced glycolytic reserves in OCRLKO compared to control (Figure 3H). Defects in the OXPHOS pathway have a high potential to result in elevated mitochondrial ROS levels in the cell, which can be detrimental (Okoye et al., 2023). We therefore checked the levels of ROS in OCRLKO NSC using the CM-H2XROS dye. Our results indicate no significant difference in the mitochondrial ROS levels measured between control and OCRLKO (Figure 3I). Overall, the results indicate modest mitochondrial function defects in OCRLKO NSC.
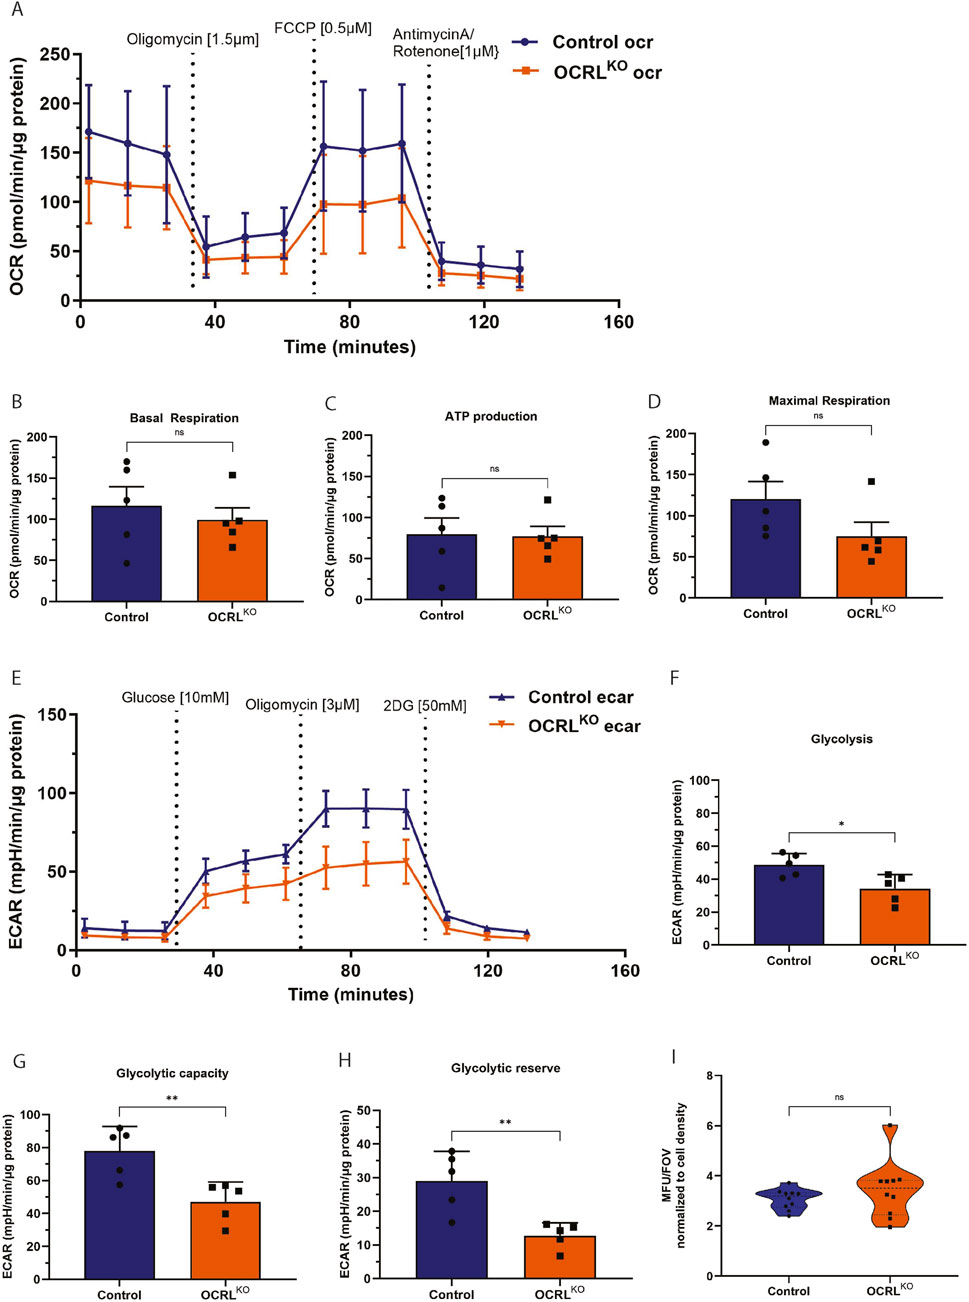
Figure 3. OCRLKO NSCs show altered parameters of cellular respiration: (A–H) Seahorse assay on control and OCRLKO NSCs, indicating various parameters of cellular respiration (N = 5 biological replicates). (A–D) Oxygen Consumption Rate (OCR) measured over various treatments, as indicated in the graph (A). Basal respiration (B), ATP production (C), and maximal respiration (D) are represented as bar graphs, with grouped data points from the OCR measurements. (E) Extracellular Acidification Rate (ECAR) measurements over various treatments as indicated in the graph. Glycolysis (F), glycolytic capacity (G), and glycolytic reserve (H) are represented as bar graphs with grouped data points from ECAR measurements. (I) MitoTracker Red CM-H2Xros measurements of mitochondrial ROS species in Control and OCRLKO NSCs (N = 2, n = 5). All panels’ data are represented as mean+/-SEM. Statistical significance calculated using two-tailed Mann–Whitney U test, *P < 0.05, ns > 0.05.
Changes of mitochondrial function in OCRLKO NSC are independent of PI(4,5)P2
We have previously shown that loss of OCRL results in elevated levels of PI(4,5)P2 (Akhtar et al., 2022). To test whether the changes in NSC mitochondrial function were a direct consequence of this elevation, we rescued the elevated PI(4,5)P2 levels in OCRLKO NSC by pharmacologically inhibiting PIP5K, the enzyme responsible for synthesizing the major pool of PI(4,5)P2 in cells. If the elevation of PI(4,5)P2 leads to mitochondrial defects, reversing PI(4,5)P2 levels to those of controls should reverse the reduction in MMP. We used the drug UNC3230, a PIP5K inhibitor, to treat both control and OCRLKO NSC cultures for 7 days. Preliminary experiments using an NSC line carrying a fluorescent reporter for plasma membrane PI(4,5)P2 levels were used to determine the concentration of UNC3230 that reduced the levels of PI(4,5)P2 (Supplementary Figure S2). Following UNC3230 treatment, we employed flow cytometry to estimate MMP using TMRM signal measurements (Figure 4). The control NSC showed no change in TMRM intensity following UNC3230 treatment compared to untreated cultures (Figure 4A,B, quantified in E). As in previous experiments, OCRLKO NSC displayed two distinct populations of cells, with 50% of the cells exhibiting reduced TMRM (Figure 4C); this was not altered by prior treatment with UNC2320 (Figure 4D). FCCP treatment served as a positive control for mitochondrial TMRM staining. FCCP treatment across all conditions led to depolarization of the mitochondria with no discernible difference between control and OCRLKO (Figure 4E). These results suggest that PI(4,5)P2 levels do not affect MMP in either wild type or OCRLKO.
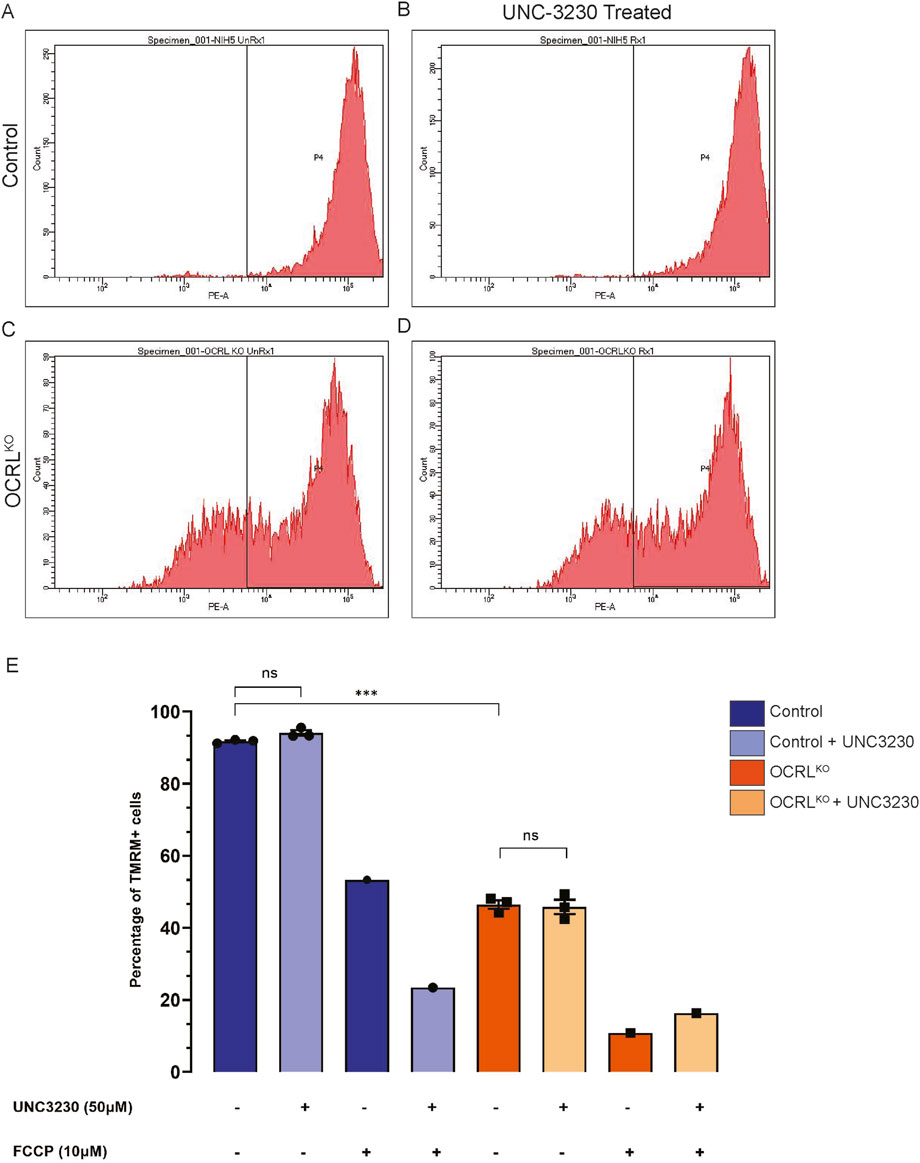
Figure 4. Mitochondrial changes in OCRLKO NSC culture is independent of elevated PI(4,5)P2: (A–E) PIP5K inhibitor (UNC3230) treatment to reduce elevated PI(4,5)P2 levels. Control and OCRLKO NSC cultures were treated with UNC3230 (50 μM) and vehicle control (DMSO, 0.05%) for 7 days and incubated with TMRM (20 nM) × 30 min at 37 °C, following which they were taken for flow cytometry analysis. (A–D) Histograms depicting TMRM signal intensity. Gating was used over the histogram (P4) of the control, untreated NSCs, to mark the TMRM signal of the control. (E) Bar graph indicating the percentage of cells in the P4 gate under different treatment conditions indicated in the x-axis. Legend identifies the genotype. Vehicle control (DMSO 0.05%) was added wherever marked as UNC3230 “-.” Each data point represents one biological replicate. Statistical significance calculated using unpaired t-test with Welch’s correction, N = 1, n = 3, *P = 0.0003.
Mitochondrial functional changes are seen in OCRLKO neurons
While NSCs are known to use both glycolysis and mitochondrial respiration, it is reported that on differentiation to neurons, they shift toward OXPHOS primarily for ATP production (Rangaraju et al., 2019; Scandella et al., 2023). To assess whether the mitochondrial changes we observed in OCRLKO NSC persist in neurons, we differentiated NSC and stained the neurons (characterized in Supplementary Figure S3A) at 30 DIV and 40DIV with TMRM (Figure 5A). In NSCs, a reduced TMRM signal was the most prominent finding (Figure 2G). However, 30DIV control and OCRLKO neurons displayed a wide range of TMRM intensities, which became more robust/uniform by 40DIV (Figure 5A). Recapitulating observations in NSC, there was an almost five-fold range of TMRM intensities seen in both control and OCRLKO neurons at DIV30 (Figure 5B); this variability reduced by DIV40 (Figure 5C). OCRLKO neurons showed a modest and nonsignificant reduction in TMRM intensity at DIV30 (Figure 5B). Analysis of a binned frequency distribution of TMRM intensities revealed a slight left shift of TMRM intensity in OCRLKO mitochondria, compared to control (Figure 5D). As differentiation proceeds, by DIV40, the TMRM intensity in OCRLKO neurons increased compared to that at DIV30. However, there was now a substantial reduction in OCRLKO, compared to control (Figure 5C); analysis of binned intensities revealed a left shift in OCRLKO compared to control (Figure 5E).
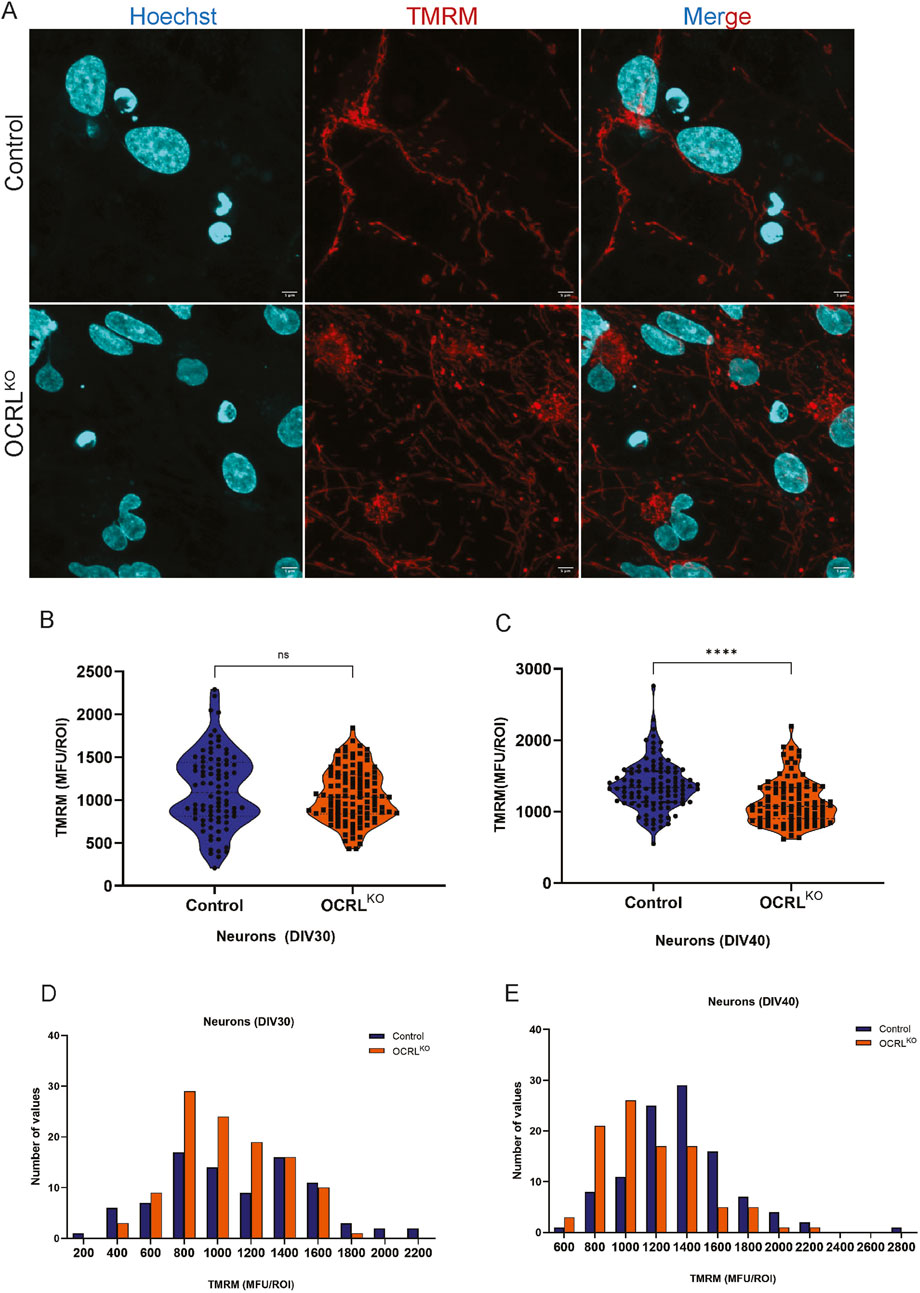
Figure 5. Mitochondrial changes in NSCs persist over neuronal differentiation: (A,B) Control (Top row) and OCRLKO (bottom row) neurons (DIV30) stained with TMRM (red), Hoechst (cyan) on live imaging on a FV3000 confocal microscope. (B,C) Violin plot depicting TMRM signal intensity calculated as the MFU of ROIs drawn over pools of the mitochondria per genotype in control and OCRLKO neuronal culture of DIV30 and DIV40, respectively. Each data point represents 1 ROI. Statistical significance calculated using the Mann–Whitney test, *P < 0.005; ****P < 0.0001, N = 3, n∼100. (D,E) Bar graph indicating the frequency distribution of the different TMRM intensities, calculated as the MFU of ROIs plotted in bins on the x-axis, and number of values for each bin plotted on the y-axis. Legend indicates the color of the genotype.
Mitochondrial MMP is not altered in OCRLKO iPSC
Reduced MMP can be noted because of a plethora of conditions, one of which may be due to the fragmentation of the mitochondria, resulting in a limited capacity for oxidative phosphorylation (OXPHOS). Another may be due to less dependence on oxidative phosphorylation and the use of glycolysis as the main source for ATP generation. Stem cells are known to rely on glycolysis as their major source of energy and later switch to OXPHOS on cell fate specification and differentiation (Scandella et al., 2023). We measured the MMP in iPSC comparing control with OCRLKO using the TMRM staining and confocal microscopy (Figure 6A). ROIs were drawn across pools of mitochondria in both genotypes to estimate MMP. Surprisingly, there was no significant difference in the TMRM intensity between iPSCs of control and OCRLKO (Figure 6B). To further analyze the distribution of MMP among iPSC cells in the culture, we analyzed their MMP by flow cytometry using TMRM staining. The histograms recapitulated the results obtained with confocal imaging. Single peaks of TMRM intensity were seen in both control and OCRLKO iPSC (Figures 6C,D), and no significant difference was found in the MMP between control and OCRLKO (Figure 6G). After recording the baseline signal, FCCP (10 μM) was added to the cells to depolarize the mitochondria as a positive control (Figures 6E,F). Cells were analyzed by flow cytometry, and we found that both control and OCRLKO showed loss of MMP on FCCP treatment (Figures 6E,F quantified in 6G); it seemed that OCRLKO was less sensitive to FCCP treatment compared to control (Figure 6I). Overall, we found no significant differences in mitochondrial function between iPSC of control and OCRLKO.
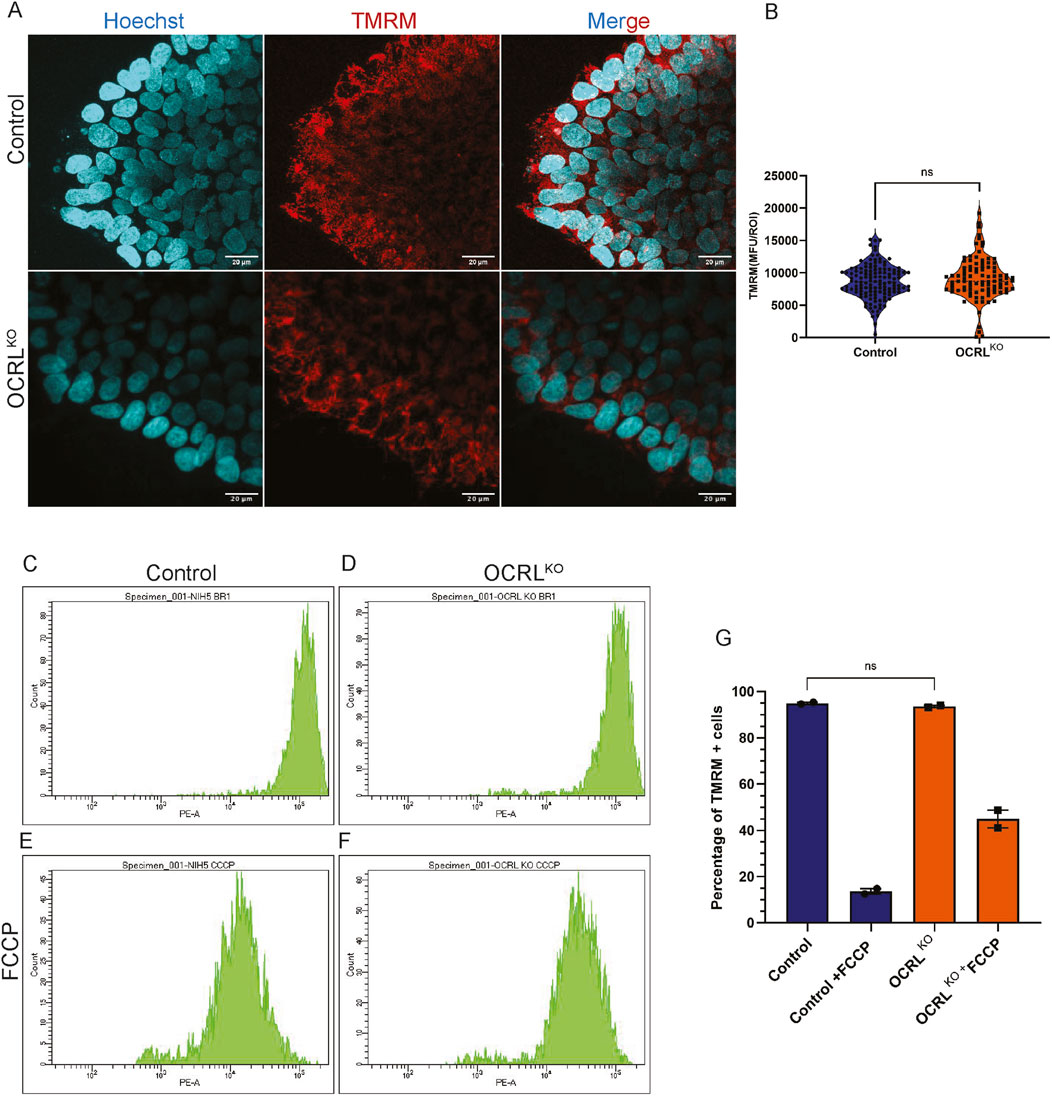
Figure 6. Reduction in MMP in OCRL KO is specific to tissues primarily relying on oxidative phosphorylation: (A,B) Confocal microscopy imaging of TMRM. Control and OCRLKO iPSC cultures stained with the TMRM dye (20 nM) (red) to mark polarized mitochondria and Hoechst (1 μg/mL) (cyan) to mark the nucleus. (B) Violin plot depicts Mean Fluorescence Units (MFU) of the TMRM signal for each genotype. Each data point corresponds to the MFU of 1 ROI drawn over a pool of mitochondria. Data represented as mean+/-SEM, *P < 0.05, ns = 0.2993; statistical significance calculated using two-tailed Mann–Whitney U test, (N = 2, n∼100) (C–G) Flow cytometry measurement of TMRM intensity of iPSCs. (C,D) depicts histograms of TMRM signal intensity per cell of control and OCRLKO iPSCs. (E,F) Control and OCRLKO iPSCs treated with FCCP (10 μM). (G) Bar graph depicting % of TMRM + cells in the same gate as control across all conditions. Each data point represents one biological replicate. Statistical significance calculated using two-tailed paired t-test, *P = 0.3333, (n = 2 biological replicates).
Impact of OCRL depletion on the mitochondrial transcriptome
To characterize changes in mitochondrial gene expression associated with the loss of OCRL, which may explain the mitochondrial functional and morphological changes seen in NSCs, we performed a transcriptomic analysis of OCRLKO NSC compared to controls. We found ca. 13,941 differentially expressed genes (DEGs) in the OCRLKO NSCs (Figure 7A). Gene Ontology (GO) analysis performed on a significance filtered DEG set (Figure 7B) did not reveal any terms associated with mitochondrial structure or function. Likewise, a transcriptomic analysis on DIV30 neurons differentiated from control and OCRLKO NSC showed ca. 143 downregulated and 458 upregulated genes (Figure 7C); GO analysis of this DEG set also did not reveal any terms associated with mitochondrial structure and function (Figure 7D). Lastly, the average expressions of all mitochondrial DNA coding genes in control and OCRLKO NSCs and neurons (DIV30) were not different (Figures 7G,H). The transcriptomic profile of both NSC and neurons were confirmed for both control and OCRLKO cultures (Supplementary Figure S1B, Supplementary Figure S3B).
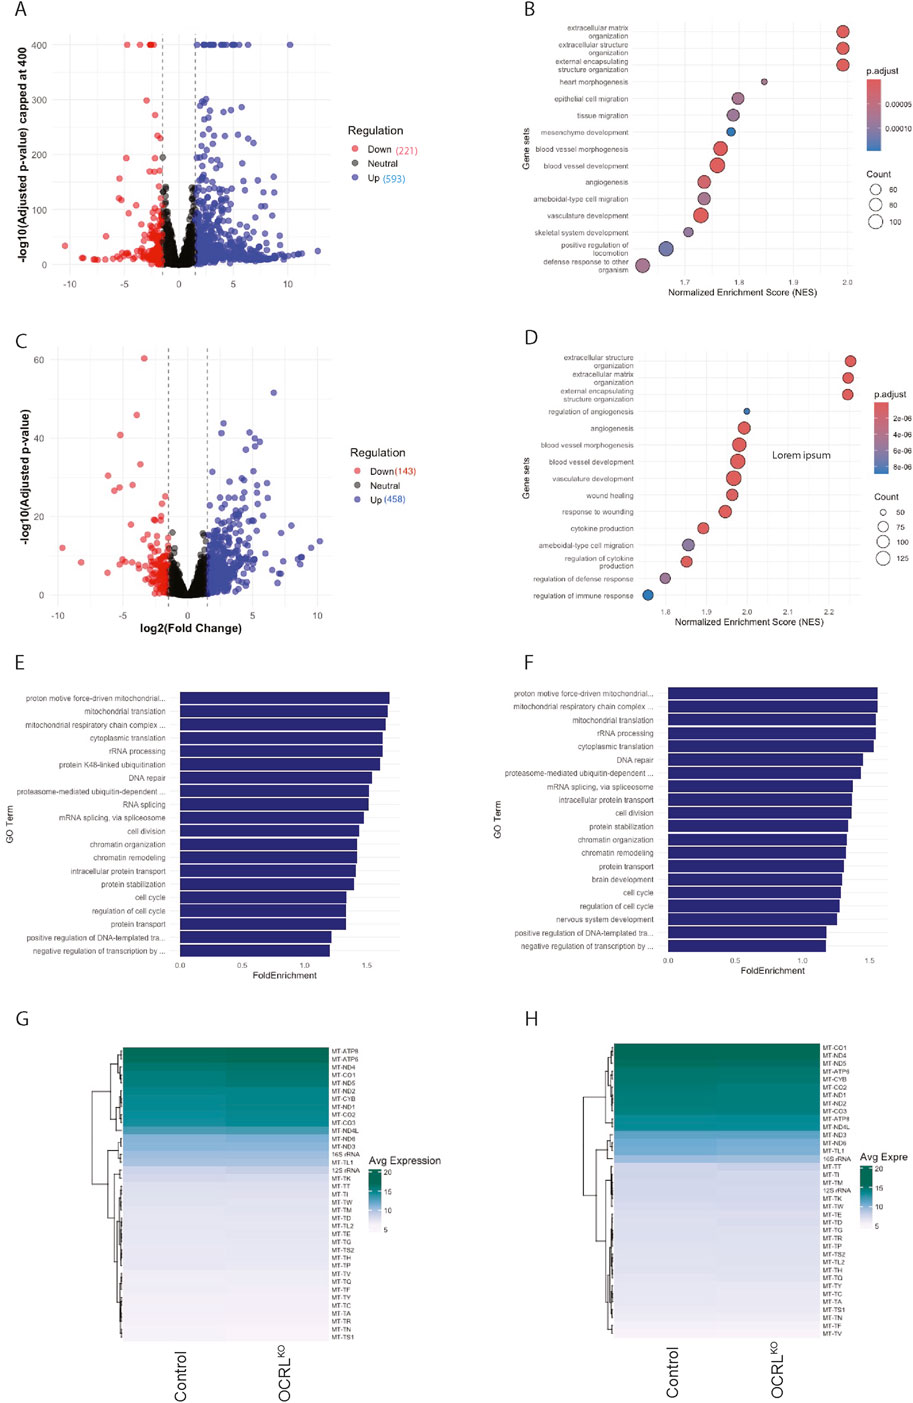
Figure 7. Transcriptomic analysis of OCRLKO NSCs shows moderate dysregulation in mitochondrial gene expression: (A) Scatter plot of DEGs in OCRLKO NSCs versus Control. 593 genes were found to be upregulated (blue dots), and 221 genes were found to be downregulated (red dots) (log2 fold change cut-off −1.5 to +1.5, p, p adj. value < 0.05). y-axis (-log10 adjusted p-value) capped at 400, values above cap were capped for visualization clarity. (B) Dot plot depicting enriched biological process GO terms on the y-axis and Normalized Enrichment Score (NES) on the x-axis calculated from gene set enrichment analysis (GSEA) for NSC, size of the dots indicates count of number of DEGs within each GO term, and shading represents adjusted p value < 0.05. (C) Scatter plot of DEGs in OCRLKO neurons (DIV30) versus Control. A total of 458 genes were found to be upregulated (blue dots), and 143 genes were found to be downregulated (red dots) (log2 fold change cut-off −1.5 to +1.5, p, p adj. value < 0.05). (D) Dot plot depicting enriched biological process GO terms on the y-axis and Normalized Enrichment Score (NES) on x-axis, calculated from GSEA for neurons; size of the dots indicates the count of number of DEGs within each GO term; shading represents the adjusted p value < 0.05. (E,F) Bar graphs of Biological Process-enriched GO terms in Control and OCRLKO NSCs and neurons (DIV30) respectively, calculated from topGO. X-axis represents the fold enrichment score, and y-axis indicates the GO term; top 20 GO terms are represented with adjusted p value <0.05. (G,H) Heatmaps of variance-stabilized average expression of all mitochondrial DNA-coding genes in control and OCRLKO NSCs and neurons (DIV30), respectively.
We also performed a GO enrichment analysis using an over-representation analysis (ORA) pipeline (topGO) with the entire list of DEGs from the NSC transcriptome, i. e., regardless of statistical significance, and the top three enriched GO terms were related to the mitochondria with a fold enrichment score of ∼1.5 (Figure 7E). We noted an enrichment of multiple mitochondria-related GO terms; this was also true of the transcriptome from DIV30 neurons (Figure 7F). This finding indicates that there is a subtle transcriptional dysregulation of mitochondrial genes as a coherent group in the OCRLKO NSC that may not be individually statistically significant in ranked or Log2 fold change cut-off filtered approaches. We generated heatmaps of the individual genes that were dysregulated in the GO terms that were picked up (Supplementary Figure S4), which reflected modest changes in average gene expression seen in the ORA. Lastly, we also compared changes in the expression of genes that are encoded in the nuclear genome but localize to and impact mitochondrial function; there was no substantive change in these either (Supplementary Table S1).
Discussion
Although previous studies have reported mitochondrial defects in cells of biopsy samples from muscle and renal tissue of LS patients, it has not been clear what the source of these defects might be. Notably, mitochondrial defects have been reported in biopsies from the muscle (Gobernado et al., 1984; Dumic et al., 2020), a tissue not typically affected in LS patients. For example, metabolic defects in the circulation secondary to impaired renal function could, in turn, lead to mitochondrial defects in tissues such as the muscle. In this study, we noted mitochondrial defects in cultured neural stem cells and neurons differentiated from an OCRL deleted iPSC line, generated from the isogenic control line NCRM5. Similar observations have been reported for LS stem cell lines generated in an independent recent study (Lo et al., 2024). Our observations strongly suggest that mitochondrial defects noted in cells differentiated from LS patient-derived stem cells arise in cultures containing only neural tissue. Given that the influence of a defective kidney and altered circulating metabolites that could affect mitochondrial function is absent in our model, it seems most likely that the mitochondrial defects seen in OCRLKO NSC and neurons arise from an intrinsic requirement for the function of this gene in these cultured cells.
In this study, we found modest but clear defects in mitochondrial structure and function in NSCs derived from OCRLKO iPSC. These defects persisted when OCRLKO NSCs were differentiated into neurons in vitro. In sharp contrast, there were no discernible defects in mitochondrial function in OCRLKO iPSC. These heterogeneities most likely reflect the different levels of the dependency of iPSCs, NSCs, and neurons on the mitochondria as a principal source of energy for their function. Previous studies have reported that stem cells are largely glycolytic in their energy strategy, while NSCs rely more on oxidative phosphorylation, and the dependence of neurons is substantially more on the mitochondria as an energy source (Iwata et al., 2020; Meacham et al., 2022).
Our study of OCRLKO NSC revealed slightly smaller and spherical mitochondria than in controls with reduced branch length, evidence of a moderate level of fragmentation. This presumably results from an imbalance of mitochondrial fission/fusion homeostasis. We also noted that in OCRLKO NSC, MMP was reduced and heterogeneous. Many stem cells are known to be primarily glycolytic, with fragmented mitochondria; fate commitment results in fusion and elongation and a switch to oxidative phosphorylation. It is unclear whether the primary defect in OCRLKO NSC is an imbalance in mitochondrial fusion/fission or if the OCRL function primarily regulates the switch between glycolysis and oxidative phosphorylation. An analysis of the mitochondrial transcriptome revealed only minimal changes, suggesting that alterations in the mitochondrial function may be a consequence of post-transcriptional mechanisms. Surprisingly, we noted in both microscopy and flow cytometry-based assays that there was considerable heterogeneity in MMP in OCRLKO NSC. One possible reason for this heterogeneity may be that in OCRLKO NSCs, there is in fact, a mixture of both neurogenic and gliogenic precursors, in contrast to control NSC cultures, where there are largely only neural precursors (Sharma et al., 2024). The difference in energy metabolism between neural and glial precursor cells is well documented. While neural precursors are plastic and mainly use oxidative phosphorylation, glial precursors mainly depend on glycolysis (Mlody et al., 2016). This heterogeneity in cellular composition most likely also explains our observation that in assays that involve integrated readouts of a large group of cells (e.g., Seahorse-based measurements), there was only a minimal difference between control and OCRLKO NSC.
What is the mechanism by which OCRL regulates mitochondrial structure and function? An immediate possibility is that the elevated levels of PI(4,5)P2 in OCRL-depleted cells also impact mitochondrial function. Since we noted that pharmacological inhibition of PIP5K, thereby reducing PI(4,5)P2 synthesis, did not rescue MMP in OCRLKO cells, it seems unlikely that the catalytic activity of OCRL or the elevated levels of PI(4,5)P2 contribute to the mitochondrial defects described in this study. Presumably, protein–protein interactions of OCRL underlie the mitochondrial phenotype. Interestingly, long-standing biochemical experiments have reported the synthesis of phosphorylated derivatives of phosphatidylinositol in mitochondrial fractions (Hajra et al., 1965; 1968), and an immunolabeling study has suggested a small pool of PI(4,5)P2 at the mitochondria (Watt et al., 2002). Given these observations, it remains a possibility that the inhibition of PIP5K was insufficient to reduce PI(4,5)P2 levels adequately to rescue the MMP defect in OCRLKO NSC. The reconstitution of OCRLKO with a wild type or catalytically dead OCRL protein will be helpful in resolving this issue more definitively. The OCRL protein itself has not been localized to the mitochondria, and thus its effect on mitochondrial function is most likely indirect (Li et al., 2018; Sheikh-Hamad et al., 2021). One possibility is the role of membrane contact sites involving the mitochondria and other organelles, particularly the endoplasmic reticulum, the main site of phosphatidylinositol biosynthesis. This raises the possibility that OCRL functions at another organelle membrane and may indirectly influence the mitochondria via membrane contact sites, a mechanism that needs further investigation. In summary, our study demonstrates a modest dependence of mitochondrial function on the OCRL protein in tissues where the mitochondria are a principal source of energy production.
Data availability statement
The data presented in the study are deposited in the ArrayExpress repository, accession number E-MTAB-16227.
Ethics statement
The generation and use of human iPS cell lines was approved by National Centre for Biological Sciences Institutional Human Ethics Committee (NCBS/ICE-8/002/31E).
Author contributions
RP: Formal Analysis, Investigation, Methodology, Writing – original draft, Writing – review and editing. PB: Investigation, Resources, Writing – review and editing. YS: Investigation, Methodology, Writing – review and editing. PR: Conceptualization, Funding acquisition, Project administration, Supervision, Writing – original draft, Writing – review and editing.
Funding
The authors declare that financial support was received for the research and/or publication of this article. This study was supported by the Department of Atomic Energy, Government of India (RTI-0046), Rohini Nilekani Philanthropies and a fellowship from the Council for Scientific and Industrial Research, Government of India to RGP (09/860 (0226)/2020-EMR-I).
Conflict of interest
The authors declare that the research was conducted in the absence of any commercial or financial relationships that could be construed as a potential conflict of interest.
Generative AI statement
The authors declare that no Generative AI was used in the creation of this manuscript.
Any alternative text (alt text) provided alongside figures in this article has been generated by Frontiers with the support of artificial intelligence and reasonable efforts have been made to ensure accuracy, including review by the authors wherever possible. If you identify any issues, please contact us.
Publisher’s note
All claims expressed in this article are solely those of the authors and do not necessarily represent those of their affiliated organizations, or those of the publisher, the editors and the reviewers. Any product that may be evaluated in this article, or claim that may be made by its manufacturer, is not guaranteed or endorsed by the publisher.
Supplementary material
The Supplementary Material for this article can be found online at: https://www.frontiersin.org/articles/10.3389/fcell.2025.1679675/full#supplementary-material
SUPPLEMENTARY FIGURE S1 | (A) Immunofluorescence images of Control and OCRLKO iPSC-derived NSCs, showing the expression of NSC markers including nestin (orange), SOX2 (green), and nuclei stained with DAPI (cyan). (B) Transcriptomic profile showing normalized average expressions of OCRL, NSC, and neuronal genes in control and OCRLKO iPSC-derived NSCs.
SUPPLEMENTARY FIGURE S2 | (A) Schematic of the experiment to test the ability of the PIP5K inhibitor UNC-3230 on the plasma membrane PI(4,5)P2. Representative images showing fields of view from control neural stem cells (NSCs) expressing a plasma membrane-targeted PI(4,5)P2 reporter (Akhtar et al., 2021). (B) Cells treated with DMSO (vehicle control, VC) display probe localization at the plasma membrane, reflecting baseline PI(4,5)P2 levels; (C,D) show the effects of treatment with 10 μM and 50 μM UNC-3230, respectively—a selective inhibitor of PIP5K1C—on reporter distribution. Scale bar = 50 μm. (E) Quantification of reporter fluorescence at the plasma membrane, reflecting PI(4,5)P2 abundance. The Y-axis represents normalized reporter intensity at the plasma membrane, and the X-axis indicates the different treatment conditions.
SUPPLEMENTARY FIGURE S3 | (A) Immunofluorescence images of Control and OCRLKO iPSC-derived neurons at DIV40, showing the expression of mature neuronal marker, MAP2 (green), and nuclei stained with DAPI (cyan). (B) Transcriptomic profile showing normalized average expression of OCRL, NSC, and neuronal genes in control and OCRLKO iPSC-derived neurons.
SUPPLEMENTARY FIGURE S4 | Transcriptomic analysis of OCRLKO NSCs shows moderate dysregulation in mitochondrial gene expression. Heatmap showing normalized average expression between OCRLKO NSCs and control of (A) GO term: Mitochondrial respiratory chain complex 1 assembly; (B) GO term: Mitochondrial translation; (C) GO term: Proton motive force driven mitochondrial ATP synthesis.
SUPPLEMENTARY TABLE S1 | Table depicting differential gene expression (log2 fold Change) in the OCRLKO NSCs compared to control of 1136 genes localized to the mitochondria from the Human MitoCarta3.0 database. (https://www.broadinstitute.org/files/shared/metabolism/mitocarta/human.mitocarta3.0.html).
References
Akhtar, B. M., Bhatia, P., Acharya, S., Sharma, S., Sharma, Y., Devi, A. B. N. S., et al. (2022). A human stem cell resource to decipher the biochemical and cellular basis of neurodevelopmental defects in Lowe syndrome. Biol. Open 11, bio059066. doi:10.1242/BIO.059066
Alexa, A., and Rahnenfuhrer, J. (2023). topGO: enrichment analysis for gene ontology. doi:10.18129/B9.bioc.topGO
Attree, O., Olivos, I., Okabe, I., Bailey, L., Nelson, D., Lewis, R., et al. (1992). The Lowe's oculocerebrorenal syndrome gene encodes a protein highly homologous to inositol polyphosphate-5-phosphatase. Nature 358, 239–242. doi:10.1038/358239a0
Baghbaderani, B. A., Tian, X., Neo, B. H., Burkall, A., Dimezzo, T., Sierra, G., et al. (2015). cGMP-Manufactured human induced pluripotent stem cells are available for pre-clinical and clinical applications. Stem Cell Rep. 5, 647–659. doi:10.1016/j.stemcr.2015.08.015
Chaudhry, A., Shi, R., and Luciani, D. S. (2020). A pipeline for multidimensional confocal analysis of mitochondrial morphology, function, and dynamics in pancreatic β-cells. Am. J. Physiol. - Endocrinol. Metab. 318, E87–E101. doi:10.1152/ajpendo.00457.2019
Cheng, C., Fass, D. M., Folz-Donahue, K., MacDonald, M. E., and Haggarty, S. J. (2017). Highly expandable human iPS cell-derived neural Progenitor Cells (NPC) and neurons for central nervous System disease modeling and high-throughput screening. Curr. Protoc. Hum. Genet. 92 (21.8), 21.8.1–21.8.21. doi:10.1002/cphg.33
Chuphal, P., Lanctôt, J. D., Cornelius, S. P., and Brown, A. I. (2024). Mitochondrial network branching enables rapid protein spread with slower mitochondrial dynamics. PRX Life 2, 043005. doi:10.1103/PRXLife.2.043005
Craigen, W. J., Graham, B. H., Wong, L.-J., Scaglia, F., Lewis, R. A., and Bonnen, P. E. (2013). Exome sequencing of a patient with suspected mitochondrial disease reveals a likely multigenic etiology. BMC Med. Genet. 14, 83. doi:10.1186/1471-2350-14-83
Dumic, K. K., Anticevic, D., Petrinovic-Doresic, J., Zigman, T., Zarković, K., Rokic, F., et al. (2020). Lowe syndrome – old and new evidence of secondary mitochondrial dysfunction. Eur. J. Med. Genet. 63, 104022. doi:10.1016/j.ejmg.2020.104022
Gobernado, J. M., Lousa, M., Gimeno, A., and Gonsalvez, M. (1984). Mitochondrial defects in lowe’s oculocerebrorenal syndrome. Arch. Neurol. 41, 208–209. doi:10.1001/archneur.1984.04050140106037
Hajra, A. K., Seiffert, U. B., and Agranoff, B. W. (1965). Labeling of mitochondrial phosphatidyl inositol phosphate by Pi32 and gamma P32ATP. Biochem. Biophys. Res. Commun. 20, 199–205. doi:10.1016/0006-291x(65)90346-3
Hajra, A. K., Seguin, E. B., and Agranoff, B. W. (1968). Rapid labeling of mitochondrial lipids by labeled orthophosphate and adenosine triphosphate. J. Biol. Chem. 243, 1609–1616. doi:10.1016/s0021-9258(18)93586-6
Holt, K. B., Winter, J., Manley, S., and Koslover, E. F. (2024). Spatiotemporal modeling of mitochondrial network Architecture. PRX Life 2, 043002. doi:10.1103/PRXLife.2.043002
Iwata, R., Casimir, P., and Vanderhaeghen, P. (2020). Mitochondrial dynamics in postmitotic cells regulate neurogenesis. Science 369, 858–862. doi:10.1126/science.aba9760
Li, Q., Lei, F., Tang, Y., Pan, J. S.-C., Tong, Q., Sun, Y., et al. (2018). Megalin mediates plasma membrane to mitochondria cross-talk and regulates mitochondrial metabolism. Cell. Mol. Life Sci. CMLS 75, 4021–4040. doi:10.1007/s00018-018-2847-3
Lo, C.-H., Chen, S., Zhao, J., Liu, Z., Wang, B., Wang, Q., et al. (2024). Defective neurogenesis in Lowe Syndrome is caused by Mitochondria Loss and cilia-related sonic Hedgehog defects. eLife 13. doi:10.7554/eLife.104055.1
Lourdes, S. R., Gurung, R., Giri, S., Mitchell, C. A., and McGrath, M. J. (2024). A new role for phosphoinositides in regulating mitochondrial dynamics. Adv. Biol. Regul. 91, 101001. doi:10.1016/j.jbior.2023.101001
Lowe, C., Terrey, M., and MacLACHLAN, E. A. (1952). ORganic-aciduria, decreased renal ammonia production, hydrophthalmos, and mental retardation: a clinical entity. AMA Am. J. Dis. Child. 83, 164–184. doi:10.1001/archpedi.1952.02040060030004
Meacham, C. E., DeVilbiss, A. W., and Morrison, S. J. (2022). Metabolic regulation of somatic stem cells in vivo. Nat. Rev. Mol. Cell Biol. 23, 428–443. doi:10.1038/s41580-022-00462-1
Mehta, Z. B., Pietka, G., and Lowe, M. (2014). The cellular and physiological functions of the Lowe Syndrome protein OCRL1. Traffic 15, 471–487. doi:10.1111/tra.12160
Mlody, B., Lorenz, C., Inak, G., and Prigione, A. (2016). Energy metabolism in neuronal/glial induction and in iPSC models of brain disorders. Semin. Cell Dev. Biol. 52, 102–109. doi:10.1016/j.semcdb.2016.02.018
Mukherjee, O., Acharya, S., and Rao, M. (2019). Making NSC and neurons from patient-derived tissue samples. Methods Mol. Biol. 1919, 9–24. doi:10.1007/978-1-4939-9007-8_2
Nolfi-Donegan, D., Braganza, A., and Shiva, S. (2020). Mitochondrial electron transport chain: oxidative phosphorylation, oxidant production, and methods of measurement. Redox Biol. 37, 101674. doi:10.1016/j.redox.2020.101674
Okoye, C. N., Koren, S. A., and Wojtovich, A. P. (2023). Mitochondrial complex I ROS production and redox signaling in hypoxia. Redox Biol. 67, 102926. doi:10.1016/j.redox.2023.102926
Olivos-Glander, I. M., Jänne, P. A., and Nussbaum, R. L. (1995). The oculocerebrorenal syndrome gene product is a 105-kD protein localized to the Golgi complex. Am. J. Hum. Genet. 57, 817–823.
Pei, L., and Wallace, D. C. (2018). Mitochondrial etiology of neuropsychiatric disorders. Biol. Psychiatry 83, 722–730. doi:10.1016/j.biopsych.2017.11.018
Rangaraju, V., Lewis, T. L., Hirabayashi, Y., Bergami, M., Motori, E., Cartoni, R., et al. (2019). Pleiotropic mitochondria: the influence of mitochondria on neuronal development and disease. J. Neurosci. 39, 8200–8208. doi:10.1523/JNEUROSCI.1157-19.2019
Sagel, I., Ores, R. O., and Yuceoglu, A. M. (1970). Renal function and morphology in a girl with oculocerebrorenal syndrome. J. Pediatr. 77, 124–127. doi:10.1016/S0022-3476(70)80056-7
Scandella, V., Petrelli, F., Moore, D. L., Braun, S. M. G., and Knobloch, M. (2023). Neural stem cell metabolism revisited: a critical role for mitochondria. Trends Endocrinol. Metab. 34, 446–461. doi:10.1016/j.tem.2023.05.008
Schoen, E. J. (1959). Lowe’s syndrome: abnormalities in renal tubular function in combination with other congenital defects. Am. J. Med. 27, 781–792. doi:10.1016/0002-9343(59)90193-7
Sharma, Y., Saha, S., Joseph, A., Krishnan, H., and Raghu, P. (2020). In vitro human stem cell derived cultures to monitor calcium signaling in neuronal development and function [version 1; peer review: 3 approved]. Wellcome Open Res. 5, 16. doi:10.12688/wellcomeopenres.15626.1
Sharma, Y., Bhatia, P., Rangappa, G., Saha, S., and Raghu, P. (2024). Enhanced notch dependent gliogenesis and delayed physiological maturation underlie neurodevelopmental defects in Lowe syndrome. bioRxiv 2024. doi:10.1101/2024.11.25.625332
Sheikh-Hamad, D., Holliday, M., and Li, Q. (2021). Megalin-Mediated trafficking of mitochondrial intracrines: relevance to signaling and metabolism. J. Cell. Immunol. 3, 364–369.
Viana, M. P., Brown, A. I., Mueller, I. A., Goul, C., Koslover, E. F., and Rafelski, S. M. (2020). Mitochondrial Fission and fusion dynamics generate efficient, Robust, and evenly distributed network topologies in budding yeast cells. Cell Syst. 10, 287–297.e5. doi:10.1016/j.cels.2020.02.002
Watt, S. A., Kular, G., Fleming, I. N., Downes, C. P., and Lucocq, J. M. (2002). Subcellular localization of phosphatidylinositol 4,5-bisphosphate using the pleckstrin homology domain of phospholipase C delta1. Biochem. J. 363, 657–666. doi:10.1042/0264-6021:3630657
Wu, T., Hu, E., Xu, S., Chen, M., Guo, P., Dai, Z., et al. (2021). clusterProfiler 4.0: a universal enrichment tool for interpreting omics data. Innovation 2, 100141. doi:10.1016/j.xinn.2021.100141
Keywords: Lowe syndrome, iPSC, mitochondria, neural stem cells, neurons, glia, metabolism
Citation: Philip RG, Bhatia P, Sharma Y and Raghu P (2025) Mitochondrial structure and function in OCRL depleted cells. Front. Cell Dev. Biol. 13:1679675. doi: 10.3389/fcell.2025.1679675
Received: 05 August 2025; Accepted: 27 October 2025;
Published: 20 November 2025.
Edited by:
Ruben Claudio Aguilar, Purdue University, United StatesReviewed by:
Maria-Paz Marzolo, Pontificia Universidad Católica de Chile, ChileMattia Zaghi, Karolinska Institutet (KI), Sweden
Copyright © 2025 Philip, Bhatia, Sharma and Raghu. This is an open-access article distributed under the terms of the Creative Commons Attribution License (CC BY). The use, distribution or reproduction in other forums is permitted, provided the original author(s) and the copyright owner(s) are credited and that the original publication in this journal is cited, in accordance with accepted academic practice. No use, distribution or reproduction is permitted which does not comply with these terms.
*Correspondence: Padinjat Raghu, cHJhZ2h1QG5jYnMucmVzLmlu
†Present address: Priyanka Bhatia, Berlin Institute for Medical Systems Biology (BIMSB), Max Delbrück Center for Molecular Medicine (MDC) in the Helmholtz Association, Berlin, Germany