 Eira Choudhary
 Rishabh Sharma
 Yashwant Kumar
 Nisheeth Agarwal
- 1Translational Health Science and Technology Institute, NCR Biotech Science Cluster, Faridabad, India
- 2Symbiosis School of Biological Sciences, Symbiosis International (Deemed University), Pune, India
Drug tolerance in mycobacterial pathogens is a global concern. Fluoroquinolone (FQ) treatment is widely used for induction of persisters in bacteria. Although FQs that target DNA gyrase are currently used as second-line anti-tuberculosis (TB) drugs, little is known about their impact on Mycobacterium tuberculosis (Mtb) persister formation. Here we explored the CRISPRi-based genetic repression for better understanding the effect of DNA gyrase depletion on Mtb physiology and response to anti-TB drugs. We find that suppression of DNA gyrase drastically affects intra- and extracellular growth of Mtb. Interestingly, gyrase depletion in Mtb leads to activation of RecA/LexA-mediated SOS response and drug tolerance via induction of persister subpopulation. Chemical inhibition of RecA in gyrase-depleted bacteria results in reversion of persister phenotype and better killing by antibiotics. This study provides evidence that inhibition of SOS response can be advantageous in improving the efficacy of anti-TB drugs and shortening the duration of current TB treatment.
Introduction
Antimicrobial resistance (AMR) is a formidable threat to the mankind. With the emergence of antibiotic-resistant pathogenic strains the burden of mortality due to such infections is manifesting its impact on global economy, which is estimated to cross 100 trillion USD by 2050 (O'Neill, 2014). In context of bacteria, AMR is introduced by either de novo mutations or integration of mobile resistance elements in the genome and hence creates a roadblock in the eradication of resistant strains (Durão et al., 2018). Tuberculosis (TB) remains the leading cause of death by single microbial infection which annually kills ~1.3 million HIV negative individuals across the globe. This burden is further escalated by infection with drug resistant strains of the causative pathogen Mycobacterium tuberculosis (Mtb), resulting in an incidence of nearly half a million cases due to multi-drug resistant (MDR) strains, of which ~6% are also extensively-drug resistant (XDR) strains (WHO., 2017).
The anti-TB chemotherapy comprises of two phases, the initial intensive phase of 2 months with daily intake of four drugs: rifampicin (Rif), isoniazid (INH), ethambutol (Emb) and pyrazinamide (PZA), and continuation phase with Rif and INH for 4–7 months (Joshi, 2011). While the initial phase is aimed to avoid the emergence of the drug-resistant organisms and to quickly reduce the bacillary load, the subsequent treatment in the continuation phase targets the recalcitrant bacterial subpopulation known as “persisters” that exhibit antibiotic insensitivity without altering their genetic makeup (Hobby and Lenert, 1957; Stewart et al., 2003; Gomez and McKinney, 2004; Jain et al., 2008). The incidence of drug resistant TB is generally attributed to the non-compliance of the regimen; however, survival fitness achieved by the pathogen during persistent state might also contribute in the emergence of AMR (Cohen et al., 2013). Despite the ongoing efforts to combat resistant strains by revitalization of current drug therapy (Sharma et al., 2017), the incidence of resistance against newly discovered anti-TB drugs viz. delamanid and bedaquilline has prompted a reassessment of the combinatorial drug therapy followed so far (Hoffmann et al., 2016).
Although multiple model systems have been employed to elicit the formation of persisters such as exposure to antibiotic (Hu et al., 2000; Dhar and McKinney, 2010; Keren et al., 2011) and stress agents (Betts et al., 2002; Deb et al., 2009), the underlying mechanism(s) of the induction of these subpopulation in Mtb is poorly characterized. Treatment with DNA gyrase inhibitor fluoroquinolone (FQ), such as ciprofloxacin, is one of the most common strategies to generate persisters in other bacteria (Hansen et al., 2008; Dörr et al., 2009; Wu et al., 2012; Grassi et al., 2017). Even though FQs are clinically used as second-line anti-TB drugs, their impact on formation of persisters in Mtb is not known.
In order to understand the direct association of DNA gyrase with the induction of persister phenotype in Mtb at the molecular level, herein, we use the CRISPR interference (CRISPRi) approach (Choudhary et al., 2015) to examine the effect of DNA gyrase depletion on physiology of Mtb H37Ra (hereafter referred as Mtb). We show that silencing the DNA gyrase expression severely attenuates bacterial proliferation, both in vitro and intracellularly. Interestingly, we observe that ~3.5% of total Mtb transcripts are induced upon suppression of DNA gyrase, majority of which are associated with DNA damage stress response including RecA-LexA regulons (Durbach et al., 1997; Brooks et al., 2001; Davis et al., 2002; Boshoff et al., 2003). Despite showing the extreme effect on growth, downregulation of Mtb DNA gyrase significantly stimulates phenotypic tolerance to different first-line anti-TB drugs. Furthermore, chemical inhibition of RecA reveals the involvement of RecA-LexA pathway in the evolution of DNA gyrase-controlled persisters in Mtb. Finally, we show that exposure to RecA inhibitor reverses the effects of DNA gyrase inhibition in Mtb and improves the bacterial killing by anti-TB chemotherapeutic agents.
Materials and Methods
Bacterial Culturing
Mtb cells were cultured in Middlebrook 7H9 broth or 7H11 agar supplemented with 1XOADS (Oleic acid [0.054 gm/l], Bovine Serum Albumin Fraction V [5 gm/l], Dextrose [2 gm/l], Sodium Chloride [0.81 gm/l]), 0.02% Tyloxapol, and 0.5% Glycerol. Cultures were grown at 37°C without (on 7H11 agar) or with (in 7H9 broth) shaking at 200 rpm. Wherever required following concentrations of antibiotics were used: 25 μg/ml kanamycin (Kan) and 50 μg/ml hygromycin (Hyg).
Construction of Knockdown Strains
To achieve the repression of genes MRA_0005/MRA_0006 (gyrB/gyrA), MRA_2165 (ftsZ), and MRA_2487 (clpP2), a pair of complementary oligonucleotides specific to the target ORF near 5′-end (Table S1) were synthesized, annealed and cloned in pGrna, as previously described (Choudhary et al., 2015), and illustrated in Figure S1. The recombinant pGrna plasmid containing gene-specific sgRNAs was transformed into dCas9-expressing Mtb H37Ra to generate knockdown strains, namely, gyr(-), ftsZ(-), and clpP2(-), respectively. Suppression was achieved by treatment of bacterial cultures with 20 ng/ml anhydrotetracycline (ATc) for 4 days (unless indicated otherwise).
Microscopy
Confocal Laser Scanning Microscopy
Bacterial cultures containing ~108 cells were pelleted and washed twice with 1X PBS, followed by suspension in 1X PBS and repeated passing through 26-guage needle. For nucleoid staining, bacterial cells were incubated with 5 μg/ml DAPI for 15 min on ice. After incubation, cells were washed with 1X PBS to remove the excess of dye and a thin smear of stained culture was prepared on a glass slide. For staining of neutral lipid (to detect lipid bodies), single cell suspension of bacteria was prepared as described above, followed by incubation with 9 μM Nile red (9-diethylamino-5-benzo[a]phenoxazinone) dye for 15 min at room temperature in dark. After staining, bacteria were pelleted, washed with decolorizing solution (0.5% HCl, 70% isopropanol, and 30% water) and 1 X PBS. Single cell suspension of stained bacteria was used to prepare thin smear on glass slide and mounted using anti-fading mounting medium. Images were acquired on Olympus FluoView FV1000 confocal microscope equipped with a 100X (numerical aperture,1.4) oil differentiated interference objective. DAPI and Nile red stained bacteria were viewed at lasers corresponding to 405 and 559 nm wavelengths, respectively. Similar capture time and adjustments were used for all the images. Cells exhibiting more than two foci in Nile red staining were considered lipid bodies (LB)-positive. For measurement of bacterial cell length, differential interference contrast (DIC) images were captured on Olympus FluoView FV1000 microscope and analyzed using FluoView FV1000 software. Each analysis was performed with images from a minimum of 20 different fields comprising of ~300 cells.
Scanning Electron Microscopy (SEM)
For SEM analysis, bacterial cultures of control and gyr(-) were pelleted and washed twice with 0.1 M phosphate buffer (pH 7.4), followed by single cell suspension of pellets in fixative buffer (2% paraformaldehyde and 2.5% glutraldehyde in 0.1 M phosphate buffer). After overnight incubation at 4°C, cells were washed twice with 0.1 M phosphate buffer and observed under Zeiss EVO40 microscope at the Advanced Instrumentation Research Facility in the Jawaharlal Nehru University, India (https://www.jnu.ac.in/airf).
Antibiotic Susceptibility Assay
Antibiotic treatment was performed with broth cultures of control and respective knockdown strains after 4 days of treatment with 5 ng/ml ATc at equal OD600 of 0.05 to achieve ~50% suppression of gyrase and maintain sufficient growth of bacteria. CFU was estimated in antibiotic-treated or untreated samples at indicated time points by spreading serial dilutions of cultures on 7H11 agar containing Kan and Hyg, after 4 weeks of incubation at 37°C. Percentage viability in drug-treated cultures compared to untreated was calculated to analyze the effect of gene knockdown on susceptibility to a particular antibiotic. Antibiotic susceptibility was also tested by spotting two-fold serial dilutions of bacterial cultures on 7H11 agar plates, followed by 4 weeks of incubation at 37°C. To determine the effect of suramin on susceptibility to antibiotic, initial ATc treatment of control and gyr(-) was performed in the presence of 50 μM suramin for 4 days in order to limit the RecA activity prior to drug treatment, followed by adjustment of culture OD600 to ~0.05 and subsequent incubation with respective antibiotics and 50 μM suramin for different time points. Cell viability was determined as described above.
MIC Determination
The MIC99 (MIC to inhibit 99% of cell viability) of different drugs against the passaged cultures of control and knockdown strains was determined by micro-titer broth dilution method (Hall et al., 2011). Briefly, the OD600 of cultures were adjusted to ~0.05 and incubated with equal volume of different dilutions of antibiotics in 96-well plate (final volume of 100 μl per well). Plates were incubated at 37°C for ~2 weeks. Growth as a visible bacterial pellet at the bottom of well was noted and compared with the growth of untreated control wells. The lowest concentration of antibiotic which prevented pellet formation was considered as MIC99.
Intracellular ATP Measurement
Bacterial cultures were pelleted down, washed twice with 1 X PBS and whole cell lysate was prepared in 1 X PBS by bead beating. Level of ATP was measured in the lysate using Bac Titer-GloTM assay kit as per the manufacturer's recommendations (Promega). ATP concentration in each sample was denoted as relative luminescence units (RLU) normalized to total protein concentration in the lysates.
RNA Extraction and Microarray Analysis
Total RNA was extracted using RNAiso plus reagent (Takara Bio Inc.) according to the manufacturer's instructions from two independent sets of control and gyr(-) strains of Mtb after 4 days of depletion. Fluorescent dye-labeled cDNA were prepared by using 4 μg RNA from both the strains with the help of SuperScript® Direct cDNA Labeling System (Thermo Fisher). For each hybridization, the cDNA probes were labeled with Alexa fluor 555 or Alexa fluor 647 (Life Technologies) and used in pairs. Complementary DNAs from the first set of samples were prepared using Alexa fluor 555-tagged dCTP for control and Alexa fluor 647-tagged dCTP for the knockdown, whereas for the second set dyes were switched such that control cDNA samples were labeled with Alexa fluor 647 and those from gyr(-) were prepared using Alexa fluor 555-tagged dCTP. Mtb-specific microarray slides were commercially procured (Microarray Inc.) that comprise of oligonucleotides specific to 3924 genes representing complete genome of Mtb in triplicates. Scanning of slides and data analyses were performed as described previously (Thakur et al., 2016). Mean fluorescence intensities of each of the 3924 spots from three different hybridizations per array were analyzed after normalization with total fluorescence intensities. Fold-change in expression levels was subsequently determined using the normalized fluorescence intensities of green and red channels. Average of values from two biological repeat experiments were used to identify genes which exhibit >two-fold difference in expression between the two strains with P-values of 0.05 or less, as determined by paired Student's t-test and false discovery rate (FDR) of <5%, as calculated by Benjamini–Hochberg procedure.
Quantitative Real Time Reverse Transcription PCR
First strand cDNA synthesis was performed with 1 μg total RNA after DNase I treatment using random hexamer primers and Superscript III reverse transcriptase (Invitrogen Life Technologies), according to the manufacturer's recommendations. PCR was performed with 50 ng cDNAs and SYBR Green PCR Master Mix (Applied Biosystems) using gene-specific primer pairs (Table S1), and real-time quantification was carried out using the ABI 7500 Fast Real-Time PCR System (Applied Biosystems) as instructed by the manufacturer. Expression level of different genes in the DNA gyrase depleted strain was estimated relative to their expression in ATc-untreated control after normalizing with the change in expression level of a housekeeping gene sigA, as described previously (Thakur et al., 2016).
Fluorescence-Activated Cell Sorting (FACS) Analysis
For nucleoid morphology analysis by FACS, DAPI-stained cells equivalent to ~105 CFU/ml in 1 X PBS were passed through 26 gauge syringe needle and acquired on BD FACSCanto II (BD Biosciences) at low aspiration speed. DAPI was excited with violet laser and detected with 450/50 nm bandpass emission filter. Total of 10,000 events were acquired and gating was set using unstained cultures of control and gyr(-) by forward scatter (FSC) and side scatter (SSC) of light. Subsequently, bacterial cells were positioned on FSC-A and SSC-A scatter plot. Data acquisition was performed by BD FACSDIVA™ software (BD Biosciences) and analyzed using FlowJo v10.0.6 software (FlowJo, LLC). Distinctive DAPI staining was evaluated based on median fluorescence intensity obtained from control and gyr(-) strains.
Macrophage Infection
For macrophage infection, THP1 cells were seeded in 24-well plates at a density of 2 × 10⁵ cells per well and differentiated using 50 nM phorbol myristate acetate (PMA). After 24 h of differentiation, PMA was removed and cells were infected with control and gyr(-) at 1:2 MOI (macrophage: bacteria) in RPMI medium containing 10% heat-inactivated fetal bovine serum (FBS). After 4 h of incubation, cells were washed with pre-warm 1 X PBS and replenished with RPMI-FBS containing amikacin (50 μg/ml) for 1 h to kill extracellular bacteria. Subsequently cells were washed and maintained in RPMI-FBS medium containing 200 ng/ml ATc throughout the experiment. At different time points cells from two wells were harvested by using 1 X PBS+0.1% Triton X100 and incubated on ice for 5 min in order to release intracellular bacteria. Cell debris were removed by centrifugation and bacterial supernatant was serially diluted in 1 X PBS and spread on 7H11 agar plates for CFU enumeration after 4 weeks of incubation at 37°C.
Analysis of Metabolites
Metabolite Extraction
Metabolites were extracted from ATc-treated empty vector control and gyrase knockdown strains using ~2.0 OD600 equivalent culture pellets suspended in 1 mL of ice-cold 80% methanol (in water) by multiple freeze thaw approaches (Sellick et al., 2011). Extracted metabolites were vacuum dried and stored at −80°C till further use.
Estimation of Metabolites
Samples were reconstituted in 15% methanol before analysis by liquid chromatography mass spectrometry (LC-MS). All data were acquired on the Orbitrap Fusion mass spectrometer (Thermo Scientific) equipped with heated electrospray ionization (HESI) source. Data were acquired on positive and negative modes using the spray voltage of 4,000 and 35,000 volt, respectively, at 120,000 resolution in MS mode and 30,000 resolution in data-dependent MS2 scan mode. Sheath gas and auxiliary gas were set to 42 and 11, respectively. Mass scan range of 50–1,000 m/z, ACG target at 200,000 ions and maximum injection time of 80 ms were used for MS, whereas ACG target was set to 20,000 ions and maximum injection time of 80 ms was used for MS/MS. Cell extracts were separated on UPLC using HSS T3 column (100 × 2.1 mm i.d, 1.7 μm, Waters) maintained at 40°C. The mobile phase A was 0.1% formic acid in water and mobile phase B was 0.1% formic acid in acetonitrile. The elution gradient was used as follows: 0 min: 1%B+99%A; 1 min: 15%B+85%A; 4 min: 35%B+65%A; 7–9 min: 95%B+5%A; and 10–14 min: 1%B+99%A. The sample injection volume was 5 μl and the flow rate of 0.3 ml/min was maintained throughout the sample elution.
Data Processing and Identification of Metabolites
All acquired data were processed using compound discoverer 2.1 software (Thermo Scientific) with the default settings to carry out metabolite identification and quantitation. The untargeted metabolomics workflow of compound discoverer 2.1 was used to perform retention time alignment, feature detection, and elemental composition prediction. Experimental blank runs acquired during data acquisition were used to remove background features arising from mobile phase. Identification of metabolites was performed primarily on the basis of in-house library of compounds for accurate mass, fragmentation, and retention time match, which were also verified on the basis of the accurate mass and fragmentation information available on mzCloud database with compound discoverer 2.1 (Thermo Fisher Scientific).
Results
Mtb Growth Is Drastically Affected by Suppression of gyrB-gyrA Operon
DNA gyrase is a heterodimer protein complex comprising of two subunits GyrB and GyrA that are encoded by gyrB (MRA_0005) and gyrA (MRA_0006) genes which are clustered in an operon-like fashion in the genome of Mtb. Suppression of DNA gyrase encoding genes in Mtb was achieved by employing the CRISPRi approach (Choudhary et al., 2015; Figure S1), as described in the materials and methods. The resulting strain was annotated as gyr(-). Copy number of both the gyrB and gyrA transcripts was examined in gyr(-) after 4 days of treatment with different doses of anhydrotetracycline (ATc) by quantitative real time reverse transcription PCR (qRT-PCR). Figure 1A shows a gradual reduction in the expression of both the genes with increasing concentration of ATc. While there is 55 and 65% reduction in gyrB and gyrA levels, respectively, after exposure to 5 ng/ml ATc, further increase in ATc concentration to 10 ng/ml leads to ~90% reduction in expression levels of these genes. Moreover, there is no effect of ATc on the transcript levels of an unrelated control gene sigA (Figure 1A). We also notice a similar effect of ATc on in vitro growth of gyr(-) strain of Mtb which exhibits ~50% reduction in OD600 after 4 days of incubation with 10 ng/ml ATc, in comparison to ATc-untreated culture (Figure 1B). Noteworthy to mention that these effects are attributed to only gyr(-) strain, as the control strain of Mtb harboring empty plasmid does not exhibit any change in growth profile when cultured in the presence of ATc (Figure 1B).
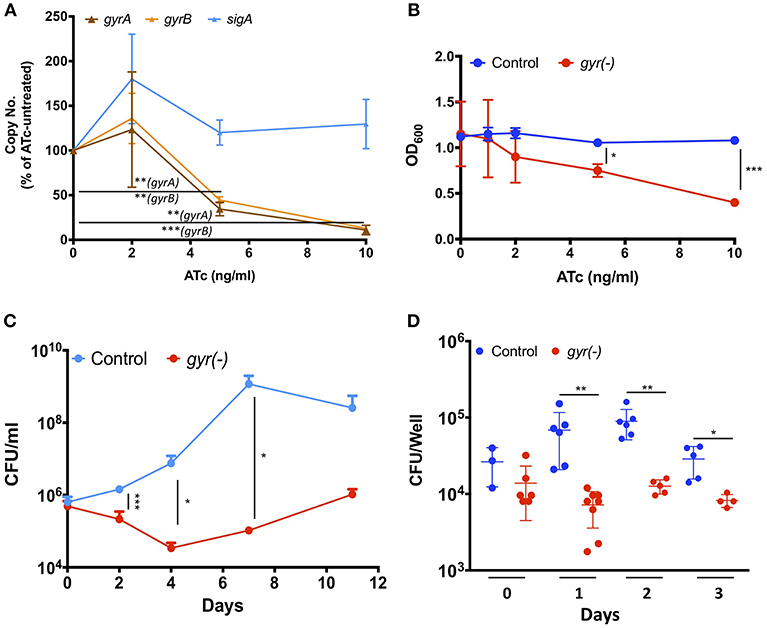
Figure 1. DNA gyrase is indispensable for growth of Mtb H37Ra. (A) Effect of CRISPRi-mediated silencing on expression of DNA gyrase-encoding genes. Transcript levels of gyrA and gyrB were measured in gyr(-) strain by qRT-PCR following treatment with increasing concentrations of ATc for 4 days. Shown is percentage modulation in copy number of respective transcripts in comparison to ATc-untreated control. Error bars represent the SD from four measurements. (B) Influence of dose-dependent suppression of DNA gyrase-encoding genes on growth of Mtb. in vitro growth of empty vector containing control and gyr(-) was determined by measuring OD600 of bacterial cultures treated with different concentrations of ATc for 4 days. Error bars represent the SD from four measurements. (C) Effect of DNA gyrase suppression on time-dependent growth kinetics of Mtb. The in vitro growth of empty vector containing control and gyr(-) was determined at designated time points by CFU enumeration of viable bacteria in cultures treated with 50 ng/ml ATc. Error bars represent the SD from at least three measurements. (D) Comparative analysis of intracellular growth profile of control and gyr(-) strains of Mtb. Infection of human monocyte-derived macrophages was performed with 1:2 MOI (macrophages: bacteria) for 4 h followed by treatment with 50 μg/ml amikacin to kill extracellular bacteria. Intracellular bacterial load was estimated by spreading serial dilution of macrophage lysates at indicated time points on 7H11-OADS agar plates. Error bars represent the SD from at least three measurements. Statistical significance is determined by paired Student's t-test: *P < 0.05, **P < 0.01, ***P < 0.001.
Next, we examined the growth profile of gyr(-) and control strains over a period of two weeks, when inoculated in the 7H9 broth medium containing ATc. Since ATc gets metabolized, here we used a relatively higher concentration (50 ng/ml) of it for constant suppression of gyrA-B genes. While the control strain exhibits normal growth, replication of gyrA-B depleted Mtb is severely affected by ATc treatment. Quantitative estimation of gyr(-) by enumeration of colony forming unit (CFU) reveals 85% reduction in growth on day 2, and ~99% reduction on days 4, 7, and 11 post-ATc treatment when compared with growth of the control bacteria (Figure 1C). These results thus demonstrate that constant suppression of DNA gyrase in Mtb prohibits bacterial proliferation in vitro.
Further, we also evaluated the effect of DNA gyrase suppression on intracellular survival of Mtb in THP-1 derived macrophages. Infection was performed with control and gyr(-) strains, pre-treated with 50 ng/ml ATc for 4 days, at 1: 2 multiplicity of infection (macrophage: bacteria) for 4 h. Determination of intracellular growth by CFU counting suggests that despite equal infection on day 0 by both the control and gyr(-) strains, the latter shows significant (P < 0.01) attenuation on successive days, whereas the control Mtb maintains its viability in the resting macrophages at all time points (Figure 1D). In comparison to the control strain, viability of gyr(-) is reduced by 90% on day1, 86% on day2, and 72% on day3 of infection. These results thus suggest that gyrase depleted Mtb is unable to face the intracellular host conditions.
Analysis of Cell Morphology of gyr(-)
In order to gain an insight into the effect of genetic suppression of DNA gyrase on Mtb growth, we further examined the nucleoid morphology of gyr(-) by confocal laser scanning microscopy using DNA-binding fluorescent dye, 4′,6-diamidino-2-phenylindole (DAPI), as reported earlier (Bhowmick et al., 2014). As depicted in Figure 2A, the gyr(-) shows a significantly dispersed nucleoid as against lobed pattern observed with the control Mtb (Figure 2A). Since defect in nucleoid morphology results in altered DAPI fluorescence intensity (Cho et al., 2004), the effect of gyrase depletion was also determined by fluorescence-activated cell sorting (FACS) analysis of DAPI-stained bacteria. A ~3.5-fold increase in the fluorescence intensity of DAPI from gyr(-) compared to control (P < 0.01) indicates perturbations of nucleoid architecture in gyr(-) (Figure 2B). Notably, a similar effect on DAPI fluorescence intensity was also observed with wild-type bacteria treated for 24 h with 5 μg/ml ofloxacin, a specific inhibitor of DNA gyrase (Figure 2B, FQ). Moreover, these effects are specific to DNA gyrase since we fail to observe any change in nucleoid morphology of Mtb depleted with unrelated essential gene clpP2 (Figure S2).
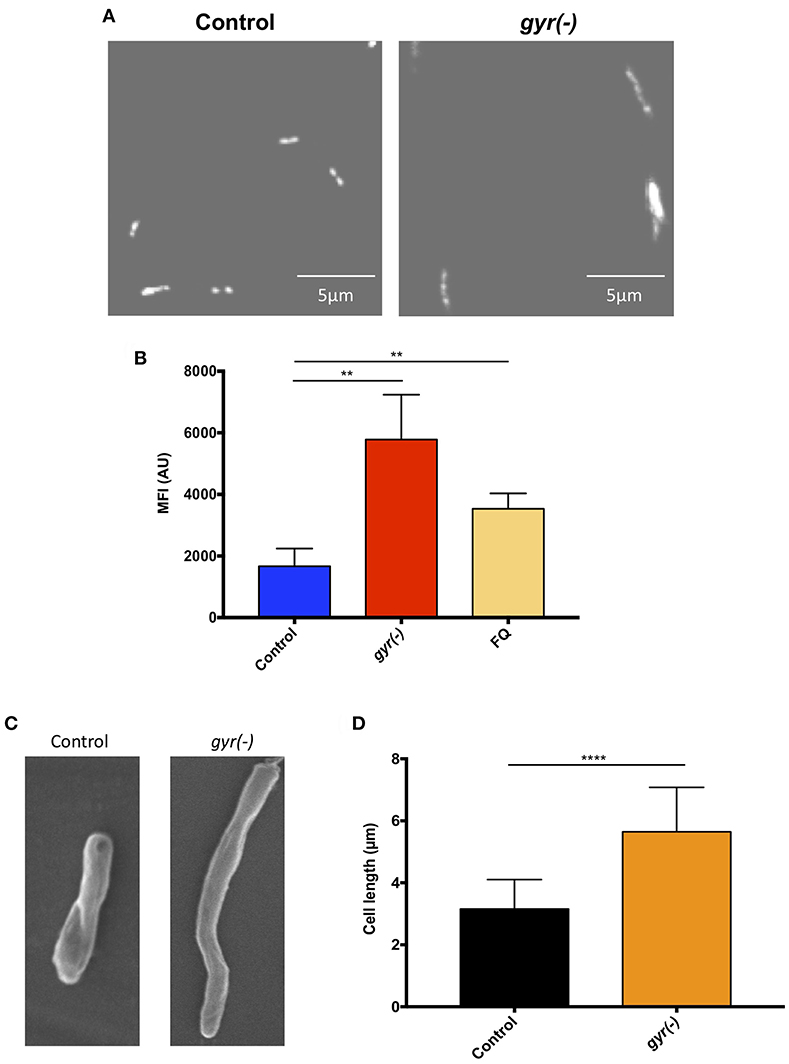
Figure 2. Depletion of DNA gyrase perturbs nucleoid morphology. (A) Effect of gyrase depletion on nucleoid organization. Morphology of 4′,6-diamidino-2-phenylindole (DAPI)-stained nucleoid of both control and gyr(-) was observed by confocal laser scanning microscopy using 100x oil objective under ultraviolet illumination. Each image is a representative of multiple fields from three different experiments. (B) Quantitative estimation of bacterial nucleoid decompaction. Status of DAPI-stained nucleoids of control and gyr(-) was analyzed by estimating median fluorescence intensity (MFI) of the dye using flow cytometry. Values were obtained from 10,000 events using FlowJo software (FlowJo LLC). FQ-treated Mtb was used as a reference control. Error bars represent SD from at least 3 replicates and statistical significance is determined by paired Student's t-test: **P < 0.01. (C) Scanning electron microscopy (SEM) analysis of bacteria. Shown are the SEM images of control and gyr(-) after 4 days of treatment with 20 ng/ml ATc. Each image is a representative of multiple fields from three different experiments. (D) Effect of gyrase depletion on bacterial cell length. Cell length of control and gyr(-) was determined under light microscopy using 100x oil objective. Shown are the mean cell lengths of ~300 cells from three different experiments. Statistical significance is determined by paired Student's t-test: ****P < 0.0001.
Alteration in the nucleoid morphology is reminiscent of the aberrant replication status of a cell (Misra et al., 2018). Morphological analysis by scanning electron microscopy indicates a significant increase in bacterial cell length due to DNA gyrase depletion (Figure 2C). The mean cell length of control bacteria is 3.2 ± 0.05 μm, whereas the gyr(-) strain exhibits an 80% increase in cell length measuring to 5.7 ± 0.08 μm (n = 320; P < 0.0001; Figure 2D). As a positive control, we also determined the cell length of Mtb lacking the expression of a known cell division gene, ftsZ (Dziadek et al., 2003; Weiss, 2004). Similar to our observation with gyr(-), bacteria depleted with ftsZ exhibits >100% increase in length compared to control (mean cell length = 6.9 ± 0.15 μm, P < 0.0001; Figure S3).
Identification of DNA Gyrase Regulons by Whole Genome Transcriptional Profiling
There is an interplay between supercoiling state of genome and its transcriptional turnover (Willenbrock and Ussery, 2004; Ma and Wang, 2016). Since DNA gyrase is a type II topoisomerase which is involved in maintaining the topological state during major DNA transactions, it becomes prudent to study the aftermath of tempering with gyrase expression on the profile of mRNA transcripts. We therefore examined the global transcriptional response of Mtb to loss of DNA gyrase, achieved by genetic approach. Complementary DNAs (cDNAs) prepared from gyrase depleted or control cells, were labeled with alexa fluor dyes during the cDNA synthesis followed by hybridization with Mtb microarrays, as described in the materials and methods. Fold change in expression was calculated for each gene by comparing the spot intensities in both the control and gyr(-) after normalization with their respective total fluorescence intensities.
Strikingly, 92% of the differentially expressed genes (n = 156) are significantly induced (>two-fold with P < 0.05 and false discovery rate (FDR) of 5%), whereas only a small fraction (13 genes) exhibit reduced expression (<0.5-fold with P < 0.05 and FDR of 5%) upon DNA gyrase depletion in Mtb (Supplementary Dataset 1 and Figure 3A). Functional classification of upregulated genes, as defined in the Mycobrowser database (https://mycobrowser.epfl.ch/), further reveals that genes corresponding to the information pathways (16%, n = 25), insertion sequences and phages (16%, n = 25), cell wall and cell processes (12%, n = 18), and intermediary metabolism and respiration (11%, n = 17) are primarily affected in gyr(-). In addition, a significant proportion of uncharacterized genes (~31%) together with a small subset of genes involved in virulence, lipid biosynthesis and transcription are also upregulated in Mtb depleted with DNA gyrase (Figure 3A). Remarkably, 36 out of 59 genes involved in regulating bacterial SOS response under the conditions such as UV irradiation, treatment with hydrogen peroxide and a mutagenic agent mitomycin C (MMC) (Boshoff et al., 2003) are induced in Mtb upon DNA gyrase depletion (Supplementary Dataset 2 and Figure 3B). The list also includes a distinct set of transcripts viz., Rv0336 (3.70-fold), Rv0515 (3.71-fold), Rv1702c (5.02-fold), Rv2100 (6.5-fold), ruvC (2.43-fold), Rv2719c (2.20-fold), recA (4.86-fold), Rv3074 (5.66-fold), and dnaE2 (5.27-fold) that are controlled by LexA repressor, a regulator of SOS response, in a RecA-dependent manner (Davis et al., 2002). The observed induction of the LexA regulons in gyr(-) by microarray hybridization was also verified by qRT-PCR using specific primers (Figure S4). Overall, the above results suggest that depletion of gyrase expression elicits SOS response in Mtb.
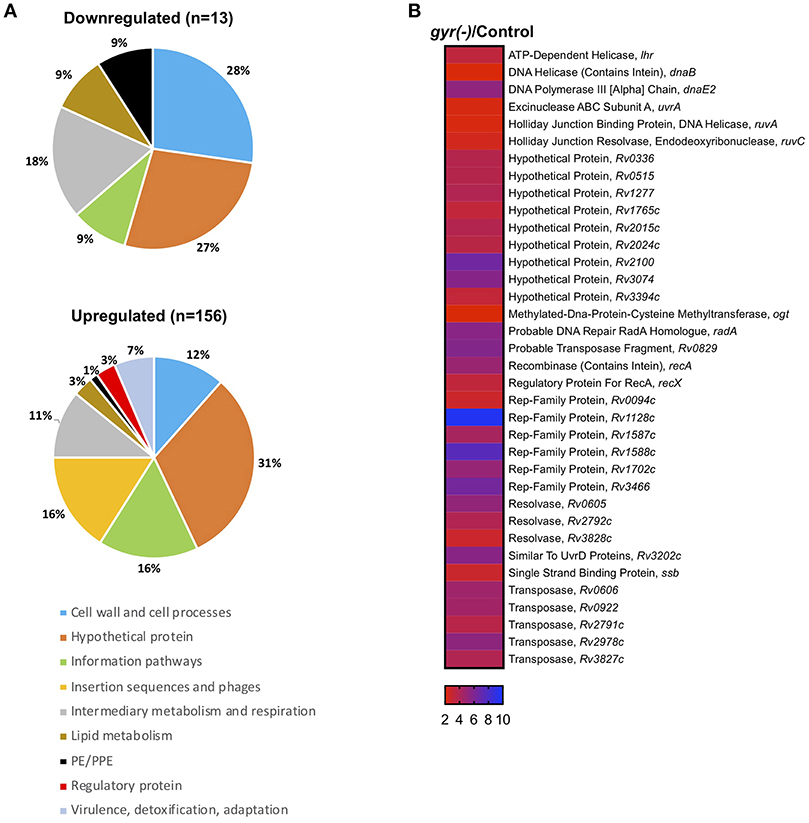
Figure 3. Silencing the DNA gyrase results in induction of DNA damage response in Mtb. (A) Microarray analysis of differentially expressed genes in gyr(-). Pie charts show percentage distribution of differentially expressed genes in gyr(-) among various functional categories according to the classification by Mycobrowser database (https://mycobrowser.epfl.ch/genes/). Data represent two independent microarray experiments, each containing triplicate values for 3,924 genes. Shown are genes that are modulated by > 2-fold in gyr(-) compared to control Mtb (P < 0.05, as determined by paired Student's t-test and FDR of 5%). (B) Expression analysis of genes involved in bacterial DNA damage response in gyr(-). Heat map shows a subset of genes from (A) known to control DNA damage response in Mtb (Boshoff et al., 2003).
Depletion of DNA gyrase in Mtb Induces Persisters
Induction of SOS response is correlated with the formation of persister cells in bacteria (Dörr et al., 2009). As we have observed significant induction of SOS-responsive genes in gyr(-), we next determined the susceptibility of gyr(-) to the first-line anti-TB drugs. Broth cultures of control and DNA gyrase depleted bacteria with equal OD600 of 0.05 were treated with different concentrations of Rif, INH and Emb followed by bacterial enumeration using CFU plating (Supplementary Dataset 3).
Our results reveal that Mtb lacking the expression of DNA gyrase exhibits 1.5–2.2-fold (P < 0.05) less killing compared to the control by Rif treatment with a 15-fold higher dose of drug than its minimum inhibitory concentration (MIC) for 24- and 48 h, respectively (Figure 4A). Similarly, the related tolerance pattern in gyr(-) is also seen toward other drugs such as INH and Emb (Figures 4B,C). While incubation with 5- and 10x MIC of INH results in >99.5% killing of control bacteria at both the time points, a significant proportion of gyr(-) cells exhibits tolerance under the same treatment conditions. As against control Mtb, the gyr(-) strain shows 8- (P < 0.0001) and 45-fold (P < 0.05) more survival after treatment with 5x MIC of INH for 24- and 48 h, respectively; the effect is similar even with higher drug concentration of 10xMIC where we find 8- (P < 0.0001) and 10-fold (P < 0.01) better survival of gyr(-) after 24- and 48 h of exposure, respectively (Figure 4B). Similar to these drugs, treatment with Emb also indicates significantly better tolerance of gyr(-) than control after 48 h of treatment with 5x (2.4-fold; P < 0.001) and 10x (3.7-fold; P < 0.0001) MIC of the drug (Figure 4C). Tolerance of DNA gyrase depleted Mtb to drugs was also confirmed by spotting the serially diluted bacterial cultures after drug treatment on 7H11-OADS agar (Figure S5A). Remarkably, level of tolerance is maintained in these bacteria even after successive passaging of the respective antibiotic-treated cultures (Figures S5B–E). In addition, these effects are specific to the knockdown of DNA gyrase, as suppression of another essential gene, clpP2 does not alter bacterial susceptibility to antibiotics (Figure S6). In pursuit of determining whether drug tolerance is attributed in gyrase knockdown strain at the genetic level, we determined the MIC as well as killing effect of the first-line drugs, Rif, INH, and Emb using the passaged cultures of control and gyr(-), but in the absence of ATc when no suppression of gyrase expression is observed. Our results show equal susceptibility of both the strains to these antibiotics (Figures S7A–E), thus suggesting that the apparent tolerance of DNA gyrase depleted Mtb to drugs is not genetically heritable.
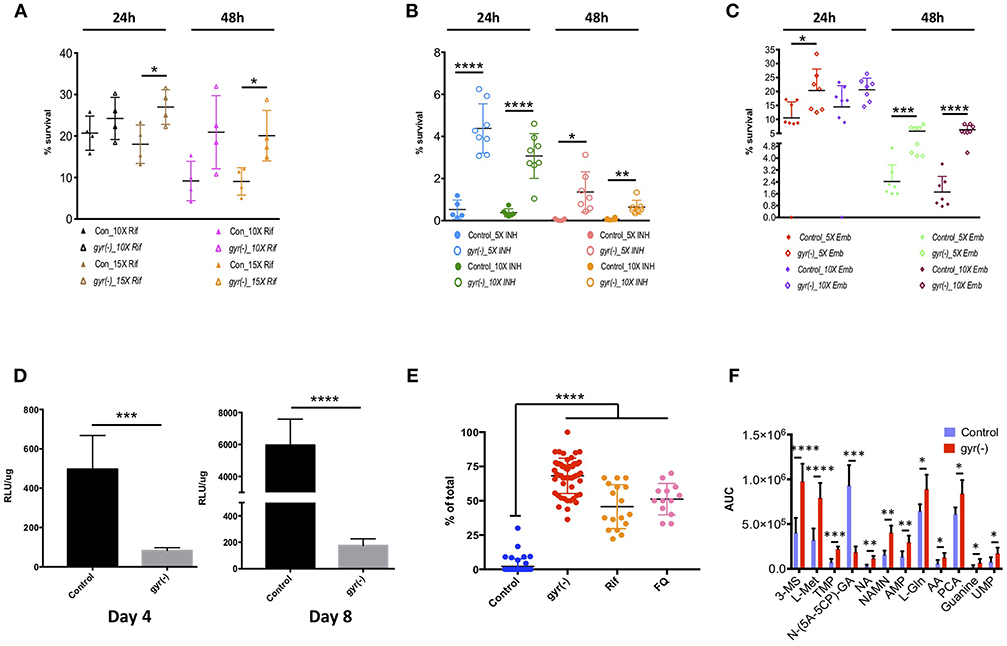
Figure 4. Depletion of DNA gyrase induces persister formation. Antibiotic susceptibility of gyrase knockdown strain to the first-line anti-TB drugs was determined by exposing bacterial cultures of control and gyr(-) at OD600 of 0.05 to different concentrations of drugs followed by CFU enumeration. Cell survival is expressed as percentage survival relative to drug-untreated cells. Reference minimum inhibitory concentration (MIC) of each drug against wild-type Mtb was obtained from the published literature. Shown are the dot-plots exhibiting the time- and dose-dependent survival kinetics of both the strains after treatment with: (A) Rif, (B) INH, and (C) Emb. Error bars represent the SD from at least four different measurements. Statistical significance is determined by paired Student's t-test: *P < 0.05, **P < 0.01, ***P < 0.001, and ****P < 0.0001. (D) Estimation of intracellular ATP levels. Intracellular ATP levels were measured in control and gyr(-) after 4- and 8 days of treatment with 20 ng/ml ATc by using BacTiter-Glo™ microbial cell viability assay (Promega). Final ATP levels were calculated after normalizing the intensity of luminescence (expressed as relative luminescence unit [RLU]) with total protein concentration in each sample. Error bars represent the SD from at least three different experiments. Statistical significance is determined by paired Student's t-test: ***P < 0.001 and ****P < 0.0001. (E) Estimation of lipid bodies. Lipid bodies (LB) were estimated in bacteria stained with Nile red by counting lipid-rich foci under confocal laser scanning microscopy using 100x oil objective. The dot plot shows percentage of total cells exhibiting >2 LBs in control, gyr(-), Rif- and FQ-treated wild-type Mtb, respectively. Data were obtained by estimating LBs in at least 200 bacterial cells from multiple fields. Error bars represent the SD from three different measurements. Statistical significance is determined by paired Student's t-test: ****P < 0.0001. (F) Comparative analysis of metabolites in control and gyr(-) strains of Mtb. Quantitative estimation of metabolites in control and gyr(-) was performed by LC-MS/MS and average values from six different experiments are plotted in the bar graph. Shown are the metabolites that are modulated by >1.3-fold in gyr(-) compared to control Mtb. Statistical significance is determined by paired Student's t-test: *P < 0.05, **P < 0.01, ***P < 0.001, and ****P < 0.0001.
The above results provide an indication of the presence of persisters in DNA gyrase depleted bacterial population that exhibit phenotypic drug tolerance. Since, energy state of bacteria plays an important role in maintaining persisters (Shan et al., 2017), we further determined the levels of ATP in Mtb following the DNA gyrase depletion. Total ATP was measured after 4 and 8 days of ATc treatment in empty vector containing control and gyr(-). Intracellular ATP level was measured as described in the materials and methods, and the values of relative luminescence unit (RLU) were normalized with the total protein concentration in the respective samples. As shown in Figure 4D, total cellular ATP pool in gyr(-) is declined by six-fold (P < 0.0001) compared to control after 4 days of suppression, and this level is further reduced to 34-fold lower than control on day 8 of ATc treatment. Importantly, the control bacteria exhibit >10-fold increment in intracellular ATP level upon progression of in vitro growth from day 4 to day 8, whereas the same is changed by only two-fold in gyr(-) strain of Mtb (Figure 4D). Another hallmark of persisters in mycobacteria is the accumulation of lipid bodies (LBs). Recently it was shown that as high as 40-fold more drug concentration is required to clear lipid-rich mycobacteria (Hammond et al., 2015). Consistent with these findings, we also observe that wild-type bacteria treated with drugs such as Rif or FQ exhibit significant (P < 0.0001) elevation of LBs. Twelve hours of exposure to 10xMIC of Rif induces 22-fold increase in the number of LB+ bacteria (45.7 ± 3.9% LB+, P < 0.0001), whereas with FQ treatment under similar conditions, their levels are increased by 24-fold (51.2 ± 3.2% LB+, P < 0.0001), compared to drug-untreated bacteria (Figure 4E). These observations together indicate that formation of LBs is an inherent response of persister bacilli. Intrigued with these findings, we further evaluated the status of these lipid-rich structures in DNA gyrase depleted Mtb. Our results reveal that a significant proportion of gyr(-) bacteria (68.2 ± 1.8%, P < 0.0001) are loaded with LBs reminiscent of drug-tolerant persister population, in contrast to control strain where majority of the cells (97.9 ± 0.8%, P < 0.0001) are devoid of any such feature (Figure 4E).
Effect of DNA Gyrase Depletion on Metabolic State of Mtb
In order to analyze the metabolic state of Mtb depleted with DNA gyrase expression, we estimated the levels of metabolites by LC-MS/MS, as described in the materials and methods. Metabolites in both the control and gyr(-) were quantified by using concentration-dependent standard curves for each metabolite as described earlier (Gupta et al., 2018). Those small molecules which exhibit minimal variation (P < 0.05) in six biological samples were examined for fold-change in their levels between the two strains (Supplementary Dataset 4). As presented in Figure 4F, we find 12 such metabolites that are differentially accumulated by >1.3-fold. Interestingly, DNA gyrase knockdown results in accumulation of most of these except N-(5-Amino-5-carboxypentyl)glutamic acid [N-(5A-5CP)-GA], which is an intermediate of lysine metabolic pathway, and exhibits ~five-fold reduction in gyr(-) compared to control. We observe overabundance of several nucleotides such as thymidine 5′-monophosphate (TMP, 3.0-fold), adenosine 5′-monophosphate (AMP, 2.18-fold), guanine (3.42-fold), and uridine monophosphate (UMP, 2.19-fold) in DNA gyrase depleted bacteria. Moreover, we also find significant increase in the levels of other metabolites in gyr(-) such as coenzymes nicotinic acid (NA, 3.61-fold) and nicotinic acid mononucleotide (NAMN, 2.58-fold) that are key regulators of energy metabolic pathways; and amino acids such as L-(-)-methionine (L-Met, 2.46-fold), L-glutamine (L-Gln, 1.38-fold), and L-pyroglutamic acid (PCA, 1.37-fold), respectively (Figure 4F). Overall, accumulation of these metabolites suggests that suppression of DNA gyrase results in perturbation of the central metabolic pathways in Mtb.
Treatment With Suramin Augments Bactericidal Effect of Antibiotics Against gyr(-)
So far, our results have demonstrated that bacteria depleted with DNA gyrase exhibit altered nucleoid morphology and cessation of core metabolic pathways. Such metabolic perturbations eventually result in induction of the RecA-LexA dependent SOS response and phenotypic tolerance to anti-TB drugs in a subpopulation containing excess of lipid granules. These observations further prompted us to evaluate the effect of suppression of RecA-LexA mediated SOS response on formation of persisters in Mtb.
Few years ago, it was reported that suramin (also called germanin), which is in clinical use since the 1920s as an anti-trypanosomal (sleeping sickness) and anti-filiarial drug (Wang, 1995), inhibits ATPase and DNA strand exchange activities of E. coli RecA (Wigle and Singleton, 2007). Subsequently, the effect of suramin was also investigated against the RecA protein of Mtb, which showed that the drug not only adversely affects its activity by disassembling RecA–single-stranded DNA filaments, but it also blocks the elicitation of SOS response in FQ-treated M. smegmatis (Nautiyal et al., 2014).
In order to examine if suramin treatment affects the overall frequency of persisters in Mtb, we analyzed its impact on accumulation of LBs in gyr(-), and efficacy of Rif and INH against control and gyr(-) strains. Bacteria were treated for 4 days with a concentration of suramin (50 μM) which is lethal for RecA nucleoprotein filament assembly (Nautiyal et al., 2014), and LBs were counted as described above. Figure 5A shows a significant effect of suramin on accumulation of LBs in gyr(-). While, 74.5 ± 1.4% of total mycobacterial cells exhibit the presence of LBs upon depletion of DNA gyrase, addition of 50 μM suramin in the bacterial culture of gyr(-) reduces their proportion to 51.0 ± 2.4% (P < 0.0001). Similarly, we find a marked improvement in killing (P < 0.01) of bacteria by Rif or INH when performed in the presence of suramin. Compared to Rif alone, treatment with Rif and suramin reduces the viability of control and gyr(-) by 2.3- and 4.6-fold, respectively, after 48 h of treatment. Likewise, bactericidal effect of INH is also found to be enhanced by 2.1- (against control) and 3.5-fold [against gyr(-)], when incubated in the presence of suramin for 48 h (Figures 5B,C).
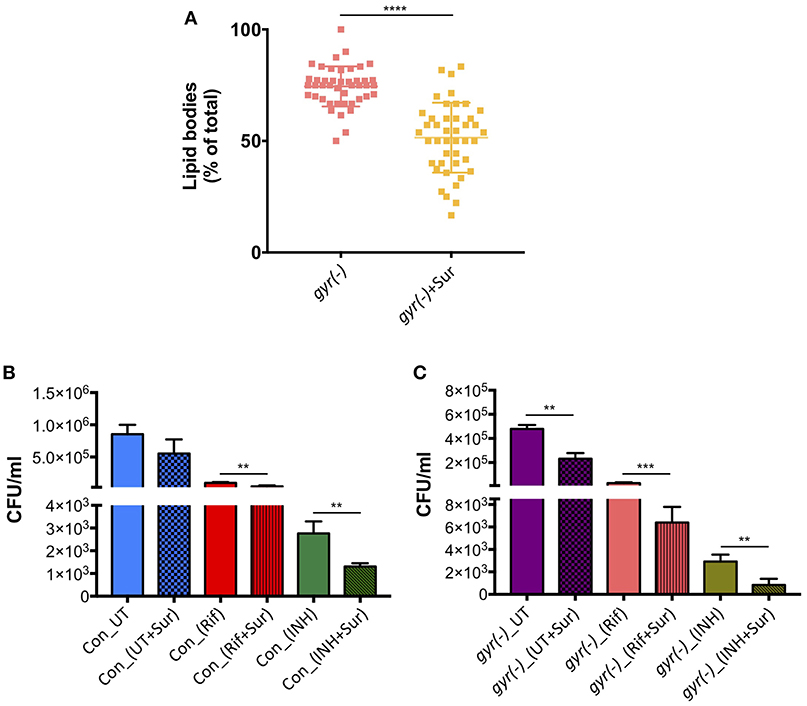
Figure 5. Inhibition of RecA potentiates the bactericidal effect of anti-TB drugs. (A) Effect of suramin on the induction of LBs in gyr(-). DNA gyrase depletion was performed in the absence or the presence of 50 μM suramin for 4 days, followed by Nile red staining of cultures. Percentage accumulation of LB+ cells was estimated from at least 40 fields from a total of three independent experiments. Statistical significance is calculated by student's t-test: ****P < 0.0001. (B) Effect of suramin on the bactericidal effect of antibiotics against control Mtb. Survival of bacteria after 48 h of treatment with 10X MIC of Rif and INH in the absence or the presence of 50 μM suramin, respectively, was determined by CFU enumeration. Error bars represent the SD from four measurements. Statistical significance is calculated by student's t-test: **P < 0.01. (C) Effect of suramin on the efficacy of drugs against gyr(-). DNA gyrase depletion was performed in the absence or the presence of 50 μM suramin for 4 days, and its susceptibility against Rif and INH was determined by estimating CFU counts after 48 h of treatment with 10X MIC of drugs, with or without 50 μM suramin. Error bars represent the SD from four measurements. Statistical significance is calculated by student's t-test: **P < 0.01, ***P < 0.001. CFU counts of untreated (UT) and suramin-treated cultures in the absence of drugs (UT+Sur) are included to estimate the augmented effect of suramin on bactericidal activity of anti-TB drugs against control (B) and gyr(-) (C).
Discussion
Whilst FQ is clinically used as second-line anti-TB drug, its impact on the physiology of Mtb has never been evaluated. This is the first report to the best of our knowledge where we have successfully demonstrated the effects of DNA gyrase depletion including formation of drug-tolerant persisters in Mtb. In the wild-type cells replication of genomic DNA is dependent on supercoiling state at the site of replication fork. DNA gyrase facilitates the progression of replication fork by removing the positive supercoils without leaving nicks in the DNA molecule (Holmes and Cozzarelli, 2000; Aubry et al., 2006). However, due to depletion of DNA gyrase in the gyr(-), its genome undergoes massive de-condensation possibly by accumulation of negative supercoils (Figure 2A). Error in DNA replication process subsequently halts cell division leading to significant reduction in bacterial viability (Figures 2C,D). Interestingly, after sharp decline in bacterial CFU counts during the initial 4 days period, growth of gyrase depleted Mtb strain is resumed at later time points, albeit with a slower rate, which suggests the elicitation of DNA repair mechanism in the proportion of viable bacteria (Figures 1C,D). Homeostasis of negative and positive supercoils is also a key factor in tuning the genomic transcription (Dorman, 1991; Dorman and Corcoran, 2009). Global transcriptional profiling reveals significant induction of genes controlling bacterial DNA damage response including those involved in DNA repair in gyr(-) on day 4 of depletion (Supplementary Datasets 1, 2, and Figure 3). These results together with decondensed nucleoid suggest that silencing the gyrase expression in Mtb is possibly causing damage of DNA molecules which subsequently results in significant loss of viability, although a parallel repair mechanisms has also initiated in the bacterial subpopulation that are viable and transcriptionally active. A thorough analysis of differentially regulated genes further reveals the elicitation of RecA-LexA mediated SOS response in these bacterial population of gyr(-) (Figure 3). Importantly, many of the persister regulons, as reported earlier (Keren et al., 2011), are also found activated in gyr(-).
Arrested growth is presumed to be the prerequisite for the origin of persisters because these metabolically inferior population suffer limited damage from antibiotic treatment than their growing counterparts (Van den Bergh et al., 2017). Although, we find better survival of gyr(-) than control Mtb in the presence of antibiotics (Figures 4A–C), killing of a significant proportion of gyrase-depleted bacteria by drug treatment indicates the existence of heterogeneous population in gyr(-) comprising of drug-susceptible metabolically active cells as well as drug-tolerant metabolically inert persisters. It is intriguing how these two distinct population are intrinsically controlled in Mtb. Recently, it has been reported that survival of FQ-treated E. coli persisters is dependent on timing of DNA repair and resumption of DNA synthesis. Interestingly, it was observed that delayed onset of growth by carbon source starvation rescues almost 100% cells from killing by FQ treatment in a RecA-dependent manner (Mok and Brynildsen, 2018). These findings thus warrant future studies to gain a deeper insight into the mechanisms behind the formation of persisters in Mtb.
Persisters are characterized by their distinct respiratory status, differential accumulation of lipid granules and altered levels of metabolites (Garton et al., 2008; Allison et al., 2011; Orman and Brynildsen, 2013; Chuang et al., 2015; Lobritz et al., 2015; Sloan et al., 2015). Significant reduction in cellular ATP levels, abundance of lipid bodies and select metabolites such as nucleic acids, amino acids and coenzymes further support the presence of persisters in gyr(-) (Figures 4D–F). Remarkably, reduction in ATP despite accumulation of AMP further reiterates defect in cellular respiration of gyrase-depleted Mtb. Furthermore, accumulation of several nucleotides in gyr(-) could be a metabolic response of cells requiring translesion synthesis (Gon et al., 2011).
In E. coli, ciprofloxacin-induced persisters are formed in a SOS-dependent manner (Dörr et al., 2009). Since, RecA is the primary regulator of SOS response (Baharoglu and Mazel, 2014), we next determined the effect of RecA inhibition on the formation of persisters in Mtb. Since, simultaneous repression of recA and gyr in Mtb could not be achieved by CRISPRi, we used anti-filarial drug suramin, which targets RecA and blocks the elicitation of SOS response in bacteria (Wigle and Singleton, 2007; Nautiyal et al., 2014). Approximately 33% reduction in the formation of lipid bodies in suramin-treated gyr(-) and improved killing of Mtb by the anti-TB drugs in the presence of suramin provides an evidence for SOS-mediated induction of persisters in gyr(-) strain of Mtb (Figure 5). Remarkably, suramin alone does not exhibit antibacterial activity against control Mtb, whereas it inhibits growth of gyr(-) by ~two-fold. While the efficacy of Rif and INH is improved in the presence of suramin against both the control and gyr(-) strains, we find better effect under a condition when persisters are abundantly present (Figures 5B,C). Noteworthy to mention that we could not detect induction of RecA-LexA regulons by qRT-PCR in the control bacteria by Rif or INH treatment, which is possibly due to the abundance of drug-susceptible population, masking the effect produced by tiny proportion of drug-tolerant persisters under these conditions. Since suramin also exhibits inhibitory action against the purified DNA primase enzyme (DnaG) of M. smegmatis (Kuron et al., 2014), it is prudent to analyze the induction of persisters by knocking out the expression of recA gene in Mtb.
In summary, silencing the SOS-response by inhibiting RecA can be explored as an adjuvant strategy to potentiate the activity of the existing antimycobacterial agents and reduce the time course of TB treatment, which is one of the primary causes of accumulation of drug resistance in TB pathogens. Although both the avirulent and virulent strains of Mtb share a great deal of similarity, the absence of PhoPR regulons in Mtb H37Ra affect some of the key metabolic pathways such as lipid metabolism (Gonzalo Asensio et al., 2006), that could impact the bacterial response to gyrase depletion. Future studies are warranted to validate our findings in the virulent Mtb strain as well as systematically examine the effect of RecA inhibition on the efficacy of anti-TB drugs in vitro as well as in an animal infection model.
Author Contributions
This study was designed by NA and EC. NA, EC, RS, and YK conducted the experiments. NA and EC wrote the manuscript and analyzed data with critical inputs from RS and YK.
Funding
We acknowledge the core funding support to THSTI from Department of Biotechnology, Government of India.
Accession Codes
Gene expression data have been deposited in GEO database under the accession codes GSE120139.
Conflict of Interest Statement
The authors declare that the research was conducted in the absence of any commercial or financial relationships that could be construed as a potential conflict of interest.
Acknowledgments
We thank Dr. Dirk Schnappinger and Dr. Sabine Ehrt at Cornell University, USA for providing us the plasmid containing the promoter Pmyc1tetO and gene encoding tetracycline repressor TetR. We sincerely thank Dr. William Bishai at the Johns Hopkins University School of Medicine for providing us the M. tuberculosis strain. Dr. Deepak Rathore at THSTI is acknowledged for his assistance in FACS experiment. Dr. Ajitesh Lunge at THSTI is acknowledged for critically reading the manuscript.
Supplementary Material
The Supplementary Material for this article can be found online at: https://www.frontiersin.org/articles/10.3389/fcimb.2019.00070/full#supplementary-material
References
Allison, K. R., Brynildsen, M. P., and Collins, J. J. (2011). Metabolite-enabled eradication of bacterial persisters by aminoglycosides. Nature 473, 216–220. doi: 10.1038/nature10069
Aubry, A., Fisher, L. M., Jarlier, V., and Cambau, E. (2006). First functional characterization of a singly expressed bacterial type II topoisomerase: the enzyme from Mycobacterium tuberculosis. Biochem. Biophys. Res. Commun. 348, 158–165. doi: 10.1016/j.bbrc.2006.07.017
Baharoglu, Z., and Mazel, D. (2014). SOS, the formidable strategy of bacteria against aggressions. FEMS Microbiol. Rev. 38, 1126–1145. doi: 10.1111/1574-6976.12077
Betts, J. C., Lukey, P. T., Robb, L. C., McAdam, R. A., and Duncan, K. (2002). Evaluation of a nutrient starvation model of Mycobacterium tuberculosis persistence by gene and protein expression profiling. Mol. Microbiol. 43, 717–731. doi: 10.1046/j.1365-2958.2002.02779.x
Bhowmick, T., Ghosh, S., Dixit, K., Ganesan, V., Ramagopal, U. A., Dey, D., et al. (2014). Targeting Mycobacterium tuberculosis nucleoid-associated protein HU with structure-based inhibitors. Nat Commun. 5:4124. doi: 10.1038/ncomms5124
Boshoff, H. I., Reed, M. B., Barry, C. E. III., and Mizrahi, V. (2003). DnaE2 polymerase contributes to in vivo survival and the emergence of drug resistance in Mycobacterium tuberculosis. Cell 113, 183–193. doi: 10.1016/S0092-8674(03)00270-8
Brooks, P. C., Movahedzadeh, F., and Davis, E. O. (2001). Identification of some DNA damage-inducible genes of Mycobacterium tuberculosis: apparent lack of correlation with LexA binding. J. Bacteriol. 183, 4459–4467. doi: 10.1128/JB.183.15.4459-4467.2001
Cho, H. S., Lee, S. S., Kim, K. D., Hwang, I., Lim, J. S., Park, Y. I., et al. (2004). DNA gyrase is involved in chloroplast nucleoid partitioning. Plant Cell 16, 2665–2682. doi: 10.1105/tpc.104.024281
Choudhary, E., Thakur, P., Pareek, M., and Agarwal, N. (2015). Gene silencing by CRISPR interference in mycobacteria. Nat. Commun. 6:6267. doi: 10.1038/ncomms7267
Chuang, Y. M., Bandyopadhyay, N., Rifat, D., Rubin, H., Bader, J. S., and Karakousis, P. C. (2015). Deficiency of the novel exopolyphosphatase Rv1026/PPX2 leads to metabolic downshift and altered cell wall permeability in Mycobacterium tuberculosis. MBio 6:e02428. doi: 10.1128/mBio.02428-14
Cohen, N. R., Lobritz, M. A., and Collins, J. J. (2013). Microbial persistence and the road to drug resistance. Cell Host Microbe. 13, 632–642. doi: 10.1016/j.chom.2013.05.009
Davis, E. O., Dullaghan, E. M., and Rand, L. (2002). Definition of the mycobacterial SOS box and use to identify LexA-regulated genes in Mycobacterium tuberculosis. J. Bacteriol. 184, 3287–3295. doi: 10.1128/JB.184.12.3287-3295.2002
Deb, C., Lee, C. M., Dubey, V. S., Daniel, J., Abomoelak, B., Sirakova, T. D., et al. (2009). A novel in vitro multiple-stress dormancy model for Mycobacterium tuberculosis generates a lipid-loaded, drug-tolerant, dormant pathogen. PLoS ONE 4:e6077. doi: 10.1371/journal.pone.0006077
Dhar, N., and McKinney, J. D. (2010). Mycobacterium tuberculosis persistence mutants identified by screening in isoniazid-treated mice. Proc. Natl. Acad. Sci. U.S.A. 107, 12275–12280. doi: 10.1073/pnas.1003219107
Dorman, C. J. (1991). DNA supercoiling and environmental regulation of gene expression in pathogenic bacteria. Infect. Immun. 59, 745–749.
Dorman, C. J., and Corcoran, C. P. (2009). Bacterial DNA topology and infectious disease. Nucleic Acids Res. 37, 672–678. doi: 10.1093/nar/gkn996
Dörr, T., Lewis, K., and Vulic, M. (2009). SOS response induces persistence to fluoroquinolones in Escherichia coli. PLoS Genet. 5:e1000760. doi: 10.1371/journal.pgen.1000760
Durão, P., Balbontin, R., and Gordo, I. (2018). Evolutionary mechanisms shaping the maintenance of antibiotic resistance. Trends Microbiol. 26, 677–691. doi: 10.1016/j.tim.2018.01.005
Durbach, S. I., Andersen, S. J., and Mizrahi, V. (1997). SOS induction in mycobacteria: analysis of the DNA-binding activity of a LexA-like repressor and its role in DNA damage induction of the recA gene from Mycobacterium smegmatis. Mol. Microbiol. 26, 643–653. doi: 10.1046/j.1365-2958.1997.5731934.x
Dziadek, J., Rutherford, S. A., Madiraju, M. V., Atkinson, M. A., and Rajagopalan, M. (2003). Conditional expression of Mycobacterium smegmatis ftsZ, an essential cell division gene. Microbiology 149, 1593–1603. doi: 10.1099/mic.0.26023-0
Garton, N. J., Waddell, S. J., Sherratt, A. L., Lee, S. M., Smith, R. J., Senner, C., et al. (2008). Cytological and transcript analyses reveal fat and lazy persister-like bacilli in tuberculous sputum. PLoS Med. 5:e75. doi: 10.1371/journal.pmed.0050075
Gomez, J. E., and McKinney, J. D. (2004). M. tuberculosis persistence, latency, and drug tolerance. Tuberculosis 84, 29–44. doi: 10.1016/j.tube.2003.08.003
Gon, S., Napolitano, R., Rocha, W., Coulon, S., and Fuchs, R. P. (2011). Increase in dNTP pool size during the DNA damage response plays a key role in spontaneous and induced-mutagenesis in Escherichia coli. Proc. Natl. Acad. Sci. U.S.A. 108, 19311–19316. doi: 10.1073/pnas.1113664108
Gonzalo Asensio, J., Maia, C., Ferrer, N. L., Barilone, N., Laval, F., Soto, C. Y., et al. (2006). The virulence-associated two-component PhoP-PhoR system controls the biosynthesis of polyketide-derived lipids in Mycobacterium tuberculosis. J. Biol. Chem. 281, 1313–1316. doi: 10.1074/jbc.C500388200
Grassi, L., Di Luca, M., Maisetta, G., Rinaldi, A. C., Esin, S., Trampuz, A., et al. (2017). Generation of persister cells of Pseudomonas aeruginosa and Staphylococcus aureus by chemical treatment and evaluation of their susceptibility to membrane-targeting agents. Front Microbiol. 8:1917. doi: 10.3389/fmicb.2017.01917
Gupta, N., Duggal, S., Kumar, A., Saquib, N. M., and Rao, K. V. S. (2018). Concurrent interactome and metabolome analysis reveals role of AKT1 in central carbon metabolism. BMC Res Notes. 11:270. doi: 10.1186/s13104-018-3364-z
Hall, L., Jude, K. P., Clark, S. L., and Wengenack, N. L. (2011). Antimicrobial susceptibility testing of Mycobacterium tuberculosis complex for first and second line drugs by broth dilution in a microtiter plate format. J. Vis. Exp. 24:3094. doi: 10.3791/3094
Hammond, R. J., Baron, V. O., Oravcova, K., Lipworth, S., and Gillespie, S. H. (2015). Phenotypic resistance in mycobacteria: is it because I am old or fat that I resist you? J. Antimicrob. Chemother. 70, 2823–2827. doi: 10.1093/jac/dkv178
Hansen, S., Lewis, K., and Vulic, M. (2008). Role of global regulators and nucleotide metabolism in antibiotic tolerance in Escherichia coli. Antimicrob. Agents Chemother. 52, 2718–2726. doi: 10.1128/AAC.00144-08
Hobby, G. L., and Lenert, T. F. (1957). The in vitro action of antituberculous agents against multiplying and non-multiplying microbial cells. Am. Rev. Tuberc. 76, 1031–1048.
Hoffmann, H., Kohl, T. A., Hofmann-Thiel, S., Merker, M., Beckert, P., Jaton, K., et al. (2016). Delamanid and bedaquiline resistance in Mycobacterium tuberculosis ancestral Beijing genotype causing extensively drug-resistant tuberculosis in a tibetan refugee. Am. J. Respir. Crit. Care Med. 193, 337–340. doi: 10.1164/rccm.201502-0372LE
Holmes, V. F., and Cozzarelli, N. R. (2000). Closing the ring: links between SMC proteins and chromosome partitioning, condensation, and supercoiling. Proc. Natl. Acad. Sci. U.S.A. 97, 1322–1324. doi: 10.1073/pnas.040576797
Hu, Y., Mangan, J. A., Dhillon, J., Sole, K. M., Mitchison, D. A., Butcher, P. D., et al. (2000). Detection of mRNA transcripts and active transcription in persistent Mycobacterium tuberculosis induced by exposure to rifampin or pyrazinamide. J. Bacteriol. 182, 6358–6365. doi: 10.1128/JB.182.22.6358-6365.2000
Jain, S. K., Lamichhane, G., Nimmagadda, S., Pomper, M. G., and Bishai, W. R. (2008). Antibiotic treatment of tuberculosis: old problems, new solutions. Microbe 3, 285–292. doi: 10.1128/microbe.3.285.1
Joshi, J. M. (2011). Tuberculosis chemotherapy in the 21 century: back to the basics. Lung India 28, 193–200. doi: 10.4103/0970-2113.83977
Keren, I., Minami, S., Rubin, E., and Lewis, K. (2011). Characterization and transcriptome analysis of Mycobacterium tuberculosis persisters. MBio 2:e00100-11. doi: 10.1128/mBio.00100-11
Kuron, A., Korycka-Machala, M., Brzostek, A., Nowosielski, M., Doherty, A., Dziadek, B., et al. (2014). Evaluation of DNA primase DnaG as a potential target for antibiotics. Antimicrob Agents Chemother. 58, 1699–1706. doi: 10.1128/AAC.01721-13
Lobritz, M. A., Belenky, P., Porter, C. B., Gutierrez, A., Yang, J. H., Schwarz, E. G., et al. (2015). Antibiotic efficacy is linked to bacterial cellular respiration. Proc. Natl. Acad. Sci. U.S.A. 112, 8173–8180. doi: 10.1073/pnas.1509743112
Ma, J., and Wang, M. D. (2016). DNA supercoiling during transcription. Biophys. Rev. 8, 75–87. doi: 10.1007/s12551-016-0215-9
Misra, H. S., Maurya, G. K., Chaudhary, R., and Misra, C. S. (2018). Interdependence of bacterial cell division and genome segregation and its potential in drug development. Microbiol. Res. 208, 12–24. doi: 10.1016/j.micres.2017.12.013
Mok, W. W. K., and Brynildsen, M. P. (2018). Timing of DNA damage responses impacts persistence to fluoroquinolones. Proc. Natl. Acad. Sci. U.S.A. 115, E6301–E6309. doi: 10.1073/pnas.1804218115
Nautiyal, A., Patil, K. N., and Muniyappa, K. (2014). Suramin is a potent and selective inhibitor of Mycobacterium tuberculosis RecA protein and the SOS response: RecA as a potential target for antibacterial drug discovery. J. Antimicrob. Chemother. 69, 1834–1843. doi: 10.1093/jac/dku080
O'Neill, J. (2014). Review on antimicrobial resistance. antimicrobial resistance: tackling a crisis for the health and wealth of nations, 2014. Rev. Antimicrob. Resist. 4, 2–16. Available online at: https://amr-review.org/Publications.html
Orman, M. A., and Brynildsen, M. P. (2013). Establishment of a method to rapidly assay bacterial persister metabolism. Antimicrob. Agents Chemother. 57, 4398–4409. doi: 10.1128/AAC.00372-13
Sellick, C. A., Hansen, R., Stephens, G. M., Goodacre, R., and Dickson, A. J. (2011). Metabolite extraction from suspension-cultured mammalian cells for global metabolite profiling. Nat. Protoc. 6, 1241–1249. doi: 10.1038/nprot.2011.366
Shan, Y., Brown Gandt, A., Rowe, S. E., Deisinger, J. P., Conlon, B. P., and Lewis, K. (2017). ATP-dependent persister formation in Escherichia coli. MBio. 7:8. doi: 10.1128/mBio.02267-16
Sharma, D., Dhuriya, Y. K., Deo, N., and Bisht, D. (2017). Repurposing and revival of the drugs: a new approach to combat the drug resistant tuberculosis. Front. Microbiol. 8:2452. doi: 10.3389/fmicb.2017.02452
Sloan, D. J., Mwandumba, H. C., Garton, N. J., Khoo, S. H., Butterworth, A. E., Allain, T. J., et al. (2015). Pharmacodynamic modeling of bacillary elimination rates and detection of bacterial lipid bodies in sputum to predict and understand outcomes in treatment of pulmonary tuberculosis. Clin. Infect. Dis. 61, 1–8. doi: 10.1093/cid/civ195
Stewart, G. R., Robertson, B. D., and Young, D. B. (2003). Tuberculosis: a problem with persistence. Nat. Rev. Microbiol. 1, 97–105. doi: 10.1038/nrmicro749
Thakur, P., Gantasala, N. P., Choudhary, E., Singh, N., Abdin, M. Z., and Agarwal, N. (2016). The preprotein translocase YidC controls respiratory metabolism in Mycobacterium tuberculosis. Sci. Rep. 6:24998. doi: 10.1038/srep24998
Van den Bergh, B., Fauvart, M., and Michiels, J. (2017). Formation, physiology, ecology, evolution and clinical importance of bacterial persisters. FEMS Microbiol. Rev. 41, 219–251. doi: 10.1093/femsre/fux001
Wang, C. C. (1995). Molecular mechanisms and therapeutic approaches to the treatment of African trypanosomiasis. Annu. Rev. Pharmacol. Toxicol. 35, 93–127. doi: 10.1146/annurev.pa.35.040195.000521
Weiss, D. S. (2004). Bacterial cell division and the septal ring. Mol. Microbiol. 54, 588–597. doi: 10.1111/j.1365-2958.2004.04283.x
Wigle, T. J., and Singleton, S. F. (2007). Directed molecular screening for RecA ATPase inhibitors. Bioorg. Med. Chem. Lett. 17, 3249–3253. doi: 10.1016/j.bmcl.2007.04.013
Willenbrock, H., and Ussery, D. W. (2004). Chromatin architecture and gene expression in Escherichia coli. Genome Biol. 5:252. doi: 10.1186/gb-2004-5-12-252
Keywords: Mycobacterium tuberculosis, gyrase, DNA damage, SOS, persisters
Citation: Choudhary E, Sharma R, Kumar Y and Agarwal N (2019) Conditional Silencing by CRISPRi Reveals the Role of DNA Gyrase in Formation of Drug-Tolerant Persister Population in Mycobacterium tuberculosis. Front. Cell. Infect. Microbiol. 9:70. doi: 10.3389/fcimb.2019.00070
Received: 13 October 2018; Accepted: 04 March 2019;
Published: 26 March 2019.
Edited by:
Anthony Baughn, University of Minnesota Twin Cities, United StatesReviewed by:
Pallavi Ghosh, The State University of New York (SUNY), United StatesJessica Seeliger, Stony Brook University, United States
Copyright © 2019 Choudhary, Sharma, Kumar and Agarwal. This is an open-access article distributed under the terms of the Creative Commons Attribution License (CC BY). The use, distribution or reproduction in other forums is permitted, provided the original author(s) and the copyright owner(s) are credited and that the original publication in this journal is cited, in accordance with accepted academic practice. No use, distribution or reproduction is permitted which does not comply with these terms.
*Correspondence: Nisheeth Agarwal, bmlzaGVldGhAdGhzdGkucmVzLmlu