 Wenwen Wang1
 Hui Tang
 Ying Yu
 Qin Zhang
- 1Shandong Provincial Key Laboratory of Animal Biotechnology and Disease Control and Prevention, Shandong Agricultural University, Taian, China
- 2College of Animal Science and Technology, China Agricultural University, Beijing, China
Enterotoxigenic Escherichia coli (ETEC) that express F4 (K88) fimbriae are the principal microorganisms responsible for bacterial diarrhea in neonatal and pre-weaning piglets. To better understand the molecular effects of ETEC F4ab/ac infection, we performed a genome-wide comparison of the changes in DNA methylation and gene expression in ETEC F4ab/ac infected porcine intestinal epithelial cells. We characterized the pattern of changes in methylation and found 3297 and 1593 differentially methylated regions in cells infected with F4ab and F4ac, respectively. Moreover, 606 and 780 differentially expressed genes (DEGs) in ETEC F4ab and F4ac infected cells were detected and these genes were highly enriched in immune/defense response related pathways. Integrative analysis identified 27 and 10 genes showing inverse correlations between promoter methylation and expression with ETEC F4ab/ac infection. Altered DNA methylation and expression of various genes suggested their roles and potential functional interactions upon ETEC F4ab/ac infection. Further functional analyses revealed that three DEGs (S100A9, SGO1, and ESPL1) in F4ab infected cells and three DEGs (MAP3K21, PAK6, and MPZL1) in F4ac infected cells are likely involved in the host cells response to ETEC infection. Our data provides further insight into the epigenetic and transcriptomic alterations of ETEC F4ab/ac infected porcine intestinal epithelial cells, and may advance the identification of biomarkers and drug targets for predicting susceptibility to and controlling ETEC F4ab/ac induced diarrhea.
Introduction
Enterotoxigenic Escherichia coli (ETEC) with F4 (K88) fimbriae is the leading cause of diarrhea in neonatal and pre-weaning piglets, resulting in levels of illness and mortality that have become a major economic burden to the pig farming industry worldwide (Wang W. et al., 2019). Three variants of the F4 strain, F4ab, F4ac, and F4ad, can be distinguished serologically (Li et al., 2007). The “a” is a common antigenic factor, whereas “b”, “c”, and “d” represent specific epitopes (Sinha et al., 2019). The fimbriae of these three variants share similarities in their structures including the major subunit, FaeG, and several minor subunits (FaeF, FaeH, FaeC, probably FaeI, and FaeJ), all of which are controlled by a single gene cluster (Xia et al., 2015). Of these three variants, F4ab and F4ac are most commonly associated with ETEC-induced diarrhea (Nguyen et al., 2017). Comparative analysis of the sequences of the F4ab and F4ac genes revealed that the differences between these two serotypes are confined to the faeG gene, which differs in amino acid composition; different localizations of “b” and “c” epitope; and different specificities in attachment to receptors (Van den Broeck et al., 2000). Identifying control strategies for ETEC F4ab/ac-induced piglet diarrhea is highly important for promoting the development of swine industry worldwide.
DNA methylation is one of the central epigenetic modifications; in mammalian genomes it occurs mainly on cytosines at position C5 in CpG dinucleotides (Wang H. et al., 2019). DNA methylation is involved in numerous processes, such as genomic imprinting, transcriptional regulation, and tumorigenesis (Schuebeler, 2015), and it occurs in response to environmental factors, such as pathogen stimulation, drug treatment, pollutants, and disease, and it serves to regulate expression of the responsive genes (Kiga et al., 2014; Jiang et al., 2018; Swathy et al., 2018; Chen et al., 2019). Bacterial endotoxins have profound impacts on gene expression in intestinal epithelial cells through DNA methylation modifications. The expression of FUT1 (Dai et al., 2017) and FUT2 (Wu et al., 2018) are epigenetically modulated by DNA methylation of their promoters, regulating ETEC F18 resistance in weaned piglets. Systematic investigations on the global DNA methylation changes induced by ETEC F4ab/ac infection and the methylation pattern of responsive genes are still scant.
This study aimed to determine the distribution of methylation on the DNA in porcine small intestine epithelial cells infected by ETEC F4ab/ac and to analyze potential DNA methylation targets related to the host cells' response to infection. A subset of DNA methylation target genes that were strongly correlated with susceptibility of ETEC F4ab/ac infection in piglets were identified. Our results enhance the understanding of epigenetic changes in intestinal cells in response to ETEC F4ab/ac infection, and may contribute to the identification of biomarkers and drug targets for predicting susceptibility to and controlling ETEC F4ab/ac induced diarrhea.
Results
Genome-Wide Methylation Profiles in ETEC F4ab/ac Infected IPEC-J2 Cells
Whole genome DNA methylation of triplicate samples of IPEC-J2 cells infected with ETEC F4ab, F4ac, and uninfected, were analyzed to determine methylation profiles of ETEC infection. Using a sliding-window peak-finding algorithm provided by NimbleScan v2.6 (Roche-NimbleGen), a total of 46,940 methylated enrichment peaks (EPs) were identified from the nine samples, of which 14,805 (31.54%) were in the ETEC F4ab infected samples, 16,336 (34.80%) in the ETEC F4ac infected samples, and 15,799 (33.66%) in the uninfected control samples (Table S1). As shown in the methylation map (Figure 1), while most chromosomal regions were covered by methylated peaks, the methylation density in these regions were distinct among the chromosomes; chromosome 13 in particular, contained a relatively large unmethylated region.
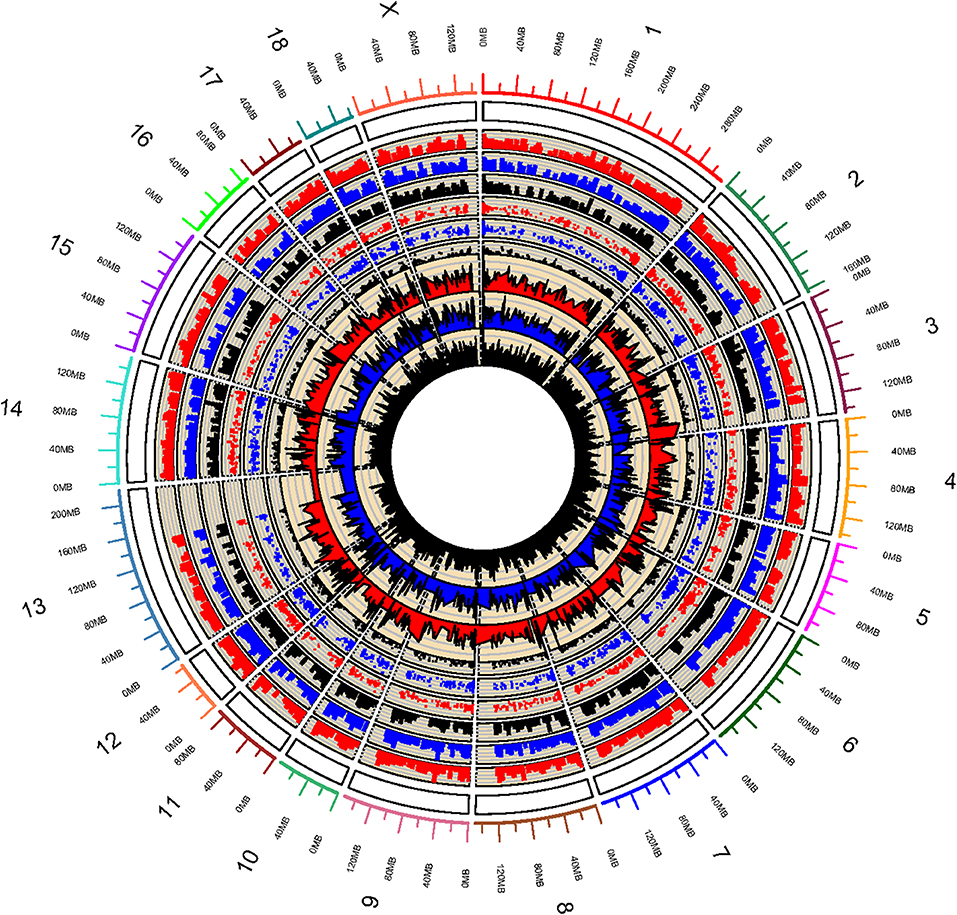
Figure 1. Global methylation pattern of IPEC-J2 cells infected with ETEC F4ab (the inner three tracks), ETEC F4ac (track 4, 5, 6 from inside to outside), and uninfected controls (track 7, 8, 9 from inside to outside). The numbers on the outermost track indicate the chromosome of the porcine genome.
Methylation Status in Genome CGIs of Infected and Uninfected IPEC-J2 Cells
In methylome studies, CpG islands (CGIs) are of particular interest because of their role in controlling gene expression (Jones, 2012). Therefore, we analyzed the methylation status of CGIs in the genome of the porcine intestinal epithelial cell line IPEC-J2 after infection with ETEC F4ab and F4ac. We grouped the CGIs into three classes according to their distance to the RefSeq genes: promoter CGIs [from about−10 kb to + 0.5 kb around the transcription start site (TSS)], intragenic CGIs [from + 0.5 kb around the TSS to the transcription terminal site (TTS)], and intergenic CGIs (those that do not fall into neither the promoter northe intragenic group) (Yu et al., 2014; Song et al., 2016; Figure 2A). The numbers of methylated EPs in the three classes of CGIs among the three groups of IPEC-J2 cells are shown in Figure 2B. Most of the methylated EPs were distributed in the intergenic and promoter CGIs for all three IPEC-J2 cell groups. It is worth mentioning that the ETEC F4ab-infected cells had relatively lower methylation levels in promoter CGIs than the uninfected or the ETEC F4ac-infected cells. The ETEC F4ac-infected cells had slightly higher methylation levels in promoter and intergenic CGIs than the uninfected or the ETEC F4ab-infected cells. In addition, the number of methylation EPs within intragenic CGIs in ETEC F4ab/ac-infected cells was higher than in uninfected cells.
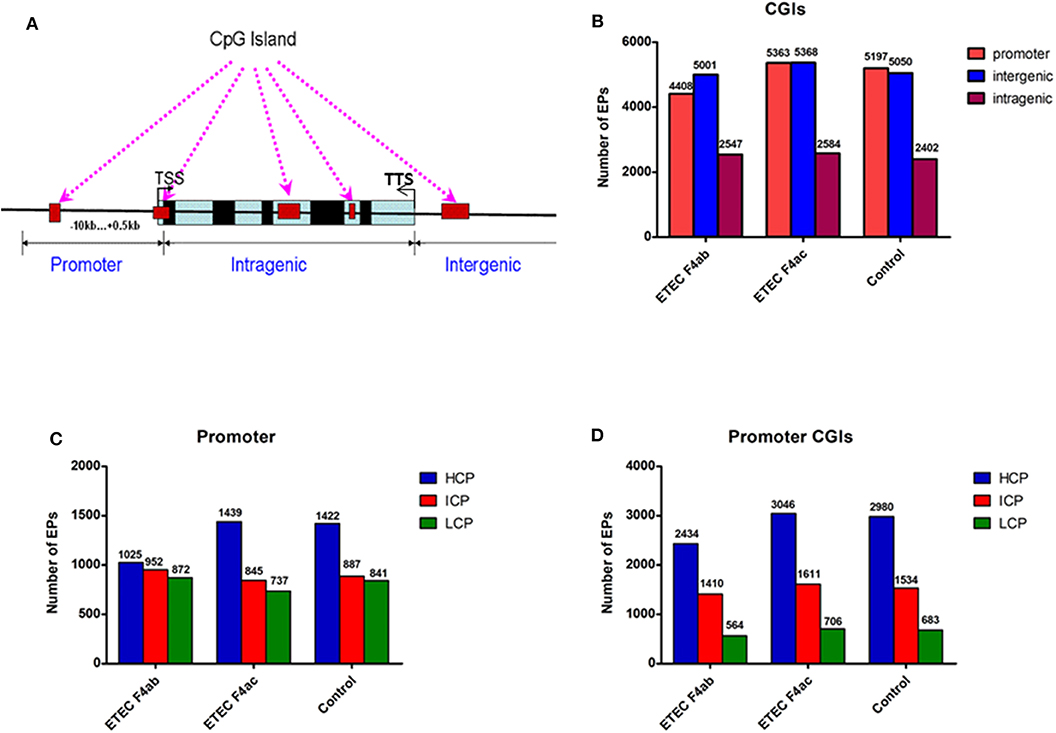
Figure 2. Distribution of DNA methylation enrichment peaks in IPEC-J2 cells infected with ETEC F4ab, ETEC F4ac, and uninfected. (A) Generic diagram showing CpG islands (CGIs) relative to gene transcript regions. TSS: transcriptional start site. (B) Number of methylation enrichment peaks (EPs) in each CGI region per experimental group. (C) Number of EPs in each type of promoter. HCP, high CpG density promoter; ICP, intermediate CpG density promoter; LCP, low CpG density promoter. (D) Number of EPs in the promoter CGIs.
Promoters are the main targets of DNA methylation modification, and the center to turn on or off gene expression (Wang X. et al., 2019). The key promoter region is defined as the −800 to +200 bp around the TSS. Based on the CpG ratio, GC content, and length CpG-rich region, we divided gene promoters into three types: high CpG density promoter (HCP), low CpG density promoter (LCP), and intermediate CpG density promoter (ICP) (Yu et al., 2014). We then analyzed the distribution of methylated EPs in the three types of the promoter (Figure 2C). We found that the number of methylated EPs was highest in the HCPs of all IPEC-J2 cell groups, followed by that in ICPs and LCPs. Additionally, in promoter CGIs, HCPs had more methylated EPs in all IPEC-J2 cell groups than ICPs or LCPs (Figure 2D). The activity of HCPs is negatively correlated with their DNA methylation status (Weber et al., 2007). We found that compared to the uninfected cells, the ETEC F4ab infected cells had fewer methylated EPs in HCPs, while the ETEC F4ac infected cells had slightly more methylated EPs in HCPs, this held true for promoter CGIs as well (Figures 2C,D).
To more finely map the pattern of DNA methylation, we divided each type of promoter (HCP, ICP, LCP) into distal (−800 to −200bp) and proximal regions (−200 to +200bp) relative to the TSS. Each region was then defined as methylated (indicated by “1”) or unmethylated (‘0'). Thus, each type of promoter was classified into three subtypes according to their methylation profile (Figure 3A) (Koga et al., 2009). For each type of promoter, the methylation profile and the number of methylated EPs for each IPEC-J2 cell group are graphed in Figures 3B–D. In general, the promoters were either highly distally methylated (“10” pattern) or highly proximally methylated (“01”), but not both (“11”). Infection with ETEC F4ab and F4ac resulted in heterogeneous methylation patterns. For all promoter types, ETEC F4ac infected cells were hypomethylated with ‘01' and “10” patterns compared to uninfected cells. ETEC F4ab infected cells were hypomethylated for the HCP type in all patterns (Figure 3B). For the ICP and LCP types, F4ab infected cells were hypermethylated in the “10” pattern and hypomethylated in the “01” pattern. In the “11” pattern, ICPs, in F4ab infected cells were hypermethylated, and for LCPs they were hypomethylated (Figures 3C,D).
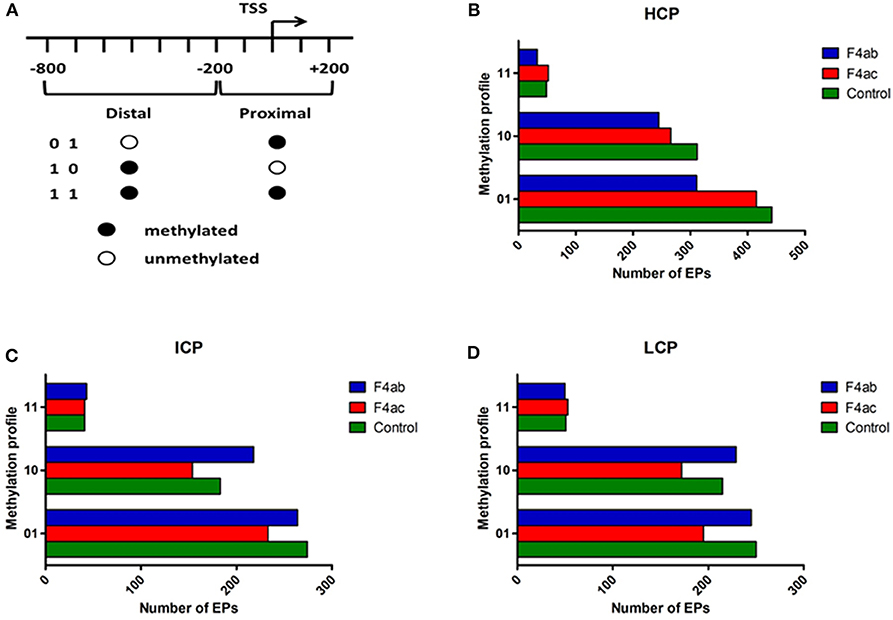
Figure 3. Distribution of different methylation patterns of promoter regions around the TSS in the three groups. (A) Schematic of the designated promoter regions and their methylation profiles. “0” denotes unmethylated and “1” methylated. The number of methylation peaks and the methylation profiles in (B) HCP, (C) ICP, and (D) LCP for each experimental group. 01: proximally methylated; 10: distally methylated; 11: fully methylated.
The DNA methylation changes and differences presumably reflect the ability of these pathogens to trigger epigenetic responses in cells involved in the immune system (Tarakhovsky, 2010).
Identification of Differentially Methylated Genes
To detect changes in the DNA methylome induced by ETEC F4ab/ac infection, we compared ETEC F4ab/ac infected and uninfected cells to identify differentially methylated regions (DMRs) in genomic DNA. 3297 DMRs were identified between ETEC F4ab infected and uninfected cells, of which 1261 were hypermethylated and 2036 hypomethylated in the infected cells (Table S2). 1593 DMRs were identified between ETEC F4ac infected and uninfected cells, of which 1140 were hypermethylated and 453 were hypomethylated in the infected cells (Table S3). The DNA methylation levels in the DMRs and the differences among the nine samples are shown by using a heatmap in Figure 4A. We subsequently mapped all DMRs to their nearest genomic features and found that DMRs were unevenly distributed across the genome. The majority of the DMRs were in the promoter regions in cells infected with ETEC F4ab or F4ac (Figure 4B), which constitute a large proportion in MeDIP-chip. To predict the potential functional significance of the identified DMRs, we analyzed the DMRs located in intragenic and promoter regions. The DMRs in the F4ab infected cells involve 2601 genes, of which, 2433 were differentially methylated only in promoters, 147 only in gene-bodies, and 21 in both promoters and gene-bodies (Table S4). Of the 2601 genes, 1043 were hypermethylated and 1558 hypomethylated. The DMRs in F4ac infected cells involve 1085 genes, of which, 991 were differentially methylated only in promoters, 91 only in gene-bodies, and 3 in both promoters and gene-bodies (Table S5). Of these 1085 genes, 752 were hypermethylated and 333 hypomethylated. Furthermore, 406 differentially methylated genes were common to both F4ab and F4ac infected cells. Of these, 187 were commonly hypermethylated and 167 commonly hypomethylated, and 52 hyper- or hypo-methylated in opposite directions in F4ab vs. F4ac infected cells (Figure 4C). Some of the identified genes involved in the immune system have been well-studied. For example, PUMA [Bbc3; p53 upregulated modulator of apoptosis (Okuda et al., 2017)] interacts with antiapoptotic Bcl-2 family members, leading to the formation of the free-type Bax and/or Bak, which are then able to signal apoptosis to the mitochondria (Yu and Zhang, 2008). RasGrf1 participates in the Ras signaling pathway (Manyes et al., 2014). JAK2 is in many ways the prototypical member of the JAK family, with an essential signaling role for cytokines and interferons involved in immunity and antiviral responses (Ferrao et al., 2018).
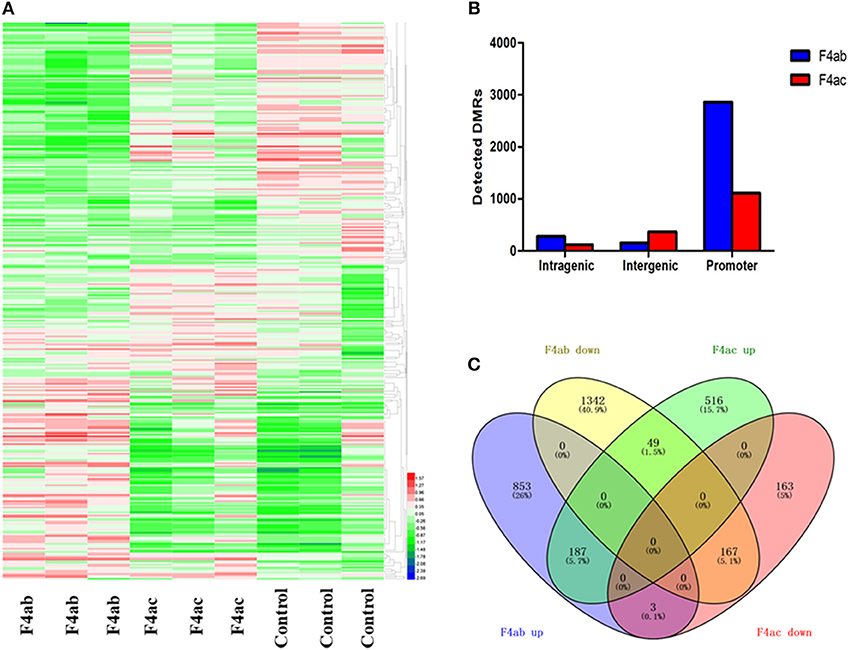
Figure 4. (A) Heatmap of differential methylation among the nine samples. F4ab: IPEC-J2 cells infected with F4ab ETEC; F4ac: IPEC-J2 cells infected with F4ac ETEC; Control: uninfected IPEC-J2 cells. (B) Distribution of DMRs. Genomic coordinates for these feature types were obtained from the UCSC pig reference genome. F4ab: DMRs between F4ab infected and uninfected cells; F4ac: DMRs between F4ac infected and uninfected cells. (C) Venn diagram showing the relationships among the differentially methylated genes identified. F4ab down/up: hypomethylated/hypermethylated genes between F4ab and uninfected cells; F4ac down/up: hypomethylated/hypermethylated genes between F4ac infected and uninfected cells.
Validation of MeDIP-Chip Data by Bisulfite Sequencing
To assess the accuracy of the MeDIP-chip results, the TLR5 gene was selected to validate promoter DNA methylation enrichment using bisulfite sequencing. The TLR5 gene was chosen because results from MeDIP-chip data indicated that it was methylated at low levels in untreated IPEC-J2 cells, moderately methylated in ETEC F4ac infected cells, and highly methylated in ETEC F4ab infected cells (Figure 5A). The results from bisulfite sequencing showed that TLR5 exhibited hypomethylated, moderate methylated, and hypermethylated enrichment in untreated IPEC-J2 cells, ETEC F4ac infected cells, and ETEC F4ab infected cells, respectively (Figure 5B), which are in good agreement with the results from the MeDIP-chip.
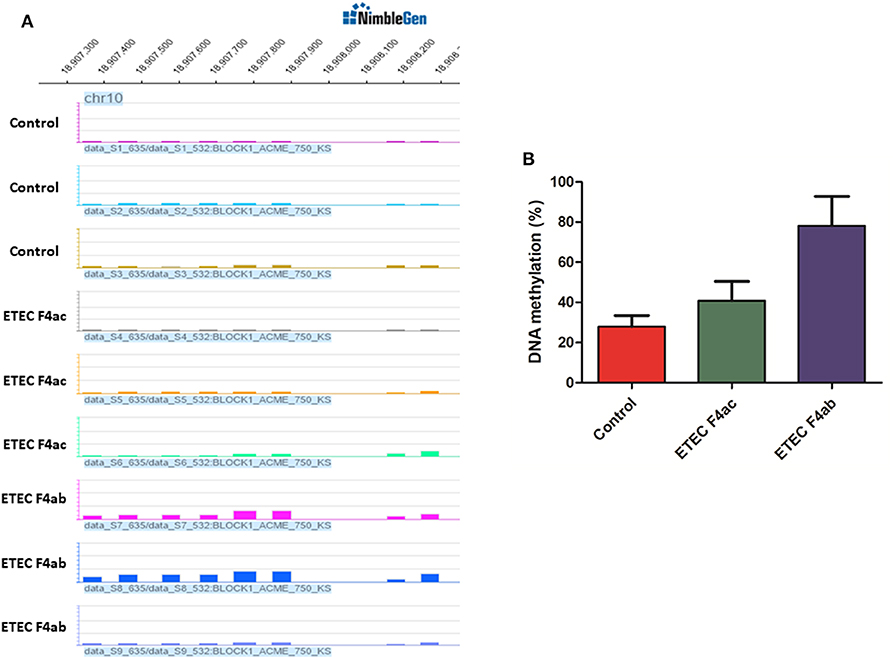
Figure 5. (A) Differentially methylated promoters of TLR5 gene in untreated IPEC-J2 cells, ETEC F4ac infected cells, and ETEC F4ab infected cells by MeDIP-chip. (B) Validation of promoter methylation status through bisulfite sequencing PCR.
Characterization of Transcriptomic Changes Induced by ETEC F4ab/ac Infection
We used an Agilent Porcine Oligo Microarray (4 × 44K) to analyze global gene expression in infected and uninfected cells. Genes were classified as differentially expressed if they exhibited |FC (fold-change)| > 1.5 with q < 0.05. In the ETEC F4ab infected cells we identified 606 genes that were significantly differentially expressed compared to the uninfected controls, 421 of these were up-regulated and 185 down-regulated (Table S6). In the ETEC F4ac infected cells, we identified 780 genes that were significantly differentially expressed compared to the uninfected controls, 524 of these were up-regulated and 256 down-regulated (Table S7). This genome-wide expression analysis provided a comprehensive portrait of the immune response, at the transcriptional level, of IPEC-J2 cells infected with ETEC F4ab/ac infection.
To investigate the biological significance of the differentially expressed genes, we performed functional annotation analysis by using a Bioconductor bioinformatics resource. The enriched GO terms could be roughly grouped into two clusters (Figure 6A). The first cluster is factor activity, such as receptor ligand activity, receptor regulator activity, cytokine activity, and chemokine activity. The second cluster centers on receptor binding, e.g., cytokine receptor binding, growth factor receptor binding, chemokine receptor binding, microtubule binding, fatty acid binding, double-stranded RNA binding, and cofactor binding. Since a key step in ETEC infection of pigs is its binding to receptor(s) on enterocytes (Roubos-van et al., 2017), the receptor binding related genes we identified are likely to be involved in this process. KEGG pathway analysis revealed that genes were significantly enriched in some immune/defense response-related pathways (Figure 6B), e.g., IL-17 signaling pathway, TNF signaling pathway and p53 signaling pathway, which indicate their roles in response to the cytotoxic effects of ETEC. Hub nodes have been found to play important roles in networks (He and Zhang, 2006), several hub pathways and associated genes were identified for ETEC F4ab and F4ac infection independently (Figure 7). The genes induced by F4ab and F4ac share most hub pathways, which is consistent with the similarity of the F4ab and F4ac fimbrial antigens. Both have the “a” epitopes formed by the conserved region of the major F4 fimbrial subunit FaeG (Verdonck et al., 2004).
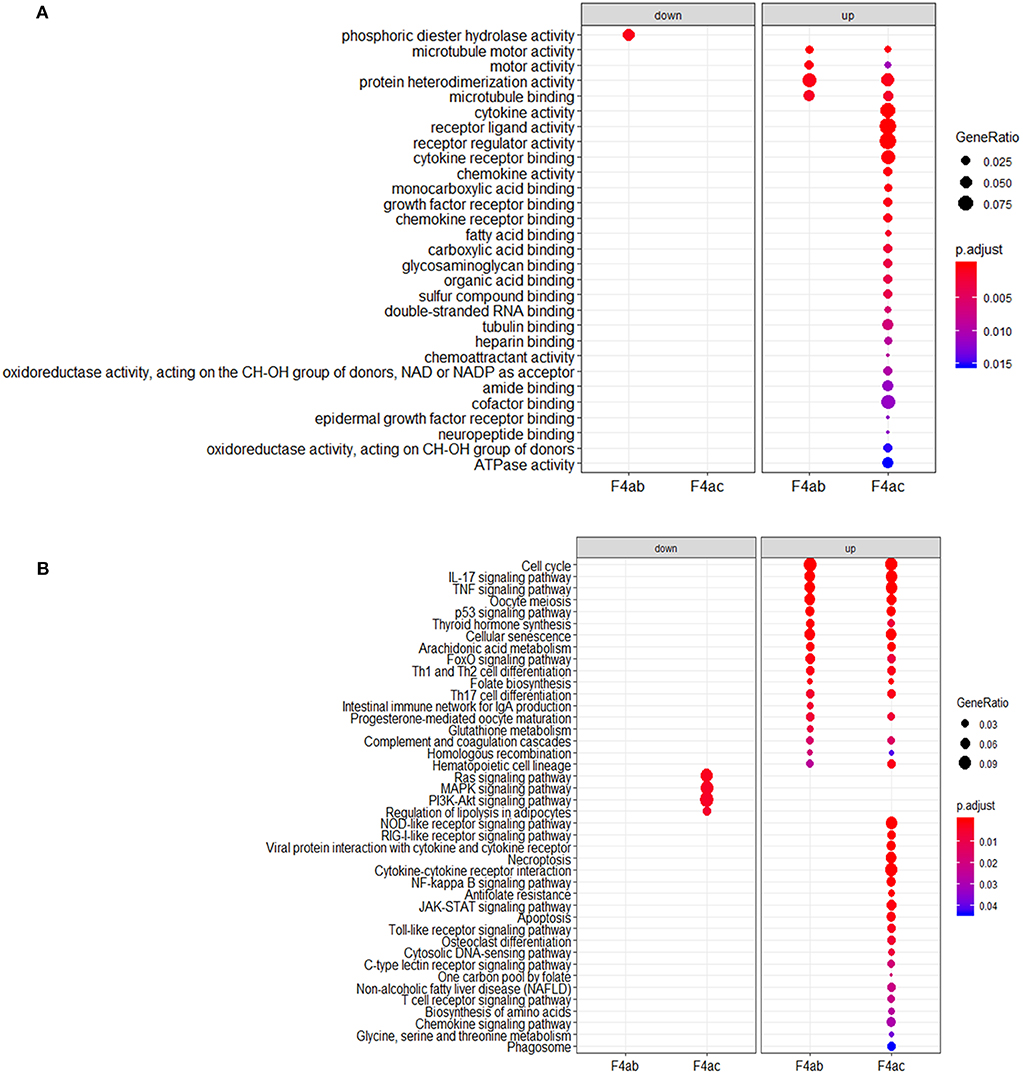
Figure 6. (A) Gene ontology and (B) KEGG pathway analyses of the differentially expressed genes in ETEC F4ab/ac infected cells vs. uninfected cells.
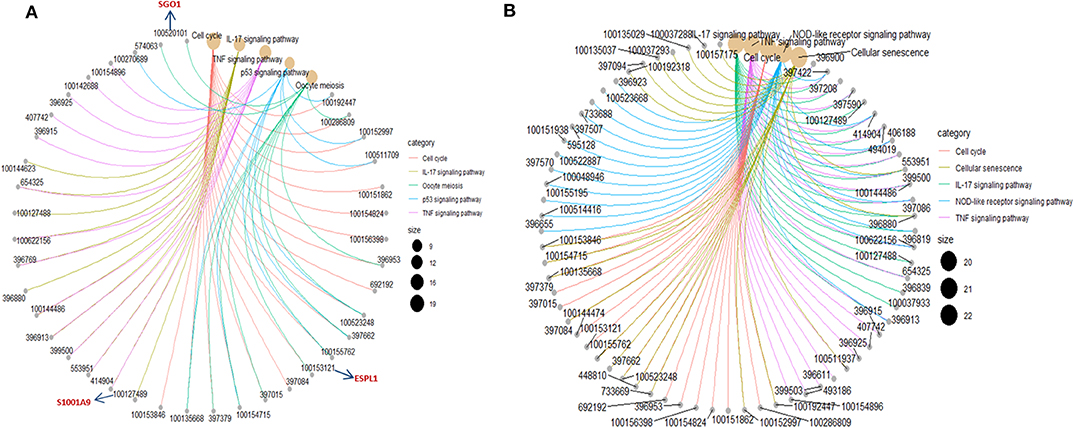
Figure 7. Hub pathways and associated genes in (A) ETEC F4ab and (B) ETEC F4ac infections.
Integrative Analysis of DNA Methylation and Gene Expression
DNA methylation occurring at gene promoters is usually involved in inhibiting the expression of the corresponding genes (Jones, 2012). By using integrative analyses of the DNA methylation profiles and gene expression profiles from IPEC-J2 cells infected with ETEC F4ab/ac vs. uninfected cells, we explored the relationship between methylation changes at the promoter regions and gene expression changes. The results showed that among the differentially methylated genes in cells infected with ETEC F4ab and F4ac, 27 and 10 were inversely expressed with regard to their methylation status, respectively (Tables 1, 2). Genes including S100A9, SGO1, and ESPL1, which are essential for cells' antiviral response, were all hypomethylated and up-regulated in cells infected with ETEC F4ab (Figure 8), these genes were also detected in hub pathways of our transcriptome analysis (Figure 7A). The methylation and expression of MAP3K21, PAK6, and MPZL1, which play roles in immune response and adhesion, were negative correlated in ETEC F4ac infected cells P < 0.05 (Figure 9). Thus, these genes could be powerful candidates methylation target genes related to susceptibility or resistance to ETEC F4ab/ac.
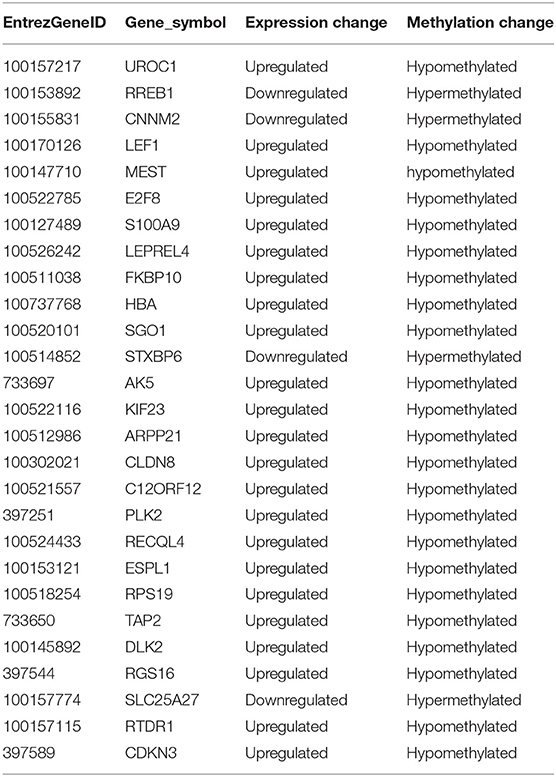
Table 1. List of differentially methylated and expressed genes in ETEC F4ab infected IPEC-J2 cells.
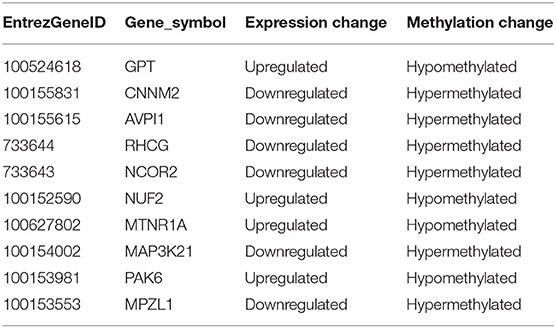
Table 2. List of differentially methylated and expressed genes in ETEC F4ac infected IPEC-J2 cells.
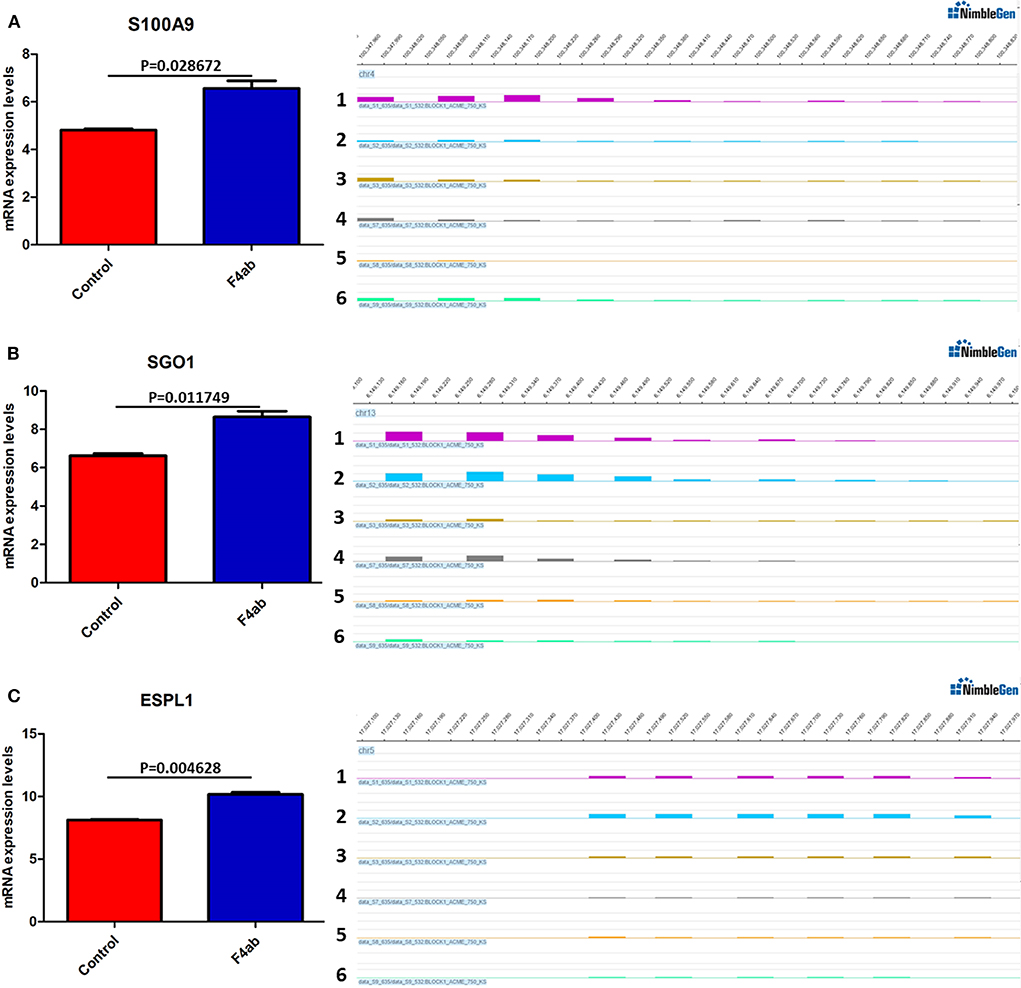
Figure 8. DNA methylation and expression of (A) S100A9, (B) SGO1, and (C) ESPL1 in ETEC F4ab infected cells. These genes were all up-regulated (left panel) and hypomethylated (right panel) compared to uninfected controls. Panels 1-3 and 4-6 indicate the differentially methylated peaks in control and F4ab infected cells by MeDIP-chip (SignalMap software, NimbleGen). P < 0.01 and P < 0.05 indicate highly significant difference and significant difference between uninfected and F4ab infected cells, respectively.
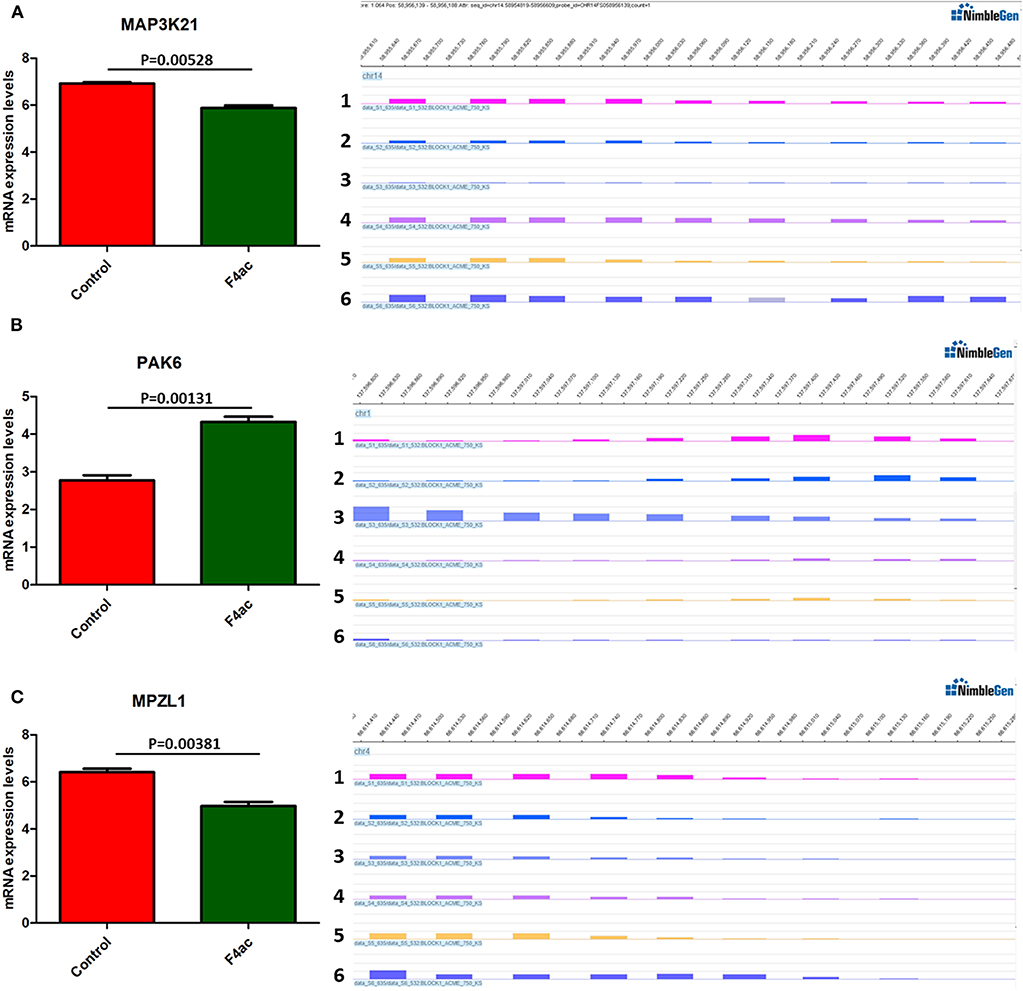
Figure 9. DNA methylation and expression of MAP3K21, PAK6, and MPZL1 in ETEC F4ac infected cells compared to uninfected cells. (A) MAP3K21 was down-regulated and hypermethylated. (B) PAK6 was up-regulated and hypomethylated. (C) MPZL1 was down-regulated and hypermethylated. Panels 1–3 and 4–6 indicate the differentially methylated peaks in control and F4ab infected cells by MeDIP-chip. P < 0.01 and P < 0.05 indicate highly significant difference and significant difference between uninfected and F4ab infected cells, respectively.
Discussion
From a genome-wide comparative methylome analysis, we revealed the epigenetic alterations in IPEC-J2 cells due to infection by ETEC F4ab/ac. We conducted an integrated analysis of MeDIP-chip and microarray data and identified a subset of genes that are implicated in the host response to ETEC F4ab/ac infection. However, these methods may only provide limited insights into the biological mechanisms of diarrhea induced by ETEC F4ab/ac. DNA, RNA, protein, and metabolite often have complementary roles to jointly perform a certain biological function. Such complementary effects and synergistic interactions between omics layers can only be captured by integrative study of multiple molecular layers (Sun and Hu, 2016). Therefore, multi-omics approaches that integrate data obtained from different omics levels (e.g., genetics, epigenetics, mRNA transcripts, proteins and metabolites) over the course of infection need to be conducted to understand their interrelation and combined influence on the host response to ETEC F4ab/ac infection. The IPEC-J2 DNA methylome profile provides an epigenetic overview of the physiological system in response to ETEC F4ab/ac infection in this study, and we expect it to constitute a set of resources for further epigenomic studies.
The host's gene expression programs especially those linked to host defense genes undergo massive changes during pathogenic infection (Boldrick et al., 2002). The epigenetic modulations such as DNA methylation can be manipulated by pathogens to influence the host's gene expression programs (Paschos and Allday, 2010). Among different kinds of epigenetic markers, DNA methylation is characterized as the most stable and easily accessible biomarker candidate. Our results provided evidences that ETEC F4ab/ac infection can trigger changes in DNA methylation and alter the expression of immune responses related genes (Tables 1, 2). In addition, other regulators such as transcription factors are also involved in the regulation of gene expression during pathogenic infection, which may in part account for the small number of common differentially methylated and expressed genes identified in our study.
Promoter methylation is directly related to transcriptional repression (Koga et al., 2009). We analyzed the methylation patterns in the promoter regions by using a porcine MeDIP-chip. In general, most chromosomal regions were covered by methylated peaks, while the methylation densities were distinct among the chromosomes. Chromosome 13 in particular, contained a relatively large unmethylated region at the end of chromosome (Figure 1), indicating that this region is highly conserved. We can't explain this phenomenon and this region need to be examined carefully in the future. The methylation levels of HCPs were higher than those of ICPs and LCPs in all IPEC-J2 cell groups (Figure 2C), which is consistent with the findings from other species (Huang et al., 2014; Su et al., 2014). The HCPs also have more methylated EPs in their promoter CGIs (Figure 2D). Koga et al. reported a stronger correlation between DNA methylation and gene repression in HCPs compared with ICPs and LCPs (Koga et al., 2009). These results suggest that promoter methylation may be correlated with pathogenic infection. Analysis of the differentially methylated genes in ETEC F4ab/ac infected cells revealed that among the 406 differentially methylated genes common to F4ab and F4ac infected cells, the majority had consistent methylation direction (Figure 4C), which is accordant with the similarity of the antigenic structures of the F4ab and F4ac fimbrial antigen (Verdonck et al., 2004). There was however a small minority of differentially methylated genes with opposite methylation direction (Figure 4C), illustrating the different methylation patterns induced by each F4 subtype.
The genes modified by differential DNA methylation merit greater attention. By integrating DNA methylation data and gene expression data, we identified 27 genes for which methylation of their promoters was inversely related to transcriptional repression in ETEC F4ab infected cells (Table 1). Among these genes, S100A9 participates in innate immunity and mediates the inflammatory response during infection-induced inflammation (Ometto et al., 2017). In addition, Wang et al. have reported that the S100A8/A9 recombinant attenuates bacterial adherence and invasion (Wang et al., 2018). Transfection of epithelial cells with S100A8/A9 expression vectors increases the cells resistance to invasion by Listeria and Salmonella (Zou et al., 2013). Purified S100A8/A9 has been shown to inhibit the growth of multiple species in vitro, including Escherichia coli, Candida albicans, S. aureus, K. pneumonia, Salmonella typhimurium, and Listeria monocytogenes (Wang et al., 2018). Also, it has been reported that the expression of S100A9 was actually controlled by the methylation status of its promoter (Chandra et al., 2018). SGO-1, a component of the cohesion complex, is involved in cell cycle progression, cell senescence, and activation of TGF-β signaling (Chetaille et al., 2014). Mice heterozygous for SGO-1 showed increased chromosome instability and susceptibility to tumors (Yamada et al., 2012), and mutations in human SGO-1 have been associated with gastric and colorectal cancers (Kim et al., 2013), as well as altered heart and gut rhythm (Chetaille et al., 2014). ESPL1, also known as separase, is an important regulator of the cell cycle and a potential oncogene (Kumar, 2017). For example, a homozygous mutant of ESPL1 leads to a high level of aneuploidy thus acting as a tumor suppressor (Shepard et al., 2007). In IPEC-J2 cells infected with ETEC F4ab, these genes were all hypomethylated and up-regulated (Figure 8). They were also all detected in hub pathways of transcriptome analysis (Figure 7A). Hub nodes play important roles in networks (He and Zhang, 2006). We speculate that these genes may be functionally linked and are regulated by methylation of their promoters in response to F4ab-induced effects.
We also identified 10 genes in ETEC F4ac infected cells that had an inverse relationship between promoter methylation and gene expression (Table 2). Among these genes, MAP3K21, PAK6, and MPZL1 (Figure 9) may be associated with the transcriptional repression of DNA methylation by blocking the binding of transcriptional activators or recruiting co-repressors (Klose and Bird, 2006). MAP3K21 is a negative regulator of TLR4 signaling (Seit-Nebi et al., 2012). Toll-like receptors (TLRs) are innate immune sensors, each responding to specific molecules of microbial origin (Janeway and Medzhitov, 2002; Akira and Takeda, 2004). Binding of pathogen-associated pattern molecules, such as lipopolysaccharides (LPS), to cell surface TLRs, results in recruitment of signaling adaptors (Hoebe et al., 2003; Yamamoto et al., 2003; Beutler, 2004; Biswas et al., 2007). MAP3K21 can suppress LPS-induced activation of the JNK or ERK pathways, but does not have an effect on LPS-induced p38 or NF-κB activation (Seit-Nebi et al., 2012). Therefore, the down-regulation and hypermethylation of MAP3K21 after ETEC F4ac infection may be to maintain balance of the inflammatory response. PAK6 is a member of the p21-activated kinases (PAKs) that have fundamental roles in cellular processes such as adhesion, motility, and survival, as well as in cancer progression (Field and Manser, 2012; King et al., 2014; Morse et al., 2016). MPZL1, also known as PZR, is a cell surface transmembrane glycoprotein belonging to the immunoglobulin family. It is comprised of an extracellular receptor domain and an intracellular domain with two immunoreceptor tyrosine-based inhibitory motifs (ITIMs) (Zhao and Zhao, 2003; Kusano et al., 2008). The phosphorylated ITIM motifs specifically bind to tyrosine phosphatase SHP-2, which plays an important role in cell growth factor signaling, and regulating basic cellular functions such as adhesion, proliferation, differentiation, transformation and migration (Billadeau and Leibson, 2002; Gibbins, 2002). Notably, MPZL1 is involved in the regulation of integrin-mediated cell motility (Zannettino et al., 2003), and ETEC F4ac receptor is a member of the integrin family (Wang W. et al., 2019). Considering the functions of these genes, we believe that MAP3K21, PAK6, and MPZL1are strongly correlated with diarrhea induced by ETEC F4ac infection. It is noteworthy that only one gene, CNNM2, was identified to be differentially methylated and expressed in both F4ab and F4ac infected cells (Tables 1, 2). CNNM2, which belongs to the Cyclin M family, is an essential gene for magnesium (Mg2+) homeostasis (de Baaij, 2015). Mg2+ is a vital cofactor for more than 600 enzymes, and plays an important role in anti-inflammatory and immunomodulatory (de Baaij et al., 2015). The changes in its promoter methylation and gene expression indicate that CNNM2 may participate in immune response to ETEC F4ab/ac stimulation.
In conclusion, we profiled the landscape of DNA methylation and gene expression in response to ETEC F4ab and F4ac infection by using a porcine intestinal epithelial cell line. Integrative analysis of the methylation and transcriptome data revealed a subset of genes implicated in the host response to ETEC F4ab/ac infection, and that the changes in expression of these genes may be driven by DNA methylation status. Thus, these genes are potential candidates for further research into the susceptibility or resistance to ETEC F4ab/ac. Our findings provide insight into the molecular effects of ETEC F4ab/ac infection and contribute to the continuing study of the epigenetic modifications resulting from ETEC F4ab/ac infection.
Materials and Methods
Cell and Bacterial Culture
IPEC-J2 cells were grown in Dulbecco's modified Eagle's medium (DMEM)/Ham's F-12 medium (1:1) (GIBCO, Invitrogen, Beijing) supplemented with 5% fetal calf serum (FCS, GIBCO, Carlsbad, CA, USA) and incubated in a humidified 5% CO2 atmosphere at 37°C. ETEC F4ab strain 195 (O8:K87:F4ab) and ETEC F4ac strain 200 (O149:K91:F4ac) were removed from cryo-storage and cultured in Ordinary Broth Agar at 37°C for three generations (24 h per generation). For cell infection experiments, strains were subcultured in LB medium and incubated with shaking (230 rpm) for 12 h at 37°C. Bacteria were collected by centrifuged and washed with sterile PBS (pH 7.4). Finally, the bacterial suspension was prepared with a final concentration of 1 × 10⁸ CFU/mL (Zhou et al., 2012).
Infection of IPEC-J2 Cells and Nucleic Acid Isolation
Dose and time of infection optimizations experiments were conducted as described in our previous study (Zhou et al., 2012). Briefly, monolayers of IPEC-J2 cells prepared in 24-well cell culture plates (Corning, Lowell, MA, USA) were washed twice with PBS, then covered with 0.5 mL of DMEM per well. Bacterial suspension was added to the medium of experimental wells (MOI = 10:1) and an equal volume of PBS was aliquoted to the control wells. Each experimental treatment was conducted in triplicate. The cells were incubated for 3 h at 37°C in a 5% CO2/air atmosphere (Vieira et al., 2010) then collected for nucleic acid isolation.
Genomic DNA and total RNA were exacted by using the Qiagen DNeasy Tissue kit (Qiagen, Hilden, Germany) and TRIzol reagent (Thermo Fisher Scientific, Waltham, U.S.A.) according to the manufacturer's guidelines. Concentrations of DNA and RNA were quantified with Qubit Fluorometer (Thermo Scientific, U.S.A.). Nucleic acid integrity was further analyzed by 1% agarose gel electrophoresis with an Agilent 2100 Bioanalyzer (Agilent Technologies, Santa Clara, CA, USA.). For RNA samples, only those with an RNA integrity number >7.0 were retained for subsequent analysis.
MeDIP-Chip
Genomic DNA from each sample was sonicated to produce random fragments 200 to 1000 bp in length. Methylated DNA was immunoprecipitated by using BioMagTM magnetic beads (Bangs Laboratories. Inc) coupled to mouse anti-5-methylcytidine monoclonal antibody (Diagenode). The immunoprecipitated DNA was eluted from the beads and purified by phenol/chloroform extraction and ethanol precipitation. The input DNA and the immunoprecipitated DNA were labeled with Cy3- and Cy5-fluorophere, respectively, and hybridized to an Arraystar Custom Pig CpG Promoter array. The CpG array covered all known CpG islands annotated by UCSC and all Ensembl gene promoter regions (~−800 to +200 bp from transcription start sites), which totally covered ~385,000 probes. Scanning was performed with an Axon GenePix 4000B microarray scanner, following the manufacturer's guidelines detailed in the NimbleGen MeDIP-Chip protocol (NimbleGen Systems Inc., Madison, USA).
Promoters and CGIs Classification
Promoter CGIs are defined as CGIs located in-−10 kb to + 0.5 kb around the TSS; intragenic CGIs are located in + 0.5 kb around the TSS to the TTS; the remaining CGIs are defined as intergenic CGIs. Key promoters are defined as the −800 to +200 bp regions around the TSS. The three categories of key promoters were determined as follows: HCP (high CpG density promoter) contains a 500bp interval with CpG/expected CpG above 0.6 and G+C content above 0.55; LCP (low CpG density promoter) do not contain a 500bp interval with CpG/expected CpG above 0.4; and ICP (intermediate CpG density promoter) is the remainders that do not fall into either HCP or LCP (Yu et al., 2014).
Data Normalization and Analysis of MeDIP-Chip Data
The enrichment intensity was determined for each probe that mapped to gene promoters and CGIs in the MeDIP DNA and input DNA samples. Comparisons were represented as log2 ratio value, where the ratio was defined as the fluorescence signal of MeDIP DNA/the fluorescence signal of input DNA. P-values were calculated to assess whether intensity differences were significant. To avoid technical variability and to evaluate methylation differences between samples, the log2-transformed ratios were subjected to median centering, quantile normalization, and linear smoothing by using the Bioconductor packages Ringo (Toedling et al., 2007), Limma (Ritchie et al., 2015), and MEDME (Pelizzola et al., 2008). The normalized chip data was then analyzed by using a sliding-window (750 bp) peak-finding algorithm provided by NimbleScan v2.6 (Roche-NimbleGen). A one-sided Kolmogorov-Smirnov (KS) test was applied to determine whether the probes were drawn from a significantly more positive distribution of intensity ratios than those from the rest of the array. Each probe was associated with a –log10[p-value] score from the windowed KS test. If several adjacent probes were significantly above a set threshold, the region was classified as an enrichment peak (EP). NimbleScan detects peaks by searching for at least 2 probes above a –log10[p-value] minimum cutoff of 2. Peaks within 500 bp of each other are merged. The differential probe-level ratio (log2[MeDIP/Input]) between treated and untreated cells was used to analyze the MeDIP hybridization to identify differentially methylated regions (DMRs) as follows: (1) log2[ratio treatment]-log2[ratio control] > 0.25; (2) log2[ratio control] < 0.4; (3) P-value determined for treatment vs control < 0.05.
Validation of MeDIP-Chip Data by Bisulfite Sequencing
Bisulfite sequencing PCR primers was designed by the online MethPrimer software (Li and Dahiya, 2002), which are listed in Table S8. Genomic DNA from the untreated IPEC-J2 cells, ETEC F4ac infected cells and ETEC F4ab infected cells were treated with bisulfite using the EZ DNA Methylation Kit (Zymo Research, D5006). Each experimental treatment was conducted in triplicate. PCR reactions were performed using the ZymoTaq™ PreMix (Zymo Research, E2004) following the manufacturer's protocols. The PCR products were then purified and cloned into the pMD19-T vector (TaKaRa biotechnology Co., Dalian, China). Ten positive clones for each subject were randomly selected for sequencing (Sangon, Shanhai, China). The final sequences were processed by the online software QUMA (Kumaki et al., 2008).
Hybridization of cDNA Microarray
Detailed cDNA microarray procedures are described in our previous work (Zhou et al., 2012). In brief, total RNA was extracted from nine samples (three ETEC F4ab infected cells, three ETEC F4ac infected cells and three control cells) with TRIzol reagent (Thermo Fisher Scientific, Waltham, U.S.A.). Total RNA was amplified and labeled by using a Low Input Quick Amp Labeling Kit, One-Color (Agilent Technologies, Santa Clara, CA, USA), following the manufacturer's instructions. The labeled cRNA was purified by using a RNeasy mini Kit (QIAGEN, GmBH, Germany), then hybridized to porcine oligo microarray slides (Agilent Technologies) containing 43,603 oligonucleotide probes. The hybridized microarray slides were scanned by using an Agilent Microarray Scanner (Agilent Technologies, Santa Clara, CA, USA). Raw data were normalized by using the quantile algorithm from Gene Spring Software 11.0 (Agilent Technologies, Santa Clara, CA, USA). Differentially expressed genes (DEGs) were defined as those with a fold change (|FC|) > 1.5 and P < 0.05.
Bioinformatics Analyses
Gene Ontology (GO) term analyses and Kyoto Encyclopedia of Genes and Genomes (KEGG) enrichment analyses for DEGs were performed by using the R package “clusterProfile” (Yu et al., 2012), with p-values calculated by using right-sided hypergeometric tests. To prevent a high false discovery rate (FDR) in multiple testing, q-values were also estimated for the FDR control (Storey, 2003). Figures were prepared by using the R package “ggplot2” (Wilkinson, 2011). RCircos (Krzywinski et al., 2009) was used to visualize the methylation maps of the nine samples.
Data Availability Statement
The datasets generated for this study can be found in the datasets (GSE143661) for this study have now been deposited in the NCBI GEO database (https://www.ncbi.nlm.nih.gov/geo/query/acc.cgi?acc=GSE143661).
Ethics Statement
The animal study was reviewed and approved by Institutional Animal Care and Use Ethics Committee of Shandong Agricultural University.
Author Contributions
QZ, WW, and YY conceived this study. WW and CZ performed the experiments. QZ, YY, WW, and HT performed the data analyses and wrote the manuscript. All authors reviewed and approved the final manuscript.
Funding
This research was supported by the National Natural Science Foundation of China (31702093 and 31572361), the China Postdoctoral Science Foundation (2019M652449), the National Major Special Project of China for the Cultivation of New Varieties of Transgenic Organisms (2014ZX0800945B), and the Shandong Double Tops Program (SYL2017YSTD12).
Conflict of Interest
The authors declare that the research was conducted in the absence of any commercial or financial relationships that could be construed as a potential conflict of interest.
Supplementary Material
The Supplementary Material for this article can be found online at: https://www.frontiersin.org/articles/10.3389/fcimb.2020.00250/full#supplementary-material
References
Akira, S., and Takeda, K. (2004). Toll-like receptor signalling. Nat. Rev. Immunol. 4, 499–511. doi: 10.1038/nri1391
Beutler, B. (2004). Inferences, questions and possibilities in toll-like receptor signalling. Nature 430, 257–263. doi: 10.1038/nature02761
Billadeau, D. D., and Leibson, P. J. (2002). ITAMs versus ITIMs: striking a balance during cell regulation. J. Clin. Invest. 109, 161–168. doi: 10.1172/JCI0214843
Biswas, S. K., Bist, P., Dhillon, M. K., Kajiji, T., Del, F. C., Yamamoto, M., et al. (2007). Role for MyD88-independent, TRIF pathway in lipid A/TLR4-induced endotoxin tolerance. J. Immunol. 179, 4083–4092. doi: 10.4049/jimmunol.179.6.4083
Boldrick, J. C., Alizadeh, A. A., Diehn, M., Dudoit, S., Liu, C. L., Belcher, C. E., et al. (2002). Stereotyped and specific gene expression programs in human innate immune responses to bacteria. Proc. Natl. Acad. Sci. U.S.A. 99, 972–977. doi: 10.1073/pnas.231625398
Chandra, A., Senapati, S., Roy, S., Chatterjee, G., and Chatterjee, R. (2018). Epigenome-wide DNA methylation regulates cardinal pathological features of psoriasis. Clin. Epigenetics 10:108. doi: 10.1186/s13148-018-0541-9
Chen, J., Wu, Y., Sun, Y., Dong, X., Wang, Z., Zhang, Z., et al. (2019). Bacterial lipopolysaccharide induced alterations of Genome-Wide DNA methylation and promoter methylation of lactation-related genes in bovine mammary epithelial cells. Toxins 11:298. doi: 10.3390/toxins11050298
Chetaille, P., Preuss, C., Burkhard, S., Cote, J. M., Houde, C., Castilloux, J., et al. (2014). Mutations in SGOL1 cause a novel cohesinopathy affecting heart and gut rhythm. Nat. Genet. 46, 1245–1249. doi: 10.1038/ng.3113
Dai, C., Sun, L., Xia, R., Sun, S., Zhu, G., Wu, S., et al. (2017). Correlation between the methylation of the FUT1 promoter region and FUT1 expression in the duodenum of piglets from newborn to weaning. 3 Biotech 7:247. doi: 10.1007/s13205-017-0880-9
de Baaij, J. H. (2015). The art of magnesium transport. Magnes. Res. 28, 85–91. doi: 10.1684/mrh.2015.0388
de Baaij, J. H., Hoenderop, J. G., and Bindels, R. J. (2015). Magnesium in man: Implications for health and disease. Physiol. Rev. 95, 1–46. doi: 10.1152/physrev.00012.2014
Ferrao, R. D., Wallweber, H. J., and Lupardus, P. J. (2018). Receptor-mediated dimerization of JAK2 FERM domains is required for JAK2 activation. Elife 7:e38089. doi: 10.7554/eLife.38089.022
Field, J., and Manser, E. (2012). The PAKs come of age: celebrating 18 years of discovery. Cell Logist 2, 54–58. doi: 10.4161/cl.22084
Gibbins, J. M. (2002). The negative regulation of platelet function: extending the role of the ITIM. Trends Cardiovasc. Med. 12, 213–219. doi: 10.1016/S1050-1738(02)00164-0
He, X., and Zhang, J. (2006). Why do hubs tend to be essential in protein networks? PLoS Genet. 2:e88. doi: 10.1371/journal.pgen.0020088
Hoebe, K., Du, X., Georgel, P., Janssen, E., Tabeta, K., Kim, S. O., et al. (2003). Identification of Lps2 as a key transducer of MyD88-independent TIR signalling. Nature 424, 743–748. doi: 10.1038/nature01889
Huang, Y. Z., Sun, J. J., Zhang, L. Z., Li, C. J., Womack, J. E., Li, Z. J., et al. (2014). Genome-wide DNA methylation profiles and their relationships with mRNA and the microRNA transcriptome in bovine muscle tissue (Bos taurine). Sci. Rep. 4:6546. doi: 10.1038/srep06546
Janeway, C. J., and Medzhitov, R. (2002). Innate immune recognition. Annu. Rev. Immunol. 20, 197–216. doi: 10.1146/annurev.immunol.20.083001.084359
Jiang, S., Yan, K., Sun, B., Gao, S., Yang, X., Ni, Y., et al. (2018). Long-term high-fat diet decreases hepatic iron storage associated with suppressing TFR2 and ZIP14 expression in rats. J. Agric. Food Chem. 66, 11612–11621. doi: 10.1021/acs.jafc.8b02974
Jones, P. A. (2012). Functions of DNA methylation: Islands, start sites, gene bodies and beyond. Nat. Rev. Genet. 13, 484–492. doi: 10.1038/nrg3230
Kiga, K., Mimuro, H., Suzuki, M., Shinozaki-Ushiku, A., Kobayashi, T., Sanada, T., et al. (2014). Epigenetic silencing of miR-210 increases the proliferation of gastric epithelium during chronic Helicobacter Pylori infection. Nat. Commun. 5:4497. doi: 10.1038/ncomms5497
Kim, M. S., An, C. H., Yoo, N. J., and Lee, S. H. (2013). Frameshift mutations of chromosome cohesion-related genes SGOL1 and PDS5B in gastric and colorectal cancers with high microsatellite instability. Hum. Pathol. 44, 2234–2240. doi: 10.1016/j.humpath.2013.04.017
King, H., Nicholas, N. S., and Wells, C. M. (2014). Role of p-21-activated kinases in cancer progression. Int. Rev. Cell Mol. Biol. 309, 347–387. doi: 10.1016/B978-0-12-800255-1.00007-7
Klose, R. J., and Bird, A. P. (2006). Genomic DNA methylation: the mark and its mediators. Trends Biochem. Sci. 31, 89–97. doi: 10.1016/j.tibs.2005.12.008
Koga, Y., Pelizzola, M., Cheng, E., Krauthammer, M., Sznol, M., Ariyan, S., et al. (2009). Genome-wide screen of promoter methylation identifies novel markers in melanoma. Genome Res. 19, 1462–1470. doi: 10.1101/gr.091447.109
Krzywinski, M., Schein, J., Birol, I., Connors, J., Gascoyne, R., Horsman, D., et al. (2009). Circos: an information aesthetic for comparative genomics. Genome Res. 19, 1639–1645. doi: 10.1101/gr.092759.109
Kumaki, Y., Oda, M., and Okano, M. (2008). QUMA: quantification tool for methylation analysis. Nucleic Acids Res. 36, W170–W175. doi: 10.1093/nar/gkn294
Kumar, R. (2017). Separase: function beyond cohesion cleavage and an emerging oncogene. J. Cell. Biochem. 118, 1283–1299. doi: 10.1002/jcb.25835
Kusano, K., Thomas, T. N., and Fujiwara, K. (2008). Phosphorylation and localization of protein-zero related (PZR) in cultured endothelial cells. Endothelium 15, 127–136. doi: 10.1080/10623320802125250
Li, L. C., and Dahiya, R. (2002). MethPrimer: designing primers for methylation PCRs. Bioinformatics 18, 1427–1431. doi: 10.1093/bioinformatics/18.11.1427
Li, Y., Qiu, X., Li, H., and Zhang, Q. (2007). Adhesive patterns of Escherichia Coli f4 in piglets of three breeds. J. Genet. Genomics 34, 591–599. doi: 10.1016/S1673-8527(07)60067-8
Manyes, L., Arribas, M., Gomez, C., Calzada, N., Fernandez-Medarde, A., and Santos, E. (2014). Transcriptional profiling reveals functional links between RasGrf1 and Pttg1 in pancreatic beta cells. BMC Genomics 15:1019. doi: 10.1186/1471-2164-15-1019
Morse, E. M., Sun, X., Olberding, J. R., Ha, B. H., Boggon, T. J., and Calderwood, D. A. (2016). PAK6 targets to cell-cell adhesions through its N-terminus in a Cdc42-dependent manner to drive epithelial colony escape. J. Cell Sci. 129, 380–393. doi: 10.1242/jcs.177493
Nguyen, U. V., Coddens, A., Melkebeek, V., Devriendt, B., Goetstouwers, T., Poucke, M. V., et al. (2017). High susceptibility prevalence for F4(+) and F18(+)Escherichia Coli in flemish pigs. Vet. Microbiol. 202, 52–57. doi: 10.1016/j.vetmic.2016.01.014
Okuda, A., Kurokawa, S., Takehashi, M., Maeda, A., Fukuda, K., Kubo, Y., et al. (2017). Poly(ADP-ribose) polymerase inhibitors activate the p53 signaling pathway in neural stem/progenitor cells. BMC Neurosci. 18:14. doi: 10.1186/s12868-016-0333-0
Ometto, F., Friso, L., Astorri, D., Botsios, C., Raffeiner, B., Punzi, L., et al. (2017). Calprotectin in rheumatic diseases. Exp. Biol. Med. 242, 859–873. doi: 10.1177/1535370216681551
Paschos, K., and Allday, M. J. (2010). Epigenetic reprogramming of host genes in viral and microbial pathogenesis. Trends Microbiol. 18, 439–447. doi: 10.1016/j.tim.2010.07.003
Pelizzola, M., Koga, Y., Urban, A. E., Krauthammer, M., Weissman, S., Halaban, R., et al. (2008). MEDME: an experimental and analytical methodology for the estimation of DNA methylation levels based on microarray derived MeDIP-enrichment. Genome Res. 18, 1652–1659. doi: 10.1101/gr.080721.108
Ritchie, M. E., Phipson, B., Wu, D., Hu, Y., Law, C. W., Shi, W., et al. (2015). Limma powers differential expression analyses for RNA-sequencing and microarray studies. Nucleic Acids Res. 43:e47. doi: 10.1093/nar/gkv007
Roubos-van, D. H. P., Litjens, R., Oudshoorn, A. K., Resink, J. W., and Smits, C. (2017). New perspectives to the enterotoxigenic E. Coli F4 porcine infection model: Susceptibility genotypes in relation to performance, diarrhoea and bacterial shedding. Vet Microbiol. 202, 58–63. doi: 10.1016/j.vetmic.2016.09.008
Schuebeler, D. (2015). Function and information content of DNA methylation. Nature 517, 321–326. doi: 10.1038/nature14192
Seit-Nebi, A., Cheng, W., Xu, H., and Han, J. (2012). MLK4 has negative effect on TLR4 signaling. Cell Mol. Immunol. 9, 27–33. doi: 10.1038/cmi.2011.15
Shepard, J. L., Amatruda, J. F., Finkelstein, D., Ziai, J., Finley, K. R., Stern, H. M., et al. (2007). A mutation in separase causes genome instability and increased susceptibility to epithelial cancer. Genes Dev. 21, 55–59. doi: 10.1101/gad.1470407
Sinha, R., Sahoo, N. R., Shrivastava, K., Kumar, P., Qureshi, S., De, U. K., et al. (2019). Resistance to ETEC F4/F18-mediated piglet diarrhoea: opening the gene black box. Trop. Anim. Health Prod. 51, 1307–1320. doi: 10.1007/s11250-019-01934-x
Song, M., He, Y., Zhou, H., Zhang, Y., Li, X., and Yu, Y. (2016). Combined analysis of DNA methylome and transcriptome reveal novel candidate genes with susceptibility to bovine Staphylococcus Aureus subclinical mastitis. Sci. Rep. 6:29390. doi: 10.1038/srep29390
Storey, J. D. (2003). The positive false discovery rate: a bayesian interpretation and the q-value. Ann. Stat. 31, 2013–2035. doi: 10.1214/aos/1074290335
Su, J., Wang, Y., Xing, X., Liu, J., and Zhang, Y. (2014). Genome-wide analysis of DNA methylation in bovine placentas. BMC Genomics 15:12. doi: 10.1186/1471-2164-15-12
Sun, Y. V., and Hu, Y. J. (2016). Integrative analysis of multi-omics data for discovery and functional studies of complex human diseases. Adv. Genet. 93, 147–190. doi: 10.1016/bs.adgen.2015.11.004
Swathy, B., Saradalekshmi, K. R., Nair, I. V., Nair, C., and Banerjee, M. (2018). Understanding the influence of antipsychotic drugs on global methylation events and its relevance in treatment response. Epigenomics 10, 233–247. doi: 10.2217/epi-2017-0086
Tarakhovsky, A. (2010). Tools and landscapes of epigenetics. Nat. Immunol. 11, 565–568. doi: 10.1038/ni0710-565
Toedling, J., Skylar, O., Krueger, T., Fischer, J. J., Sperling, S., and Huber, W. (2007). Ringo–an R/Bioconductor package for analyzing ChIP-chip readouts. BMC Bioinformatics 8:221. doi: 10.1186/1471-2105-8-221
Van den Broeck, W., Cox, E., Oudega, B., and Goddeeris, B. M. (2000). The F4 fimbrial antigen of Escherichia Coli and its receptors. Vet. Microbiol. 71, 223–244. doi: 10.1016/S0378-1135(99)00174-1
Verdonck, F., Cox, E., Vancaeneghem, S., and Goddeeris, B. M. (2004). The interaction of F4 fimbriae with porcine enterocytes as analysed by surface plasmon resonance. FEMS Immunol. Med. Microbiol. 41, 243–248. doi: 10.1016/j.femsim.2004.03.009
Vieira, M. A., Gomes, T. A., Ferreira, A. J., Knobl, T., Servin, A. L., and Lievin-Le, M. V. (2010). Two atypical enteropathogenic Escherichia Coli strains induce the production of secreted and membrane-bound mucins to benefit their own growth at the apical surface of human mucin-secreting intestinal HT29-MTX cells. Infect. Immun. 78, 927–938. doi: 10.1128/IAI.01115-09
Wang, H., Zong, Q., Wang, S., Zhao, C., Wu, S., and Bao, W. (2019). Genome-Wide DNA methylome and transcriptome analysis of porcine intestinal epithelial cells upon deoxynivalenol exposure. J. Agric. Food Chem. 67, 6423–6431. doi: 10.1021/acs.jafc.9b00613
Wang, S., Song, R., Wang, Z., Jing, Z., Wang, S., and Ma, J. (2018). S100A8/A9 in inflammation. Front. Immunol. 9:1298. doi: 10.3389/fimmu.2018.01298
Wang, W., Liu, Y., Tang, H., Yu, Y., and Zhang, Q. (2019). ITGB5 plays a key role in Escherichia Coli F4ac-Induced diarrhea in piglets. Front. Immunol. 10:2834. doi: 10.3389/fimmu.2019.02834
Wang, X., Ao, H., Song, M., Bai, L., He, W., Wang, C., et al. (2019). Identification of DNA methylation regulated novel host genes relevant to inhibition of virus replication in porcine PK15 cell using double stranded RNA mimics and DNA methyltransferase inhibitor. Genomics 111, 1464–1473. doi: 10.1016/j.ygeno.2018.09.020
Weber, M., Hellmann, I., Stadler, M. B., Ramos, L., Paabo, S., Rebhan, M., et al. (2007). Distribution, silencing potential and evolutionary impact of promoter DNA methylation in the human genome. Nat. Genet. 39, 457–466. doi: 10.1038/ng1990
Wilkinson, L. (2011). Ggplot2: elegant graphics for data analysis by H. Wickham. Biometrics 67, 678–679. doi: 10.1111/j.1541-0420.2011.01616.x
Wu, Z., Feng, H., Cao, Y., Huang, Y., Dai, C., Wu, S., et al. (2018). New insight into the molecular mechanism of the FUT2 regulating Escherichia Coli F18 resistance in weaned piglets. Int. J. Mol. Sci. 19:3301. doi: 10.3390/ijms19113301
Xia, P., Zou, Y., Wang, Y., Song, Y., Liu, W., Francis, D. H., et al. (2015). Receptor for the F4 fimbriae of enterotoxigenic Escherichia Coli (ETEC). Appl. Microbiol. Biotechnol. 99, 4953–4959. doi: 10.1007/s00253-015-6643-9
Yamada, H. Y., Yao, Y., Wang, X., Zhang, Y., Huang, Y., Dai, W., et al. (2012). Haploinsufficiency of SGO1 results in deregulated centrosome dynamics, enhanced chromosomal instability and colon tumorigenesis. Cell Cycle 11, 479–488. doi: 10.4161/cc.11.3.18994
Yamamoto, M., Sato, S., Hemmi, H., Hoshino, K., Kaisho, T., Sanjo, H., et al. (2003). Role of adaptor TRIF in the MyD88-independent toll-like receptor signaling pathway. Science 301, 640–643. doi: 10.1126/science.1087262
Yu, G., Wang, L. G., Han, Y., and He, Q. Y. (2012). ClusterProfiler: an R package for comparing biological themes among gene clusters. OMICS 16, 284–287. doi: 10.1089/omi.2011.0118
Yu, J., and Zhang, L. (2008). PUMA, a potent killer with or without p53. Oncogene 27(Suppl. 1), S71–S83. doi: 10.1038/onc.2009.45
Yu, M., Li, W., Luo, S., Zhang, Y., Liu, H., Gao, Y., et al. (2014). Folic acid stimulation of neural stem cell proliferation is associated with altered methylation profile of PI3K/Akt/CREB. J. Nutr. Biochem. 25, 496–502. doi: 10.1016/j.jnutbio.2013.12.010
Zannettino, A. C., Roubelakis, M., Welldon, K. J., Jackson, D. E., Simmons, P. J., Bendall, L. J., et al. (2003). Novel mesenchymal and haematopoietic cell isoforms of the SHP-2 docking receptor, PZR: identification, molecular cloning and effects on cell migration. Biochem. J. 370, 537–549. doi: 10.1042/bj20020935
Zhao, R., and Zhao, Z. J. (2003). Identification of a variant form of PZR lacking immunoreceptor tyrosine-based inhibitory motifs. Biochem. Biophys. Res. Commun. 303, 1028–1033. doi: 10.1016/S0006-291X(03)00484-4
Zhou, C., Liu, Z., Jiang, J., Yu, Y., and Zhang, Q. (2012). Differential gene expression profiling of porcine epithelial cells infected with three enterotoxigenic Escherichia Coli strains. BMC Genomics 13:330. doi: 10.1186/1471-2164-13-330
Keywords: DNA methylome, transcriptome, enterotoxigenic Escherichia coli, diarrhea, pig
Citation: Wang W, Zhou C, Tang H, Yu Y and Zhang Q (2020) Combined Analysis of DNA Methylome and Transcriptome Reveal Novel Candidate Genes Related to Porcine Escherichia coli F4ab/ac-Induced Diarrhea. Front. Cell. Infect. Microbiol. 10:250. doi: 10.3389/fcimb.2020.00250
Received: 19 December 2019; Accepted: 29 April 2020;
Published: 29 May 2020.
Edited by:
Jonathan Shaw, University of Sheffield, United KingdomReviewed by:
Graciela Castro Escarpulli, National Polytechnic Institute, MexicoJoby Cole, University of Sheffield, United Kingdom
Copyright © 2020 Wang, Zhou, Tang, Yu and Zhang. This is an open-access article distributed under the terms of the Creative Commons Attribution License (CC BY). The use, distribution or reproduction in other forums is permitted, provided the original author(s) and the copyright owner(s) are credited and that the original publication in this journal is cited, in accordance with accepted academic practice. No use, distribution or reproduction is permitted which does not comply with these terms.
*Correspondence: Ying Yu, eXV5aW5nQGNhdS5lZHUuY24=; Qin Zhang, cXpoYW5nQGNhdS5lZHUuY24=