 Jessica A. Grembi
 Koshlan Mayer-Blackwell
 Stephen P. Luby2
 Alfred M. Spormann
- 1Department of Civil and Environmental Engineering, Stanford University, Stanford, CA, United States
- 2Division of Infectious Diseases and Geographic Medicine, Stanford University, Stanford, CA, United States
- 3Department of Chemical Engineering, Stanford University, Stanford, CA, United States
Quantitative molecular diagnostic methods can effectively detect pathogen-specific nucleic acid sequences, but costs associated with multi-pathogen panels hinder their widespread use in research trials. Nano-liter qPCR (nL-qPCR) is a miniaturized tool for quantification of multiple targets in large numbers of samples based on assay parallelization on a single chip, with potentially significant cost-savings due to rapid throughput and reduced reagent volumes. We evaluated a suite of novel and published assays to detect 17 enteric pathogens using a commercially available nL-qPCR technology. Amplification efficiencies ranged from 88 to 98% (mean 91%) and were reproducible across four operators at two separate facilities. When applied to fecal material, assays were sensitive and selective (99.8% of DNA amplified were genes from the target organism). Due to nanofluidic volumes, detection limits were 1–2 orders of magnitude less sensitive for nL-qPCR than an enteric TaqMan Array Card (TAC). However, higher detection limits do not hinder detection of diarrhea-causing pathogen concentrations. Compared to TAC, nL-qPCR displayed 99% (95% CI 0.98, 0.99) negative percent agreement and 62% (95% CI 0.59, 0.65) overall positive percent agreement for presence of pathogens across diarrheal and non-diarrheal fecal samples. Positive percent agreement was 89% among samples with concentrations above the nL-qPCR detection limits. nL-qPCR assays showed an underestimation bias of 0.34 log10 copies/gram of stool [IQR −0.40, −0.28] compared with TAC. With 12 times higher throughput for a sixth of the per-sample cost of the enteric TAC, the nL-qPCR chip is a viable alternative for enteropathogen quantification for studies where other technologies are cost-prohibitive.
Introduction
Quantitative molecular diagnostic methods, such as quantitative polymerase chain reaction (qPCR), can target nucleic acid gene sequences specific to known microbial pathogens. These methods have provided insights in the study of diarrheal disease beyond what can be gained using microbiological cell culture or immunoassays (van den Berg et al., 2007; Liu et al., 2016b; Platts-Mills et al., 2018) and have been applied successfully in the field of pathogen detection for decades (Wood et al., 1994; Lin et al., 2000; He et al., 2002). Over time, molecular diagnostics were developed from single-gene qPCR assays to multiplex reactions (Soumet et al., 1999; Taniuchi et al., 2011; Mondal et al., 2012) and to multi-assay, multi-sample arrays that can be operated in parallel on a single chip or card (Liu et al., 2013, 2016a; Huang et al., 2016; Wongboot et al., 2018). Specifically in the field of enteric pathogen detection, a TaqMan Array Card (TAC) was developed by Liu et al. (2013, 2016a) and subsequently used in several studies to estimate pathogen-attributable diarrhea burdens (Platts-Mills et al., 2014, 2018; Liu et al., 2016b), as well as the impact of enteric pathogens on child growth (Platts-Mills et al., 2017; Rogawski et al., 2018; Schnee et al., 2018) and vaccine uptake (Grassly et al., 2016; Taniuchi et al., 2016). However, despite advances in the throughput of molecular detection of pathogens, costs associated with broad multi-target molecular assays still pose a barrier to their widespread use in epidemiological research studies. For instance, the per-sample cost of the enteric TAC is $60, not including labor, capital equipment, or DNA extraction reagents (Liu et al., 2013).
Compared with TAC, higher-throughput microfluidic qPCR technologies hold potential to decrease per sample costs of multi-target diagnostics and reduce instrument backlogs for large research studies. In the case of nano-liter (nL) qPCR, precision robotic dispensing permits smaller reaction volumes, increases throughput, and reduces reagent volumes. While nL-qPCR technologies have been previously applied to pathogen detection, early efforts to develop nL-qPCR pathogen chips were limited by factors such as: (i) high limits of detection associated with small reaction volumes (6–33 nL), (ii) insufficient information provided to evaluate quantitative assay validation, and (iii) relatively low sample throughput per chip (12–48 samples; Stedtfeld et al., 2008; Goldfarb et al., 2013; Ishii et al., 2013).
In more recent studies, a commercial nL-qPCR technology (SmartChip™ Real-Time PCR, TakaraBio Inc.) was used to design multi-target diagnostics to detect the presence of antibiotic resistance genes in urban wastewater treatment plant effluent, reclaimed water, and environmental samples (Wang et al., 2014; Karkman et al., 2016; Stedtfeld et al., 2016) and to evaluate a suite of related dehalogenase genes in complex microbial communities (Mayer-Blackwell et al., 2014). This technology uses 100 nL reaction volumes and allows for flexible configuration of a 5,184-well chip that can analyze up to 384 samples (depending on the number of assays included). Using this platform, we developed a nL-qPCR chip targeting 17 enteric pathogens across 96 samples in duplicate. Here, we present a comprehensive evaluation of the technology with laboratory standards as well as fecal samples from children in rural Bangladesh. The nL-qPCR enteropathogen chip permits high-throughput, rapid pathogen detection at significantly lower cost per-sample than other methods.
Methods
Assay Design and nL-qPCR Procedures
We selected bacterial, protozoan, and helminthic enteropathogens identified as contributing to diarrheal disease in children across 12 countries (Kotloff et al., 2013; Platts-Mills et al., 2015). We computationally designed primer pairs to target 16 virulence genes using methods described previously (26; and Supplementary Materials). We included an additional 10 published assays (see Table 1) to assess the suitability for inclusion of previously validated assays optimized at similar PCR conditions (Niesters, 2002; Maeda et al., 2003; Verweij et al., 2004; Yu et al., 2005; Wiria et al., 2010; Hoffmann et al., 2013; Liu et al., 2013). The final chip tested 96 samples against 54 assays. The chip was configured to contain 21 pathogen virulence/marker gene targets, three general targets (for bacteria, archaea, and fungi), and four quality control targets. The quality control assays were included to monitor inhibition and efficiency of DNA extraction and qPCR amplification. These included three gene targets from Mus musculus (ACAA2, B2M, and ESRRA), which we have used previously to monitor qPCR amplification inhibition between samples and across chips (Mayer-Blackwell et al., 2014), and a single extrinsic control from phocine herpesvirus (PhHV, gB), which is often spiked into DNA lysis buffers prior to sample processing to monitor DNA extraction efficiency (Liu et al., 2016a; Platts-Mills et al., 2018; Rogawski et al., 2018). Each assay was included in duplicate on a single chip (except for two of the four quality control assays, B2M and ESRRA, which were included once each due to space limitations). Assays were initially evaluated against 490bp synthesized linear DNA strands (Integrated DNA Technologies, Inc., Coralville, IA) for each target gene. Synthetic constructs were designed from reference genes (Table S1) and were used instead of cultured organisms in order to ensure high-precision, equimolar concentrations of each target in the final standard pool. Oligonucleotide primers (Integrated DNA Technologies, Inc., Coralville, IA) at a final concentration of 1 μM were added to a mixture of LightCycler 480 SYBR Green I Master Mix (Roche Applied Sciences, Indianapolis, IN) and the Mus musculus control spike-ins (ESRRA at 3 x 10⁵ copies/uL, ACAA2 at 3 x 10⁶ copies/uL, and B2M at 3 x 10⁷ copies/uL) and were robotically dispensed onto nL-qPCR chips using TakaraBio's SmartChip™ platform. In a separate plate, samples were added to additional master mix and robotically dispensed onto chips. Duplicate chips were run, using the standard TakaraBio protocol: 95°C for 3 min, then 40 cycles of (95°C for 60 s, 60°C for 70 s). Each chip contained a minimum of two negative (no template) controls for each assay.
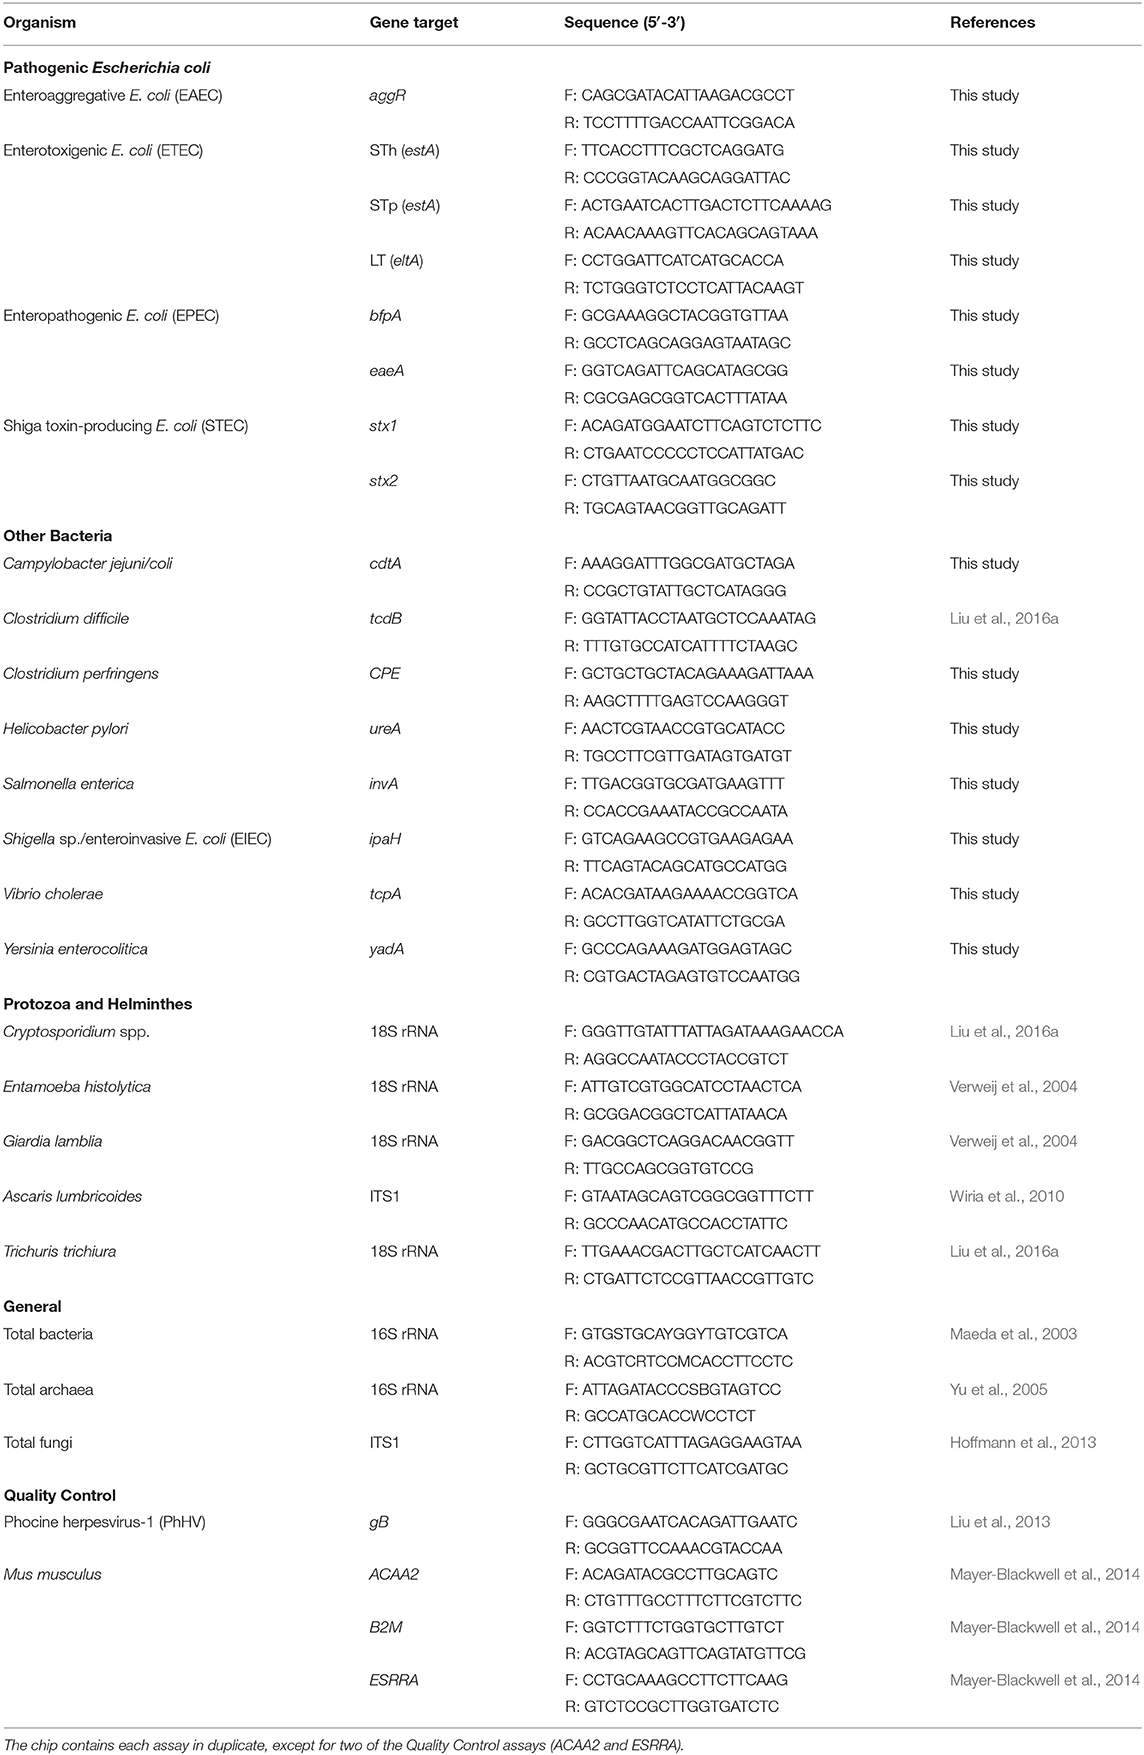
Table 1. Assays included on the nL-qPCR pathogen chip.
Analytical Performance
Analytical performance was evaluated in accordance with the Minimum Information for Publication of Quantitative Real-Time PCR Experiments (MIQE) guidelines (Bustin et al., 2009). Assay efficiencies were evaluated with a pool of synthetic DNA standards, described above. Standards were 10-fold serially diluted (10–106 copies/reaction). Standard curves were run on a minimum of 15 chips over two instruments at separate facilities (Fremont, CA and East Lansing, MI) and with two different operators at each location. Efficiencies were calculated according to Rutledge and Côté (2003); mean efficiency over all runs is reported along with coefficient of variation. Limit of detection (LOD) was determined with pooled synthetic DNA standards spiked into extracted DNA from 10 fecal samples to a final concentration of 10, 100, and 1,000 copies/reaction; each sample was run in duplicate on two chips. The mean cycle quantification (Cq) value (i.e., the cycle at which sufficient copies of target DNA have been made to produce a fluorescent signal detectable by the instrument) was calculated for duplicate assays on a single chip, and all results under the Cq cutoff of 30 were determined positive. A total of 20 positive samples (10 samples × 2 chips) per target at each concentration were assayed and LOD was defined as the lowest concentration which 95% were positively detected (i.e., where 19 of the 20 were detected).
Inter-assay precision (reproducibility) was assessed across the standard curves used for efficiency calculations measured over 15–20 chips, using different lots of master mix, different batches of oligonucleotide primers, and four different operators at two separate facilities. We report the mean coefficient of variation on calculated copy numbers over all points on the standard curve as well as the range. Intra-assay precision (repeatability) was measured within-chip and between chips. Within-chip precision was evaluated in three samples in which extracted DNA from fecal samples was mixed with positive controls at high (105 copies/reaction) and low (100 copies/reaction) concentrations and assayed 10 times each on a single chip: we report the coefficient of variation of calculated copy number across the 10 replicates. Between-chip precision was evaluated for synthetic DNA standards, for 60 fecal samples into which positive controls were spiked, and for 249 fecal samples collected from a cohort of Bangladeshi children that tested positive for at least one pathogen by TAC. Replicates for each sample were run on two chips and the coefficient of variation of calculated template copies was determined across all four replicates. We report mean coefficient of variation of calculated template copies over all samples, as well as the number of unique samples included in the calculation of the mean.
Sensitivity and specificity were evaluated using DNA standards spiked into extracted DNA from 40 pathogen-free fecal samples. For each pathogen target 10 samples contained the target at low concentration (100 copies/reaction), 10 samples at medium concentration (10x the LOD) and 10 samples at high concentration (100x the LOD); an additional 10 samples had no target. Sensitivity and specificity were determined based on positive or negative detection in these 40 samples. In order to further verify assay specificity, we sequenced qPCR amplicons from 94 sample mixtures which contained a total of 102 Bangladeshi child fecal samples, and 27 positive control samples obtained from other labs at Stanford (see Acknowledgments). The Seq-Ready™ TE MultiSample FLEX protocol, PCR clean-up, and DNA quantification prior to sequencing were done in accordance with TakaraBio's standard procedures, as described previously (Atshemyan et al., 2017; Firtina et al., 2017). The resulting paired-end Illumina MiSeq reads were quality filtered and only sequences that were the expected target gene amplicon length (± 3 bp) were maintained. We verified the intended target (organism and gene) by conducting a nucleotide BLAST search (Altschul et al., 1990) on each unique sequence. We retained the top hit(s), defined as the highest sequence identity with the lowest E value.
Sample Collection
We used 249 fecal samples from children 10–18 months old in rural Bangladesh to test the performance of nL-qPCR chip against the performance of enteric TAC. Children were enrolled in a randomized controlled trail evaluating the impact of water, sanitation, handwashing, and nutritional interventions on child growth and health (Arnold et al., 2013; Luby et al., 2018; Stewart et al., 2018; Lin et al., 2020); 218 (88%) children did not have diarrheal symptoms in the previous 7 days. Samples were collected by the child's caregiver into a sterile collection container and placed on cold chain within 165 [IQR 79, 791] min, transported to the laboratory and held at −80°C prior to analysis. DNA was extracted according to previously published protocols (Liu et al., 2016a) in the Parasitology lab at the International Centre for Diarrhoeal Disease Research, Bangladesh (icddr,b), including spike-in of 106 copies of PhHV into the lysis buffer, and separated into two aliquots: one aliquot was subjected to TAC analysis at icddr,b and the other was shipped on dry ice to Stanford University. Samples were collected after obtaining written, informed consent from the child's primary caregiver and with approval from human subjects committees at icddr,b (PR-11063), University of California, Berkeley (2011-09-3652), and Stanford University (25863).
Statistical Analyses
Data analysis was performed in R statistical software, v3.5.2 (R Core Team, 2018) and analysis files are available as Supplementary Materials. Coefficient of variation (the standard deviation of replicates divided by the mean) was used to evaluate precision in accordance with the MIQE guidelines (Bustin et al., 2009). Specifically, coefficient of variation of calculated copy number, and not Cq value, is reported per Schmittgen and Livak (2008) and Hellemans et al. (2007). Within-chip, between-chip, and between instrument/operator variances were compared with a pairwise Wilcoxon rank sum test, using the Benjamini-Hochberg procedure to account for multiple comparisons (Benjamini and Hochberg, 1995). Sensitivity and specificity were calculated using the epi.test function from the epiR package (Stevenson et al., 2019). Positive percent agreement and negative percent agreement were calculated in the same manner and are reported with this alternative nomenclature as recommended when no absolute reference standard is used (Food and Drug Administration, 2007). Exact binomial 95% confidence limits on sensitivity and specificity were calculated according to David (1999). Unweighted Cohen's Kappa was calculated using the epi.kappa function with confidence intervals calculated according to Rothman (2002). Bias in calculated log10 copy numbers per gram of stool (corrected for extraction and PCR efficiency by normalizing to the positive control PhHV spike-in) was evaluated according to Martin Bland and Altman (1986) using the blandr::blandr.statistics function to estimate bias (Datta, 2017); 95% confidence intervals determined per Bland and Altman (2002).
Results
Analytical Performance
The mean efficiency for each assay, based on the evaluation of standard curves run on 15–20 chips, ranged from 88 to 98% (mean 91%) with a coefficient of variation of 6.3% [IQR 5.3, 7.3] (Table 2). The linearity over all assays on all chips was 0.990 [IQR 0.987, 0.992] and detection limits were between 10 and 100 copies/100 nL reaction, which corresponds to 8 × 10⁵-8 × 10⁶ copies/g of stool (Table 2). Within-chip repeatability was assessed in 10 replicates on a single chip: synthetic DNA in high (105 copies/reaction) and low (102 copies/reaction) concentrations was spiked into DNA extracted from fecal samples. The high concentration displayed a coefficient of variation in calculated copy number of 15% [IQR 8–25]; the low concentration had variability of 27% [IQR 18–36] (Figure S1).
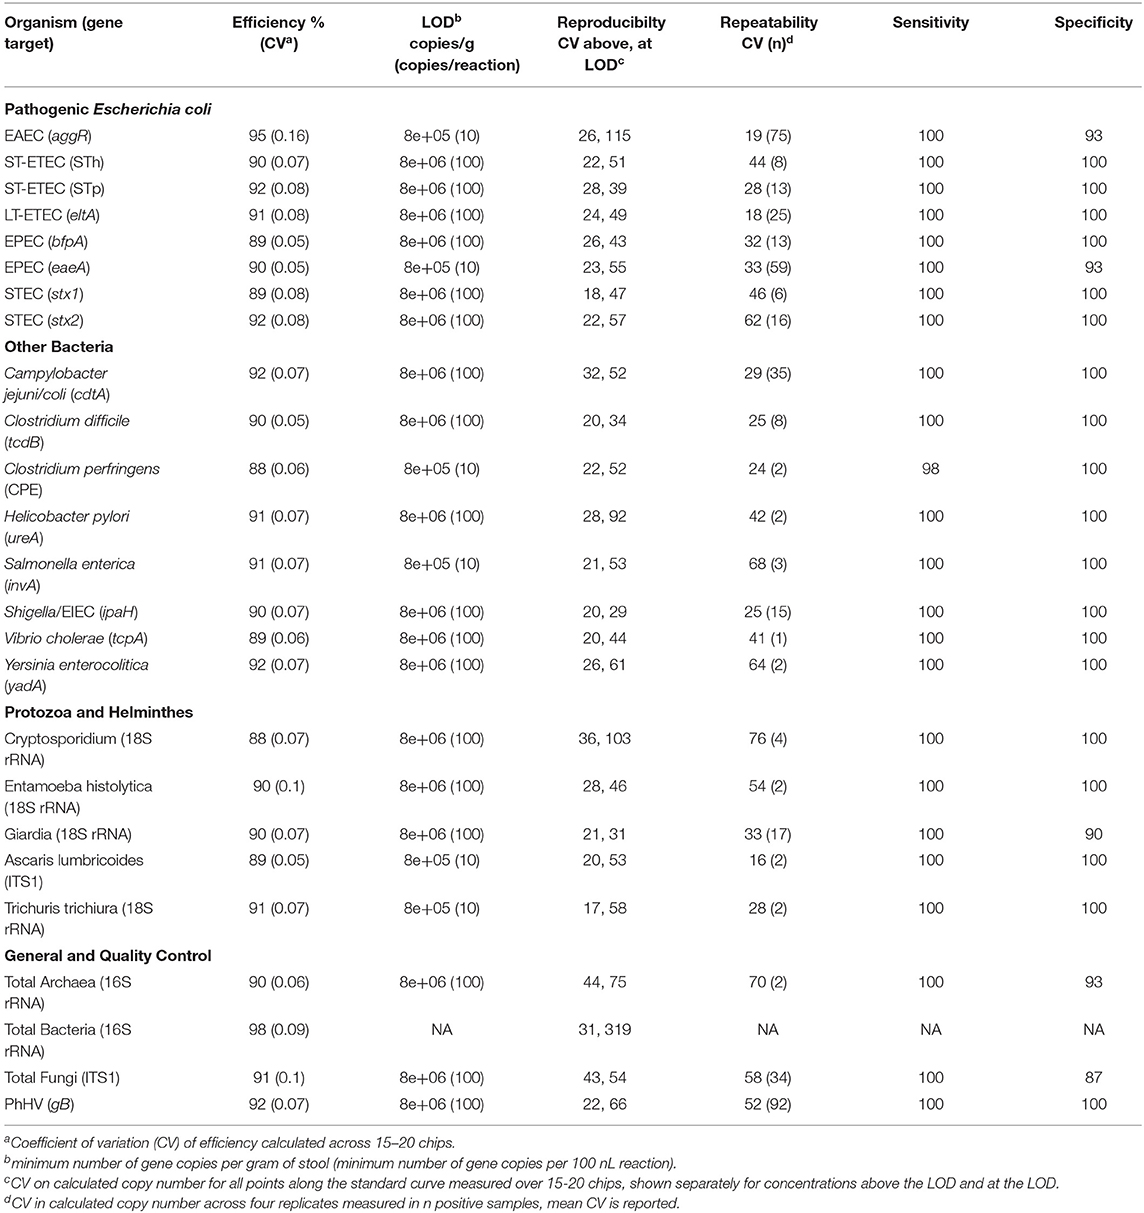
Table 2. Analytical performance of the nL-qPCR pathogen chip.
Cq values across replicate chips were highly repeatable for synthetic DNA standards (R2 = 0.989, Figure 1A), for synthetic DNA in a complex stool DNA matrix (R2 = 0.984, Figure 1B) and for DNA extracted from fecal samples collected from children in Bangladesh (R2 = 0.935, Figure 1C). Fecal samples displayed a median difference in Cq values of 0.39 [IQR 0.15–0.81] (Figure 1C) across all assays, which corresponds to a coefficient of variation on calculated gene copy number of 28% [IQR 16–50] (Table 2, Repeatability). The highest variability was again seen at the lowest concentrations (Figure S2).
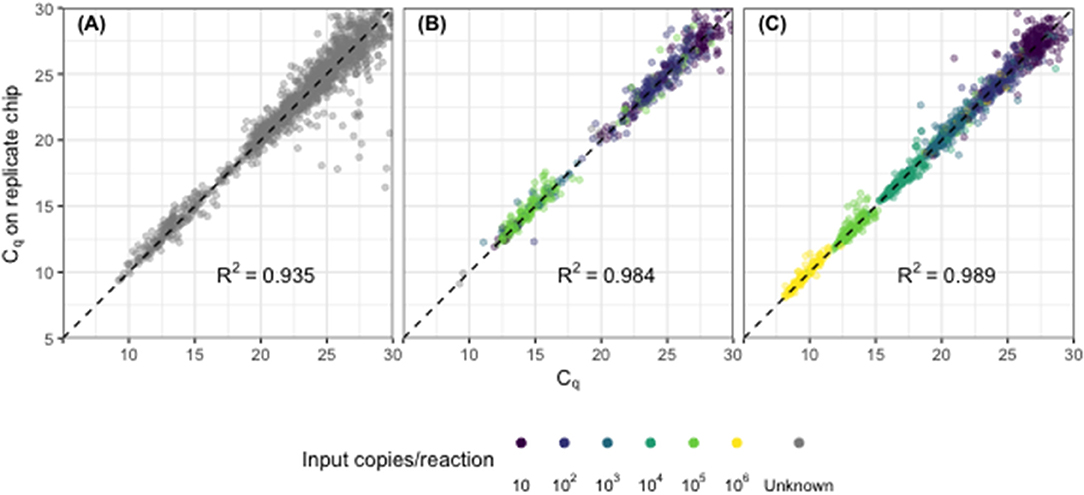
Figure 1. Assay precision across replicate chips for (A) synthetic DNA standards across a 6-fold dilution series, (B) synthetic DNA standards spiked into child fecal samples (n = 60), and (C) child fecal samples (n = 249). Each point represents the replicated results for a single sample-assay reaction run in a specific location on the chip. Points shown with color indicate results from amplified DNA standards with defined input copy number (10–106); gray points indicate results from fecal samples with unknown input copy number, absent synthetic standards.
Assays were reproducible across two instruments and four operators, with the same inverse relationship noted between variance and concentration (Table S3). At concentrations one or more orders of magnitude above the detection limit, coefficient of variation on calculated copy number ranged from 17 to 44% (Table 2). Coefficient of variation at the limit of detection ranged from 29 to 115% for pathogen virulence and marker genes, the highest of which was analogous to 17 ± 20 copies detected. Variance for the total bacterial (16S rRNA) assay at the detection limit (10 copies/reaction) was highest at 319%. Between-chip variance was similar to variance across two instruments and four operators (p = 0.99) but both were significantly higher than within-chip variance (p < 0.0001, pairwise Wilcoxon rank sum test). Coefficients of variation of the magnitudes observed are not biologically relevant when analyzing pathogen quantities on the log10 scale, as is the normal procedure.
Analytical sensitivity ranged from 98 to 100% and specificity from 90 to 100% (Table 2) among 40 samples containing combinations of synthetic nucleic acid spiked into DNA extracted from 10 different individuals and assayed in duplicate. To further ensure the specificity of the assays, we sequenced amplicons from 96 fecal samples collected from children in Bangladesh that tested positive for at least one pathogen target. We obtained 1.7M (26,747 unique) sequences with 330 [IQR 142, 1,171] unique sequences per assay. Amplicon sequencing showed that the assays were specific. The intended gene target was correctly identified in the top hit(s) (defined as highest identity and lowest E-value) for 99.8% of unique sequences. Most (99.7%) of the BLASTn searches returned a database top hit with ≥97% sequence identity. The Ascaris lumbricoides assay had highest number of off-target hits: 7/130 of the unique sequences were identified as the same target gene in a closely related species, Ascaris ovis.
Clinical Performance
For 249 Bangladeshi child fecal samples, overall percent agreement between nL-qPCR and TAC was 91% for the >4,400 reactions and negative percent agreement was 99% [95% CI 98, 99; Cohen's Kappa = 0.69 (95% CI 0.66–0.72)]. Positive percent agreement was highly dependent on concentration of the target gene. At concentrations above nL-qPCR detection limits (>107 copies/g stool) positive percent agreement was 89%; this dropped to 61% for concentrations near the nL-qPCR detection limits (105-107 copies/ g stool) and fell to 5% for concentrations below 105 copies/g stool (Table S4). In instances where both methods detected the presence of target genes, nL-qPCR assays displayed a median underestimation bias of −0.34 log10 copies [IQR −0.40, −0.28] (see Table 3 and Figure S3 for individual assay statistics).
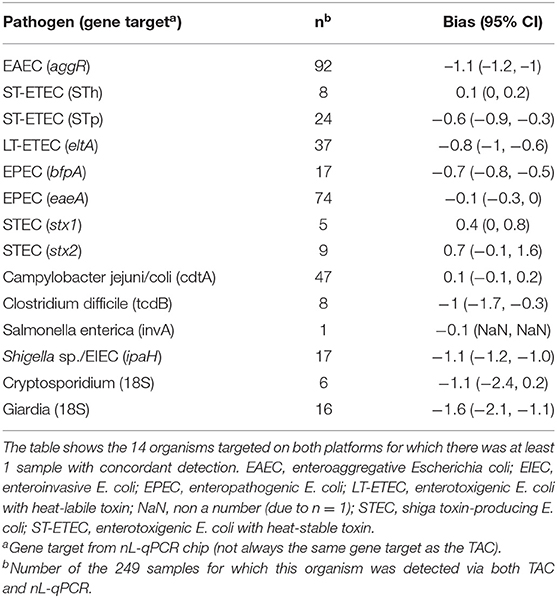
Table 3. Bland-Altman bias estimates by assay on calculated log10 copy number per gram of stool for nL-qPCR compared to TAC.
The average TAC Cq value was 30.9 [IQR 28.6, 33.0] for reactions detected by TAC but not by nL-qPCR, which was just above the maximum detectable cycle (Cq = 30) for nL-qPCR (Figure 2A, black points). The higher detection limits for nL-qPCR assays did not interfere with detection of diarrhea-causing pathogen concentrations, with the exception of the V. cholerae assay which had an etiologic cutoff that was below the nL-qPCR detection limit. The etiologic cutoff (shown as red lines in Figure 2A) indicates the TAC Cq value below which children were highly likely to have diarrhea, i.e., the value at which the odds ratio for diarrhea cases compared to controls was >2 (Liu et al., 2016b; Platts-Mills et al., 2018). nL-qPCR assays detected all but eight of the 40 reactions in which TAC assays detected a sample below the etiologic Cq cutoff value (4 for Shigella/EIEC, 3 for V. cholerae, and 1 for Cryptosporidium), and typically detected samples well above the cutoff for most assays (Figure 2A). Reactions positive by nL-qPCR but not TAC were also at low concentrations (Figure 2B) and could have been the result of less stringent amplification without the use of probe-based dyes with nL-qPCR.
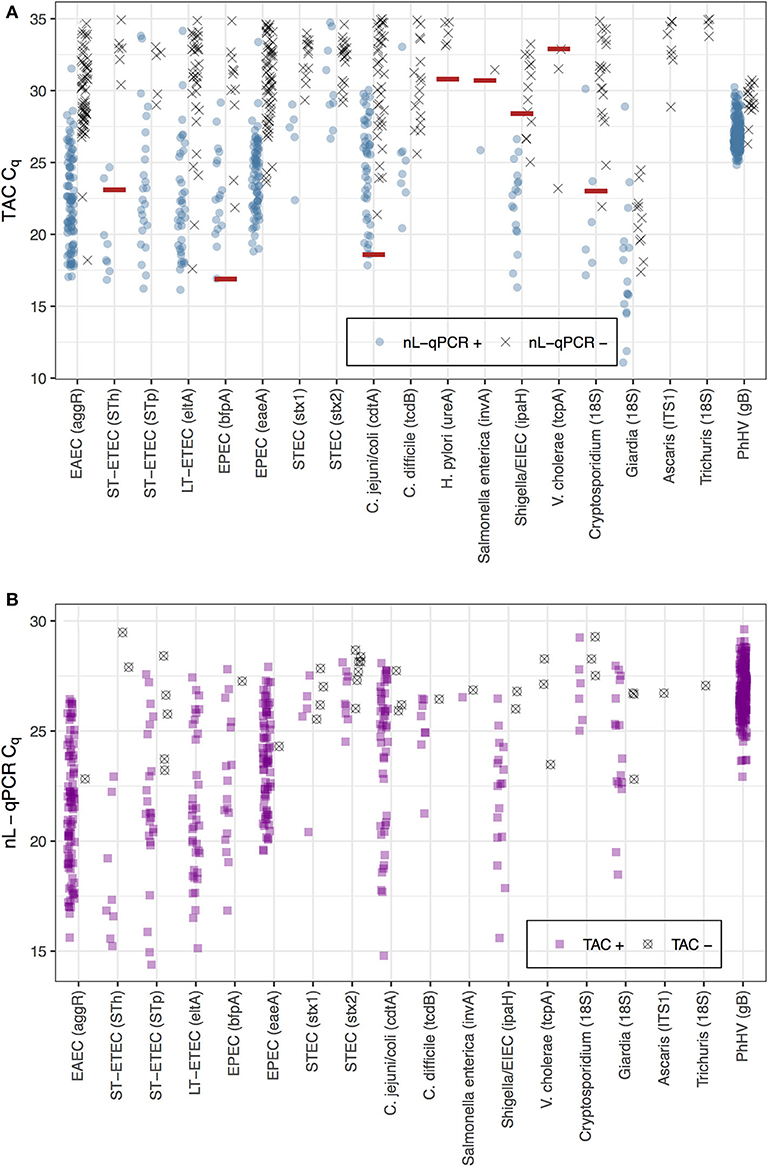
Figure 2. Comparison of nL-qPCR and TAC assays across 249 fecal samples. Samples detected by (A) TAC or (B) nL-qPCR are shown with their respective Cq values. Blue (top) and purple (bottom) points represent positive detections found in both nL-qPCR and TAC tests. Gray points (top) represent targets undetected by nL-qPCR but detected by TAC, and vise versa (bottom). Red lines represent pathogen TAC etiologic cutoff Cq values (etiologic cutoffs have not been established for nL-qPCR assays).
Contamination may cause false-positive qPCR results, and can occur due to cross-contamination between samples or as a result of free ambient DNA in the laboratory environment. Sample cross-contamination occurred rarely with nL-qPCR; amplification of pathogen virulence or marker genes in no-template controls occurred in <3% of the 4,288 no-template control sample reactions. Moreover, these amplifications resulted in calculated copy numbers near or below the established limit of detection (35 copies; IQR 28–42 copies). Ambient laboratory contamination was detected more frequently and was highly dependent on operator. Amplification of bacterial 16S rRNA occurred in 46% of no-template controls, but always at concentrations near the detection limit [11 (IQR 7, 25) copies]. Cross-contamination, although possible, occurs rarely and only in low concentration, thereby indicating a low likelihood of false positive results.
Discussion
The nL-qPCR chip evaluated here provides satisfactory analytical performance for simultaneous analysis of 96 samples against a suite of 17 enteric pathogens for a cost of < $10/sample. The high-throughput nature of the nL-qPCR chip is particularly advantageous when large numbers of samples need to be processed in a timely manner, such as in population-based research studies and field trials. Above certain thresholds, we found analytical performance to be comparable to an enteric TAC widely used for investigations of diarrheal disease in diverse global populations, for at least a quarter of the per-sample cost ($60; Liu et al., 2013). The cost of TAC can be greater if not purchased in bulk (Table S2). nL-qPCR is not likely to detect pathogens shed at concentrations below the detection limits (8 × 10⁵–8 × 10⁶ copies/g stool).
The primary difference in performance we observed was that a majority of the nL-qPCR assays had detection limits 1–2 orders of magnitude higher than TAC. The reduction in sensitivity is caused primarily by the fact that the nL-qPCR reaction volumes are 0.0125 μL compared to 0.2–0.4 μL for TAC; (10, personal communication with Liu, 2019). Among 249 fecal samples from Bangladeshi children, most nL-qPCR assays displayed a modest underestimation bias (i.e., returned a lower estimated number of copies per gram of stool) compared to the enteric TAC. However, these differences do not appear to be limitations in terms of ability to distinguish pathogen loads relevant for diarrheal disease for pathogens with established etiological cutoffs, with the potential exception of Vibrio cholerae. Importantly, the TAC and nL-qPCR assays for V. cholerae target different virulence genes: hemolysin (hlyA) for TAC and toxin-coregulated pilus (tcpA) for nL-qPCR. The etiologic cutoffs were established for hlyA, which is commonly detected in environmental V. cholerae strains that lack both the tcpA and cholera toxin genes (Hasan et al., 2013). Thus, discordant detection between the technologies might not represent differences in performance, but rather differential presence of these virulence genes within V. cholerae strains. Given that studies have shown low concentrations of V. cholerae hlyA gene are observed in feces coincident with diarrheal symptoms in children (Liu et al., 2016b; Platts-Mills et al., 2018), this might be a superior gene target for V. cholerae in pathogen panels. Additional studies should verify the optimal gene target for diarrhea-causing V. cholerae species. Not including the V. cholerae assay, the nL-qPCR chip was able to detect 32 of 37 (86%) samples with targets below TAC etiologic cutoffs, despite the lower sensitivity due to the chip's higher limits of detection. Future work could address the nL-qPCR assays that failed to identify Shigella/EIEC (4 samples) and Cryptosporidium (1 sample) in samples where TAC identified quantities below the established etiologic cutoffs.
In studies where quantitation is required at lower concentrations than were achieved in this study, pre-amplification can be performed as described by Ishii et al. (2013). In addition, pre-printing primers directly onto chips, similar to the TAC spotting procedure, can reduce detection limits by nearly 50%. However, a major advantage of the nL-qPCR SmartChip™ is the flexibility of the platform. Therefore, if a research team does opt to pre-print primers onto chips, we suggest also maintaining a stock of unprinted chips. The current configuration of the chip was designed with large-scale epidemiology studies in mind, thus increased throughput was prioritized over the inclusion of a higher number of assays. Researchers could increase throughput even further if focusing on a smaller set of targets, which would permit more samples per chip and reduce per-sample costs. In large-scale studies, replicating analysis for questionable samples is often necessary (e.g., when replicates give discordant results). Unprinted chips allow for an operator to run a limited suite of sample/assay pairs that need to be reanalyzed: for example, 384 samples with questionable results in the initial run from a large study could be analyzed against a minimal suite of 12 assays on a specially designed chip at the end of the study. This facilitates the resolution of discordant results and minimizes missing values in the final dataset to maximize statistical power in the analysis stage.
Unprinted nL-qPCR chips also allow end-users, with appropriate assay validation, to substitute assays in the set reported here. Our evaluation included 10 pre-published assays that operate at similar PCR conditions. We found they performed well in nL format, suggesting that end users have flexibility in re-designing the chip. We further show that seven primer pairs previously validated using TaqMan with probe-based dyes had excellent specificity among 96 fecal samples when utilized with SYBR Green intercalating dye instead. These results suggest the additional reagent costs associated with probes may not be necessary in some circumstances to achieve high specificity, which is consistent with other reports of equal or superior specificity with SYBR Green compared to TaqMan chemistry (Maeda et al., 2003; Peng et al., 2018).
Quantifying nucleic acid targets for large numbers of samples is expensive, regardless of the platform used and the tradeoff between technical replicates and biological replicates is often debated in large studies. Although technical replicates are generally encouraged (the rule of thumb is triplicates for qPCR), these are often sacrificed in the face of limited budgets to ensure greater statistical power afforded in the analysis with independent biological replicates (Kitchen et al., 2010; Taylor et al., 2010). Technical replicates are important to facilitate identification of outlier or spurious results, particularly on chip- or card-style platforms, and increase the likelihood of detection near the detection limit where analytical precision is the lowest (Smyth et al., 2005; Yuan and Irizarry, 2006; Liu et al., 2013). The nL-qPCR pathogen chip is configured to provide duplicate results for the 21 pathogen-specific virulence and marker genes. This was deliberate as it is impossible to determine a priori if a sample will be near the detection limit, particularly in the case of fecal samples where the presence of PCR inhibitors is likely (Monteiro et al., 1997; Wilson, 1997). Early versions of the enteric TAC included replicates (Liu et al., 2013), but those have been replaced by additional pathogen targets in latter versions currently in use for large-scale studies (Liu et al., 2016b; Platts-Mills et al., 2018). Due to the flexibility in configuration of the nL-qPCR, up to 13 additional pathogen targets could be added without sacrificing duplicate assays, and throughput would still be 8–9 times higher and cost 50% less than the enteric TAC. It is our hope that the lower per-sample cost and built-in technical replicates may facilitate best practices under budgetary constraints.
The nL-qPCR platform has important limitations. First, nL-qPCR does not appear to be well-suited for absolute quantification of total bacteria due to the fact that general bacterial contamination (measured by quantification of the 16S rRNA gene with broad specificity primers) was detected near the detection limit in almost half of the no-template control samples. Due to the open chip technology, there is higher likelihood for contamination if not used in a controlled laboratory with minimal ambient contamination and operators meticulous in their practice of sterile technique. To ensure potential low-concentration contamination is identified, we strongly recommend incorporation of replicates, as included on the nL-qPCR chip evaluated here, when using this technology or more stringent Cq filtering (e.g., Cq 29 or earlier). Secondly, the use of robotic liquid-handling instruments and specialized thermocyclers require a high capital investment, which might make the technology inaccessible to some institutions. Capital costs of these instruments are comparable to those required for the TAC, and availability of the instruments at shared user facilities might facilitate cost-sharing across labs. Another limitation of molecular methods in general is the inability to determine presence of viable organisms. However, model-derived quantitative cutoffs could be established for nL-qPCR based on the odds ratio of having clinical diarrheal symptoms at a specific Cq value, as has already been done for TAC (Platts-Mills et al., 2015; Liu et al., 2016b). Additionally, the importance of asymptomatic enteropathogen detection via molecular methods is increasing due the associations observed with childhood stunting and vaccine efficacy (Grassly et al., 2016; Taniuchi et al., 2016; Platts-Mills et al., 2017; Rogawski et al., 2018). Finally, the current nL-qPCR chip configuration does not include viral enteric pathogen targets. The primary aim for this study was to validate the nL-qPCR technology for bacterial and parasitic targets, and future iterations of the chip including viral targets could be combined with a reverse-transcriptase protocol for the study of RNA as well as DNA viruses.
In conclusion, we found the nL-qPCR pathogen chip to be an acceptable alternative for population-based field trials interested in enteric pathogen outcomes; the savings in both cost and time will be amplified at scale.
Data Availability Statement
The original contributions presented in the study are publicly available. This data can be found here: https://www.ncbi.nlm.nih.gov/bioproject/; PRJNA593072.
Ethics Statement
The studies involving human participants were reviewed and approved by human subjects committees at icddr,b (PR-11063), University of California, Berkeley (2011-09-3652), and Stanford University (25863). Written informed consent to participate in this study was provided by the participants' legal guardian/next of kin.
Author Contributions
JG and AS conceived of the study. JG and KM-B planned the study and designed primers. SL and JG obtained fecal samples from Bangladesh. JG conducted lab work, analyzed data and wrote the manuscript. All authors contributed to manuscript revision, read, and approved the final manuscript.
Funding
Funding for this work was provided by a grant from the National Institutes of Health (C-IDEA 1RC4TW00878101 to JG and AS) and a grant from the Bill and Melinda Gates Foundation (OPP1161946 to SL). AS was supported by a National Science Foundation (NSF) grant (C-DEBI STC). JG was supported by a NSF Graduate Research Fellowship and a Stanford Interdisciplinary Graduate Fellowship. Funders had no role in the design or execution of the study, interpretation of results, or decision to publish.
Conflict of Interest
The authors declare that the research was conducted in the absence of any commercial or financial relationships that could be construed as a potential conflict of interest.
Acknowledgments
We would like to thank Joerg Deutzmann for molecular insights; Yana Hoy-Schulz for helpful discussions and samples for early testing; and Albert Mueller and Wenyu Gu for critical comments on early versions of the manuscript. We wish to acknowledge Max Sanchez and Masy Leung (TakaraBio) as well as Jeff Landgraf and Christi Harris (Research Technology Support Facility, Michigan State University) for performing microfluidic reactions. We are grateful to the Stanford Health Care Clinical Microbiology Laboratory, and the laboratories of Manuel Amieva, Alexandria Boehm, Rashidul Haque, Julie Parsonnet, Justin Sonnenburg, David Stevens, and Steven Williams for providing pure culture DNA for select pathogens and/or positive control samples. This manuscript has been released as a pre-print at https://doi.org/10.1101/746446 (Grembi et al., 2019).
Supplementary Material
The Supplementary Material for this article can be found online at: https://www.frontiersin.org/articles/10.3389/fcimb.2020.00351/full#supplementary-material
References
Altschul, S. F., Gish, W., Miller, W., Myers, E. W., and Lipman, D. J. (1990). Basic local alignment search tool. J. Mol. Biol. 215, 403–410. doi: 10.1016/S0022-2836(05)80360-2
Arnold, B. F., Null, C., Luby, S. P., Unicomb, L., Stewart, C. P., Dewey, K. G., et al. (2013). Cluster-randomised controlled trials of individual and combined water, sanitation, hygiene and nutritional interventions in rural Bangladesh and Kenya: the WASH Benefits study design and rationale. BMJ Open 3:e003476. doi: 10.1136/bmjopen-2013-003476
Atshemyan, S., Chavushyan, A., Berberian, N., Sahakyan, A., Zakharyan, R., and Arakelyan, A. (2017). Characterization of BRCA1/2 mutations in patients with family history of breast cancer in Armenia. F1000 Res. 6:29. doi: 10.12688/f1000research.10434.1
Benjamini, Y., and Hochberg, Y. (1995). Controlling the false discovery rate: a practical and powerful approach to multiple testing. J. R. Stat. Soc. Ser. B 57, 289–300. doi: 10.1111/j.2517-6161.1995.tb02031.x
Bland, D. G., and Altman, J. M. (2002). Commentary on quantifying agreement between two methods of measurement. Clin. Chem. 48, 801–802. doi: 10.1093/clinchem/48.5.801
Bustin, S. A., Benes, V., Garson, J. A., Hellemans, J., Huggett, J., Kubista, M., et al. (2009). The MIQE guidelines: minimum information for publication of quantitative real-time PCR experiments. Clin. Chem. 55, 611–622. doi: 10.1373/clinchem.2008.112797
David, C. (1999). “Modelling binary data,” in Modelling Binary Data: Tests in Statistical Science (Boca Raton: Chapman, Hall/CRC), 25–27.
Firtina, S., Ng, Y. Y., Ng, O. H., Nepesov, S., Yesilbas, O., Kilercik, M., et al. (2017). A novel pathogenic frameshift variant of CD3E gene in two T-B+ NK+ SCID patients from Turkey. Immunogenetics 69, 653–659. doi: 10.1007/s00251-017-1005-7
Food Drug Administration. (2007). Statistical Guidance on Reporting Results from Studies Evaluating Diagnostic Tests. Rockville, MD: U.S. Department of Health and Human Services; p. 17, 25–9. Retrieved from https://www.fda.gov/regulatory-information/search-fda-guidance-documents/statistical-guidance-reporting-results-studies-evaluating-diagnostic-tests-guidance-industry-and-fda.
Goldfarb, D. M., Dixon, B., Moldovan, I., Barrowman, N., Mattison, K., Zentner, C., et al. (2013). Nanolitre real-time PCR detection of bacterial, parasitic, and viral agents from patients with diarrhoea in Nunavut, Canada. Int. J. Circumpolar Health 72, 1–8. doi: 10.3402/ijch.v72i0.19903
Grassly, N. C., Praharaj, I., Babji, S., Kaliappan, S. P., Giri, S., Venugopal, S., et al. (2016). The effect of azithromycin on the immunogenicity of oral poliovirus vaccine: a double-blind randomised placebo-controlled trial in seronegative Indian infants. Lancet Infect. Dis. 16, 905–914. doi: 10.1016/S1473-3099(16)30023-8
Grembi, J. A., Mayer-Blackwell, K., Luby, S. P., and Spormann, A. M. (2019). High-throughput multi-parallel enteropathogen quantification via nano-liter qPCR. bioRxiv [Preprint]. 746446. doi: 10.1101/746446
Hasan, N. A., Ceccarelli, D., Grim, C. J., Taviani, E., Choi, J., Sadique, A., et al. (2013). Distribution of virulence genes in clinical and environmental vibrio cholerae strains in Bangladesh. Appl. Environ. Microbiol. 79, 5782–5785. doi: 10.1128/AEM.01113-13
He, Q., Wang, J. P., Osato, M., and Lachman, L. B. (2002). Real-time quantitative PCR for detection of Helicobacter pylori. J. Clin. Microbiol. 40, 3720–3728. doi: 10.1128/JCM.40.10.3720-3728.2002
Hellemans, J., Mortier, G., De Paepe, A., Speleman, F., and Vandesompele, J. (2007). qBase relative quantification framework and software for management and automated analysis of real-time quantitative PCR data. Genome Biol. 8:R19. doi: 10.1186/gb-2007-8-2-r19
Hoffmann, C., Dollive, S., Grunberg, S., Chen, J., Li, H., Wu, G. D., et al. (2013). Archaea and fungi of the human gut microbiome: correlations with diet and bacterial residents. PLoS ONE 8:e66019. doi: 10.1371/journal.pone.0066019
Huang, R. S. P., Johnson, C. L., Pritchard, L., Hepler, R., Ton, T. T., and Dunn, J. J. (2016). Performance of the Verigene® enteric pathogens test, Biofire FilmArrayTM gastrointestinal panel and Luminex xTAG® gastrointestinal pathogen panel for detection of common enteric pathogens. Diagn. Microbiol. Infect. Dis. 86, 336–339. doi: 10.1016/j.diagmicrobio.2016.09.013
Ishii, S., Segawa, T., and Okabe, S. (2013). Simultaneous quantification of multiple food- and waterborne pathogens by use of microfluidic quantitative PCR. Appl. Environ. Microbiol. 79, 2891–2898. doi: 10.1128/AEM.00205-13
Karkman, A., Johnson, T. A., Lyra, C., Stedtfeld, R. D., Tamminen, M., Tiedje, J. M., et al. (2016). High-throughput quantification of antibiotic resistance genes from an urban wastewater treatment plant. FEMS Microbiol. Ecol. 92, 1–7. doi: 10.1093/femsec/fiw014
Kitchen, R. R., Kubista, M., and Tichopad, A. (2010). Statistical aspects of quantitative real-time PCR experiment design. Methods 50, 231–236. doi: 10.1016/j.ymeth.2010.01.025
Kotloff, K. L., Nataro, J. P., Blackwelder, W. C., Nasrin, D., Farag, T. H., Panchalingam, S., et al. (2013). Burden and aetiology of diarrhoeal disease in infants and young children in developing countries (the Global Enteric Multicenter Study, GEMS): a prospective, case-control study. Lancet 6736, 1–14. doi: 10.1016/S0140-6736(13)60844-2
Lin, A., Ali, S., Arnold, B. F., Rahman, M. Z., Alauddin, M., Grembi, J., et al. (2020). Effects of water, sanitation, handwashing, and nutritional interventions on environmental enteric dysfunction in young children: a cluster-randomized, controlled trial in rural Bangladesh. Clin. Infect. Dis. 70, 738–747.
Lin, M.-H., Chen, T.-C., Kuo, T.-T., Tseng, C.-C., and Tseng, C.-P. (2000). Real-Time PCR for Quantitative Detection of Toxoplasma gondii. J. Clin. Microbiol. 38, 4121–4125. doi: 10.1128/JCM.38.11.4121-4125.2000
Liu, J., Gratz, J., Amour, C., Kibiki, G., Becker, S., Janaki, L., et al. (2013). A laboratory-developed TaqMan Array Card for simultaneous detection of 19 enteropathogens. J. Clin. Microbiol. 51, 472–480. doi: 10.1128/JCM.02658-12
Liu, J., Gratz, J., Amour, C., Nshama, R., Walongo, T., Maro, A., et al. (2016a). Optimization of quantitative PCR methods for enteropathogen detection. PLoS ONE 11:e0158199. doi: 10.1371/journal.pone.0158199
Liu, J., Platts-Mills, J. A., Juma, J., Kabir, F., Nkeze, J., Okoi, C., et al. (2016b). Use of quantitative molecular diagnostic methods to identify causes of diarrhoea in children: a reanalysis of the GEMS case-control study. Lancet 388, 1291–1301. doi: 10.1016/S0140-6736(16)31529-X
Luby, S. P., Rahman, M., Arnold, B. F., Unicomb, L., Ashraf, S., Winch, P. J., et al. (2018). Effects of water quality, sanitation, handwashing, and nutritional interventions on diarrhoea and child growth in rural Bangladesh: A cluster randomised controlled trial. Lancet Glob. Heal. 6, 30490–30494. doi: 10.1016/S2214-109X(17)30490-4
Maeda, H., Fujimoto, C., Haruki, Y., Maeda, T., Kokeguchi, S., Petelin, M., et al. (2003). Quantitative real-time PCR using TaqMan and SYBR green for actinobacillus actinomycetemcomitans, porphyromonas gingivalis, prevotella intermedia, tetQ gene and total bacteria. FEMS Immunol. Med. Microbiol. 39, 81–86. doi: 10.1016/S0928-8244(03)00224-4
Martin Bland, J., and Altman, D. G. (1986). Statistical methods for assessing agreement between two methods of clinical measurement. Lancet 327, 307–310. doi: 10.1016/S0140-6736(86)90837-8
Mayer-Blackwell, K., Azizian, M. F., Machak, C., Vitale, E., Carpani, G., de Ferra, F., et al. (2014). Nanoliter qPCR platform for highly parallel, quantitative assessment of reductive dehalogenase genes and populations of dehalogenating microorganisms in complex environments. Environ. Sci. Technol. 48, 9659–9667. doi: 10.1021/es500918w
Mondal, D., Minak, J., Alam, M., Liu, Y., Dai, J., Korpe, P., et al. (2012). Contribution of enteric infection, altered intestinal barrier function, and maternal malnutrition to infant malnutrition in Bangladesh. Clin. Infect. Dis. 54, 185–192. doi: 10.1093/cid/cir807
Monteiro, L., Bonnemaison, D., Vekris, A., Petry, K. G., Bonnet, J., Vidal, R., et al. (1997). Complex polysaccharides as PCR inhibitors in feces. J. Clin. Microbiol. 35, 995–998. doi: 10.1128/JCM.35.4.995-998.1997
Niesters, H. G. (2002). Clinical virology in real time. J. Clin. Virol. 25, 3–12. doi: 10.1016/S1386-6532(02)00197-X
Peng, X., Nguyen, A., and Ghosh, D. (2018). Quantification of M13 and T7 bacteriophages by TaqMan and SYBR green qPCR. J. Virol. Methods 252, 100–107. doi: 10.1016/j.jviromet.2017.11.012
Platts-Mills, J., Gratz, J., Mduma, E., Svensen, E., Amour, C., Liu, J., et al. (2014). Association between stool enteropathogen quantity and disease in Tanzanian children using TaqMan array cards: a nested case-control study. Am. J. Trop. Med. Hyg. 90, 133–138. doi: 10.4269/ajtmh.13-0439
Platts-Mills, J. A., Babji, S., Bodhidatta, L., Gratz, J., Haque, R., Havt, A., et al. (2015). Pathogen-specific burdens of community diarrhoea in developing countries: A multisite birth cohort study (MAL-ED). Lancet Glob. Heal. 3, 564–575. doi: 10.1016/S2214-109X(15)00151-5
Platts-Mills, J. A., Liu, J., Rogawski, E. T., Kabir, F., Lertsethtakarn, P., Siguas, M., et al. (2018). Use of quantitative molecular diagnostic methods to assess the aetiology, burden, and clinical characteristics of diarrhoea in children in low-resource settings: a reanalysis of the MAL-ED cohort study. Lancet Glob. Heal. 6, e1309–e1318. doi: 10.1016/S2214-109X(18)30349-8
Platts-Mills, J. A., Taniuchi, M., Uddin, M. J., Sobuz, S. U., Mahfuz, M., Gaffar, S. A., et al. (2017). Association between enteropathogens and malnutrition in children aged 6-23 mo in Bangladesh: a case-control study. Am. J. Clin. Nutr. 105, 1132–1138. doi: 10.3945/ajcn.116.138800
R Core Team (2018). R: A Language and Environment for Statistical Computing. (Vienna: R Foundation for Statistical Computing).
Rogawski, E. T., Liu, J., Platts-Mills, J. A., Kabir, F., Lertsethtakarn, P., Siguas, M., et al. (2018). Use of quantitative molecular diagnostic methods to investigate the effect of enteropathogen infections on linear growth in children in low-resource settings: longitudinal analysis of results from the MAL-ED cohort study. Lancet Glob. Heal. 6, e1319–e1328. doi: 10.1016/S2214-109X(18)30351-6
Rutledge, R. G., and Côté, C. (2003). Mathematics of quantitative kinetic PCR and the application of standard curves. Nucleic Acids Res. 31:e93. doi: 10.1093/nar/gng093
Schmittgen, T. D., and Livak, K. J. (2008). Analyzing real-time PCR data by the comparative CT method. Nat. Protoc. 3, 1101–1108. doi: 10.1038/nprot.2008.73
Schnee, A. E., Haque, R., Taniuchi, M., Uddin, M. J., Alam, M. M., Liu, J., et al. (2018). Identification of etiology-specific diarrhea associated with linear growth faltering in Bangladeshi infants. Am. J. Epidemiol. 187, 2210–2218. doi: 10.1093/aje/kwy106
Smyth, G. K., Michaud, J., and Scott, H. S. (2005). Use of within-array replicate spots for assessing differential expression in microarray experiments. Bioinformatics 21, 2067–2075. doi: 10.1093/bioinformatics/bti270
Soumet, C., Ermel, G., Rose, N., Rose, V., Drouin, P., Salvat, G., et al. (1999). Evaluation of a multiplex PCR assay for simultaneous identification of Salmonella sp., Salmonella enteritidis and Salmonella typhimurium from environmental swabs of poultry houses. Lett. Appl. Microbiol. 28, 113–117. doi: 10.1046/j.1365-2672.1999.00488.x
Stedtfeld, R. D., Baushke, S. W., Tourlousse, D. M., Miller, S. M., Stedtfeld, T. M., Gulari, E., et al. (2008). Development and experimental validation of a predictive threshold cycle equation for quantification of virulence and marker genes by high-throughput nanoliter-volume PCR on the OpenArray platform. Appl. Environ. Microbiol. 74, 3831–3838. doi: 10.1128/AEM.02743-07
Stedtfeld, R. D., Williams, M. R., Fakher, U., Johnson, T. A., Stedtfeld, T. M., Wang, F., et al. (2016). Antimicrobial resistance Dashboard application for mapping environmental occurrence and resistant pathogens. FEMS Microbiol. Ecol. 92, 1–9. doi: 10.1093/femsec/fiw020
Stevenson, M., Nunes, T., Heuer, C., Marshall, J., Sanchez, J., Thornton, R., et al. (2019). epiR: Tools for the Analysis of Epidemiological Data. R package version 1.0-2. Available online at: https://CRAN.R-project.org/package=epiR
Stewart, C. P., Dewey, K. G., Lin, A., Pickering, A. J., Byrd, K. A., Jannat, K., et al. (2018). Effects of lipid-based nutrient supplements and infant and young child feeding counseling with or without improved water, sanitation, and hygiene (WASH) on anemia and micronutrient status: results from 2 cluster-randomized trials in Kenya and Bangladesh. Am. J. Clin. Nutr. 109, 148–164. doi: 10.1093/ajcn/nqy239
Taniuchi, M., Platts-Mills, J. A., Begum, S., Uddin, M. J., Sobuz, S. U., Liu, J., et al. (2016). Impact of enterovirus and other enteric pathogens on oral polio and rotavirus vaccine performance in Bangladeshi infants. Vaccine 34, 3068–3075. doi: 10.1016/j.vaccine.2016.04.080
Taniuchi, M., Verweij, J. J., Noor, Z., Sobuz, S. U., Van Lieshout, L., Petri, W. A., et al. (2011). High throughput multiplex PCR and probe-based detection with luminex beads for seven intestinal parasites. Am. J. Trop. Med. Hyg. 84, 332–337. doi: 10.4269/ajtmh.2011.10-0461
Taylor, S., Wakem, M., Dijkman, G., Alsarraj, M., and Nguyen, M. (2010). A practical approach to RT-qPCR-Publishing data that conform to the MIQE guidelines. Methods 50:S1. doi: 10.1016/j.ymeth.2010.01.005
van den Berg, R. J., Vaessen, N., Endtz, H. P., Schülin, T., van der Vorm, E. R., and Kuijper, E. J. (2007). Evaluation of real-time PCR and conventional diagnostic methods for the detection of Clostridium difficile-associated diarrhoea in a prospective multicentre study. J. Med. Microbiol. 56, 36–42. doi: 10.1099/jmm.0.46680-0
Verweij, J. J., Blange, R. A., Templeton, K., Schinkel, J., Brienen, E. A. T., Rooyen, M. A. A., et al. (2004). Simultaneous detection of entamoeba histolytica, giardia lamblia, and cryptosporidium parvum in fecal samples by using multiplex real-time PCR. J. Clin. Microbiol. 42, 1220–1223. doi: 10.1128/JCM.42.3.1220-1223.2004
Wang, F.-H., Qiao, M., Su, J.-Q., Chen, Z., Zhou, X., and Zhu, Y.-G. (2014). High throughput profiling of antibiotic resistance genes in urban park soils with reclaimed water irrigation. Environ. Sci. Technol. 48, 9079–9085. doi: 10.1021/es502615e
Wilson, I. G. (1997). Inhibition and facilitation of nucleic acid amplification. Appl. Environ. Microbiol. 63, 3741–3751. doi: 10.1128/AEM.63.10.3741-3751.1997
Wiria, A. E., Prasetyani, M. A., Hamid, F., Wammes, L. J., Lell, B., Ariawan, I., et al. (2010). Does treatment of intestinal helminth infections influence malaria? Background and methodology of a longitudinal study of clinical, parasitological and immunological parameters in Nangapanda, Flores, Indonesia (ImmunoSPIN Study). BMC Infect. Dis. 10:77. doi: 10.1186/1471-2334-10-77
Wongboot, W., Okada, K., Chantaroj, S., Kamjumphol, W., and Hamada, S. (2018). Simultaneous detection and quantification of 19 diarrhea-related pathogens with a quantitative real-time PCR panel assay. J. Microbiol. Methods 151, 76–82. doi: 10.1016/j.mimet.2018.06.006
Wood, M. W., Mahon, J., and Lax, A. J. (1994). Development of a probe and PCR primers specific to the virulence plasmid of Salmonella enteritidis. Mol. Cell. Probes 8, 473–479. doi: 10.1006/mcpr.1994.1068
Yu, Y., Lee, C., Kim, J., and Hwang, S. (2005). Group-specific primer and probe sets to detect methanogenic communities using quantitative real-time polymerase chain reaction. Biotechnol. Bioeng. 89, 670–679. doi: 10.1002/bit.20347
Keywords: enteropathogen, quantification, qPCR, enteric infection, molecular detection, high-throughput
Citation: Grembi JA, Mayer-Blackwell K, Luby SP and Spormann AM (2020) High-Throughput Multiparallel Enteropathogen Detection via Nano-Liter qPCR. Front. Cell. Infect. Microbiol. 10:351. doi: 10.3389/fcimb.2020.00351
Received: 17 January 2020; Accepted: 08 June 2020;
Published: 15 July 2020.
Edited by:
Yi-Wei Tang, Cepheid, United StatesReviewed by:
Kai Huang, The University of Texas Medical Branch at Galveston, United StatesPallavi Singh, Northern Illinois University, United States
Copyright © 2020 Grembi, Mayer-Blackwell, Luby and Spormann. This is an open-access article distributed under the terms of the Creative Commons Attribution License (CC BY). The use, distribution or reproduction in other forums is permitted, provided the original author(s) and the copyright owner(s) are credited and that the original publication in this journal is cited, in accordance with accepted academic practice. No use, distribution or reproduction is permitted which does not comply with these terms.
*Correspondence: Jessica A. Grembi, amdyZW1iaUBzdGFuZm9yZC5lZHU=; Alfred M. Spormann, c3Bvcm1hbm5Ac3RhbmZvcmQuZWR1
†Present address: Koshlan Mayer-Blackwell, Fred Hutchinson Cancer Research Center, Vaccine and Infectious Disease Division, Seattle, WA, United States