Abstract
This article presents the factors that help build the adaptive capacity of individuals to reduce vulnerability from natural threats. The findings are based on primary data on individuals engaged in various livelihood practices in the Digha-Sankarpur- Mandarmoni region along the eastern coastline of the Bay of Bengal in India. Coastal communities have their individual perceptions about their vulnerability to natural threats and associated risks to various assets. Based on perception survey responses, “adaptive capacity” is measured and the determining factors are analyzed with an aim to provide policy guidelines for strengthening the adaptive capacity of people dependent on coastal ecosystem-based livelihoods. Findings show that income security for individuals in coastal systems can be achieved through a livelihood diversification strategy. The scope for individuals to build personal savings, have access to financial institutions, and engage in collaborative actions with immediate neighbors in the community help to prevent multiple losses at the individual level aids in their adaptive capacity. Government actions to provide institutional and governance support and incentives to promote livelihood diversification and personal savings would enhance adaptive capacity through institutional actions. Public investment in public goods and services, including protection and monitoring of natural coastal ecosystems, infrastructure development, technological intervention, providing access to information, and community empowerment, have important roles to play in enhancing adaptive capacity.
Introduction
It is now well-established in the literature that coastal ecosystems are providers of multiple ecological functions with close links to societal and economic functions, either direct or indirect (Burke et al., 2001; Millennium Ecosystem Assessment, 2005; UNEP, 2006; Martínez, 2007; Roy et al., 2016; IPBES, 2018; Drius et al., 2019; Lau et al., 2019). Social-ecological systems in coastal zones are already exposed to several pressures induced by anthropogenic drivers like high population density, high concentration of socio-economic activities, rapid urbanization, land use change, and nutrient transport (Martínez, 2007; Neumann et al., 2015; Roy et al., 2015; Brown et al., 2019; Liu and Yang, 2020). Coastal ecosystems have been altered by humans harvesting provisioning, cultural, and amenity services. Additional threats of external natural shocks are also intensifying the degree and spread of vulnerability of this complex system (IPCC, 2014, 2018; Roy et al., 2015; Cetin, 2016). Exposure to multiple threats results in reduction in service flow from the ecosystem functions to the social-ecological system and hence reduces human welfare (Millennium Ecosystem Assessment, 2005; IPBES, 2018). This phenomenon is now well-documented in the literature (CTCN, 2019; Hindsley and Yoskowitz, 2020).
Possibilities of sea level rise, extreme weather events, and changing weather and climatic patterns are likely to change the pattern of coastal erosion, inundation, shoreline change, frequency of flooding and sea water intrusion, groundwater salinity level in coastal areas, and ocean acidification (Dayton et al., 2005; IPCC, 2012, 2014; Roy et al., 2015). These are considered to pose more risks (Hoegh-Guldberg et al., 2018) to the system and can worsen the chain effect (Dasgupta et al., 2009, 2011; IPCC, 2018). The impacts of cyclones and storm surges are found to be more devastating in developing countries with low adaptive capacity (India Water Portal, 2009; Dasgupta et al., 2011; IPCC, 2018; The Hindu, 2019). There are efforts to map the changes in landscape, erosion, and flooding using GIS and remote sensing techniques in various country contexts (Mujabar and Chandrasekar, 2013; Ghoussein et al., 2018; Kaya et al., 2019; Bove et al., 2020). Apart from incidences of extreme events, current levels of socio-economic, cultural, institutional, and political conditions of these less developed regions regulate the intensity and persistence of impacts (IPCC, 2014). Studies have indicated that the coastal areas along the Bay of Bengal (including West Bengal in India) are highly vulnerable to natural disasters (e.g., risk of sea level rise, prone to cyclones and coastal flooding, etc.) (Das et al., 2011; Chakraborty and Joshi, 2016; Islam et al., 2016; Nayak, 2017; CTCN, 2019; Jana, 2020). In order to address the vulnerability and risks of coastal communities and to build resilience, it is important to understand the current adaptive capacity of the socio-ecological system (Smit et al., 2000; Cinner et al., 2015; Birch and Carney, 2020; Kuhl et al., 2020).
The definition of adaptive capacity varies across disciplines and contexts. But, there is a common concept of adaptive capacity across different disciplines. This definition states that human agency which can modify vulnerability in several ways (Engle, 2011) to adjust against threats or shocks (Birkmann, 2013). In this study, following Adger (2000), we consider vulnerability as the presence or lack of ability/actions/interventions to withstand threats/shocks and stresses to livelihood. In the case of a resilience framework study of adaptive capacity, it broadly involves a spatial approach, capturing the dynamic properties of a system that helps in identification of exclusive characteristics of adaptive capacity of the concerned system (Engle, 2011). In the context of assessing wellbeing, Dasgupta and Mäler (2001) emphasized the importance of considering both “constituents” and “determinants” of wellbeing. Similarly, in the context of assessing adaptive capacity, making a differentiation between the components and the determining factors of adaptive capacity is required. Engle (2011) has also specified the theoretical and empirical importance of assessing adaptive capacity and characterizing the determining factors for advancement in research and contribution to the policy aspect related to adaptive capacity.
Against this backdrop, the novelty of this study lies in the method of empirically assessing adaptive capacity, and characterization of the determining factors. The multiplicity of elements that help in capacity building complicates the measurement of adaptive capacity. Also, from a policy intervention point of view, how much public and private intervention can help in adaptive capacity enhancement for livelihood categories is an interesting research question that would be helpful for informing policy through science-based findings, which is addressed in this article. The broader objective of this study is to empirically assess adaptive capacity and identify the factors that can influence adaptive capacity of coastal livelihoods based on vulnerable population's perception about the effectiveness of public adaptive measures and capacity of private adaptive measures to cope with coastal threats. This will help not only design to reduce coastal livelihood vulnerabilities in local informed policy but can also help to see if some generalized conclusions can be derived. However, existing knowledge in the literature and new information from the field have both been integrated in this paper. Local micro-level assessment of adaptive capacity for the individual livelihood groups in the coastal communities has been analyzed to derive broader policy implications. The study uses the vulnerability framework. It is done for a defined coastal stretch along the coast of the Bay of Bengal.
Study area
This study focuses on the Digha-Sankarpur-Mandarmoni, which is ~69 square kilometers of land-ocean interaction zone along a 17 kilometers long coastline in India along the Bay of Bengal. For the field study carried out during 2013–2015, the administrative areas covered are: beach areas of Dattapur (bordering with the neighboring state of Odisha), New Digha, Old Digha, Sankarpur, Tajpur, and Mandarmoni in the Purba Medinipur district of the state of West Bengal (Figure 1). The major ecosystem types in Digha-Sankarpur-Mandarmoni coastal zone are sandy and muddy beaches, mudflats, sand dunes, estuarine, and coastal forest.
Figure 1
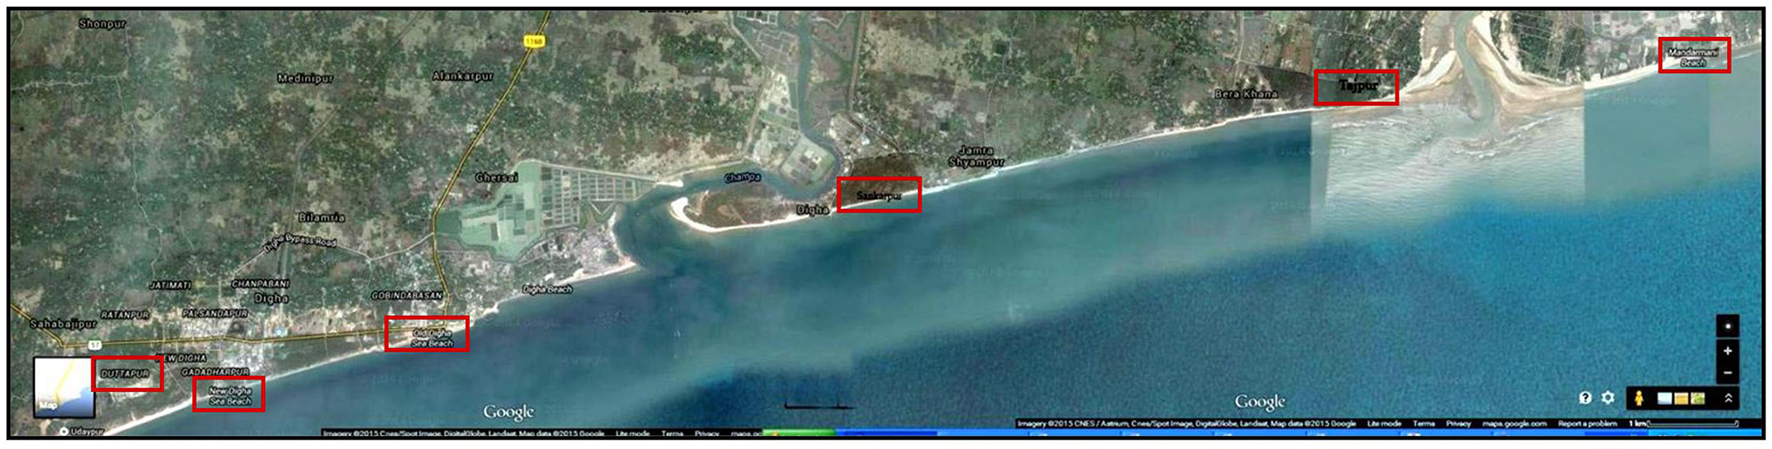
Satellite map of the Digha-Sankarpur-Mandarmoni study site. Major six beach locations in the study site, e.g., Duttapur, New Digha, Old Digha, Sankarpur, Tajpur and Mandarmoni, are highlighted with red rectangles. Source: https://maps.google.com/,2015, (Google Maps, 2015).
Digha-Sankarpur-Mandarmoni coasts are subject to frequent hazards caused by several natural phenomena like cyclonic storms, flooding, erosion, and sea level rise (Hazra et al., 2001; Jana et al., 2014; National Disaster Management Authority, India, 2017) (Table 1). The rate of relative sea level rise, which is over 3 mm/year, is considered to impact on the eroding nature of this coast (Hazra et al., 2001; Das and Dandapath, 2014). Excluding the contribution of inland water bodies, it has been estimated that, between 1950 and 2005, almost 10% of the land in the region has been engulfed by sea water (Santra Mitra et al., 2013; Das and Dandapath, 2014). Projected temperature extremes, rainfall patterns, and sea level rise (IPCC, 2012) are likely to accentuate the existing vulnerability of the region. Additional human interventions (Bhattacharya et al., 2003) are also altering the ecosystem to various degrees. Alterations that have been observed during field investigation are shown in Table 2. These changes in the natural ecosystem and various market driven factors have resulted in a shift in livelihood and occupational pattern in the region where the economic activities are primarily dependent on the coastal ecosystem and the associated ecosystem service flows.
Table 1
| Year | Threat | Scale | References |
|---|---|---|---|
| 1942 | Cyclone | Five meters high surge occurred in Medinipur coast and ~15,000 people were reportedly died due to the severe cyclonic storm | Nath et al., 2008 |
| 1956 | Cyclone and sea water intrusion | Flooding due sea water intrusion damaged agricultural fields | Nath et al., 2008 |
| 2009 | Cyclone | The cyclone Aila affected 25 blocks in the Purba Medinipur district and caused deaths and loss/ damage of properties | National Disaster Management Authority, India, 2017 |
| 2020 | Cyclone | Very severe cyclonic storm Amphan caused massive devastation | Kumar et al., 2021 |
| 1990–2008 | Increase in frequency of cyclones | – | Hazra et al., 2001 |
| 2011–2012 | Flooding | – | National Disaster Management Authority, India, 2012–2013 |
| 2013 | Heavy rainfall | Multiple cases of deaths were reported as well as other losses | IANS, 2013 |
| 1990–2008 | Increase in post-monsoon rainfall pattern | – | Hazra et al., 2001 |
| 1972–2006 | Increase in average mean sea level | – | Jana et al., 2014 |
| 1972–2010 | Net shoreline change | – | Jana et al., 2014 |
| 2005 | Eroding coast | – | The Hindu, 2005 |
| 2011–2012 | Erosion of sea dyke | – | National Disaster Management Authority, India, 2012–2013 |
| 2012 | Eroding coast | – | TOI, 2012 |
| 2014 | Eroding coast | – | Anandabazar Patrika, 2014 |
| 2006 | Pollution in coast and coastal water due to untreated sewage | – | The Hindu Business Line, 2013 |
| 2010 | Pollution created by untreated sewage discharge by industry, municipality and coastal settlement | – | Chakraborty, 2010 |
Natural threats in Digha-Sankarpur-Mandarmoni coastal zone.
Table 2
| Ecosystem type | Major locations on Digha-Sankarpur- Mandarmoni Coastline | Typology by alterationa |
|---|---|---|
| Sand dunes and Sandy and muddy beaches | Dattapur | Semi-altered |
| Old Digha | Altered | |
| New Digha | Semi-altered | |
| Sankarpur | Semi-altered | |
| Tajpur | Semi-altered | |
| Mandarmoni | Altered | |
| Estuaries | Dattapur | Semi-altered |
| Tajpur | Semi-altered | |
| Forest | Dattapur | Semi-altered |
| New Digha | Semi-altered | |
| Sankarpur | Semi-altered | |
| Tajpur | Semi-altered | |
| Mandarmoni | Semi-altered |
Extent of alteration in the coastal ecosystem of Digha-Sankarpur-Mandarmoni coasts.
a“Semi-altered” ecosystems refer to those where both natural ecosystem and alterations, like cropland and urbanization done through human interventions, co-exist, whereas in “Altered” ecosystems there is no existence of natural ecosystems and it is covered by only cropland and urbanization .
Source: Primary survey based data.
Figure 2 provides an overview of economic activities that are linked to local coastal ecosystems (estuarine, marine, riverine, sandy beaches, and coastal forests) and associated ecosystem service flows, provisioning and recreational services, both direct and indirect. In the study site, the provisioning services category, which includes fishing and agriculture, are the traditional livelihood practices. Recreational service is a non-traditional livelihood category. Formal institutionalized technically enabled deep sea fishing with trawlers, fishing with small mechanized boats, and fishing with manual boats coexists. Also, some coastal fishermen do not use any boats or any advanced gear for fishing. Instead, they practice very crude primitive manual methods. The aquaculture sites in this region are concentrated in certain pockets between old Digha (in Digha Mohona) and parts of Tajpur and Mandarmoni. Agriculture in the region can be mainly characterized by single crop paddy cultivation during monsoons, though some vegetables are also grown. Irrigation is difficult in most parts of the coastal area due to the highly saline creek water. Some winter irrigation is carried out by individuals storing rainwater in shallow channels. During the primary survey, it was observed that permanent, seasonal, and daily migration from adjacent and distant areas is also a prominent demographic feature in this area. Tourism activities have attracted in-migration of people to the study area. Seasonal migration is observed primarily in activities like deep sea fishing and aquaculture. Daily migrants from neighboring villages come to work in mostly mobility service-based livelihoods in the informal sector through manual and locally designed motorized van driving. These are either directly or indirectly connected to the coastal ecosystem services of the study site (Roy et al., 2015). Non-traditional livelihood options, such as tourism-related activities, are of a more recent origin. In some cases, in addition to their primary traditional agriculture and fishery-based livelihood practices, people undertake secondary additional occupation in the tourism sector. This includes setting up of temporary retail outlets on the beach, van-rickshaw driving (manual and motorized), and organizing horse-rides, motorbike rides, and water sports for the tourists on the beach. Survey findings show that changes in traditional agriculture and fishery-based occupational structures are attributable to the increasing cost of cultivation, reduced fish catch, increasing soil salinity, and risks to income and life from threats of extreme natural events. The stakeholders engaged in various occupational categories have also reported their perception of occurrence of the predominant natural threats in the region (Figure 3).
Figure 2
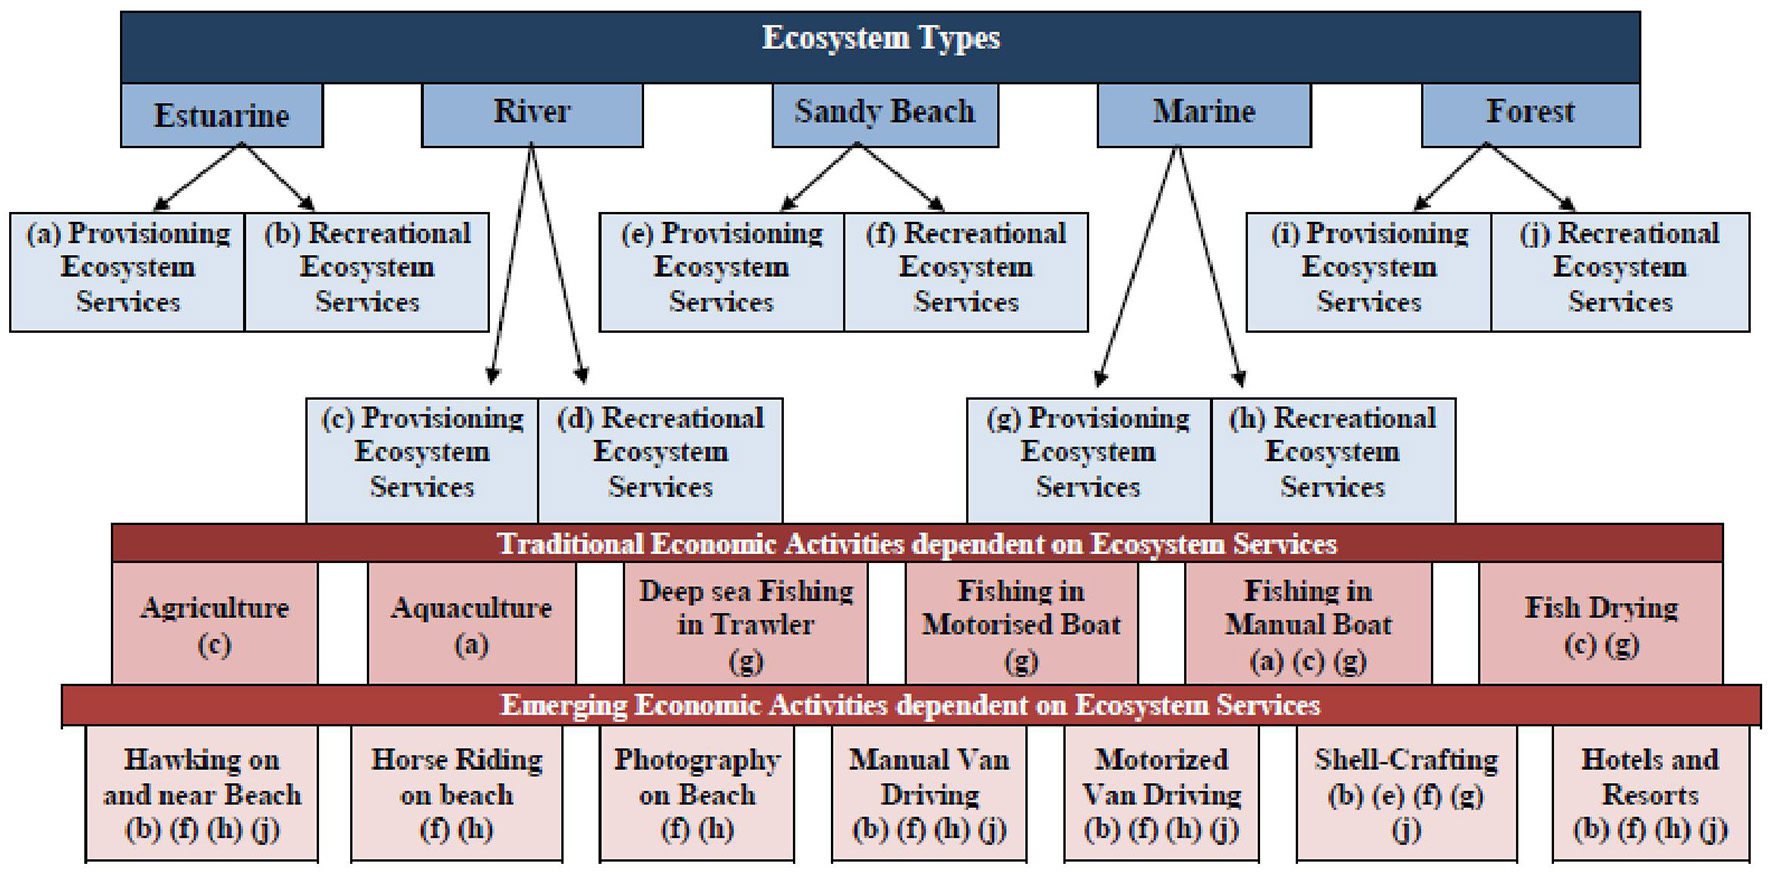
Socio-ecological system in Digha-Sankarpur-Mandarmoni. The notations attached with traditional and emerging economic activities within parenthesis correspond to the notations mentioned in the boxes for various ecosystem services. Source: Primary survey based data.
Figure 3
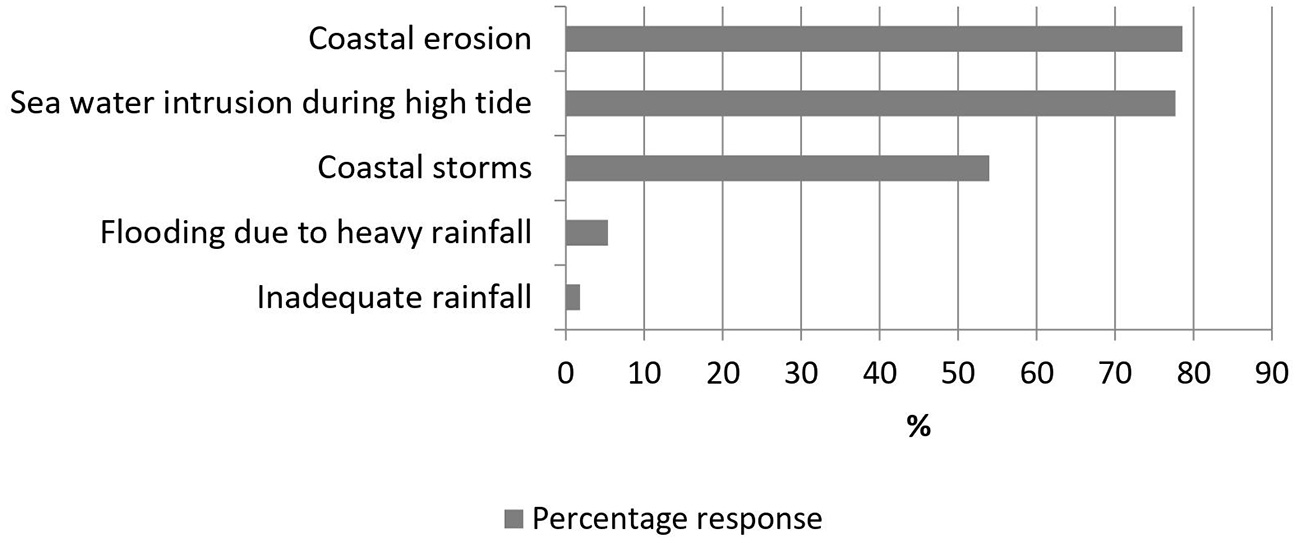
Percentage of respondents reporting natural threats in Digha-Sankarpur-Mandarmoni. Source: Primary survey based data.
Materials and methods
Our goal is to identify livelihood category indicators of adaptive capacity to arrive at the adaptive capacity score. The purpose is also to understand the role of various determinants in explaining the adaptive capacity. We intend to assess adaptive capacity of individuals in various livelihood or occupational categories that are vulnerable to natural threats due to exposure of various economic activities in the study area along the coast. Vulnerability is broadly seen as a function of three core factors, namely exposure, sensitivity, and adaptive capacity, in key documents like the IPCC (2012). Improvement in adaptive capacity through any kind of intervention results in reduced vulnerability (Yohe and Tol, 2002; Engle, 2011). We hypothesize that the capacity of an individual/household to adapt depends on access to wider public goods and services and on individual decision and action to protect against various anticipated losses. At any point in time, the level of adaptive capacity is determined by the prior decisions by individuals to invest in various protective actions to minimize the potential future losses to assets, lives, health, income, and finance. The perception about losses depends on an individual's ability to recover after any incidence of threat. An individual's adaptive capacity is also enhanced through better access to various public goods which government or non-government institutions create from time to time. Investment decisions help reduce damage to human wellbeing in any local context. These investments include installation of advanced technology like early warning systems, installation of Global Positioning System (GPS) in deep sea fishing trawlers through technical innovation, and physical and financial infrastructure development. Providing households access to loan finance, building disaster shelters and organizing efforts to move people to safer places during disasters, and improving information dissemination on weather forecasts or extreme weather events are all context-specific public goods and services aimed to enhance the adaptive capacity of private households.
Adaptive capacity indicators and score
This study aims to derive a quantitative score for adaptive capacity (AC) for each individual across occupation categories surveyed by considering two dimensions of adaptive actions using Equation (3): public action (ACPUA) and adaptive capacity through private action (ACPA). ACPUA and ACPA are derived using Equations (1) and (2) respectively.
Where, j = occupation category; i = individual; m, n = number of indicators in each category; g, h, w1, w2= indicator weights in each category.
The choice of indicators under public (ACPUA) and private (ACPA) actions are important to arrive at the adaptive capacity scores. The indicators of private and public actions have been identified and applied when estimating Equation (3) using two steps. In the first step, a list of indicators has been prepared through literature review (Brooks and Adger, 2005; Penalba and Elazegui, 2011) such as technological advancements and innovative solutions apart from economic, financial, social, and institutional factors. This is enriched during the exploratory survey and pilot survey stage by interviewing individuals across various livelihood categories at the study site. An adaptive capacity indicator list is also finalized. So, the final list of indicators of adaptive capacity by public action through creation of public good is represented by 33 actions (Table 3) relevant for the study site. The indicators of individual/household action are represented through actions targeted at the reduction of 10 types of losses incurred by households (Table 4). Given the fact that perceived adaptive capacity of an individual is often linked with cognitive behavior and risk perception (Jain et al., 2015), the risk perception of an individual is captured through the perception of an individual about the intensity of loss due to natural threats. Stakeholders' responses were sought using a likert scale ranging from “high” to “no impact at all”.
Table 3
| Sl. No. | List of public actions |
|---|---|
| 1 | Early warning system (radio, television, newspaper, local announcements) |
| 2 | GPS and wireless installed in deep sea fishing trawlers and mechanized boats |
| 3 | Construction of embankments |
| 4 | Financial assistance provided by the DSDAa in the form of easy loans/aid |
| 5 | Financial assistance provided by the panchayatb in the form of easy loans/aid |
| 6 | Financial assistance provided by other government bodies in the form of easy loans/aid |
| 7 | Financial assistance by NGOsc |
| 8 | Financial assistance by SHGsd |
| 9 | Loan from bank |
| 10 | Loan from cooperative society |
| 11 | Compensation/loan given by employer/owner |
| 12 | Loan from friends/relatives/local money lender |
| 13 | Crop damage compensation by government. |
| 14 | Crop insurance provided by the government |
| 15 | Government provides seed (free of cost/at low price) |
| 16 | Government provides scientific training for agriculture |
| 17 | Government provides scientific training for fishing |
| 18 | Rehabilitation programs by the government |
| 19 | Hawker's rehabilitation program by DSDA |
| 20 | Rehabilitation programs by any NGO |
| 21 | One-time housing material aid by the Centre/State/Panchayat |
| 22 | Improved infrastructure-roads |
| 23 | Improved infrastructure-electricity |
| 24 | Improved infrastructure-healthcare |
| 25 | Improved supply of drinking water |
| 26 | Afforestation program by the forest department |
| 27 | Community awareness programs organized by Digha science Center to build community adaptive capacity |
| 28 | Community awareness programs organized by DSDA to build community adaptive capacity |
| 29 | Purchase of life insurance against disaster risk |
| 30 | Evacuation of illegal hotels and restaurants built on the coast |
| 31 | Fine collection from illegal hotels and restaurants built on the coast |
| 32 | Sewerage treatment plant established by DSDA |
| 33 | Beach cleaning by DSDA |
Components representing public actions.
aDigha Sankarpur Development Authority (DSDA) is the local administrative body under the Urban Development Department, Government of West Bengal.
bVillage-level local administrative body.
cNon-Governmental Organizations.
dSelf- Help Groups.
Source: Primary survey based data.
Table 4
| Sl. No. | Personal loss types |
|---|---|
| Loss 1 | Fixed asset loss (house, land, etc.) |
| Loss 2 | Loss of shop/van/Boat etc. |
| Loss 3 | Loss of any other asset |
| Loss 4 | Income loss |
| Loss 5 | Health risk |
| Loss 6 | Loss of lives |
| Loss 7 | Crop loss |
| Loss 8 | Leaving current residence to find safer places |
| Loss 9 | Giving up occupation |
| Loss 10 | Lack of savings and borrowing money |
Components of losses that private adaptive actions try to reduce.
Source: Primary survey based data.
The final survey questionnaire (prepared and translated into the local Bengali language) was designed to get information on broadly socio-economic and demographic characteristics, changing patterns in economic activities over the years, reasons associated with these changes, a list of important threats (natural and anthropogenic) to different economic activities, and interventions/actions adopted/available and implemented so far to reduce the impact of such threats. These are captured from the perspective of different stakeholders. Questions are asked about different types of threats, drivers of such threats, the frequency of natural events/hazards and human-induced threats resulting in monetary loss to different stakeholders, and changes in ecosystem services. The interview outcome provides the information on scores from the individuals engaged in various occupation categories through ordinal scoring.
The steps that were followed are:
Step 1: Identification of the components of Adaptive Capacity (AC)
In the context of the study site, the components mentioned in Tables 3, 4 under the two broad categories of the AC Score are identified through literature review and detailed stakeholder consultation during pre-testing.
Step 2: Derivation of component/indicator level scores
For derivation of component level scores for each of the two categories, each respondent is asked to allocate an ordinal score. In case of adaptive capacity through public action, for each of the 33 components, the respondents are asked to select either “not beneficial” (which was score 1), “beneficial to some extent” (score 2), or “highly beneficial” (score 3). For the components of adaptive capacity through private action, the response categories and the respective numerical scores corresponding to the 10 components represented through impact variables were: “no loss”- 1, “marginal loss”- 4, “medium loss”- 9, and “very significant loss”- 16 (Cliff and Keats, 2003; Chakravarty, 2016). Higher loss means less adaptive capacity.
The ordinal response data obtained from the field are converted into numerical scores. The component level scores are calculated through weighted additive aggregation method where weights are derived using the non-linear Principal Component Analysis method (Linting and van der Kooij, 2012), which is considered to be appropriate in case of ordinal variables (Ferrari et al., 2005; Ellis et al., 2006). Two separate non-linear Principal Component Analysis (PCA) exercises are carried out to obtain weights of sub-components [i.e., gm and hn in Equations (1) and (2), respectively] for public action and private action using statistical package SPSS. This produced separate scores for adaptive capacity through public action (ACPUA) and adaptive capacity through private action (ACPA) at the level of respondents by using multiple components listed in Tables 3, 4.
Step 3: Derivation of Adaptive Capacity Scores
After obtaining the scores corresponding to the two selected components of adaptive capacity, i.e., ACPUA and ACPA at individual level using Equations (1) and (2), another non-linear PCA was carried out. This produced weights [w1 and w2in Equation (3)] for ACPUA and ACPA scores required for the derivation of AC scores at the individual respondent level. The final AC scores at individual level were derived through weighted aggregation of ACPUA and ACPA scores as mentioned in Equation (3). Since the components in ACPA represented losses due to lack of action, the corresponding weight of this component was attached with a negative sign.
The numeric value of weights (w1 and w2) in Equation (3) derived through this exercise are shown in Equation (4).
Adaptive capacity determinants
After obtaining the values of adaptive capacity scores for individual respondents [AC scores from Equation (4)], we consider ACji as the dependent variable and the variations in adaptive capacity scores are analyzed through multiple regression analysis by taking a number of explanatory variables representing natural, social and community level, economic, and individual level attributes. In the literature, several determinants of adaptive capacity have been mentioned which can be categorized under different capital/service flow categories: natural, infrastructural, financial, human, social, and cultural capital (Table 5). Since the factors determining adaptive capacity are context-dependent, the variables representing different aspects of determinants of adaptive capacity vary across studies. In the context of this study, identified relevant variables represent the five types of capital mentioned above. The variables are listed in Table 6. Keeping in mind the framework of assessment for adaptive capacity, these variables are categorized under three actor groups: public, community, and individual. For example, factors like “decline in supply of ecosystem services”, are public-level factors as they satisfy standard non-excludability and non-rivalry characters for all individuals in the region, whereas factors like “awareness about threats” often remain limited to any particular occupational community (like fishermen) or at a spatial scale (like within a village). Factors like income or saving potential are limited to an individual level.
Table 5
| Category | Mentioned in literature | Identified from the study sites | Public/community/individual good |
|---|---|---|---|
| Natural Capital | Availability and access to environmental resources (World Bank, 2010) | Respondents' perception about status of supply of ecosystem services | Public |
| Infrastructural Capital | Public resources, technology, access to education and healthcare facilities, and formal organizational structure i.e., formal institutions (World Bank, 2010) | Selection of different locations (e.g., Old Digha, Mandarmoni, etc.) in the study site that represented different status of infrastructural capital like public resources, public regulation on activities etc. | Public |
| Financial Capital | Income, Aid, and loans, savings (Lopez-Marrero, 2010) | Annual income, savings Income diversification index |
Individual |
| Human Capital | Threat Awareness, leadership, skill, vision, and motivation (Fabricius et al., 2007) | Awareness about prevalent natural threats Number of years of stay in the study area Whether still continuing traditional activity |
Public and community Individual |
| Social and Cultural Capital | Formal and Informal Knowledge networks, existence of polycentric institutions, ability of individuals and organizations to learn, anticipate and forecast, expansion of social networks, Membership of community organization, informal non-monetary support (e.g., food sharing), role of institutions, norms and faith within community to work toward common objectives (Pelling and High, 2005; Adger et al., 2007) |
Membership of community organization, awareness about existing adaptive measures Type of primary activity (responses: completely group activity, activity carried out individually under supervision and infrastructural assistance of any organization, Activity carried out individually with support (loan, information, etc.) from community organization, Completely individual activity) |
Community and individual |
Factors determining adaptive capacity.
Table 6
| Variable name | Measurement level | |
|---|---|---|
| y | Adaptive capacity score | Continuous |
| x1 | Decline in supply of ecosystem services | Dichotomous |
| x2 | Index of awareness adaptive measures | Continuous |
| d3 | Awareness of coastal storm | Dichotomous |
| d4 | Awareness of seawater intrusion | Dichotomous |
| d5 | Awareness of coastal erosion | Dichotomous |
| d6 | Completely group activity dummy | Dichotomous |
| d7 | Completely individual activity dummy | Dichotomous |
| d8 | Individual activity with community support dummy | Dichotomous |
| d9 | Old Digha dummy | Dichotomous |
| d10 | Tajpur and Mandarmoni dummy | Dichotomous |
| x3* d11 | Interaction of Inverse Simpson Indexa and dummy of benefit from savings | Continuous |
| x4*d5 | Interaction of duration of stay and awareness of coastal erosion | Continuous |
Overview of the variables in adaptive capacity score regression specification.
aInverse Simpson Index of diversity = 1/ (P) (Valdivia et al., 1996). Source: Primary survey based data.
The multiple linear regression Equation (5) in stochastic form with usual assumptions on stochastic term have been estimated (Maddala, 1994; Wooldridge, 2016) to analyze the determinants of Adaptive Capacity Score. Table 6 presents an overview of the variables of the regression equation specified in Equation (5). The estimated coefficients of the regression equation are reported in Table 7 of the following section.
Table 7
| Coefficients | |||||
|---|---|---|---|---|---|
| Model | Unstandardized coefficients | Standardized coefficients | t | ||
| B | Std. Error | Beta | |||
| 1 | (Constant) | 0.48 | 0.10 | 4.57* | |
| Decline in supply of ecosystem services | −0.15 | 0.03 | −0.44 | −5.50* | |
| Aware of prevalent natural threat 1 | −0.04 | 0.03 | −0.12 | −1.69 | |
| Aware of prevalent natural threat 2 | −0.13 | 0.03 | −0.30 | −4.25* | |
| Aware of prevalent natural threat 3 | 0.13 | 0.03 | 0.30 | 4.43* | |
| Index of awareness about adaptive and coping measures | 0.00 | 0.00 | 0.07 | 0.93 | |
| Completely group activity dummy | 0.07 | 0.06 | 0.14 | 1.19 | |
| Completely individual activity dummy | −0.03 | 0.05 | −0.09 | −0.72 | |
| Individual activity with community support dummy | 0.07 | 0.06 | 0.13 | 1.18 | |
| Old Digha dummy | 0.06 | 0.03 | 0.15 | 1.83 | |
| Tajpur and Mandarmoni dummy | −0.07 | 0.03 | −0.19 | −2.35* | |
| Interaction of Inverse Simpson Index and Benefitted from savings | 0.15 | 0.06 | 0.20 | 2.70* | |
| Interaction of duration of stay and Awareness of threat | 0.00 | 0.00 | −0.15 | −2.0* | |
Determinants of adaptive capacity.
*Significant at 5% level of significance. Source: Primary survey based data.
This assessment uses primary qualitative and quantitative data collected from the study site Digha- Shankarpur- Mandarmoni1,2 along the eastern coastline of the Bay of Bengal in India. The data collection framework is shown in Figure 7.
Figure 4
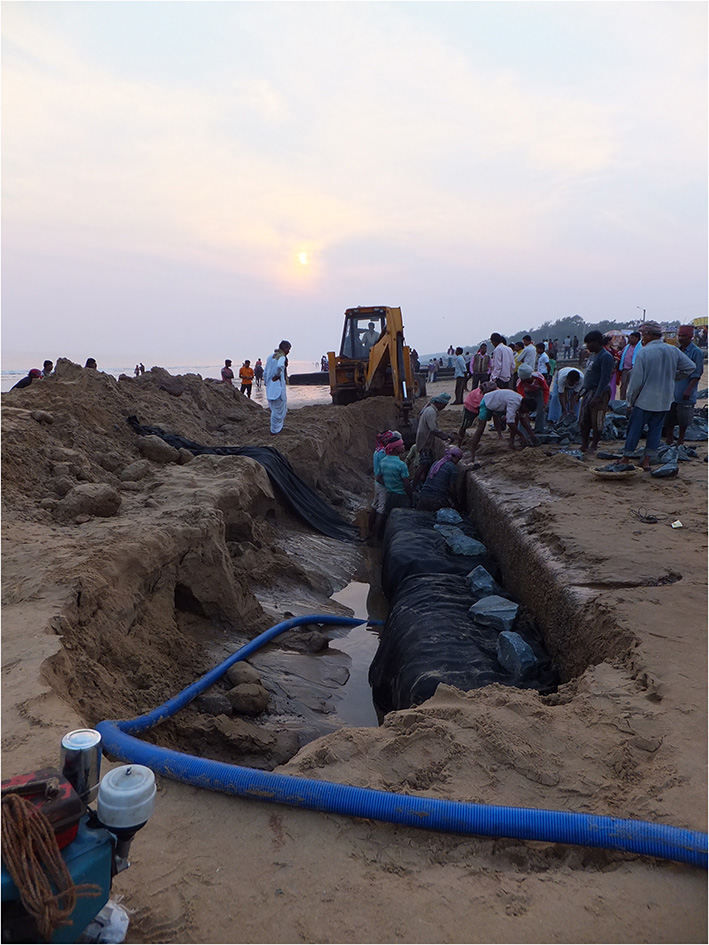
Infrastructure project: Embankment construction work in progress along the coastline in Digha. Source: Authors.
Figure 5
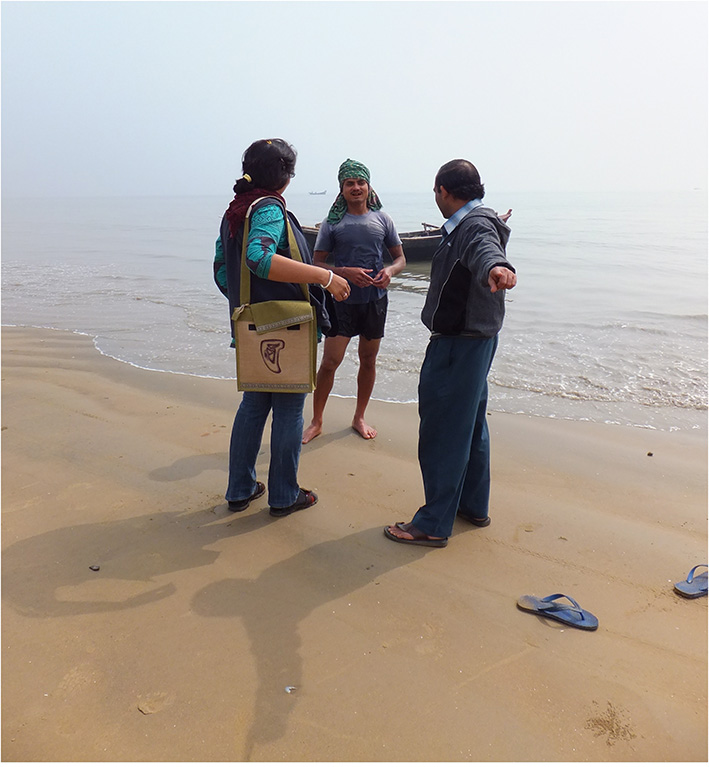
Interviewing Fisherman at Shankarpur coast. Source: Authors.
Figure 6
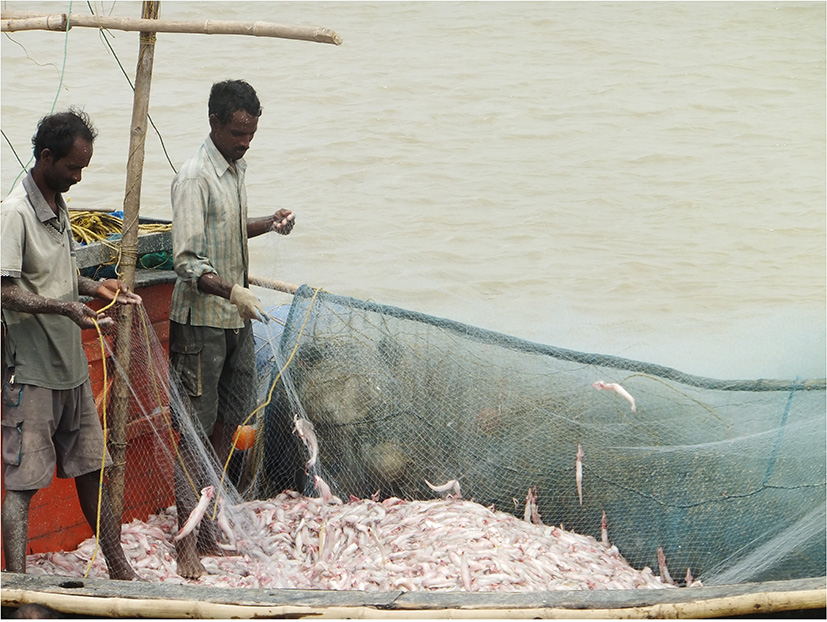
Fishermen in Digha with fish catch using deep sea fishing trawlers. Source: Authors.
Figure 7
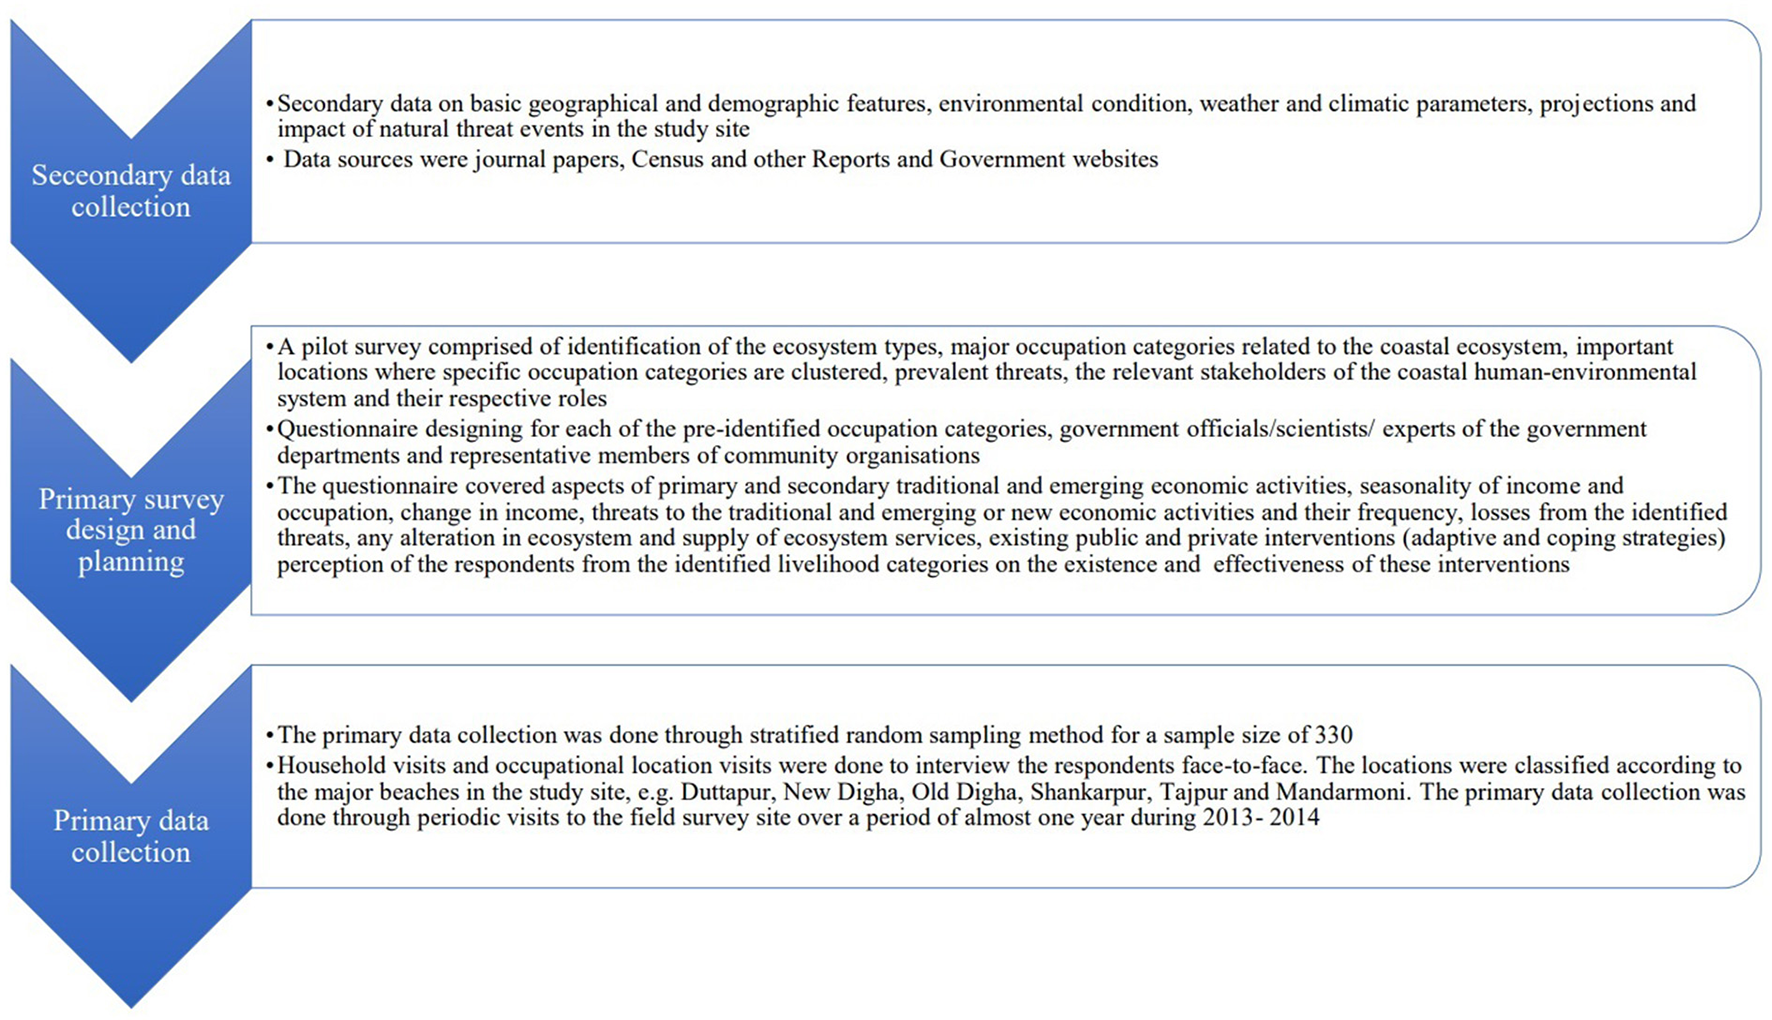
Primary and secondary data collection framework.
Results and discussion
The study questionnaire includes various kinds of natural threats. In addition to a literature search, exploratory and pilot scale surveys helped to understand people's perception about threats and need for actions to alleviate the vulnerability to several coastal livelihood categories in the study site Digha-Sankarpur-Mandarmoni. The respondents3 of the primary survey reported incidences of major natural threats based on the recall method of their experiences.
Table 8
| Age groups | Percentage share in total number of respondents |
|---|---|
| Males | 90 |
| 18–32 years | 26 |
| 33–47 years | 28 |
| 48–62 years | 27 |
| 63–77 years | 6 |
| 78–92 years | 4 |
| Females | 10 |
| 18–32 years | 5 |
| 33–47 years | 4 |
| 48–62 years | 1 |
| Aggregate annual household income (in INR) groups | Percentage share in total number of respondents |
| 5,000–34,999 | 13 |
| 35,000–64,999 | 43 |
| 65,000–94,999 | 17 |
| 95,000–124,999 | 18 |
| 125,000 and above | 9 |
General information about the respondents of primary survey in the study site.
Source: Primary survey based data.
Among the five major natural threats, as mentioned in Figure 3, more than 50 percent of the respondents have reported coastal erosion, sea water intrusion during high tide, and coastal storms as major natural threats. These are followed by flooding due to heavy rainfall. Individual responses to adaptive actions to these threats were received in a likert scale. These were finally converted to adaptive score as mentioned in the preceding section. This provided us a scope to distribute the responses in each livelihood category. In Figure 8, the box plot shows the distribution of adaptive capacity scores of individuals belonging to different primary occupation categories. Horizontal bars within the boxes are the median scores which help us compare across various primary occupation/livelihood categories.
Figure 8
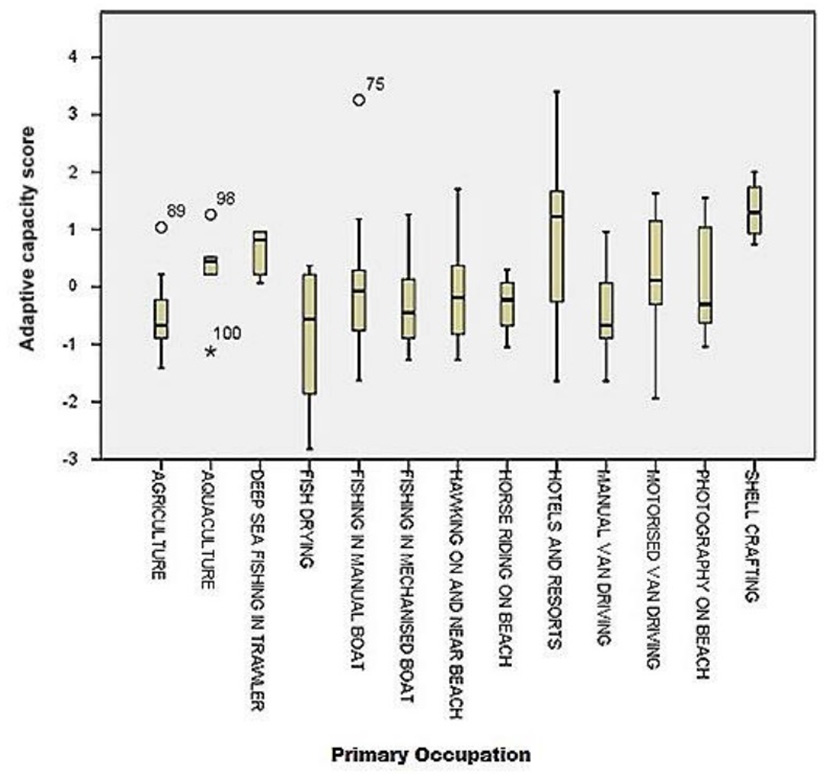
Box plot of adaptive capacity scores. Source: Primary survey based data.
Tourism and fisheries are found to be the dominant sectors in the study site. Horse riding on the beach, manual and motorized van driving, photography on the beach, shell crafting, and hawking can be considered as primarily direct tourism-related livelihood options that are emerging in the study site. Median adaptive capacity score is the highest for shell crafting. It is followed by hotels and resorts, deep sea fishing in trawlers, aquaculture, and others. Economic activities like van driving, hawking, fish drying, fishing in manual and mechanized boats, etc. are institutionally less organized, less regulated by the government, mostly in informal livelihood categories, and have lower median values, implying overall low adaptive capacity level. The range of individual adaptive capacity scores is found to be the highest for hotels and resorts among the tourism sector. This implies that there exists a wide range of variations in adaptive capacity level among the hotel industry and tourism service providers in the region because of their wide range of variation in investment. Activities that are carried out in a group, such as deep-sea fishing in a trawler, fishing in a mechanized boat, shell crafting, etc., have adaptive capacity scores lying within a smaller range, i.e., showing more homogeneity compared to hotels for individual adaptive capacity levels. The fishermen association collectively sets rules for deep sea fishing such as when to go fishing in the open ocean and in what kind of team formation, as well as providing marketing and financial assistance to fishermen. The government provides training for deep sea fishermen and helps in the installation of GPS, early warning systems, etc. It is worth noting that the new livelihood created through shell crafting is carried out by the women's' self-help groups (SHGs) who have their own group norms for monitoring group member's activities and thus can be considered as an organized economic activity. Marketing is also done through group activity either in local markets directly or through contracts with other supply outlets. This livelihood shows the highest median value and least spread of adaptive capacity score. Agriculture has an overall lower adaptive capacity score and is thus more vulnerable in the region.
We analyzed weights/component loadings derived through non-linear Principal Components Analysis (as mentioned in the previous section) to identify the relative importance of the components among the indicators of ACPUA and ACPA. The ACPUA components that are found to have highly significant component loadings or weights are: early warning systems, global positioning systems (GPSs), construction of embankments, one-time housing material aid, improved infrastructure, and afforestation. Among ACPA personal losses, perceived intensity of household and occupational asset loss, income loss, crop loss, and loss due to migration are attended with higher priority by private action. This is also consistent with the findings above that show deep sea trawlers which are now technically enabled and are regulated are showing higher adaptive capacity scores. Also, we observed respondents are changing traditional livelihood dependence on agricultural activity and informal fishing activities and are trying to diversify their livelihood by engaging themselves in less vulnerable livelihood activities, such as temporary retail outlets on the beach, van-rickshaw driving, and organizing horse-rides for tourists, motorbike rides, and water sports for tourists on the beach. Both pull and push factors were found to drive this change in occupational pattern. In the agriculture sector, a small amount of land holdings and proximity to the sea, lack of any formal association like the fishery sector actors, decline in ecosystem services due to salt water intrusions, and lack of government action also lead to low adaptive capacity and hence to higher vulnerability of these traditional activities. This analysis helps in providing information for prioritizing public investment to help reduce vulnerability by enhancing the adaptive capacity of a community.
Multiple factors determine the differences in adaptive capacity across individuals. This is reflected in our regression model (Equation 5) that has 12 predictors including two interaction dummies. By running a multiple linear regression exercise using statistical package SPSS, the results were obtained. The results are in Table 7.
Analysis of statistically significant variables shows that adaptive capacity improves if a decline in the supply of ecosystem services can be controlled/reversed. So, investment in restoring ecosystem health to maintain or enhance ecosystem services in coastal zones will help in building adaptive capacity in this context. This aligns with other country studies as well (World Bank, 2010). In the literature (Fabricius et al., 2007; Huq and Reid, 2007), it has been mentioned that awareness about threats has a positive impact on building adaptive capacity. In this study, we have tested that by differentiating rapid and slow onset natural threats. Awareness of threats 1 (coastal storms) and 2 (seawater intrusion during high tide) have negative coefficients whereas awareness of threat 3 (coastal erosion) has a positive coefficient. This implies that, since coastal storm (threat 1) and sea water intrusion during high tide (threat 2) are rapid-onset threats, mere awareness about incidences of these events does not improve adaptive capacity. This needs more prior protective action through public investment in costal storm protection and installation of early warning systems. But in the case of slow-onset threats like coastal erosion (threat 3), awareness enables an individual or community to take a priori decisions over a relatively longer period of time to act on an individual capacity or by influencing public action.
We got positive signs for estimated coefficients for dummies for group activity and individual activity with community support. The completely individualized activity dummy has a negative coefficient. This implies that economic activities carried out in a group or with community support reduces the vulnerability and hence leads to better adaptive capacity, while individual efforts alone can deliver negative impacts. This we consider a reflection of the role social capital has in positively influencing individual adaptive capacity, which also supports the findings in existing literature (Pelling and High, 2005; Adger et al., 2007). Hence, for improvement of adaptive capacity levels of individuals engaged in any particular occupation category, the occupational practices can be modified toward a group orientation where there will be opportunities to make group decisions, investments, accumulation of funds etc. It also creates scope for knowledge sharing. It is seen from the estimated coefficients of the two location dummies in the model that individuals engaged in activities in Old Digha have better adaptive capacity compared to Tajpur and Mandarmoni. A distinctive feature of both Tajpur and Mandarmoni is that they are newly altered coasts and unregulated economic activities are more visible on these coasts compared to Old and New Digha, which already have public investment in beach protection and coastal infrastructure in place. The significance of public investment in adaptive capacity building has also been recognized by the respondents. The regression coefficient for the variable created through Inverse Simpson Index (which measures individual income diversification) and benefits from savings potential turned out to be significant. This implies income diversification of individuals when supplemented by actions toward adoption of various savings instruments available in the financial market leads to an increase in adaptive capacity. Therefore, it can be said that at the individual level adaptive capacity is supposed to increase with livelihood diversification if enhanced income leaves some margin for maintaining savings. Annual income from primary activity is insignificant in various regression runs whether with or without interactions term. We can infer from this observation that higher income does not always improve adaptive capacity, but rather diversified livelihood sources for income generation builds better adaptive capacity at an individual level and creates opportunities for elevating saving levels.
Thus, livelihood type, state of the coastal natural capital, existence of social capital, and government regulations have considerable influence on adaptive capacity. The common attributes of the most beneficial adaptive measures taken in the study site included infrastructure development through public investment and having public good features (e.g., early warning systems, construction of embankments, etc.). These interventions are not meant for any specific occupation category. Ongoing government interventions focus on hard interventions like road construction, cleaning and beautification (Phadikar, 2017), building protective walls and dykes to restrict beach erosion (ICZMPWB, n.m.), and promotion of tourism-related activities (Government of West Bengal, 2008; Ganguly and Sharma, 2015) without much strict enforcement for regulations, as we observed from the field responses. Also, there is a lack of investment focus on enhancing coastal ecosystem-based functions and services. From existing reports, policy documents, and interviews with government officials and village focus group discussions in the study site, it has been found that some regulatory mechanisms are currently pushed back against by local communities and associations in the absence of adequate consultations from policy makers related to impositions of bans on deep sea fishing during fish breeding period, bans on gill nets in fishing, and training facilities for fishermen. The regulatory body considers these as barriers to policies. Communities report regulatory level corruption in certain pockets of the study area, such as in implementation and violation of CRZ (Coastal Regulation Zone) regulation. There is evidence of violation of CRZ regulation by both formal and informal sectors (cag.gov.in, 2017). Clearly, trust is eroding between local communities and regulatory bodies. Lack of coordination among multiple regulatory bodies within the government is also prevailing. While carrying out this study, availability and access to scientific data at a spatial level in the study site turned out to be a major challenge.
Conclusions
This study was based on a detailed primary survey along the 17 km. stretch of Digha-Shankarpur-Mandarmoni coast in the Bay of Bengal to provide a clear understanding of the perception of people from various livelihood groups on what works and what does not work in their vulnerability reduction. People in the study region reported how they are exposed to several natural threats. People from various coastal ecosystem-dependent livelihood categories perceive their vulnerability to natural threats and understand the need for action. The region is also characterized by relatively high population density and socio-economic features that also contribute to the vulnerability of the local communities. Findings provide insights for going forward with policy formulation, implementations, and actions to withstand natural threats to various livelihood categories. The study outcomes identified what various actions can do to reduce coastal vulnerability. The success of any action, whether by the administrative body in the study area, the fishery association, SHGs, or investors in the region, clearly depends on how trust-building with the vulnerable community is attempted. People perceive that investment in restoring ecosystem health to maintain or enhance ecosystem services in coastal zones helps in building their individual adaptive capacity, however, it was also observed that there is a lack of investment focus on enhancing coastal ecosystem-based functions and services. Public investment in embankments, infrastructure, and early warning systems enhance private adaptive capacity across all livelihood categories. Social capital through community support and livelihood diversification for individuals also strengthens adaptive capacity. Local stakeholders' participation in action design can strongly enhance contextualization of the interventions to achieve strategic vulnerability reduction. In many cases, due to non-inclusion of local people, intervention was pushed back or hindered. The study method can be replicated in other local contexts for assessing adaptive capacity levels, spread, and determinants among other vulnerable groups to determine both public and private actions needed to reduce existing vulnerabilities and to avoid future new vulnerabilities. In the study region, there is a top-down policy push toward livelihood generation in the tourism sector. But this study shows that this new livelihood option is growing with low adaptive capacity. It is thereby making the coastal community more vulnerable. The study was undertaken during 2013–15, i.e., before the official adoption of the Sustainable Development Goals (SDG) framework. Any future similar adaptive capacity assessment focused research can position it in the context of the SDG to show what kind of actions can provide maximum synergies and least trade off to get wider developmental benefits in human wellbeing besides vulnerability reduction.
Statements
Data availability statement
The raw data supporting the conclusions of this article can be made available by the authors on request, based on discretion of the authors concerning the purpose and use of the requested data.
Ethics statement
The questionnaire involving human participants was reviewed and approved by the Project Ethics Committee of Global Change Programme- Jadavpur University. Written informed consent for participation was not required for this study.
Author contributions
All authors listed have made a substantial, direct, and intellectual contribution to the work and approved it for publication.
Funding
Authors acknowledge the financial support received under the completed APN project (reference numbers: ARCP2012- 12NMY-ROY and ARCP2013-07CMY-ROY) for the period November 2012-March 2015. This provided the initial financial support for SD as a researcher in the project. Financial support was also received through the Global Change Programme of Jadavpur University for the period April 2015-March 2017. During April 2017-June 2018, as a registered Ph.D student, SD received the Swami Vivekananda Single Girl Child Scholarship for Research in Social Sciences (SVSGC) of University Grants Commission (UGC) of the Government of India. Also, authors acknowledge partial support provided by the SMARTS Center- PISCES project of SERD at the Asian Institute of Technology, Thailand at the final stage for the publication of the work in 2022.
Acknowledgments
The paper is based on part of doctoral thesis of SD. The thesis was submitted and the degree was awarded from the Department of Economics, Jadavpur University in 2019. The primary survey and data used in the study were collected during the APN project period 2013-2015. The authors acknowledge contributions at various stages from APN project partners and individual project members who were engaged during the project work in various capacities and feedback received from a number of Workshop- Seminar- Conference participants, Ph.D committee members, faculty members, and external examiners at the Department of Economics, Jadavpur University, reviewers of the article.
Conflict of interest
The authors declare that the research was conducted in the absence of any commercial or financial relationships that could be construed as a potential conflict of interest.
Publisher’s note
All claims expressed in this article are solely those of the authors and do not necessarily represent those of their affiliated organizations, or those of the publisher, the editors and the reviewers. Any product that may be evaluated in this article, or claim that may be made by its manufacturer, is not guaranteed or endorsed by the publisher.
Footnotes
1.^ The study site falls under the jurisdiction of local administrative body Digha Sankarpur Development Authority (DSDA) (Urban Development Department, Government of West Bengal). The study site comprises parts of Ramnagar I and II administrative blocks of East Medinipur district of West Bengal, India.
2.^ The primary field survey photographs are given in Figures 4–6.
3.^ The general information about the respondents of the primary survey in the study site are shown in Table 8.
References
1
Adger W. Agrawala S. Mirza M. Conde C. O'Brien K. Pulhin J. et al . (2007). “Assessment of adaptation practices, options, constraints and capacity,” in Climate Change 2007: Impacts, Adaptation and Vulnerability. Contribution of Working Group II to the Fourth Assessment Report of the Intergovernmental Panel on Climate Change, eds M. Parry, O. Canziani, J. Palutikof, P. V. Linden, and C. Hanson (Cambridge: Cambridge University Press), 717–743.
2
Adger W. N. (2000). Social and ecological resilience: are they related?Prog. Hum. Geogr.24, 347–364. 10.1191/030913200701540465
3
Anandabazar Patrika (2014). Anandabazar Patrika. Retrieved from: https://www.anandabazar.com/: https://www.anandabazar.com/nature/%E0%A6%95-%E0%A6%B7%E0%A7%9F-%E0%A6%B7-%E0%A6%A3-%E0%A6%B8-%E0%A6%95%E0%A6%A4-%E0%A6%89%E0%A6%A6-%E0%A6%AC-%E0%A6%97-%E0%A6%AC-%E0%A7%9C%E0%A6%9B-%E0%A6%AC-%E0%A6%B6-%E0%A6%B7%E0%A6%9C-%E0%A6%9E%E0%A6%A6-%E0%A6%B0-1.3896 (accessed June 12, 2014).
4
Bhattacharya A. Sarkar S. K. Bhattacharya A. (2003). “An assessment of coastal modification in the low lying tropical coast of north east India and role of natural and artificial forcings,” in Proceedings of International Conference on Estuaries and Coasts (Hangzhou).
5
Birch T. Carney J. (2020). “Regional resilience: building adaptive capacity and community well-being across louisiana's dynamic coastal–inland continuum,” in Louisiana's Response to Extreme Weather, ed L. Shirley (Cham: Springer), 313–340.
6
Birkmann J. (2013). “Measuring vulnerability to promote disaster-resilient societies and to enhance adaptation: discussion of conceptual frameworks and definitions,” in Measuring Vulnerability to Natural Hazards : Towards Disaster Resilient Societies, ed J. Birkmann (Tokyo: United Nations University Press), 9–79.
7
Bove G. Becker A. Sweeney B. Vousdoukas M. Kulp S. (2020). A method for regional estimation of climate change exposure of coastal infrastructure: Case of USVI and the influence of digital elevation models on assessments. Sci. Total Environ.710, 136162. 10.1016/j.scitotenv.2019.136162
8
Brooks N. Adger W. (2005). “Assessing and enhancing adaptive capacity,” in Adaptation Policy Frameworks for Climate Change: Developing Strategies, Policies and Measures, eds B. Lim, and E. Spanger-Siegfried (Cambridge University Press), 165–181.
9
Brown C. J. Jupiter S. D. Albert S. Anthony K. R. Hamilton R. J. Fredston-Hermann A. et al . (2019). A guide to modelling priorities for managing land-based impacts on coastal ecosystems. J. Appl. Ecol.56, 1106–1116. 10.1111/1365-2664.13331
10
Burke L. Kura Y. Kassem K. Revenga C. Spalding M. McAllister D. et al . (2001). Coastal Ecosystems.Washington, DC: World Resources Institute.
11
cag.gov.in (2017). Compliance Audit. Retrieved from: cag.gov.in: https://cag.gov.in/sites/default/files/audit_report_files/Chapter_3_%E2%80%93_Compliance_Audit_-_Report_No.1_of_2017_%E2%80%93_Economic_Sector_Government_of_West_Bengal_0.pdf (accessed May 11, 2019).
12
Cetin M. (2016). Determination of bioclimatic comfort areas in landscape planning: a case study of Cide Coastline. Turk. J. Agric. Food Sci. Technol.4, 800–804. 10.24925/turjaf.v4i9.800-804.872
13
Chakraborty A. Joshi P. (2016). Mapping disaster vulnerability in India using analytical hierarchy process. Geomat. Nat. Hazards Risk7, 308–325. 10.1080/19475705.2014.897656
14
Chakraborty S. K. (2010). Coastal environment of Midnapore, West Bengal: potential threats and management. J. Coast. Environ.1, 27–40.
15
Chakravarty S. R. (2016). Inequality, Polarization and Conflict: An Analytical Study. New Delhi: Springer.
16
Cinner J. E. Huchery C. Hicks C. C. Daw T. M. Marshall N. Wamukota A. et al . (2015). Changes in adaptive capacity of Kenyan fishing communities. Nat. Clim. Chang.5, 872. 10.1038/nclimate2690
17
Cliff N. Keats J. A. (2003). Ordinal Measurement in the Behavioral Sciences. New York, NY: Psychology Press.
18
CTCN (2019). Climate Change Strategies 2020.Copenhagen: Climate Technology Centre and Network (CTCN) and Witan Media Ltd.
19
Das R. Dandapath P. (2014). Existence and experience of Purba Medinipur coastal belt on its morpho-dynamic journey with the distinctive geology and geomorphology. Int. J. Sci. Res. 3, 1242–1251. Available online at: https://www.ijsr.net/get_abstract.php?paper_id=2014428
20
Das T. K. Das Gupta I. Lohar D. Bhattacharya B. (2011). Disasters in West Bengal: An Interdisciplinary Study.Kolkata: ACB Publications.
21
Dasgupta P. Mäler K. (2001). Wealth as a Criterion for Sustainable Development. London: Beijer International Institute of Ecological Economics.
22
Dasgupta S. Laplante B. Murray S. Wheeler D. (2009). “Climate change and the future impacts of storm-surge disasters in developing countries,” in Working Paper 182. Washington, DC: Centre for Global Development.
23
Dasgupta S. Laplante B. Murray S. Wheeler D. (2011). Exposure of developing countries to sea-level rise and storm surges. Clim. Change106, 567–579. 10.1007/s10584-010-9959-6
24
Dayton P. Curran S. Kitchingman A. Wilson M. Catenazzi A. J. R. (2005). “Coastal systems,” in Ecosystems and Human Well-Being: Current State and Trends, eds M. E. Assessment, R. Hassan, R. Scholes, and N. Ash (Washington, DC: Island Press), 513–550.
25
Drius M. Bongiorni L. Depellegrin D. Menegon S. Pugnetti A. Stifter S. (2019). Tackling challenges for Mediterranean sustainable coastal tourism: an ecosystem service perspective. Sci. Total Environ.652, 1302–1317. 10.1016/j.scitotenv.2018.10.121
26
Ellis R. N. Kroonenberg P. M. Harch B. D. Basford K. E. (2006). Non-linear principal components analysis: an alternative method for finding patterns in environmental data. Environmetrics17, 1–11. 10.1002/env.738
27
Engle N. L. (2011). Adaptive capacity and its assessment. Global Environ. Change21, 647–656. 10.1016/j.gloenvcha.2011.01.019
28
Fabricius C. Folke C. Cundill G. Schultz L. (2007). Powerless spectators, coping actors, and adaptive co-managers: a synthesis of the role of communities in ecosystem management. Ecol. Soc.12, 16. 10.5751/ES-02072-120129. Available online at: https://www.jstor.org/stable/26267828
29
Ferrari P. Annoni P. Salini S. (2005). “A comparison between alternative models for environmental ordinal data: nonlinear PCA vs rasch analysis,” in Proceedings of the 20th International Workshop on Statistical Modelling (Milan).
30
Ganguly P. Sharma S. (2015). Sustainable development of coastal tourism in Digha, West Bengal: An Investigation of Local Residents? Attitude. IJLTEMAS4, 34–44. Available online at: https://www.ijltemas.in/DigitalLibrary/Vol.4Issue3/34-44.pdf
31
Ghoussein Y. Mhawej M. Jaffal A. Fadel A. El Hourany R. Faour G. (2018). Vulnerability assessment of the South-Lebanese coast: A GIS-based approach. Ocean Coast. Manag.158, 56–63. 10.1016/j.ocecoaman.2018.03.028
32
Google Maps (2015). Retrieved from: https://maps.google.com/ (accessed September 17, 2015).
33
Government of West Bengal (2008). West Bengal Tourism Policy. Retrieved from: http://wbtourism.gov.in; http://wbtourism.gov.in/tourism_gb/files/document/Tourism_policy.pdf (accessed May 11, 2019).
34
Hazra S. Ghosh T. Baksi A. Ray N. (2001). Sea level change: its impact on West Bengal coast. Indian J. Geogr. Environ.6, 25–37. Available online at: http://inet.vidyasagar.ac.in:8080/jspui/bitstream/123456789/1169/2/geo_v6.pdf#page=29
35
Hindsley P. Yoskowitz D. (2020). Global change—Local values: Assessing tradeoffs for coastal ecosystem services in the face of sea level rise. Global Environ. Change61, 102039. 10.1016/j.gloenvcha.2020.102039
36
Hoegh-Guldberg O. Jacob D. Taylor M. Bindi M. Brown S. Camilloni I. et al . (2018). “Impacts of 1.5°C global warming on natural and human systems,” in Global Warming of 1.5°C. An IPCC Special Report on the Impacts of Global Warming of 1.5°C Above Pre-Industrial Levels and Related Global Greenhouse Gas Emission Pathways… and Efforts to Eradicate Poverty, eds V. Masson-Delmotte, P. Zhai, H.-O. Pörtner, D. Roberts, J. Skea, P. Shukla et al., (PCC Secretariat) 175–311. Available online at: http://hdl.handle.net/10138/311749
37
Huq S. Reid H. (2007). Community-based adaptation: a vital Approach to the Threat Climate Change Poses to the Poor. London: IIED Briefing, International Institute for Environment and Development.
38
IANS (2013). Available online at: https://www.indiatoday.in/india/story/west-bengal-heavy-rains-kolkata-215603-2013-10-26/india/story/west-bengal-heavy-rains-kolkata-215603-2013-10-26 (accessed August 13, 2017); Retrieved April 2, 2019, from www.indiatoday.in: https://www.indiatoday.in/india/story/west-bengal-heavy-rains-kolkata-215603-2013-10-26 (accessed August 13, 2017).
39
ICZMPWB (n.m.) . Digha Shankarpur Area integrated Beachfront Area Development Plan. Retrieved from: http://www.iczmpwb.org; http://www.iczmpwb.org/main/pdf/pea/Digha%20Shankarpur%20Integrated%20Beachfront%20Area%20Development%20Plan.pdf (accessed May 11 2019).
40
India Water Portal (2009). Cyclone Aila. Retrieved from: https://www.indiawaterportal.org (accessed February 24, 2016); https://www.indiawaterportal.org/articles/cyclone-aila-2009 (accessed February 24, 2016).
41
IPBES (2018). “The IPBES regional assessment report on biodiversity and ecosystem services for Asia and the Pacific,” in Secretariat of the Intergovernmental Science-Policy Platform on Biodiversity and Ecosystem Services, eds M. Karki, S. Senaratna Sellamuttu, S. Okayasu, and W. Suzuki (Bonn).
42
IPCC (2012). Managing the Risks of Extreme Events and Disasters to Advance Climate Change Adaptation. A Special Report of Working Groups I and II of the Intergovernmental Panel on Climate Change. Cambridge; New York, NY: Cambridge University Press.
43
IPCC (2014). Climate Change 2014: Synthesis Report. Contribution of Working Groups I, II and III to the Fifth Assessment Report of the Intergovernmental Panel on Climate Change. Geneva: IPCC.
44
IPCC (2018). “Summary for policymakers,” in Global Warming of 1.5°C. An IPCC Special Report on the Impacts of Global Warming of 1.5°C Above Pre-Industrial Levels and Related Global Greenhouse Gas Emission Pathways…and Efforts to Eradicate Poverty. Geneva: World Meteorological Organization.
45
Islam M. A. Mitra D. Dewan A. Akhter S. H. (2016). Coastal multi-hazard vulnerability assessment along the Ganges deltaic coast of Bangladesh–A geospatial approach. Ocean Coast. Manag.127, 1–15. 10.1016/j.ocecoaman.2016.03.012
46
Jain M. Naeem S. Orlove B. Modi V. DeFries R. S. (2015). Understanding the causes and consequences of differential decision-making in adaptation research: adapting to a delayed monsoon onset in Gujarat, India. Global Environ. Change31, 98–109. 10.1016/j.gloenvcha.2014.12.008
47
Jana A. Biswas A. Maiti S. Bhattacharya A. K. (2014). Shoreline changes in response to sea level rise along Digha Coast, Eastern India: an analytical approach of remote sensing, GIS and statistical techniques. J. Coast. Conserv.18, 145–155. 10.1007/s11852-013-0297-5
48
Jana S. (2020). Micro-level coastal vulnerability assessment in relation to post-Aila landscape alteration at the fragile coastal stretch of the Sagar Island, India. Reg. Stud. Mar. Sci.33, 100908. 10.1016/j.rsma.2019.100908
49
Kaya E. Agca M. Adiguzel F. Cetin M. (2019). Spatial data analysis with R programming for environment. Human Ecol. Risk Assess.25, 1521–1530. 10.1080/10807039.2018.1470896
50
Kuhl L. Van Maanen K. Scyphers S. (2020). An analysis of UNFCCC-financed coastal adaptation projects: assessing patterns of project design and contributions to adaptive capacity. World Dev.127, 104748. 10.1016/j.worlddev.2019.104748
51
Kumar R. Rani S. Maharana P. (2021). Assessing the impacts of Amphan cyclone over West Bengal, India: a multi-sensor approach. Environ. Monit. Assess.193, 1–21. 10.1007/s10661-021-09071-5
52
Lau J. D. Hicks C. C. Gurney G. G. Cinner J. E. (2019). What matters to whom and why? Understanding the importance of coastal ecosystem services in developing coastal communities. Ecosyst. Serv.35, 219–230. 10.1016/j.ecoser.2018.12.012
53
Linting M. van der Kooij A. (2012). Nonlinear principal components analysis with CATPCA: a tutorial. J. Pers. Assess.94, 12–25. 10.1080/00223891.2011.627965
54
Liu C. Yang M. (2020). An empirical analysis of dynamic changes in ecological sustainability and its relationship with urbanization in a coastal city: the case of Xiamen in China. J. Clean. Prod.256, 120482. 10.1016/j.jclepro.2020.120482
55
Lopez-Marrero T. (2010). An integrative approach to study and promote natural hazards adaptive capacity: a case study of two flood-prone communities in Puerto Rico. Geogr. J.176, 150–163. 10.1111/j.1475-4959.2010.00353.x
56
Maddala G. S. (1994). Econometric Methods and Applications. Edward Elgar Publishing.
57
Martínez M. L.-M. (2007). The coasts of our world: ecological, economic and social importance. Ecol. Econ.63, 254–272. 10.1016/j.ecolecon.2006.10.022
58
Millennium Ecosystem Assessment (2005). Ecosystems and Human Well-Being: Synthesis.Washington, DC: Island Press; World Resources Institute.
59
Mujabar P. S. Chandrasekar N. (2013). Coastal erosion hazard and vulnerability assessment for southern coastal Tamil Nadu of India by using remote sensing and GIS. Nat. Hazards69, 1295–1314. 10.1007/s11069-011-9962-x
60
Nath S. K. Roy D. Thingbaijam K. K. (2008). Disaster mitigation and management for West Bengal, India–An appraisal. Curr. Sci. 94, 858–864. Available online at: https://www.jstor.org/stable/24101732
61
National Disaster Management Authority India. (2017). District Action Plan for Disaster Preparedness, Purba Medinipur. Tamluk: National Disaster Management Authority.
62
National Disaster Management Authority India.. (2012–2013). Multi Hazard District Disaster Management Plan, District- Purba Medinipur. Tamluk: National Disaster Management Authority, India.
63
Nayak S. (2017). Coastal zone management in India– present status and future needs. Geospatial Inf. Sci.20, 174–183. 10.1080/10095020.2017.1333715
64
Neumann B. Vafeidis A. T. Zimmermann J. Nicholls R. J. (2015). Future coastal population growth and exposure to sea-level rise and coastal flooding-a global assessment. PLoS ONE10:118571. 10.1371/journal.pone.0118571
65
Pelling M. High C. (2005). Understanding adaptation: What can social capital offer assessments of adaptive capacity?Global Environ. Change15, 308–319. 10.1016/j.gloenvcha.2005.02.001
66
Penalba L. M. Elazegui D. D. (2011). Adaptive Capacity of Households, Community Organizations and Institutions for Extreme Climate Events in the Philippines.Singapore: EEPSEA, IDRC Regional Office for Southeast and East Asia.
67
Phadikar A. (2017). Seafront drive plan in Digha. The Telegraph. Tamluk: The Telegrpah.
68
Roy J. Datta S. Kapuria P. Guha I. Banerji R. Rao S. et al . (2016). Coastal ecosystem and changing economic activities and vulnerabilities along Chinese and South Asian Coasts. APN Sci. Bull. 21–6. 10.30852/sb.2016.21
69
Roy J. Ratnasiri J. Miah M. G. Islam M. R. Chen S. Rao S. et al . (2015). Coastal Ecosystem and Changing Economic Activities: Challenges for Sustainability Transition along Chinese and South Asian Coasts.Kobe: Asia Pacific Network for Global Change Research.
70
Santra Mitra S. Santra A. Mitra D. (2013). Change detection analysis of the shoreline using toposheet and satellite image: a case study of the coastal stretch of Mandarmani-Shankarpur, West Bengal, India. Int. J. Geomat. Geosci. 3. Available online at: https://www.indianjournals.com/ijor.aspx?target=ijor:ijggs&volume=3&issue=3&article=004
71
Smit B. Burton I. Klein R. J. Wandel J. (2000). An anatomy of adaptation to climate change and variability. Clim. Change45, 223–251. 10.1023/A:1005661622966
72
The Hindu (2005). The Hindu. Retrieved from: https://www.thehindu.com/; http://www.thehindu.com/205/01/28/stories/2005012803011800.htm (accessed December 12, 2014).
73
The Hindu (2019). Cyclone Fani | Live Updates: Aerial Survey Shows Extensive Damage Around Puri. Retrieved from: https://www.thehindu.com/; https://www.thehindu.com/news/national/cyclone-fani-live-updates-odisha-andhra-pradesh-west-bengal/article27019974.ece (accessed May 15, 2019).
74
The Hindu Business Line (2013). The Hindu Business Line. Retrieved from: https://www.thehindubusinessline.com/; http://www.thehindubusinessline.com/todays-paper/tp-economy/pollution-threatens-digha-sea-resort/article1751774.ece (accessed December 12, 2014).
75
TOI (2012). The Times of India. Retrieved from: https://timesofindia.indiatimes.com/; http://timesofindia.indiatimes.com/city/kolkata/Mandarmani-hotels-draw-Mamata-ire/articleshow/11481033.cms (accessed February 1, 2015).
76
UNEP (2006). Marine and Coastal Ecosystems and Human Well-Being Synthesis Report UNEP.
77
Valdivia C. Dunn E. G. Jetté C. (1996). Diversification as a risk management strategy in an Andean agropastoral community. Am. J. Agric. Econ.78, 1329–1334. 10.2307/1243516
78
Wooldridge J. M. (2016). Introductory Econometrics: A Modern Approach. Boston: Nelson Education.
79
World Bank (2010). Economics of Adaptation to Climate Change: Social Synthesis Report. Washington, DC: World Bank.
80
Yohe G. Tol R. S. (2002). Indicators for social and economic coping capacity- moving toward a working definition of adaptive capacity. Global Environ. Change12, 25–40. 10.1016/S0959-3780(01)00026-7
Summary
Keywords
adaptive capacity, vulnerable coastal population, coastal ecosystem-based livelihood practices, income security, Bay of Bengal
Citation
Datta S and Roy J (2022) Exploring adaptive capacity: Observations from the vulnerable human-coastal environmental system of the Bay of Bengal in India. Front. Clim. 4:1007780. doi: 10.3389/fclim.2022.1007780
Received
30 July 2022
Accepted
04 November 2022
Published
13 December 2022
Volume
4 - 2022
Edited by
Ayyoob Sharifi, Hiroshima University, Japan
Reviewed by
Hakna Ferro Azcona, UNADE American University of Europe, Mexico; Sandipan Ghosh, Chandrapur College, India
Updates
Copyright
© 2022 Datta and Roy.
This is an open-access article distributed under the terms of the Creative Commons Attribution License (CC BY). The use, distribution or reproduction in other forums is permitted, provided the original author(s) and the copyright owner(s) are credited and that the original publication in this journal is cited, in accordance with accepted academic practice. No use, distribution or reproduction is permitted which does not comply with these terms.
*Correspondence: Satabdi Datta sdatta.eco@gmail.com
This article was submitted to Climate Adaptation, a section of the journal Frontiers in Climate
Disclaimer
All claims expressed in this article are solely those of the authors and do not necessarily represent those of their affiliated organizations, or those of the publisher, the editors and the reviewers. Any product that may be evaluated in this article or claim that may be made by its manufacturer is not guaranteed or endorsed by the publisher.