Abstract
In addition to reducing carbon dioxide (CO2) emissions, actively removing CO2 from the atmosphere is widely considered necessary to keep global warming well below 2°C. Ocean Alkalinity Enhancement (OAE) describes a suite of such CO2 removal processes that all involve enhancing the buffering capacity of seawater. In theory, OAE both stores carbon and offsets ocean acidification. In practice, the response of the marine biogeochemical system to OAE must be demonstrably negligible, or at least manageable, before it can be deployed at scale. We tested the OAE response of two natural seawater mixed layer microbial communities in the North Atlantic Subtropical Gyre, one at the Western gyre boundary, and one in the middle of the gyre. We conducted 4-day microcosm incubation experiments at sea, spiked with three increasing amounts of alkaline sodium salts and a 13C-bicarbonate tracer at constant pCO2. We then measured a suite of dissolved and particulate parameters to constrain the chemical and biological response to these additions. Microbial communities demonstrated occasionally measurable, but mostly negligible, responses to alkalinity enhancement. Neither site showed a significant increase in biologically produced CaCO3, even at extreme alkalinity loadings of +2,000 μmol kg−1. At the gyre boundary, alkalinity enhancement did not significantly impact net primary production rates. In contrast, net primary production in the central gyre decreased by ~30% in response to alkalinity enhancement. The central gyre incubations demonstrated a shift toward smaller particle size classes, suggesting that OAE may impact community composition and/or aggregation/disaggregation processes. In terms of chemical effects, we identify equilibration of seawater pCO2, inorganic CaCO3 precipitation, and immediate effects during mixing of alkaline solutions with seawater, as important considerations for developing experimental OAE methodologies, and for practical OAE deployment. These initial results underscore the importance of performing more studies of OAE in diverse marine environments, and the need to investigate the coupling between OAE, inorganic processes, and microbial community composition.
Introduction
Earth's climate is changing due to continued anthropogenic CO2 emissions, with very high emission scenarios causing a projected warming of over 4°C by 2100 (IPCC, 2021). The marine system is intimately linked to these climatic changes. Oceanic CO2 uptake leads to ocean acidification that, when combined with additional temperature and pollution stresses, may lead to marine ecosystem destabilization (Sabine et al., 2004; National Research Council, 2010; Riebesell and Tortell, 2011; Honisch et al., 2012). In addition to managing the climate crisis, an additional focus should be placed on maintaining ocean health and services.
Keeping warming well below 2°C is a major societal challenge, and will require policies that drastically reduce CO2 emissions (Rogelj et al., 2016; Meinshausen et al., 2022). Emissions reductions, while necessary, may require complementary actions that actively remove greenhouse gases from the atmosphere, known as Negative Emissions Technologies (NETs; Royal Society Royal Academy of Engineering, 2018; National Academies of Sciences Engineering and Medicine, 2019). One promising NET is ocean alkalinity enhancement (OAE), an umbrella term for a suite of processes focused on enhancing the buffering capacity of the ocean. Due to its effect on ocean chemistry, OAE would not only neutralize and sequester CO2, it would also offset a substantial portion of ocean acidification (Kheshgi, 1995; Caldeira and Rau, 2000; Renforth and Henderson, 2017; National Academies of Sciences Engineering and Medicine, 2022).
OAE is based on a geochemical earth-system feedback in which increasing atmospheric CO2 drives chemical weathering and dissolution of calcium carbonate, silicate, and oxide minerals on land (Hartmann et al., 2013; Renforth and Henderson, 2017; Renforth, 2019). Delivery of the resulting alkalinity and cations to the ocean raises its buffering capacity, allowing for mass transfer of CO2 from the atmosphere into the ocean. Because of these natural alkalinity feedbacks, the global ocean already holds ~60x more carbon than the atmosphere (Sigman and Boyle, 2000). However, these natural alkalinity feedbacks operate on 10,000–100,000 year timescales (Berner et al., 1983; Archer et al., 1998). The concept of OAE is to speed up this natural geochemical weathering process through engineered approaches (Kheshgi, 1995; Renforth and Henderson, 2017), decreasing its operational timescale to one capable of offsetting anthropogenic emissions (i.e., 1–10 GT C yr−1; IPCC AR6).
The biological effects of OAE approaches have been understudied (Bach et al., 2019; National Academies of Sciences Engineering and Medicine, 2022). The point-source nature of alkalinity introduction to the ocean means that temporal and regional gradients will exist in neutralization effectiveness (Burt et al., 2021) and in the extent of impact (Butenschön et al., 2021; Mongin et al., 2021). OAE may not simply restore ocean chemistry, or exactly reverse the biogeochemical effects of ocean acidification (Zickfeld et al., 2021). For example, there may be distinct responses to enhanced alkalinity inputs that will not be predicted based on the extensive research on the impacts of ocean acidification (National Research Council, 2010). Before being deployed at scale, the biogeochemical effects of OAE should be studied explicitly through experimentation.
In particular, because OAE will increase calcite saturation state, focus has been placed on assessing the response of marine calcifiers (Renforth and Henderson, 2017; Bach et al., 2019). Since calcification is a source of CO2 to the atmosphere (Frankignoulle et al., 1994), increased biological or inorganic CaCO3 production in response to higher saturation state would constitute a negative feedback on the ability of OAE to sequester carbon. Furthermore, the resulting ecosystem shifts could potentially impact export efficiency, leading to complex feedbacks on whole-ocean carbon storage through the operation of the biological pump (Bach et al., 2019).
Assessing the natural community response to alkalinity addition is key to scaling OAE approaches. To date, experimental OAE impact studies have focused on individual species in culture. For example, coralline algae demonstrated increased calcification in response to higher alkalinity at constant pCO2, with no measurable effect on photosynthesis (Gore et al., 2018). This increased calcification response would constitute a negative feedback to OAE. In a separate study, some larger marine organisms were able to withstand magnesium bicarbonate concentrations >10 mM with minimal ecotoxicological impact, suggesting a relatively high tolerance for enhanced alkalinity (Gim et al., 2018). Individual cultured organisms are crucial for understanding mechanistic physiological responses to environmental forcings. However, there may be interactions at the community scale that are not captured in these laboratory cultures, both because of trophic interactions, and because cultured organisms are not necessarily the same as those found in the natural environment.
In this study, we focus on two questions: (1) Does alkalinity enhancement provoke a biogeochemical response from the natural marine community, and is it dose-dependent or independent of dosage? And (2) Is the response consistent or variable across different locations? The North Atlantic Ocean is a particularly important region to characterize because it accounts for ~25% of all contemporary oceanic CO2 uptake from the atmosphere (Friedlingstein et al., 2020) despite comprising only 15% of the global ocean surface, and is a key deepwater formation location (Sigman and Boyle, 2000), meaning that OAE in the North Atlantic may lead to rapid carbon sequestration and long stored CO2 residence times. Oligotrophic regions are important ecologically, due to their geographic extent in both the Atlantic and Pacific basins (Polovina et al., 2008).
To begin to address these questions, we conducted short-term incubations in which we amended natural seawater with three amounts of alkalinity at two sites in the North Atlantic Subtropical Gyre. These incubations were designed to test the short-term stress-response of natural communities to alkalinity enhancement. We added pure carbonate alkalinity while holding seawater pCO2 constant. This approach simulates an alkalinity addition that has already reacted with gaseous CO2 such that it is fixed and stable as bicarbonate. In this way, we alleviate the need to continuously aerate the experiments; separate compounding effects of cation addition (Bach et al., 2019) or degassing (Rau et al., 2007); and distinguish the effect of added alkalinity from ocean acidification studies aimed solely at changing seawater pCO2 (Meyer and Riebesell, 2015). Our three alkalinity additions (low, medium, high) were chosen to fall in the range of scenarios C and D from Renforth and Henderson (2017), simulating conditions ranging from extensive, equilibrated alkalinity addition to rapid, moderate impact alkalinity addition.
Location and methods
Station locations
Incubations were conducted at two locations in the North Atlantic Subtropical Gyre during the 2020 occupation of the 24.5°N longitudinal section on the RRS James Cook (JC191; experiment stations subsequently called “Alkaline Ocean I and II” or AOI and AOII; Table 1). Wintertime in the subtropical gyre is typically characterized by low and stable primary production (Figure 1; Henson et al., 2009). AOI was conducted at the gyre boundary close to the Bahamas, where the base ecosystem is characterized by relatively high, diatom-dominated production (Luo et al., 2012). AOII was conducted in the central gyre, characterized by highly stable, low production, dominated by picophytoplankton, similar to the Bermuda-Atlantic Timeseries site at times of ultra-oligotrophy (Cavender-Bares et al., 2001). Seawater was sampled from both locations at 40 m water depth, with AOI being slightly colder and less saline (23.58°C, Salinity = 36.75) than AOII (23.71°C, Salinity = 37.53). The calculated mixed layer depth (MLD, determined as the depth where Δ°C = 1, Reynolds et al., 2014) was similar at both locations (123 m and 122 m, respectively) and both stations showed a deep fluorescence/chlorophyll max (121 m at AOI and 126 m at AOII). The two stations differed most in terms of biological production, with a weighted mean Chl a concentration above sampling depth of 0.099 mg m−3 at AOI, compared to 0.049 mg m−3 at AOII in the ultraoligotrophic central gyre.
Table 1
| Incubation | Lat/ Long | Date Time Started | Duration (hrs) | Treatment | NaHCO3(mg) | Na2CO3(mg) | Wt. Ratio | Alk:DIC | Alk Increase (μeq kg−1) |
|---|---|---|---|---|---|---|---|---|---|
| AOI | 26° 30' N 76° 9' W | 25-01-2020 05:00 | 96 | Ctrl | 0 | 0 | 0 | 1.166 | 0 |
| Low | 982.4 | 409.9 | 2.397 | 1.248 | 511 | ||||
| Medium | 1909.4 | 857.4 | 2.227 | 1.262 | 1024 | ||||
| High | 3666.9 | 1814.5 | 2.021 | 1.282 | 2050 | ||||
| AOII | 23° 34' N 41° 28' W | 15-02-2020 01:45 | 96 | Ctrl | 0 | 0 | 0 | 1.166 | 0 |
| Low | 980.8 | 413.3 | 2.373 | 1.250 | 512 | ||||
| Medium | 1912.9 | 857.6 | 2.231 | 1.262 | 1025 | ||||
| High | 3668.6 | 1815.9 | 2.020 | 1.282 | 2051 |
Experiment details for both locations, including alkalinity spike information.
Figure 1

A map of the North Atlantic Subtropical Gyre, with marked station locations for the study (see Table 1 for coordinates). The background is the mean satellite-derived chlorophyll-a (Chl-a), averaged for the months of January and February, 2020.
Alkalinity enhancement
Three alkalinity spikes (low, medium, and high) were made by weighing out mixtures of NaHCO3 and Na2CO3 salts, each with alkalinity to dissolved inorganic carbon (Alk:DIC) ratios calculated to maintain constant pCO2 (Table 1). The benefit to maintaining constant pCO2 is twofold. First, it eliminates large pCO2 gradients between the experiments and the surrounding medium (both air and the flow-through incubator seawater; see below). This approach ensures that CO2 exchange does not impact the carbonate chemistry over the experiment duration. Second, adding carbon as well as alkalinity allows for larger alkalinity additions without causing extremely high carbonate ion concentrations (and therefore CaCO3 saturation states).
Salt mixtures were stored dry and transported in individual 50 mL Falcon tubes. Immediately before seawater collection, salt mixtures were dissolved into 50 mL of milli-Q water and shaken until completely dissolved. The 13C primary production spike was prepared separately. A smaller amount of NaH13CO3 was weighed into a 15 mL Falcon tube and stored as a dry salt. Before the first incubation, this spike was fully dissolved into 15 mL milliQ water, for a spike concentration of ~0.2 M. The spike was then kept sealed, refrigerated, and in the dark over the course of the cruise, for use in both sets of incubations.
Incubations
We conducted all experiments with raw, natural seawater collected at night from 40 m depth using 10 L niskin bottles. Water from individual Niskins was combined into a large shaded tank and individual cubitainers were filled from this pooled reservoir. Four 9.5 L cubitainers (ColeParmer, Environmental Express® Cubitainer® Collapsible Polyethylene (PE) Containers) were filled for each treatment type (control, low, medium, and high) for a total of 16 cubitainers per location. To each of these cubitainers, 234 μL of the isotopic spike was added for a final [NaH13CO3] of 5.2 μM. To each cubitainer except for the four controls, 12.5 mL of alkalinity spike was added via 5 mL pipette. Cubitainers were capped and gently shaken to fully mix the spikes into the seawater. After full mixing, one randomly chosen cubitainer from each treatment was immediately sampled for all analyses as an initial “t0” sample. The remaining three cubitainers from each treatment type (control, low, medium, high, in triplicate; 12 in total) were placed in an on-deck flow-through incubator which maintained the containers at ambient surface temperature conditions over the experiment duration. Incubators were screened with light filters (Lee filters, 172 Lagoon Blue) to mimic the light conditions at the sampling depth. Ship movement, driven in accordance with wind and wave action, provided continuous, passive mixing.
At t0 and after 96 h (tf), incubations were quenched by removing the cubitainers in a random order and sampling the seawater for (1) DIC and total alkalinity (TA); (2) nutrients; (3) FlowCam (4) Flow cytometry; (5) total particulate carbon and nitrogen and δ13C; (6) particulate inorganic carbon. As with the initial water collection, all sampling was conducted at night and under light exclusion by covering the cubitainers with black bin bags. Each cubitainer was gently mixed by hand before each sample was taken.
Incubation subsampling
For DIC and total alkalinity, samples were collected in 250 mL borosilicate glass bottles following Dickson et al. (2007); after a 1% by-volume headspace was created the sample was poisoned by addition of 50 μL of saturated mercuric chloride solution and made air-tight by sealing with greased (Apiezon L) ground-glass stoppers and storing in the dark at room temperature. Samples were analyzed at the National Oceanography Center, Southampton, UK: DIC was measured by coulometry using a MARIANDA VINDTA 3C system (Mintrop, 2004), with CO2 extracted from a calibrated volume of sample by addition of 8% phosphoric acid in excess. TA was determined using a two-stage potentiometric open-cell titration using a Scripps Total Alkalinity Titration System (Dickson et al., 2003); weighed volumes were first acidified to pH 3.5-4 using hydrochloric acid while stirred and bubbled with air to remove evolved CO2, before the titration was continued to pH 3.0. The TA was determined using a non-linear least-squares fit of the equivalence point of the titration curve. Both analyses were calibrated using certified reference materials (Batches 180 and 191; Dickson, 2010). Mean accuracy based on repeat analyses of reference material was 0.95 μmol kg−1 (n = 4) for TA and−0.37 μmol kg−1 (n = 9) for DIC.
For nutrients, brown HDPE bottles were filled directly from the incubation cubitainers after rinsing three times with the incubation water and stored chilled until onboard analysis. Inorganic nutrients in micro-molar concentrations were analyzed on board of the R/V James Cook on a 4-Channel AA3 autoanalyzer (Seal analytical). Samples were analyzed within 8 h after collection and measured against certified reference material (KANSO). Long-term measurement uncertainties were assessed by repeat measurements of Niskin samples over the cruise duration. Over 10 random Niskin bottle samples with 10 replicates each (n = 100), long-term standard deviations were 0.033 μM (silicate), 0.003 μM (phosphate), 0.011 μM (nitrate), and 0.004 μM (nitrite).
Biological and particulate sampling
For FlowCam, a 15 mL Falcon tube was filled with incubation seawater, followed by 37.5 μL of glutaraldehyde (to achieve 0.25% final concentration). Samples were immediately stored at 4°C. FlowCam samples were analyzed on a FlowCam VS1 (Fluid Imaging Technologies) in a 100 μm flow cell under 10x magnification and the use of a colorimeter-inlet, allowing for the determination of particles with a size range from 2 to 100 μm. The preserved sample water was injected into the flowcell with a flow rate of 0.150 ml min−1, each sample was analyzed in triplicate. Instrument performance was checked with a sample of diatom-rich coastal seawater at the beginning of each analytical session. Using the method of Clauset et al. (2009), the distribution of particle sizes in each sample was fit with a power-law probability distribution, i.e., p(D) = A(ξ) (D/2)−ξ, where D is a particle's equivalent spherical diameter in μm, ξ is the power-law exponent that describes the relative abundance of smaller vs. larger particles, and A is a normalizing constant. A ξ = 3 means that 100 μm particles are 1000x rarer than 10 μm particles, whereas a ξ = 2 means that 100 μm particles are 100x rarer than 10 μm particles.
For flow cytometry analyses, 2 ml of incubation water were fixed with 20 μl glutaraldehyde (50 % solution), stored at 4°C for 12 h and then transferred into a −80°C freezer until analysis (Heywood et al., 2006). Flow cytometry samples were analyzed on a CyFlow Cube 8 (Sysmex). The determination of the planktonic community of Prochlorococcus, Synechococcus and picoeukaryotes was achieved by analyzing water samples at a flowrate of 0.5 μl s−1 immediately after defrosting and by gating each group based on their fluorescence signals against their size fractionation. For the determination of the bacterial community, sample water was stained with Sybr Green I DNA dye for 1 h at room temperature and then analyzed at a flowrate of 1 μl s−1. The distinction between High (Hnac) and Low nucleic acid bacteria (Lnac) was achieved by gating according to the fluorescence signal against the differentiation in size. We adopted the autotrophic:hetotrophic biomass framework outlined by Calvo-Díaz et al. (2011) to analyze the total change in the autotrophic potential of our experiments. Although we do not have comparable size/volume scaling laws for our flow cytometry data, we calculate the autotrophic:heterotrophic count ratio (AC:HC) by dividing the total autotrophic counts (Synechococcus+Prochlorococcus+picoeukaryotes) by the total bacterial counts (Lnac + Hnac bacteria).
For particulates, the remaining 7 L of seawater was filtered through a 25 mm combusted GF/F filter via peristaltic pump. Filters were stored in combusted foil at −20°C on the ship. Once returned to land, filters were oven-dried at 60°C overnight. Dry 25 mm filters were cut in half using a sterilized ceramic blade on a gridded, backlit cutting plate. A half-filter was wrapped in an 8 × 7 mm tin capsule (EA Consumables), and double-wrapped if the filter was not completely enclosed. Samples were placed in a 48-well plate and sent to the UC Davis Stable Isotope Facility for total particulate carbon (PC), nitrogen (PN), and δ13C of PC using an elemental analyzer interfaced with an isotope ratio mass spectrometer. Limits of quantitation for PC and PN are 100 and 5 μg, respectively; long-term standard deviations on δ13C and δ15N are 0.2 and 0.3‰, respectively.
Particulate inorganic carbon (PIC) analysis was conducted on the second half of each 25 mm filter. Half-filters were placed into 12 mL Labco Exetainer tubes. Tubes were capped, evacuated, and filled with 4 mL of 10% phosphoric acid via syringe to convert all CaCO3 to CO2. Samples were then run on a Picarro-Automate autosampler system capable of measuring [CO2] and δ13C of CO2 (Subhas et al., 2019). Concentrations of CO2 were converted to a mass of CaCO3 using a standard curve of in-house Iceland Spar calcite; there was not enough CO2 to measure δ13C on these samples.
Assuming linear primary production kinetics, net primary production (μmol C kg−1 d−1) was calculated using the PC and δ13CPC data (Popp et al., 2006):
where τ is the turnover timescale in units of d−1, tf is the incubation duration in days, δ13Csw,t0t0 is the initial δ13C of the spiked seawater, δ13CPC,tf is the final δ13C of particulate carbon, and δ13CPC,t0t0 is the initial δ13C of particulate carbon measured at t0. Turnover time (in days) was estimated by taking the inverse of τ. NPP was calculated by multiplying [PC], the final particulate carbon concentration in μmol kg−1, by τ.
Statistical analyses
Results of all analyses were analyzed to determine the statistical significance of trends as a function of alkalinity addition. We examined both dose-dependent and binary (dosage-independent) responses in our data. In some cases, all alkalinity additions (low, medium, high) were grouped together and compared to the control experiments. In others, experimental triplicates were grouped along a vector of alkalinity addition intensity (i.e., control = 0, low = 1, medium = 2, high = 3) and trends were analyzed according to this intensity vector. Both the dose independent step-response (i.e., y = a if addition intensity is 0 and y = b if addition intensity is >0) and the dose dependent linear model (i.e., y = ax+b) have two free parameters (a, b). The model selected in each case was that whose corresponding control vector better correlated to the data. Statistical significance and correlations were assessed using the Kendall rank-correlation test (Kendall, 1938). This non-parametric correlation does not assume an a priori distribution of results and is therefore useful when assessing significance of variables where the underlying correlations are not well understood. We used Kendall's rather than Spearman's rank correlation because its p-values are more conservative (i.e., equal or larger). Each incubation was treated as an individual point, rather than taking the mean of triplicate incubations. Trends that demonstrated p > 0.1 were deemed statistically insignificant.
Results
Alkalinity enhancement and secondary CaCO3 precipitation
All measured and calculated parameters are provided in Supplementary Table 1 and are available online. Our alkalinity additions demonstrate an increase in measured TA and DIC (Figure 2A), consistent with the amount of spike added to each treatment (Table 1). The calculated calcite saturation state increased as a function of alkalinity addition (Figure 2B). At each site, seawater pCO2 (Figure 2C) was constant across treatments to within ±20 ppm (Figure 2C).
Figure 2
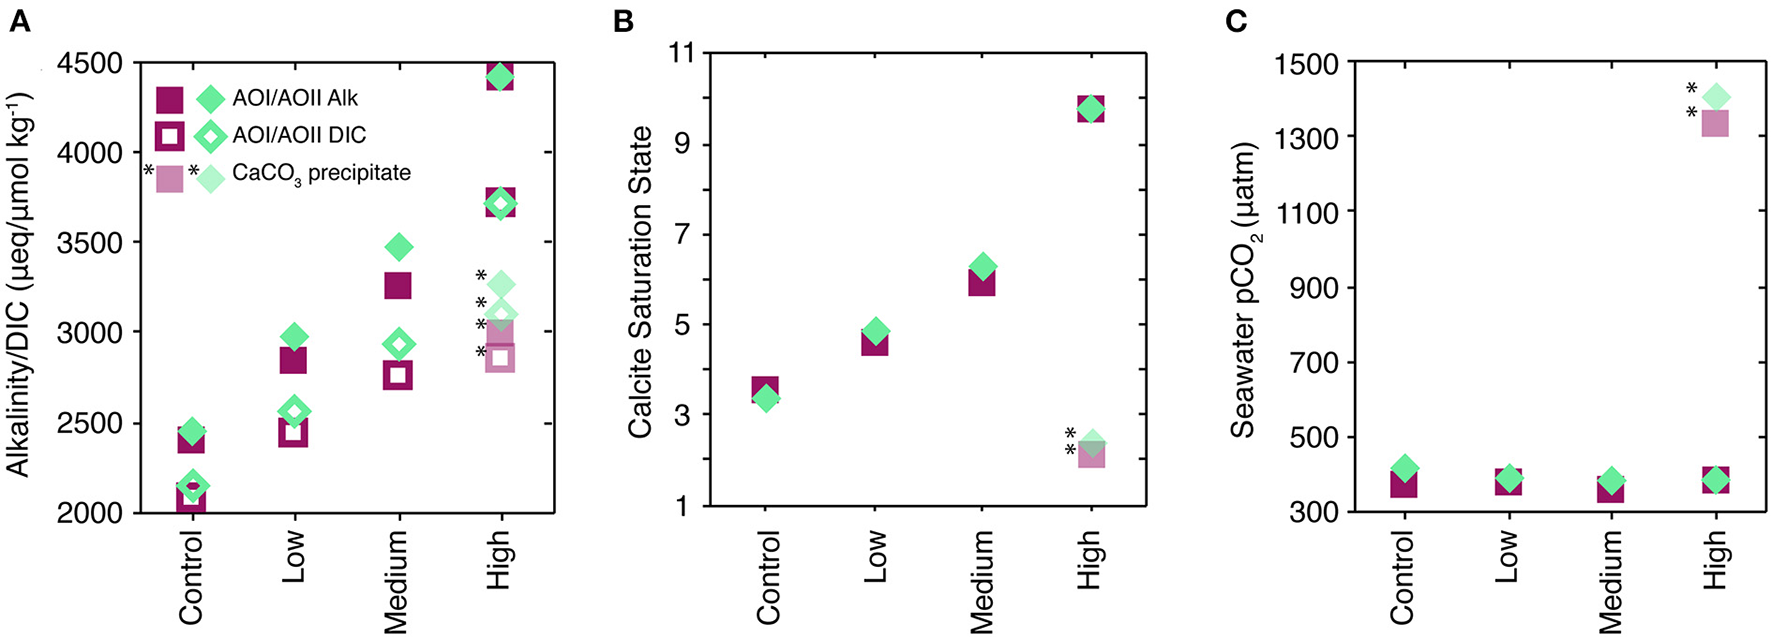
Carbonate system parameters for the experiments. All AOI symbols are magenta squares; all AOII samples are teal diamonds. (A) Shows adjusted alkalinity (Alk; filled symbols) and DIC (open symbols) for each treatment type, shown as the mean of final triplicate and initial t0 values. Note that the “control” case was only spiked with ~5 μmol kg−113C-bicarbonate, and essentially represents the in situ carbonate system. CaCO3 precipitation during sample storage led to anomalous measured values for the “High” treatment, indicated by the semi-transparent, starred symbols in each panel; see text for details. (B) Shows the calcite saturation state for each of the treatment types, using the Alk and DIC values from (A). (C) Shows seawater pCO2 calculated for each of the treatment types.
Calcite saturation reached >10 in the “high” addition experiments (Figure 2B), which appears to have caused CaCO3 nucleation and growth in our sample bottles (Sun et al., 2015). Measured alkalinity and DIC values for these samples were ~1,600 and 800 umol kg−1 lower than expected values, respectively, based on the amount of spike added (Figure 2A, Table 1, Supplementary Material). In Figure 2, we denote these measurements with asterisks and provide the estimated values based on the spike addition as solid symbols. Using the initial spike and seawater compositions, the ratio of the TA to DIC decrease in these samples was 1.8–2, consistent with CaCO3 precipitation. We also observed crystal precipitates on the glass sample bottle walls of all “high” treatments and one “medium” treatment. These precipitates readily dissolved when dripped with HCl, suggesting that they were CaCO3.
We posit that this calcite precipitation occurred during sample storage, and not during the 4-day incubations, for the following reasons. Calcite precipitation is typically facilitated by including calcite seeds (Burton and Walter, 1987). Because of the low measured PIC in all of our samples, calcite overgrowth onto suspended PIC was likely insignificant. We did not observe a dose-dependent increase in t0 PIC at AOI (Table 2). At AOII, there was a slight increase in t0 PIC with increased alkalinity dosing, but this increase disappeared over the course of the incubation (Table 2, Figures 5B,D and below). In any case, the measured 10–20 nmol L−1 increase in t0 PIC would not produce a measurable signal in TA or DIC. These results suggest that CaCO3 overgrowth on suspended PIC was likely minimal.
Table 2
| Location | AOI | AOII | ||||||
|---|---|---|---|---|---|---|---|---|
| Treatment | Control | Low | Medium | High | Control | Low | Medium | High |
| NO3 + NO2 (μmol kg−1) | 0.059 | 0.052 | 0.188* | 0.053 | 0.274 | 0.264 | 0.266 | 0.254 |
| PO4 (μmol kg−1) | 0.0225 | 0.0297 | 0.0454* | 0.0153 | 0.0003 | 0.0008 | 0.0057 | 0.0052 |
| SiO4 (umol kg−1) | 1.049 | 1.024 | 1.029 | 1.069 | 0.753 | 0.733 | 0.733 | 0.718 |
| PC (μmol L−1) | 1.07 | 1.12 | 1.13 | 0.93 | 1.00 | 0.92 | 0.82 | 0.93 |
| PN (μmol L−1) | 0.12 | 0.14 | 0.15 | 0.11 | 0.10 | 0.09 | 0.11 | 0.10 |
| PIC (nmol L−1) | 40 | 36 | 33 | 38 | 23 | 31 | 32 | 41 |
| PC δ13C (‰) | −23.3 | −22.8 | −22.2 | −23.1 | −23.1 | −24.1 | −24.8 | −25.1 |
| 103 Syn mL−1 | 13.8 | 14.8 | 20.2 | 22 | 36.1 | 13.9 | 7.7 | 4.6 |
| 103 Pro mL−1 | 274 | 170 | 128 | 112 | 111 | 73 | 63 | 59 |
| 103 Pico mL−1 | 1.77 | 1.97 | 1.84 | 2.23 | 2.34 | 2.14 | 2.08 | 2.45 |
| 106 ln bac mL−1 | 1.37 | 1.21 | 1.13 | 1.10 | 1.27 | 1.32 | 1.20 | 1.20 |
| 106 hn bac mL−1 | 1.47 | 1.22 | 1.14 | 1.11 | 1.12 | 1.17 | 1.01 | 1.03 |
| ξ | 2.37 | 2.13 | 2.07 | 2.02 | 2.08 | 2.41 | 2.10 | 1.96 |
| ξ std | 0.01 | 0.03 | 0.03 | 0.03 | 0.05 | 0.03 | 0.06 | 0.04 |
t0 information for all experiments at AOI and AOII.
Starred values are anomalous relative to other nutrient values; see text for discussion. PC, PN, and PIC stand for total particulate carbon, particulate nitrogen, and particulate inorganic carbon, respectively. Carbon isotopic composition of PC is relative to PDB. Syn, Pro, and Pico are flow cytometry-derived Syneccococcus, Prochlorococcus, and picoeukaryotes counts per milliliter, respectively. Low nucleic acid (Lnac) and high nucleic acid (Hnac) bacteria counts are also included. Flow cam-derived particle distribution exponents (ξ) and 1-sigma standard deviations (σξ) are provided. See text for the meaning of this exponent.
Calcium carbonate may have precipitated on the plastic walls of the cubitainer, although we did not observe any obvious precipitates or other growths on the cubitainer walls. Calcite nucleates much more slowly on non-CaCO3 substrates (e.g., quartz seeds, Lioliou et al., 2007), but we can use calcite-seeded CaCO3 precipitation rates (Burton and Walter, 1987; Zhong and Mucci, 1989; Morse et al., 2003; Lopez et al., 2009) as an absolute upper bound on the size of the precipitation effect during our 96-h experiments. Using these studies, we calculate a 4-day alkalinity decrease of 37–265 μmol kg−1, corresponding to a pCO2 increase of 7–70 ppm. These changes are relatively small compared to the −1,600 umol kg−1 Alk and +1,000 ppm pCO2 changes measured in the sample bottles (Figure 2, Supplementary Table 1).
Instead, it is more likely that the precipitation occurred during sample storage. Transfer from the 9.5L cubitainers to the 250-mL glass sample bottles provided a factor of 3 increase in surface area:volume, increasing the potential of precipitation on the glass bottle walls. Samples were stored for a long period of time before analysis (~18 months, because of limited laboratory/sample access due to COVID-19), giving ample time for nucleation and precipitation. We thus assume that inorganic CaCO3 precipitation during the 4-day experiments had a minimal effect on the carbonate chemistry during our experiments, and did not significantly impact the biogeochemical responses we observe. However, we suggest that this precipitation behavior may be consequential for seawater chemistry during sustained alkalinity additions in which saturation states >10 are maintained over longer time periods. In particular, the resulting sample bottle pCO2 of +1,000 ppm suggests that this process may switch alkalinity enhancement from an atmospheric CO2 sink to a CO2 source (Figure 2).
Initial conditions
Initial t0 samples from our experiments are shown in in Table 2 and Figure 3. At both stations, nitrate and phosphate concentrations were below 500 nmol kg−1, with slightly higher nitrate concentrations at AOII (~250 vs. 50 nmol kg−1), and higher phosphate concentrations at AOI (~20 vs. 1 nmol kg−1; Table 2). Silicate concentrations were slightly higher at AOI. Nitrate and phosphate concentrations in the AOI-“medium” experiment were raised; however nitrite and silicate did not show the same elevation (Table 2). Given the consistency of all other measurements and the nutrient trends we observe (Section Final conditions), we assume that this one sample was contaminated during nutrient subsampling, and contamination was not an issue for our incubations.
Figure 3
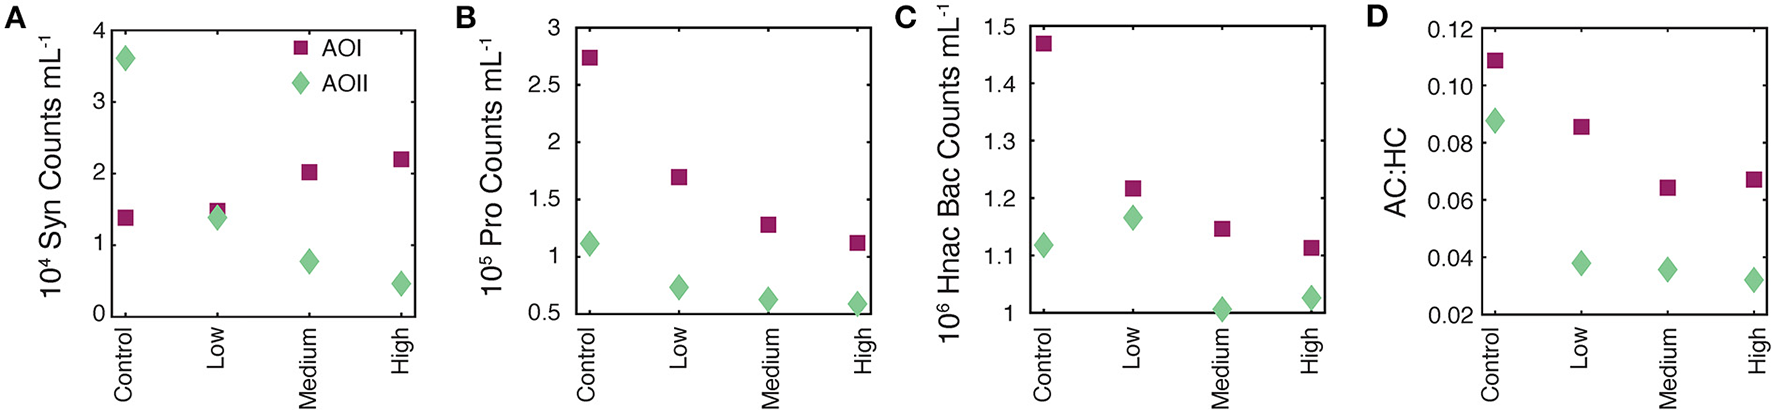
Flow cytometry data on t0 samples from all experimental treatments. In all panels, the magenta squares are AOI data and teal diamonds are AOII data. (A) 104Synecococcus counts per mL. (B) 105Prochlorococcus counts per mL. (C) 106 high nucleic acid bacterial (Hnac Bac) counts per mL. (D) Total autotrophic:heterotrophic count ratio [AC:HC = (Syn+Pro+Pico)/(Hnac Bac+Lnac Bac); see text for details].
Total particulate C (PC) and N (PN) were ~10% higher at AOI compared to AOII (Table 2). Particulate δ13C values were typical for surface bulk organic matter composition for the region (−22.8‰ and −24.2‰; Esposito et al., 2019; Close and Henderson, 2020). Total PIC concentrations were low at both stations—between 23 and 43 nmol L−1–with indistinguishable fractions of total carbon as CaCO3 (fCaCO3 ~ 3.5%, calculated on a molar basis).
Typically, initial values are used to establish consistency across incubations. Our t0 nutrient concentrations (nitrate+nitrite, nitrite, phosphate, and silicate) were stable across all alkalinity treatments, indicating no measurable nutrient contamination from the bicarbonate and carbonate salts (Table 2). However we did observe immediate, dose-dependent responses of some cell counts (Figure 3). Synechococcus counts at AOI remained constant or became elevated as a function of alkalinity addition (Figure 3A). The Prochlorococcus and Hnac bacterial counts declined as a function of alkalinity addition at both locations (Figures 3B,C). All responsive parameters showed the strongest decrease at the “high” dose, suggesting an immediate, dose-dependent response of the cell counts to the alkalinity addition. The t0 AC:HC decreased as a function of alkalinity addition at both locations, indicating a more substantial and immediate change in small-sized autotrophic counts relative to heterotrophic counts as a function of alkalinity addition (Figure 3D). We note that this metric does not account for larger autotrophs (e.g., diatoms and coccolithophores) or heterotrophs (e.g., zooplankton).
There are two potential indirect causes of these trends. First, microbial community effects could be the result of a time dependent sampling of the t0 cubitainers. Cubitainers were spiked in order, from control up to the high alkalinity dose. After spiking, the four t0 samples were immediately taken and filtered simultaneously, which took about an hour. It is unlikely that the strong response in cell counts occurred solely due to time-dependent sampling over the course of an hour. Alternatively, the effects could be due to the addition of toxic trace metals along with the alkalinity spikes. While possible, we used analytical grade reagents, and sampling/processing was done cleanly to avoid any such contamination. We also note that actual alkalinity addition will be accompanied by much larger additions of cations (e.g., Ca, Mg, and others; Bach et al., 2019), and thus these experiments represent a lower bound on microbial effects due to the addition of metal contaminants along with alkalinity. We therefore suggest that the alkalinity addition was the primary driver of our observed t0 cell counts.
The rapid response of these cell counts is hard to explain using a biological mechanism. Instead, we speculate that the mixing of our alkalinity spikes with seawater caused particle flocculation events, changing the cell concentrations in our flow cytometry subsamples. Alkaline flocculation is an established process for harvesting cells from seawater (Vandamme et al., 2015), with variable efficiencies for different microbial species (Lama et al., 2016). While circumstantial, the trends we observe are consistent with higher alkalinity enhancements leading to greater flocculation, thus causing greater decreases in cell counts directly after alkalinity addition (Figure 3, Table 2). Alkaline flocculation would also explain the differential species response to the alkalinity loading (different flocculation efficiencies), and if we happened to catch a floc during sampling, it would explain the apparent elevation of Syn at AOI. Finally, it could also explain the appearance and subsequent disappearance of PIC observed at AOII (Table 2, Sections Alkalinity enhancement and secondary CaCO3 precipitation, Final conditions).
Final conditions
At the end of the incubation (tf = 96 h), some parameters showed clear responses with notable differences between the AOI and AOII experiments. The dissolved (Figure 4) and particulate (Figure 5) responses are shown with means and standard deviations on top of the triplicate experiments. Initial t0 values are shown as gray points with the mean t0 value as a dashed gray line. Fits to the data were either performed as a linear regression, or a step-change between the control and all alkalinity addition experiments (e.g., Figure 4F vs. Figure 5F, respectively). Kendall p-values for all tf parameters are shown in Supplementary Table 2.
Figure 4
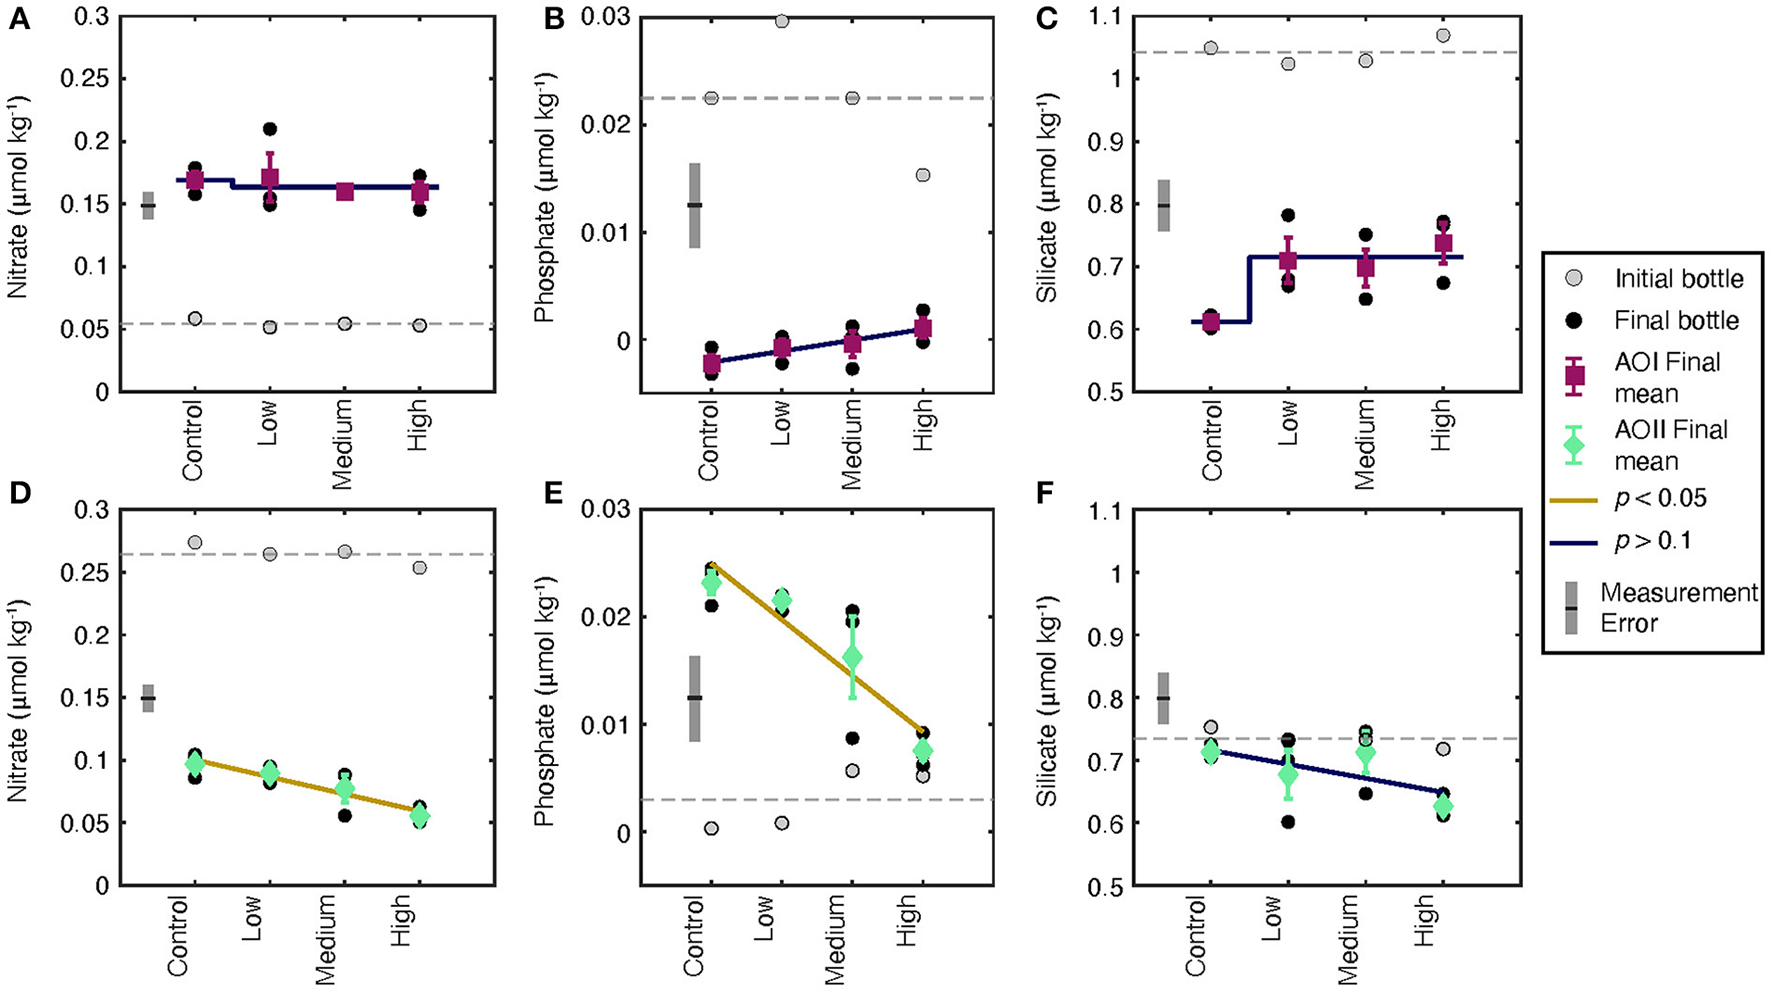
Dissolved nitrate, phosphate, and silicate concentrations for tf (black circles)and t0 (gray circles) at AOI (A–C) and AOII (D–F). The gray dashed line indicates the mean value of all t0 values. Each black circle is an individual experiment. Triplicate incubations for each condition are grouped, and the mean and standard deviation of the triplicates is shown as the colored symbol with error bars. Measurement errors determined from long-term repeat measurements over the cruise duration are shown as gray error bars. The trend shown is either a linear or step-change regression through the data. A blue line indicates an insignificant trend (p > 0.1, or within measurement error); a gold line indicates a significant trend (p < 0.05).
Figure 5

Particulate data collected from each incubation at AOI (A–C) and AOII (D–F). (A) Net primary production (NPP) as calculated in Equation 1. (B) PIC concentration in nanomoles per liter. (C) The autotrophic to heterotrophic count ratio (AC:HC). (D–F) Are the same as (A–C), but for AOII. All symbols, colors, and lines are the same as in Figure 3.
Nutrient concentrations changed from their initial values in almost all of our experimental treatments (Figure 3). Because many of our concentrations are very low, it is important to consider the measurement uncertainties and detection limits of these analyses. We show the long-term standard deviation of nutrient measurements as gray error bars on each plot for comparison to our data. At AOI, all incubations demonstrated increases in nitrate (Figure 3A), decreases in phosphate (Figure 3B), and decreases in silicate (Figure 3C) relative to t0. Final phosphate and silicate concentrations showed a small increase as a function of alkalinity dose, but these trends are not significant given the reported measurement uncertainties (Figures 3B,C). Compared to AOI, the final dissolved nutrients at AOII demonstrated completely opposite effects to alkalinity addition. Nitrate decreased and phosphate increased relative to t0 (Figures 3D,E). In addition, both nitrate and phosphate concentrations decreased as a function of alkalinity addition. These trends appear to be significant even when considering measurement uncertainties. Because we sampled cubitainers randomly, it is unlikely that the nutrient trends we observe are due to systematic, low-level contamination. Silicate did not significantly change from the control values (Figure 3F) with no significant effect of alkalinity dosing.
Measured particulate parameters share some similarities, and some differences, with the observed nutrient changes (Figure 4). Net primary production in the control experiments was slightly higher at AOI (0.13 μmol C kg−1 d−1, Figure 4A) compared to AOII (0.11 μmol C kg−1 d−1Figure 4D), consistent with the higher Chl-a and slightly higher PC concentrations at the gyre boundary. At AOI, we observed no significant effect on NPP (Figure 4A) or the final AC:HC (Figure 4C). At AOII, NPP decreased by ~30% across all alkalinity additions, although individual treatment values are variable (Figure 4D). The final AC:HC decreased, but not significantly (Figure 4F). We observed a no significant changes in PIC concentrations at either site (Figures 4B,E, Table 2).
The FlowCam data were used to generate particle size distributions for each experiment (Figure 5). As imaged particles in all cases were dominantly nondescript aggregates rather than e.g., living large diatom or dinoflagellate cells, we interpret these to be detrital particulate material contributing to particulate stocks, dynamics, and fluxes, and hence focus on their size, which is a key determinant of particle cycling and fluxes (Bianchi et al., 2018; Cael et al., 2021). If alkalinity addition changes the distribution of particle sizes, samples will follow a different slope of log(size) vs. log(number). We diagnosed this change by taking the difference in slope between the t0 and tf particle size distributions (Supplementary Table 1). As shown schematically in Figure 6A, a more negative change in this slope is indicative of a shift toward a greater number of smaller particles, and fewer larger particles. Alkalinity addition shifted the particle size distribution toward more negative slopes (i.e., toward more abundant small particles; Figure 6B). Considering the AOI data alone, this slope change was borderline significant (p = 0.06, Supplementary Table 2). Unfortunately, several of the AOII samples were lost after collection, meaning that only the “high” AOII samples could be analyzed. These AOII samples show a similar change in slope to the AOI data, indicating that both sites' particles are shifting toward smaller sizes. Pooling the AOI and AOII data together gives a more significant change in slope as a function of alkalinity dosage (p = 0.03, Supplementary Table 2, Figure 6B).
Figure 6

Analysis of tf particle size distributions from the FlowCam data. (A) shows a schematic of the change in slope on the particle size distribution; (B) shows measured changes in particle size distribution exponents as a function of treatment type for AOI (magenta points) and AOII (teal points), and combined points (“pooled,” magenta with teal outline).
Discussion
Primary production in the North Atlantic Subtropical Gyre
Given the longer incubation times of our experiments (4 days) compared with typical incubations (12–24 h, López-Sandoval et al., 2018), it is useful to compare our results with others from the region. In general, our incubation data is scattered, which may be caused by known bottle effects in microcosm incubations (Calvo-Díaz et al., 2011; Mahaffey et al., 2012). We did notice occasionally very high Synechococcus and Prochlorococcus cell counts in some final samples; these high counts may be due to the presence of phytoplankton-rich aggregates that can form through bacterial heterotrophy (Cruz and Neuer, 2019), or potentially through alkaline flocculation (Vandamme et al., 2015; Lama et al., 2016). We did not screen the seawater prior to incubation, so aggregates may have also formed due to zooplankton grazing. High cell counts in these samples also fits with our observations of detrital aggregates in the Flow Cam data (Section Final conditions). In spite of this variation, we observed general consistency between t0 and tf AC:HC (Figures 5C,F) and Synechococcus and Prochlorococcus cell counts (Supplementary Table 1). These agreements suggest that our incubations did not change in composition substantially over the course of the incubation, and gives us confidence in the incubation approach.
We also assess our incubation approach by comparing NPP rates to previous studies. Surface ecosystems in the subtropical oligotrophic gyre demonstrate low primary production rates (Poulton et al., 2006), coupled with strong nitrate (and phosphate) limitation (Davey et al., 2008; Moore et al., 2008, 2013). A majority of NPP data from this region comes from repeat occupations of the Atlantic Meridional Transect (AMT), a latitudinal transect that samples a wide range of biogeochemical provinces in the Eastern North Atlantic. The AMT is typically occupied either in March-April or September-October. In the North Atlantic Subtropical Gyre, most AMT stations are at the Eastern edge of the basin (often close to 20° W), whereas our stations are in the Western side at 76 °W (AOI) and just over the mid-Atlantic ridge at 41 °W (AOII, Table 1). Our incubations were conducted in January-February, and therefore both in terms of spatial and temporal comparisons, the AMT stations are useful but do not provide an exact match to our study locations. We do not expect the ~3-week difference between our two stations to contribute to differences between our two sites, given the relatively low, and stable, satellite-derived Chl-a in the subtropical gyre during January and February (Figure 1; Henson et al., 2009).
At AOI and AOII, we measured NPP rates of 0.13 ± 0.07 and 0.11 ± 0.01 μmol C L−1 d−1, respectively. In the North Atlantic Subtropical Gyre, NPP rates from 12 to 24 h 14C incubations vary from <0.1 to 0.4 μmol C L−1 d−1 (Marañón et al., 2000; Serret et al., 2001; Poulton et al., 2006). Poulton et al. reports NPP rates of 0.13–0.63 μmol C L−1 d−1 at the sea surface, and 0.04–0.12 μmol C L−1 d−1 at the chlorophyll maximum. Our rates sit at the lower and upper end of these ranges, respectively, consistent with our sampling depth (40 m) being between the surface and the chlorophyll maximum (around 120 m at our locations). In addition, the Chl-a concentration at 40° W is lower than the Chl-a concentration at 20° W, due to the large longitudinal gradient in Chl-a in the Eastern part of the gyre. It therefore follows that our NPP rates would be at the lower end of the reported range for AMT data, given our more westerly sampling locations. The general agreement between our NPP rates and these repeat-occupation AMT data gives us further confidence in our incubations, and in the effect of alkalinity enhancement on these parameters.
Alkalinity enhancement effects on seawater and its microbial communities
The minimal response of some key biogeochemical parameters (Figure 5) suggests that even high alkalinity enhancement does not cause a major stress response to these systems on the timescale of days. However, our results do demonstrate small but significant responses to alkalinity enhancement, such as the drop in NPP at AOII (Figure 4D). In general, we observe both dose-dependent effects (e.g., Figure 3) and binary responses (e.g., Figures 4C, 5F, 6). The dose-independent responses are apparent even at alkalinity additions of ~500 μeq kg−1 (Figure 2A), and suggest that ecosystems can respond quickly, but mildly, to such alkalinity additions. This addition magnitude is similar to average surface ocean conditions following extensive alkalinity addition combined with global limitation of carbon emissions (Ilyina et al., 2013; Renforth and Henderson, 2017). Of course, alkalinity enhancement within a dispersing plume may be much higher than this global mean value (Renforth and Henderson, 2017). Even at constant pCO2, alkalinity enhancement will increase both pH and calcite saturation state (Figure 2), the combination of which may lead to nonlinear and/or threshold-like short-term community responses. We further stress that our short-term incubations do not necessarily represent the longer term response of these communities to sustained alkalinity enhancement.
One proposed metric for assessing the effects of OAE is the response of calcifying organisms such as coccolithophores (Renforth and Henderson, 2017; Bach et al., 2019). Because high alkalinity doses greatly increase saturation state even at fixed pCO2 (ΩCa > 10, Figure 2B), we expected to see higher PIC concentrations driven by this higher thermodynamic driving force for calcite precipitation. Indeed, during sample storage, we saw substantial inorganic CaCO3 precipitation on the bottle walls, suggesting that on the timescale of months to years, increased saturation states may impose a negative feedback on OAE, or even cause OAE to become a source of CO2 to the atmosphere (Figure 2; Renforth and Henderson, 2017). However over the course of the incubations—a timescale of days—the changes in PIC were insignificant, suggesting little to no alkalinity effect on biologically mediated CaCO3 precipitation. The small increase in t0 PIC largely disappeared over the 4-day incubation, with indistinguishable changes in PIC from t0 to tf, and across all incubations (Figures 5B,E). The lack of PIC response to calcite saturation state suggests that net community calcification at these sites likely does not respond to alkalinity enhancement, at least over the 4-day timescale investigated here.
A lack of calcification response in our experiments is inconsistent with calcification rate increases observed in cultured calcareous algae under OAE conditions (Gore et al., 2018). It is possible that open-ocean calcifiers respond differently than algae, particularly given the unique calcification strategy of coccolithophores (Erez, 2003; Young and Henriksen, 2003). Although not a perfect analog, ocean acidification experiments might give us some insight into the response of coccolithophores to alkalinity enhancement. While generally demonstrating decreases in calcification and PIC:POC, ocean acidification culture and mesocosm experiments over a range of timescales demonstrate a range of effect intensities, depending on the species studied and the style of carbonate chemistry manipulation (Meyer and Riebesell, 2015; Riebesell et al., 2017; D'Amario et al., 2020). By analogy, it is therefore unclear whether coccolithophores will increase calcification rates in response to OAE. Future work should target individual coccolith species and how they respond uniquely to OAE, both in culture and in natural settings (Riebesell et al., 2017; D'Amario et al., 2020).
The low and invariant PIC concentrations (and fCaCO3 ~2–3%) in these systems imply that coccolithophore production is not responsible for the 30% drop in NPP observed at AOII caused by alkalinity enhancement (Figure 5D). We can parse the NPP results in terms of changes in total [PC] and changes in turnover time (calculated as 1/τ; Equation 1, Supplementary Table 1). The turnover time at both AOI and AOII did not change significantly as a function of alkalinity dosing (Supplementary Table 2). At AOI there was little change in [PC] or turnover time over the course of the incubation, leading to a negligible alkalinity effect on total NPP (Supplementary Tables 1, 2, Figure 5D). In contrast, the final [PC] at AOII was slightly lower in the treatments relative to the control (Supplementary Tables 1, 2). Despite relatively constant turnover times, this drop in C inventory manifested as a decrease in NPP per unit carbon (Equation 1). The resiliency of these plankton communities are particularly salient given their importance to overall carbon fixation in the oligotrophic Subtropics (Poulton et al., 2006; Cáceres et al., 2017).
Our NPP results demonstrate mixed responses to OAE, and the corresponding nutrient data are difficult to interpret. The observed silicate drawdown at AOI (Figure 4C) indicates that there may have been increased diatom frustule production. In contrast, silicate concentrations remained stable over the incubation duration at AOII, suggesting little to no net silica production (Figure 4F). We observed a complete drawdown of phosphate at AOI (Figure 4B), suggesting that nutrients were being consumed to fuel NPP. However, nitrate concentrations increased (Figure 4A), suggesting a decoupling of N and P cycling during incubation. Nutrient results at AOII were similarly decoupled. We saw net nitrate drawdown, and a small but measurable increase in dissolved phosphate, particularly in the control (Figures 4D,E). These nutrient changes did not transfer to the particulate phase; there was no significant change in the particulate C:N ratio at either AOI or AOII (Supplementary Table 1).
The apparent decoupling between nitrate and phosphate may be related to mixotrophy in the North Atlantic Oligotrophic Gyre (Hartmann et al., 2012). Instead of algal control, bacterial clades may dominate the phosphate uptake (Zubkov et al., 2007), and may even contribute to nitrogen fixation (Dyrhman and Haley, 2006). This microbial control likely exerts an influence on the relationship between particulate and dissolved phases, and more importantly here, may impact the system's short-term response to alkalinity enhancement. The subtly different incubation responses at our two locations may be partially set by the oceanographic setting underlying these two communities. On the Western side of the gyre boundary, greater nutrient supply via submesoscale mixing with the Gulf Stream (Wenegrat et al., 2020) may support a more dynamic ecosystem compared to the more quiescent central gyre. Metagenomics and/or transcriptomics could help fully unpack the short-term shifts we observe. Regardless, our results underscore the importance of investigating the effects of alkalinity enhancement on a diverse set of marine ecosystems.
Alkalinity enhancement effects on particle size distributions
Particle size distributions appear to reflect the observed changes in biogeochemical parameters at both stations (Figure 6B). The barely significant particle size decrease at AOI (p = 0.06) is consistent with the minimal impact of alkalinity dosing on NPP, PIC, and AC:HC at that location (Figures 5A–C). Thus, despite some treatments displaying substantially smaller particle size distributions (e.g., the very negative “low” and “high' points, Figure 6B), the immediate biogeochemical impacts appear minimal. The available data from AOII “high” treatments demonstrate a significant decrease in slope of about 0.3 relative to t0. These AOII results are consistent with decreased NPP at high alkalinity doses, which may be driven by a relative increase in respiration causing increased disaggregation, as has been seen in natural systems (Bianchi et al., 2018; Omand et al., 2020). Overall, these slope changes imply about a factor of 2 increase in small particle abundances at the “high” alkalinity treatments.
A shift to smaller particle sizes may reflect changes in key biogeochemical processes. These processes may include community shifts and thus a change in the style of biomass production. In addition, particle size distributions are affected by aggregation and disaggregation processes that are important for carbon export more broadly (Burd and Jackson, 2009). Because our experiments were conducted in microcosm cubitainers, we did not directly measure sinking rates and we cannot speculate on the direct impact of this particle size distribution shift on carbon export. While the relationship between particle size and sinking speed is variable and can even be insignificant or negative in some cases (Iversen and Lampitt, 2020; Laurenceau-Cornec et al., 2020; Cael et al., 2021), metastudies indicate that on the whole larger particles sink more quickly through the water column than smaller ones, and the relationship between particle size and sinking speed is nearly always significantly positive (Laurenceau-Cornec et al., 2020; Cael et al., 2021). Measuring particle size distributions at locations where alkaline fluids are mixing with seawater may be especially important, given the potential for flocculation of biological material during seawater alkalinization (Figure 3; Vandamme et al., 2015). The relationship between particle size distributions and alkalinity enhancement must be further tested in more locations and ecosystems; but also in experimental systems at a variety of scales, including field trials.
Considerations for future OAE experiments and deployments
Microcosm incubations are a valuable oceanographic tool because of their relative simplicity, their feasibility, and their long history of use in testing responses of the microbial community to a variety of chemical stresses (Moore et al., 2013). It is therefore useful to follow well-established “microcosm” protocols (Mahaffey et al., 2012; Moore et al., 2013). Continuing these experiments will be a cost-efficient way to test the short-term response to OAE across a wide parameter space, on ships of opportunity, in dedicated OAE field trials, and in coastal seawater facilities. However, adapting the incubation approach to studying OAE requires specific methodological considerations. Our results underscore some issues for these experiments, and for OAE studies more generally.
First, careful consideration must be given to the method of alkalinity enhancement in natural community experiments. For air-equilibrated alkaline seawater, the disturbance to natural communities created by bubbling rules out sparging with air. In addition to its effects on the community, bubbling will equilibrate seawater with air, while surface seawater demonstrates a large range of pCO2 and is often out of equilibrium with the atmosphere (Cai et al., 2020). Therefore, it may be preferable to add alkalinity in a ratio that maintains the original pCO2 of the seawater (Table 1). This addition will require knowledge of the initial seawater carbonate chemistry, and potentially its variability through time. We recommend using underway pCO2 measurements (e.g., SOCAT, Bakker et al., 2016) and/or discrete TA/DIC analyses (e.g., GLODAP, Lauvset et al., 2021) to estimate the target site seawater pCO2, and design the alkalinity spikes to reach the desired pCO2 without the need for bubbling.
Second, the impact of abiotic CaCO3 precipitation must be considered when designing OAE experiments. While precipitation does not appear to have affected our biological results, it does place practical limits on alkalinity enhancement experiments. Here, even air-equilibrated alkalinity enhancements of +2,000 umol/kg caused CaCO3 precipitation and a subsequent elevation of seawater pCO2 well above atmospheric values (Figure 2). Experiments testing these high alkalinity enhancements should be carefully designed to mitigate the precipitation of CaCO3, and their potential effects on the biological system. Storage time of discrete samples for analyses of carbonate system parameters should be kept as short as possible. Currently, there are few studies that predict thresholds for CaCO3 precipitation in natural seawater (Pokrovsky, 1998; Moras et al., 2021; Hartmann et al., 2022), and these experiments should be prioritized. We suggest that alkalinity loadings be limited to ~+1,000 μmol kg−1 for biological experiments to avoid potential precipitation issues. Unequilibrated alkalinity loadings will need to be much lower. In addition to experimental concerns, it is likely that abiotic CaCO3 precipitation will set the practical carrying capacity for real-world OAE deployments, and thus set limits on their ultimate efficiency.
Third, we note the immediate effects of alkalinity addition on our cell counts, and speculate that they might be driven by flocculation during the mixing of alkaline solutions with seawater (Figure 3; Vandamme et al., 2015; Lama et al., 2016). Although our effects appeared to dissipate over the course of our incubations, they should be considered when designing future experiments and sampling strategies, and may be related to our observed changes in particle size distributions (Figure 6). We suggest that sufficient time be given between alkalinity spiking and initial sampling to minimize any possible flocculation effects on experimental results. Flocculation efficiency may be related to surface charge characteristics of particulate matter (Vandamme et al., 2015) and therefore may require dedicated study across a variety of different particle types found in natural seawater.
Conclusion
Given the potential for OAE to help society mitigate the worst effects of continued CO2 emissions, research must be performed to assess its viability and scalability. Clearly, OAE has the potential to neutralize a substantial portion of all anthropogenic CO2 emissions. However its scalability relies on a careful assessment of the associated risks to marine communities and ecosystems in situ. Here, we have demonstrated some measurable short-term effects of enhanced alkalinity on two natural microbial communities in the North Atlantic Subtropical Gyre, although many were not statistically significant. We note the potential for inorganic CaCO3 precipitation driven by high saturation states on the timescale of months to years, and the potential for flocculation of particulate cellular matter driven by the mixing of alkaline solutions with seawater. These effects place limits on our ability to test the effects of OAE at high alkalinity loadings, and potentially influence maximum addition thresholds. Despite these abiotic considerations, particulate calcium carbonate concentrations did not measurably increase in our incubations even at high saturation states, suggesting a negligible response of biological calcification to OAE. In addition, NPP remained constant at the gyre boundary station, and only moderately decreased at the central gyre station. These results suggest that a broader range of organisms, not just marine calcifiers, drive the ecosystem response to OAE.
The differing short-term stress responses at these two locations indicate that ocean ecosystems may exhibit unique responses to OAE, requiring a concerted effort to study these effects at multiple spatial and temporal scales. However, the relatively mild response of these systems demonstrates that alkalinity enhancement may not cause a major disturbance to primary production processes occurring in the oligotrophic subtropical gyre. Here we investigated the immediate effect of carbonate alkalinity alone, and future work should also focus on the multiple stressors associated with alkaline mineral dissolution into seawater (e.g., Mg, Ca, and trace constituent enhancements). It remains to be tested whether open-ocean microbial communities will be able to adjust to sustained, steady-state alkalinity addition. In any case, alkalinity point-sources and plumes, if deployed at scale, will likely need continual monitoring of these abiotic and microbial effects.
Funding
AS was supported through WHOI internal and Assistant Scientist Startup funding. LM and SR were supported by the University of Portsmouth Ph.D. scheme and the UK NERC National Capability programme CLASS (Climate Linked Atlantic Sector Science) ECR Fellowship. BC, AF, EM, and PB were supported by the UK NERC National Capability programme CLASS, grant number NE/R015953/1.
Publisher's note
All claims expressed in this article are solely those of the authors and do not necessarily represent those of their affiliated organizations, or those of the publisher, the editors and the reviewers. Any product that may be evaluated in this article, or claim that may be made by its manufacturer, is not guaranteed or endorsed by the publisher.
Statements
Data availability statement
The datasets generated for this study, along with the associated analysis scripts, can be found on Github at: https://github.com/bbcael/subhasetal.
Author contributions
BC and AS designed the research, synthesized the results, and performed calculations and regressions. LM performed the incubations. AS wrote the manuscript with help and input from all authors. All authors contributed to sample analysis. All authors contributed to the article and approved the submitted version.
Acknowledgments
We thank three reviewers for comments and suggestions that greatly improved this manuscript. We thank the science party and ship crew of the RRS James Cook during the JC191 expedition. We acknowledge that the Woods Hole Oceanographic Institution is located on, and has benefited directly from, the traditional and unceded lands of the Mashpee Wampanoag Tribe.
Conflict of interest
The authors declare that the research was conducted in the absence of any commercial or financial relationships that could be construed as a potential conflict of interest.
Supplementary material
The Supplementary Material for this article can be found online at: https://www.frontiersin.org/articles/10.3389/fclim.2022.784997/full#supplementary-material
References
1
ArcherD.KheshgiH.Maier-ReimerE. (1998). Dynamics of fossil fuel CO2 neutralization by marine CaCO3. Global Biogeochem Cycles.12, 259–276. 10.1029/98gb00744
2
BachL. T.GillS. J.RickabyR. E. M.GoreS.RenforthP. (2019). CO2 removal with enhanced weathering and ocean alkalinity enhancement: potential risks and co-benefits for marine pelagic ecosystems. Front. Climate1:7. 10.3389/fclim.2019.00007
3
BakkerD. C. E.PfeilB.LandaC. S.MetzlN.O'BrienK. M.OlsenA.et al. (2016). A multi-decade record of high-quality fCO2 data in version 3 of the Surface Ocean CO2 Atlas (SOCAT). Earth Syst. Sci. Data8, 383–413. 10.5194/essd-8-383-2016
4
BernerR. A.LasagaA. C.GarrelsR. M. (1983). Carbonate-silicate geochemical cycle and its effect on atmospheric carbon dioxide over the past 100 million years. Am. J. Sci.283:641. 10.2475/ajs.283.7.641
5
BianchiD.WeberT. S.KikoR.DeutschC. (2018). Global niche of marine anaerobic metabolisms expanded by particle microenvironments. Nat. Geosci. 11, 263–268. 10.1038/s41561-018-0081-0
6
BurdA. B.JacksonG. A. (2009). Particle aggregation. Ann. Rev. Mar. Sci. 1, 65–90. 10.1146/annurev.marine.010908.163904
7
BurtD. J.FröbF.IlyinaT. (2021). The sensitivity of the marine carbonate system to regional ocean alkalinity enhancement. Front. Climate3:624075. 10.3389/fclim.2021.624075
8
BurtonE. A.WalterL. M. (1987). Relative precipitation rates of aragonite and Mg calcite from seawater: temperature or carbonate ion control?Geology15, 111–114. 10.1130/0091-7613(1987)15<111:RPROAA>2.0.CO;2
9
ButenschönM.LovatoT.MasinaS.CaseriniS.GrossoM. (2021). Alkalinization scenarios in the mediterranean sea for efficient removal of atmospheric CO2 and the mitigation of ocean acidification. Front. Climate3:614537. 10.3389/fclim.2021.614537
10
CáceresC.RiveraA.GonzálezS.AnadónR.Phytoplankton community structure and dynamics in the North Atlantic subtropical gyre (2017). Progress in Oceanography. 151, 177–188, 10.1016/j.pocean.2016.12.003
11
CaelB. B.CavanE. L.BrittenG. L. (2021). Reconciling the size-dependence of marine particle sinking speed. Geophys. Res. Lett. 48:e2020GL091771. 10.1029/2020GL091771
12
CaiW. J.XuY. Y.FeelyR. A.WanninkhofR.JönssonB.AlinS. R.et al. (2020). Controls on surface water carbonate chemistry along North American ocean margins. Nat. Commun. 11:2691. 10.1038/s41467-020-16530-z
13
CaldeiraK.RauG. H. (2000). Accelerating carbonate dissolution to sequester carbon dioxide in the ocean: geochemical implications. Geophys. Res. Lett. 27, 225–228. 10.1029/1999GL002364
14
Calvo-DíazA.Díaz-PérezL.SuárezL. Á.MoránX. A. G.TeiraE.MarañónE. (2011). Decrease in the autotrophic-to-heterotrophic biomass ratio of picoplankton in oligotrophic marine waters due to bottle enclosure. Appl. Environ. Microbiol. 77, 5739–5746. 10.1128/AEM.00066-11
15
Cavender-BaresK. K.KarlD. M.ChisholmS. W. (2001). Nutrient gradients in the western North Atlantic Ocean: Relationship to microbial community structure and comparison to patterns in the Pacific Ocean. Deep Sea Research Part I: Oceanographic Research Papers.48, 2373–2395. 10.1016/s0967-0637(01)00027-9
16
ClausetA.ShaliziC. R.NewmanM. E. (2009). Power-law distributions in empirical data. SIAM Rev. 51, 661–703. 10.1137/070710111
17
CloseH. G.HendersonL. C. (2020). Open-ocean minima in δ13C values of particulate organic carbon in the lower euphotic zone. Front. Mar. Sci. 7:540165. 10.3389/fmars.2020.540165
18
CruzB. N.NeuerS. (2019). Heterotrophic bacteria enhance the aggregation of the marine picocyanobacteria prochlorococcus and synechococcus. Front. Microbiol. 10:1864. 10.3389/fmicb.2019.01864
19
D'AmarioB.PérezC.GrelaudM.PittaP.KrasakopoulouE.ZiveriP. (2020). Coccolithophore community response to ocean acidification and warming in the Eastern Mediterranean Sea: results from a mesocosm experiment. Sci. Rep. 10:12637. 10.1038/s41598-020-69519-5
20
DaveyM.TarranG. A.MillsM. M.RidameC.GeiderR. J.LaRocheJ. (2008). Nutrient limitation of picophytoplankton photosynthesis and growth in the tropical North Atlantic. Limnol. Oceanogr.53, 1722–1733. 10.4319/lo.2008.53.5.1722
21
DicksonA. (2010). Standards for ocean measurements. Oceanography23, 34–47. 10.5670/oceanog.2010.22
22
DicksonA.AfghanJ.AndersonG. (2003). Reference materials for oceanic CO2 analysis: a method for the certification of total alkalinity. Mar. Chem.80, 185–197. 10.1016/S0304-4203(02)00133-0
23
DicksonA. G.SabineC. L.ChristianJ. R. (2007). Guide to best practices for ocean CO2 measurements. PICES Spec. Publ.3:191. 10.25607/OBP-1342
24
ErezJ. (2003). The source of ions for biomineralization in foraminifera and their implications for paleoceanographic proxies. Rev. Mineral. Geochem. 2003:5410115. 10.2113/0540115
25
EspositoM.AchterbergE. P.BachL. T.ConnellyD. P.RiebesellU.TaucherJ. (2019). Application of stable carbon isotopes in a subtropical North Atlantic Mesocosm Study: a new approach to assess CO2 effects on the marine carbon cycle. Front. Mar. Sci. 6:616. 10.3389/fmars.2019.00616
26
FrankignoulleM.CanonC.GattusoJ. (1994). Marine calcification as a source of carbon dioxide: positive feedback of increasing atmospheric CO2. Limnol. Oceanogr. 39, 458–462. 10.4319/lo.1994.39.2.0458
27
FriedlingsteinP.O'SullivanM.JonesM. W.AndrewR. M.HauckJ.OlsenA.et al. (2020). Global carbon budget 2020. Earth Syst. Sci. Data12, 3269–3340. 10.5194/essd-12-3269-2020
28
GimB.-M.HongS.LeeJ.-S.KimN.-H.KwonE.-M.GilJ.-W.et al. (2018). Potential ecotoxicological effects of elevated bicarbonate ion concentrations on marine organisms. Environ. Poll. 241, 194–199. 10.1016/j.envpol.2018.05.057
29
GoreS.RenforthP.PerkinsR. (2018). The potential environmental response to increasing ocean alkalinity for negative emissions. Mitigat. Adapt. Strategies Glob. Change2018, 1–21. 10.1007/s11027-018-9830-z
30
HartmannJ.SuitnerN.LimC.SchneiderJ.Marín-SamperL.ArísteguiJ.et al. (2022). Stability of alkalinity in Ocean Alkalinity Enhancement (OAE) approaches – consequences for durability of CO2 storage. Biogeosci. Discuss. 2022:126. 10.5194/bg-2022-126
31
HartmannJ.WestA. J.RenforthP.KöhlerP.RochaC. L. D. L.Wolf-GladrowD. A.et al. (2013). Enhanced chemical weathering as a geoengineering strategy to reduce atmospheric carbon dioxide, supply nutrients, and mitigate ocean acidification. Rev. Geophys. 51, 113–149. 10.1002/rog.20004
32
HartmannM.GrobC.TarranG. A.MartinA. P.BurkillP. H.ScanlanD. J.et al. (2012). Mixotrophic basis of Atlantic oligotrophic ecosystems. Proc. Natl. Acad. Sci. 109, 5756–5760. 10.1073/pnas.1118179109
33
HensonS. A.DunneJ. P.SarmientoJ. L. (2009). Decadal variability in North Atlantic phytoplankton blooms. J. Geophys. Res.114:2008JC005139. 10.1029/2008JC005139
34
HeywoodJ. L.ZubkovM. V.TarranG. A.FuchsB. M.HolliganP. M. (2006). Prokaryoplankton standing stocks in oligotrophic gyre and equatorial provinces of the Atlantic Ocean: evaluation of inter-annual variability. Deep Sea Res. II53, 1530–1547. 10.1016/j.dsr2.2006.05.005
35
HonischB.RidgwellA.SchmidtD. N.ThomasE.GibbsS. J.SluijsA.et al. (2012). The geological record of ocean acidification. Science.335, 1058–1063. 10.1126/science.1208277
36
IlyinaT.Wolf-GladrowD.MunhovenG.HeinzeC. (2013). Assessing the potential of calcium-based artificial ocean alkalinization to mitigate rising atmospheric CO2 and ocean acidification. Geophys. Res. Lett. 40, 5909–5914. 10.1002/2013GL057981
37
IPCC (2021). Summary for policymakers, in Climate Change 2021: The Physical Science Basis. Contribution of Working Group I to the Sixth Assessment Report of the Intergovernmental Panel on Climate Change, eds Masson-DelmotteV.ZhaiP.PiraniA.ConnorsS. L.PéanC.BergerS.et al. (Cambridge; New York, NY: Cambridge University Press), 3–32.
38
IversenM. H.LampittR. S. (2020). Size does not matter after all: no evidence for a size-sinking relationship for marine snow. Progr. Oceanogr. 189:102445. 10.1016/j.pocean.2020.102445
39
KendallM. G. (1938). A new measure of rank correlation. Biometrika30, 81–93. 10.1093/biomet/30.1-2.81
40
KheshgiH. (1995). Sequestering atmospheric carbon dioxide by increasing ocean alkalinityEnergy20, 915–922. 10.1016/0360-5442(95)00035-F
41
LamaS.MuylaertK.KarkiT. B.FoubertI.HendersonR. K.VandammeD. (2016). Flocculation properties of several microalgae and a cyanobacterium species during ferric chloride, chitosan and alkaline flocculation. Bioresour. Technol. 220, 464–470. 10.1016/j.biortech.2016.08.080
42
Laurenceau-CornecE. C.MoigneF. A. C. L.GallinariM.MoriceauB.ToullecJ.IversenM. H.et al. (2020). New guidelines for the application of Stokes' models to the sinking velocity of marine aggregates. Limnol. Oceanog.65, 1264–1285. 10.1002/lno.11388
43
LauvsetS. K.LangeN.TanhuaT.BittigH. C.OlsenA.KozyrA.et al. (2021). An updated version of the global interior ocean biogeochemical data product, GLODAPv2.2021. Earth Syst. Sci. Data13, 5565–5589. 10.5194/essd-13-5565-2021
44
LioliouM. G.ParaskevaC. A.KoutsoukosP. G.PayatakesA. C. (2007). Heterogeneous nucleation and growth of calcium carbonate on calcite and quartz. J. Colloid Interface Sci. 308, 421–428. 10.1016/j.jcis.2006.12.045
45
LopezO.ZuddasP.FaivreD. (2009). The influence of temperature and seawater composition on calcite crystal growth mechanisms and kinetics: Implications for Mg incorporation in calcite lattice. Geochim. Cosmochim. Acta73, 337–347. 10.1016/j.gca.2008.10.022
46
López-SandovalD. C.Delgado-HuertasA.AgustíS. (2018). The 13C method as a robust alternative to 14C-based measurements of primary productivity in the Mediterranean Sea. J. Plankton Res.40, 544–554. 10.1093/plankt/fby031
47
LuoY. W.DoneyS. C.AndersonL. A.BenavidesM.Berman-FrankI.BodeA.et al. (2012). Database of diazotrophs in global ocean: abundance, biomass and nitrogen fixation rates. Earth Syst. Sci. Data4, 47–73. 10.5194/essd-4-47-2012
48
MahaffeyC.BjörkmanK.KarlD. (2012). Phytoplankton response to deep seawater nutrient addition in the North Pacific Subtropical Gyre. Marine Ecology Progress Series.460, 13–34. 10.3354/meps09699
49
MarañónE.HolliganP. M.VarelaM.MouriñoB.BaleA. J. (2000). Basin-scale variability of phytoplankton biomass, production and growth in the Atlantic Ocean. Deep Sea Res. I47, 825–857. 10.1016/S0967-0637(99)00087-4
50
MeinshausenM.LewisJ.McGladeC.GütschowJ.NichollsZ.BurdonR.et al. (2022). Realization of Paris Agreement pledges may limit warming just below 2°C. Nature604, 304–309. 10.1038/s41586-022-04553-z
51
MeyerJ.RiebesellU. (2015). Reviews and Syntheses: responses of coccolithophores to ocean acidification: a meta-analysis. Biogeosciences12, 1671–1682. 10.5194/bg-12-1671-2015
52
MintropL. (2004). Versatile Instruments for the Determination of Titration Alkalinity. Manual for Versions 3S and 3C, Rep. Kiel.
53
MonginM.BairdM. E.LentonA.NeillC.AklJ. (2021). Reversing ocean acidification along the Great Barrier Reef using alkalinity injection. Environ. Res. Lett. 16:064068. 10.1088/1748-9326/ac002d
54
MooreC. M.MillsM. M.ArrigoK. R.Berman-FrankI.BoppL.BoydP. W.et al. (2013). Processes and patterns of oceanic nutrient limitation. Nat. Geosci.6, 701–710. 10.1038/ngeo1765
55
MooreC. M.MillsM. M.LangloisR.MilneA.AchterbergE. P.RocheJ. L.GeiderR. J. (2008). Relative influence of nitrogen and phosphorous availability on phytoplankton physiology and productivity in the oligotrophic sub-tropical North Atlantic Ocean. Limnol. Oceanogr.53, 291–305. 10.4319/lo.2008.53.1.0291
56
MorasC. A.BachL. T.CyronakT.Joannes-BoyauR.SchulzK. G. (2021). Ocean Alkalinity Enhancement – avoiding runaway CaCO3 precipitation during quick and hydrated lime dissolution. Biogeosci. Discuss2021:330. 10.5194/bg-2021-330
57
MorseJ. W.GledhillD. K.MilleroF. J. (2003). Caco3 precipitation kinetics in waters from the great Bahama bank: implications for the relationship between bank hydrochemistry and whitings. Geochim. Cosmochim. Acta67, 2819–2826. 10.1016/S0016-7037(03)00103-0
58
National Academies of Sciences Engineering and Medicine (2019). Negative Emissions Technologies and Reliable Sequestration: A Research Agenda. Washington, DC: The National Academies Press.
59
National Academies of Sciences Engineering and Medicine (2022). A Research Strategy for Ocean-based Carbon Dioxide Removal and Sequestration. Washington, DC: The National Academies Press.
60
National Research Council (2010). Effects of Ocean Acidification on Marine Ecosystems (Chapter 4). Ocean Acidification: A National Strategy to Meet the Challenges of a Changing Ocean. Washington, DC: The National Academies Press.
61
OmandM. M.GovindarajanR.HeJ.MahadevanA. (2020). Sinking flux of particulate organic matter in the oceans: sensitivity to particle characteristics. Sci. Rep. 10:5582. 10.1038/s41598-020-60424-5
62
PokrovskyO. S. (1998). Precipitation of calcium and magnesium carbonates from homogeneous supersaturated solutions. J. Crystal Growth186, 233–239. 10.1016/S0022-0248(97)00462-4
63
PolovinaJ. J.HowellE. A.AbecassisM. (2008). Ocean's least productive waters are expanding. Geophys. Res. Lett.35:GL031745. 10.1029/2007GL031745
64
PoppB. N.BidigareR. R.DeschenesB.LawsE. A.PrahlF. G.TanimotoJ. K.et al. (2006). A new method for estimating growth rates of alkenone-producing haptophytes. Limnol. Oceanogr. 4, 114–129. 10.4319/lom.2006.4.114
65
PoultonA. J.HolliganP. M.HickmanA.KimY.-N.AdeyT. R.StinchcombeM. C.et al. (2006). Phytoplankton carbon fixation, chlorophyll-biomass and diagnostic pigments in the Atlantic Ocean. Deep Sea Res. II53, 1593–1610. 10.1016/j.dsr2.2006.05.007
66
RauG.KnaussK.LangerW.CaldeiraK. (2007). Reducing energy-related CO2 emissions using accelerated weathering of limestoneEnergy32, 1471–1477. 10.1016/j.energy.2006.10.011
67
RenforthP. (2019). The negative emission potential of alkaline materials. Nat. Commun. 10:1401. 10.1038/s41467-019-09475-5
68
RenforthP.HendersonG. (2017). Assessing ocean alkalinity for carbon sequestration. Rev. Geophys. 55, 636–674. 10.1002/2016RG000533
69
ReynoldsS.MahaffeyC.RoussenovV.WilliamsR. G. (2014). Evidence for production and lateral transport of dissolved organic phosphorus in the eastern subtropical North Atlantic. Glob. Biogeochem. Cycles28, 805–824. 10.1002/2013GB004801
70
RiebesellU.BachL. T.BellerbyR. G. J.MonsalveJ. R. B.BoxhammerT.CzernyJ.et al. (2017). Competitive fitness of a predominant pelagic calcifier impaired by ocean acidification. Nat. Geosci. 10, 19–23. 10.1038/ngeo2854
71
RiebesellU.TortellP. D. (2011) Effects of ocean acidification on pelagic organisms ecosystems, in Ocean Acidification, eds. GattusoJ.-P.HanssonL. (Oxford: Oxford University Press), 99–121.
72
RogeljJ.den ElzenM.HöhneN.FransenT.FeketeH.WinklerH.et al. (2016). Paris Agreement climate proposals need a boost to keep warming well below 2 °C. Nature534, 631–639. 10.1038/nature18307
73
Royal Society and Royal Academy of Engineering (2018). Greenhouse Gas Removal. London: Royal Society and Royal Academy of Engineering.
74
SabineC. L.FeelyR. A.GruberN.KeyR. M.LeeK.BullisterJ. L.et al. (2004). The oceanic sink for anthropogenic CO2. Science.305, 367–371. 10.1126/science.1097403
75
SerretP.RobinsonC.FernándezE.TeiraE.TilstoneG. (2001). Latitudinal variation of the balance between plankton photosynthesis and respiration in the eastern Atlantic Ocean. Limnol. Oceanogr. 46, 1642–1652. 10.4319/lo.2001.46.7.1642
76
SigmanD. M.BoyleE. A. (2000). Glacial/interglacial variations in atmospheric carbon dioxide. Nature.407, 859–869. 10.1038/35038000
77
SubhasA. V.McCorkleD. C.QuizonA.McNicholA. P.LongM. H. (2019). Selective preservation of coccolith calcite in ontong-Java plateau sediments. Paleoceanogr. Paleoclimatol. 10.1029/2019pa003731
78
SunW.JayaramanS.ChenW.PerssonK. A.CederG. (2015). Nucleation of metastable aragonite CaCO3 in seawater. Proc. Natl. Acad. Sci. U. S. A. 112, 3199–3204. 10.1073/pnas.1423898112
79
VandammeD.PohlP. I.BeuckelsA.FoubertI.BradyP. V.HewsonJ. C.et al. (2015). Alkaline flocculation of Phaeodactylum tricornutum induced by brucite and calcite. Bioresour. Technol. 196, 656–661. 10.1016/j.biortech.2015.08.042
80
WenegratJ. O.ThomasL. N.SundermeyerM. A.TaylorJ. R.D'AsaroE. A.KlymakJ. M.et al. (2020). Enhanced mixing across the gyre boundary at the Gulf Stream front. Proc. Natl. Acad. Sci. U. S. A. 117, 17607–17614. 10.1073/pnas.2005558117
81
YoungJ. R.HenriksenK. (2003). Biomineralization within vesicles: the calcite of coccoliths. Rev. Mineral. Geochem. 54, 189–215. 10.2113/0540189
82
ZhongS.MucciA. (1989). Calcite and aragonite precipitation from seawater solutions of various salinities: Precipitation rates and overgrowth compositions. Chem. Geol.78, 283–299. 10.1016/0009-2541(89)90064-8
83
ZickfeldK.AzevedoD.MathesiusS.MatthewsH. D. (2021). Asymmetry in the climate-carbon cycle response to positive and negative CO2 emissions. Nat Clim Chang.11, 613–617. 10.1038/s41558-021-01061-2
84
ZubkovM. V.MaryI.WoodwardE. M. S.WarwickP. E.FuchsB. M.ScanlanD. J.BurkillP. H. (2007). Microbial control of phosphate in the nutrient-depleted North Atlantic subtropical gyre. Environ. Microbiol.9, 2079–2089. 10.1111/j.1462-2920.2007.01324.x
Summary
Keywords
climate—change, ocean alkalinity enhancement, biogeochemistry, North Atlantic, carbon flux
Citation
Subhas AV, Marx L, Reynolds S, Flohr A, Mawji EW, Brown PJ and Cael BB (2022) Microbial ecosystem responses to alkalinity enhancement in the North Atlantic Subtropical Gyre. Front. Clim. 4:784997. doi: 10.3389/fclim.2022.784997
Received
28 September 2021
Accepted
06 July 2022
Published
25 July 2022
Volume
4 - 2022
Edited by
Soheil Shayegh, European Institute of Economics and the Environment, Italy
Reviewed by
Lennart Thomas Bach, University of Tasmania, Australia; Phillip Williamson, University of East Anglia, United Kingdom
Updates
Copyright
© 2022 Subhas, Marx, Reynolds, Flohr, Mawji, Brown and Cael.
This is an open-access article distributed under the terms of the Creative Commons Attribution License (CC BY). The use, distribution or reproduction in other forums is permitted, provided the original author(s) and the copyright owner(s) are credited and that the original publication in this journal is cited, in accordance with accepted academic practice. No use, distribution or reproduction is permitted which does not comply with these terms.
*Correspondence: Adam V. Subhas asubhas@whoi.edu
This article was submitted to Negative Emission Technologies, a section of the journal Frontiers in Climate
Disclaimer
All claims expressed in this article are solely those of the authors and do not necessarily represent those of their affiliated organizations, or those of the publisher, the editors and the reviewers. Any product that may be evaluated in this article or claim that may be made by its manufacturer is not guaranteed or endorsed by the publisher.