 Di Cai
 Gerrit Lohmann
 Xianyao Chen
 Monica Ionita
- 1Department of Paleoclimate Dynamics, Alfred Wegener Institute Helmholtz Center for Polar and Marine Research, Bremerhaven, Germany
- 2Frontier Science Center for Deep Ocean Multi-spheres and Earth System/Physical Oceanography Laboratory, Ocean University of China, Qingdao, China
- 3Laoshan Laboratory, Qingdao, China
- 4Physics Department, University of Bremen, Bremen, Germany
- 5Faculty of Forestry, “Stefan cel Mare” University of Suceava, Suceava, Romania
While the Arctic's accelerated warming and sea ice decline have been associated with Eurasian cooling, debates persist between those attributing this to sea ice retreat and those to internal variability. Our study examines the association between autumn sea ice variability over the Barents-Kara Seas and extreme cold winters in Europe. Using the observational data and composite analysis, we explore the interannual variability and the potential linkage between sea ice and atmospheric circulation patterns. It reveals a correlation with shifts toward a negative phase of North Atlantic Oscillation and more frequent episodes of the atmospheric blocking over Greenland and the North Atlantic. Furthermore, the negative phase of the North Atlantic Oscillation and enhanced blocking are closely related and mutually reinforcing, shaping the spatial distribution of cold anomalies over much of the European continent. Our results suggest a link between the unusual decrease in Barents-Kara Sea ice during autumn and the occurrence of intense European weather extremes in subsequent winter months, emphasizing the need for delving deeper into this relationship on monthly time scales to enhance our predictive capabilities for midlatitude extreme events.
1 Introduction
Observations indicate a significant warming of the Arctic region over the recent decades, accompanied by the accelerating decline of sea ice cover in all regions and for all seasons (Screen and Simmonds, 2010; Stroeve et al., 2011; Stroeve and Notz, 2018; Ding et al., 2022; Ionita, 2023). The linear trend of the Arctic Sea ice extent in September is about −13% per decade during 1979–2017 (Serreze and Meier, 2019). These variations in the Arctic sea ice conditions may trigger local and remote concurrent processes, influencing the regional surface energy budget (Screen and Simmonds, 2010), atmospheric and ocean circulation patterns (Francis et al., 2009; Sévellec et al., 2017), and weather systems over Northern Hemisphere continents (Cohen et al., 2014).
Despite intense efforts to understand Arctic-midlatitudes linkages, the controversy remains regarding a causal relationship between the Arctic sea ice conditions and mid-latitude weather extremes (e.g., Cohen et al., 2020; Outten et al., 2023). Numerous studies, such as Blackport et al. (2019), suggest that internal climatic variability, rather than direct causation, might drive the observed correlation between sea ice and mid-latitude winter temperatures. Several studies have used numerical models to assess their connections by forcing the climate models with reduced sea ice conditions and comparing the corresponding midlatitude temperature responses to those from simulations with increased sea ice extent, but the results do not support a robust causation (McCusker et al., 2016; Sun et al., 2016). Such results argue that a muted midlatitude response to sea-ice perturbations, suggesting that the mid-latitude cooling in winter may not be direct consequence of the Arctic sea ice retreat. Conversely, several studies based on observations (Hopsch et al., 2012; Tang et al., 2013) and model simulations (Mori et al., 2014) do find a robust connection between cold winter extremes over the northern hemisphere and the Arctic Sea ice loss, suggesting that the latter forces the former. Thermodynamic forcing by sea ice reduction contributes to weather events by changing the large-scale atmospheric circulation and the internal shifts in atmospheric dynamics (Overland et al., 2021).
The Barents Sea is among the regions most impacted by the reduction in sea ice, which has witnessed a substantial decline in sea ice extent due to global warming and climate change (Rieke et al., 2023 and the references therein). This decline, primarily attributed to rising temperatures driven by anthropogenic greenhouse gas emissions (Yamagami et al., 2022), has transformed the dynamics of the delicate ecosystem. Moreover, it has been linked to the occurrence of cold and harsh winters over Europe. Overall, the reduction of sea ice cover in the Barents Sea has emerged as a critical environmental and climatic issue in recent years, with far-reaching consequences for weather patterns and temperatures across Europe, particularly during winter (Honda et al., 2009; Petoukhov and Semenov, 2010; Li et al., 2023). This reduction of sea ice during autumn and early winter underscores the Arctic ecosystem's vulnerability and provides insights into the peculiar meteorological events occurring further south—the colder and more severe winters experienced across Europe. More specifically, the reduction of Arctic sea ice in autumn, particularly over the Barents and Kara Seas (BKS, 65°-85°N, 30°-90°E; Petoukhov and Semenov, 2010), can lead to warming and instability of the overlying atmosphere. The resulting preferential warming of the Arctic atmospheric column further causes an increase in geopotential height thickness and a decrease in the meridional temperature gradient, which may enhance upward propagating planetary waves into the stratosphere (Honda et al., 2009) and slow the polar jet stream (Francis et al., 2009).
On one hand, sufficient wave breaking in the stratosphere is conducive to disrupting and weakening the stratospheric polar vortex (SPV), potentially triggering sudden stratospheric warming (SSW) events (Cohen et al., 2014; Peings et al., 2023). Characterized by a low-pressure system encircled by strong westerly winds, the SPV confines the cold polar air masses to the polar region. A weak SPV favors the negative phase of the Arctic Oscillation (AO) or the North Atlantic Oscillation (NAO) at the surface (Kretschmer et al., 2018a,b), implying an essential role for tropospheric-stratospheric coupling (Cohen et al., 2021). On the other hand, weakening zonal winds increase the likelihood of slower and more amplified Rossby waves, leading to more frequent blocking (Preece et al., 2023) characterized by persistent anticyclones disrupting the steady westerly flow. Due to its large spatial extent and temporal persistence, atmospheric blocking may cause large-scale circulation anomalies that substantially impact weather patterns and are often associated with significant climate anomalies (Rimbu and Lohmann, 2011; Ionita et al., 2016).
However, what remains unclear is how the monthly atmospheric circulation and the frequency of persistent cold anomalies respond to the decreased autumn sea ice in the BKS. Moreover, various extreme cold winters have occurred in the mid-latitude continents during ongoing global warming and sea ice decline (Cohen et al., 2014; Kretschmer et al., 2018a,b), affecting individuals, agriculture, and commerce directly. In this respect, here we trace the step-by-step development of atmospheric flow and the blocking frequency using composite analysis on the interannual timescale, to present observational evidence that explores the relationship between sea ice extent (SIE) variation in autumn and European extreme winter weather. In brief, the aim of this study is to answer three questions: (1) Is there a link between autumn sea ice conditions and monthly extreme cold events in Europe? If so, (2) what physical process might be involved in this association? And further to explore (3) the time evolution of atmospheric conditions associated with low sea ice on the interannual timescale.
2 Data and methods
2.1 Data
Observations of monthly sea ice cover data for the period 1950–2022, were obtained from the Hadley Center Sea Ice and Sea Surface Temperature data set (HadISST, Rayner et al., 2003). SIE was quantified as the aggregate area where sea ice concentration exceeds a 15% threshold. To investigate the relationship of large-scale Northern Hemisphere atmospheric circulation to the initial sea ice forcing, we used the monthly sea level pressure (SLP), the 2m temperature (T2M), geopotential height and zonal and meridional winds at 500 and 100 hPa, with a grid-point resolution of 0.25° × 0.25°, in winter (DJF) from 1950/1951 to 2022/2023, which are available from the fifth generation European Center of Medium-Range Weather Forecasts atmospheric reanalysis (ERA5, Hersbach et al., 2020). Before the analysis, all variables were linear detrended in order to eliminate the effects of global warming and accentuate the fluctuations. Further preprocessing included re-gridding to a uniform spatial resolution (1°×1°) through a bilinear interpolation.
Additionally, the observational daily minimum temperature (TN) and daily maximum temperature (TX) were extracted from the E-OBS database v27.0e (Cornes et al., 2018) with a spatial resolution of 0.1°×0.1°. The daily geopotential height at 500 hPa (Z500) from the ERA5 reanalysis data (Hersbach et al., 2020) during 1950–2023 was used to calculate the blocking frequency, offering insight into atmospheric stability and blocking event occurrences.
2.2 Indices for extreme climate events
In this study, extreme climate events over Europe are captured by the monthly temperature indices, TN10p and TX10p, as defined by the Expert Team on Climate Change Detection and Indices (ETCCDI, Peterson et al., 2001). TN10p is an index measuring the percentage of days when the daily minimum temperature is below the 10th percentile threshold calculated for each calendar day (regarding the climatological norm) using a running 5-day window. This is a measure of the percentage of cold nights. TX10p, on the other hand, is an index measuring the percentage of days when the daily maximum temperature is below the 10th percentile threshold, representing the percentage of cold days.
2.3 Computation of the 2D blocking frequency
We used the two-dimensional (2D) blocking frequency index (Scherrer et al., 2006) to investigate the impacts of the SIE anomalies in the previous autumn (September-October-November) on the temperature conditions over Europe in the following winter. The 2D blocking index is based on the evaluation of blocking conditions at every grid point and goes beyond the one-dimensional blocking index (Tibaldi and Molteni, 1990). This index is derived from the geopotential height gradients in the southern (GHGS) and northern (GHGN) sides of the blocking region, evaluated at three specific reference latitudes. The gradients are defined as:
where φ0 is the latitude of the considered grid point.
A grid point is defined as instantaneous blocking if the conditions GHGS > 0 and GHGN < (−10 m/degrees of latitude) are simultaneously satisfied. A blocking event is detected if continuous instantaneous blocking covers at least 5 consecutive days. For each winter, the blocking frequency is defined as the ratio between the total number of days of blocking events and the total number of winter days. According to Scherrer et al. (2006), blockings are detected separately at each grid point within the latitude zone 35°-75°N.
2.4 Composite analysis
Composite analyses were applied to depict the typical pattern and physical mechanism responsible for connecting between the autumn sea ice extent (SIE) in the Barents-Kara Seas and the atmospheric circulation, surface air temperature, and blocking frequency. Years in which the value of the detrended SIE time series in autumn was above (or below) ±0.8 standard deviation were classified as high (or low) SIE years. This threshold was selected based on its statistical significance in distinguishing distinct sea ice conditions, ensuring a robust differentiation between years with high or low SIE, while maintaining a sufficient sample size for analysis. To examine the relationship between autumn sea ice and the following European weather conditions, monthly blocking frequency and cold extreme indices anomalies in the subsequent winter-to-autumn were also performed in composite analysis. The threshold value used for the composite analysis does not significantly alter the results. The statistical significance of the composite maps at the 5% significance level is established by Welch's t-test (Welch, 1947).
3 Results
The linear detrended time series of autumn SIE over the BKS for 1950–2022 (Figure 1) exhibits substantial interannual variability. To understand the association between atmospheric circulation and different autumn sea ice states and their relation to extreme cold events in Europe, we constructed the composite maps between the linear detrended time series of autumn SIE over the BKS for the years when the values of the index were higher than 0.8 standard deviation (high) and lower than −0.8 standard deviation (low). Statistically, the total number of high and low autumn SIE episodes considered were 15 and 14 cases, respectively, as derived from Figure 1.
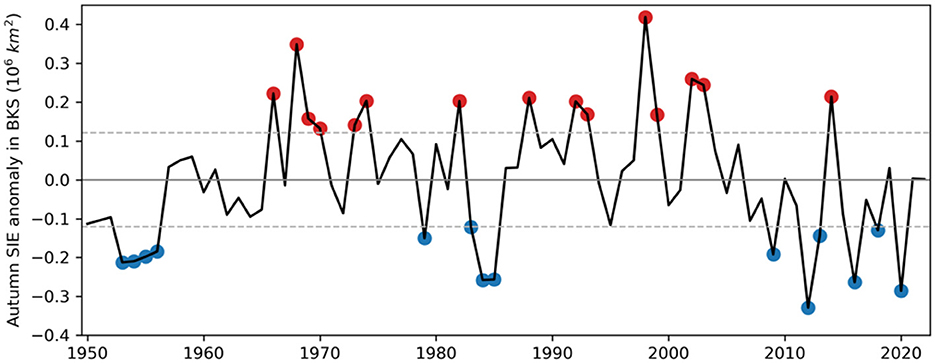
Figure 1. The linear detrended autumn SIE over the BKS (65°-85°N, 30°-90°E) from 1950 to 2022 in HadISST observations (Rayner et al., 2003). The gray-dashed lines represent the bounds of ±0.8 standard deviations from the mean. Years exceeding these bounds are marked with red (above) and blue (below) dots, respectively.
Figures 2, 3 depict winter atmospheric anomalies corresponding to different autumn sea ice conditions over the BKS. In the low SIE case (Figure 2), the composite map of the 100 hPa geopotential height (Z100) anomaly (Figure 2A) indicates that strong anomalous easterlies dominate the circulation for almost the whole 50°N-70°N latitudinal band, thereby reducing westerly flow. These wind differences match the associated changes of Z100 field well, with a maximum anomaly of 100 gpm over the central Arctic. Additionally, the Z500 composite (Figure 2B) presents relatively large positive values concentrated between the Greenland Sea and the Barents Sea. Predominantly, except over the North Atlantic and North Pacific, a barotropic structure is evident. The intensification of the meridional component of the mid-troposphere circulation is visible up and downstream of the Greenland Sea during low SIE situations.
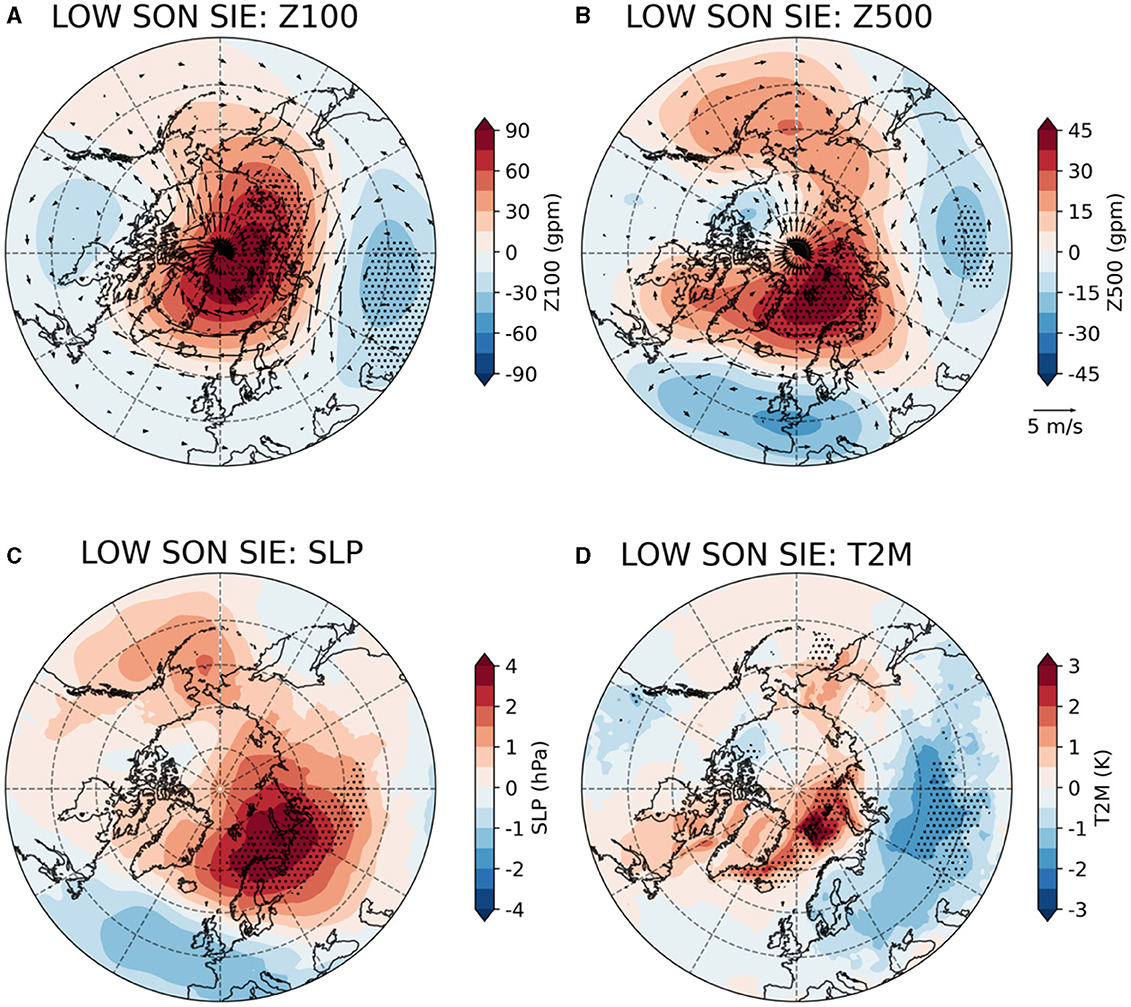
Figure 2. Composite maps for the Z100 (A), Z500 (B) with corresponding wind vectors, SLP (C), and T2M (D) for winter (DJF) during low autumn SIE in BKS. The dots highlight significant anomalies at a confidence level of 95%.
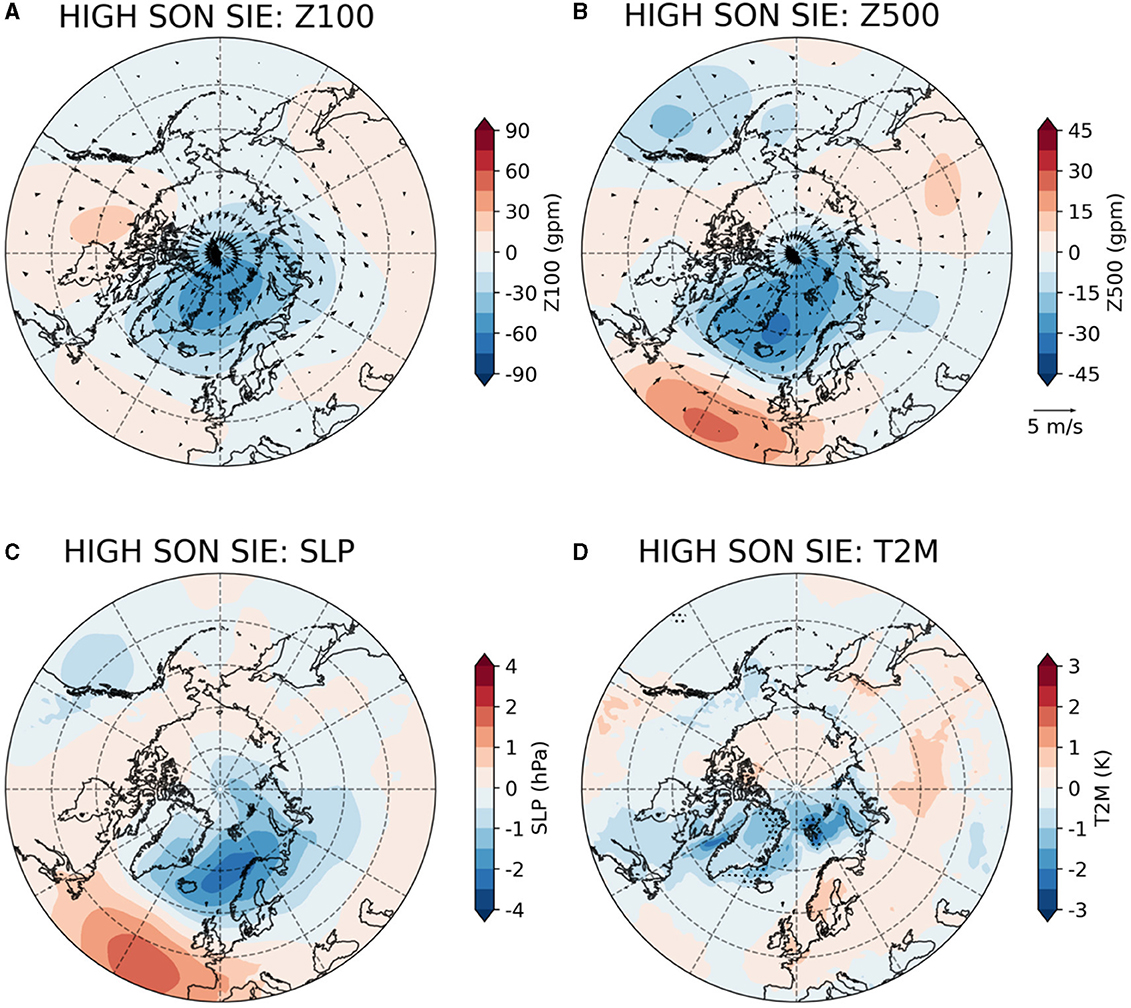
Figure 3. Composite maps for the Z100 (A), Z500 (B) with corresponding wind vectors, SLP (C), and T2M (D) for winter (DJF) during high autumn SIE in BKS. The dots highlight significant anomalies at a confidence level of 95%.
The SLP pattern (Figure 2C) resembles the fingerprint of the negative phase of AO (Thompson and Wallace, 1998), associated with a positive pressure anomaly in the polar region. This structure is caused by the decrease of autumn sea ice in the BKS, which may lead to the increase of SST over the BKS region. These responses encompassed a strengthening of both the Aleutian low and the Siberian high, accompanied by an equatorward shift of the midlatitude westerlies (Outten et al., 2023). The intensified Siberian high and the shifted westerly winds, contribute to significant cooling over the mid and high latitudes of the Eurasian continent, as shown in Figure 2D. This cooling extends southward to the whole of Europe. This pattern appears to be a “warm Arctic and cold continent (WACE)” pattern (Hong et al., 2023). Strong warming over the BKS is contrasted by considerable cooling in adjacent northern Eurasia in the following winter. Although of smaller magnitude, negative surface air temperature anomalies also cover a large part of North America.
The atmospheric circulations linked to sea ice conditions in the BKS reveals a meridional asymmetry in the winter WACE configuration (Luo et al., 2022). High SIE years (Figure 3) are marked by a strengthened polar vortex (Figure 3A) and a positive AO (Figure 3C), promoting a robust zonal jet stream and consequent retention of cold air in the polar region, with concurrent Eurasian warming (Figure 3D). Conversely, low SIE years are associated with a destabilized climate system, with ensuing weather extremes. These contrasting circulation and temperature anomalies are crucial to deciphering the dynamical processes driving recent extreme weather events across Europe.
Subsequent analysis centers on low autumn SIE conditions within the BKS, given their correlation with distinct atmospheric regimes. We illustrate the composite maps of Z100 (Figure 4), Z500 (Figure 5), and blocking frequency (Figure 6) anomalies for the following December to May, associated with anomalously low autumn SIE over the BKS. The primary reason for using monthly averages rather than short event durations is that we are interested in persistent conditions on interannual time scales. Findings related to high SIE conditions are presented within the Supplementary Figures 1–3.
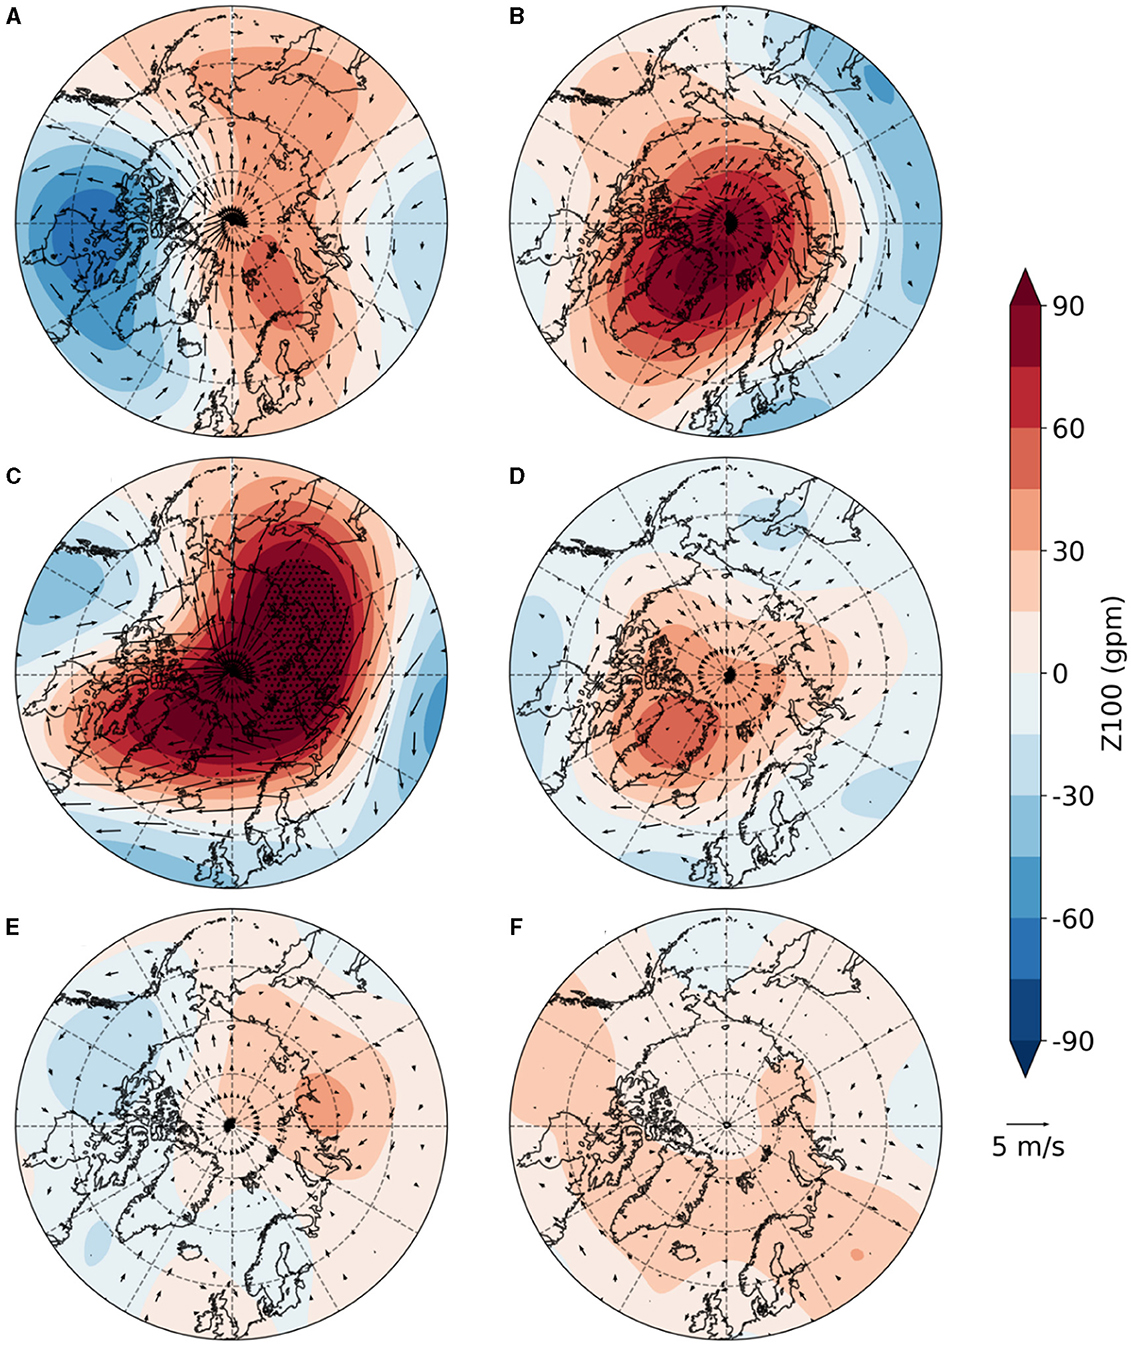
Figure 4. Composites of Z100 and 100 hPa wind vector anomalies for the following December to May, relative to the detrended autumn SIE in BKS below −0.8 standard deviation (low SON SIE). The dots highlight significant anomalies at a confidence level of 95%. (A) December. (B) January. (C) February. (D) March. (E) April. (F) May.
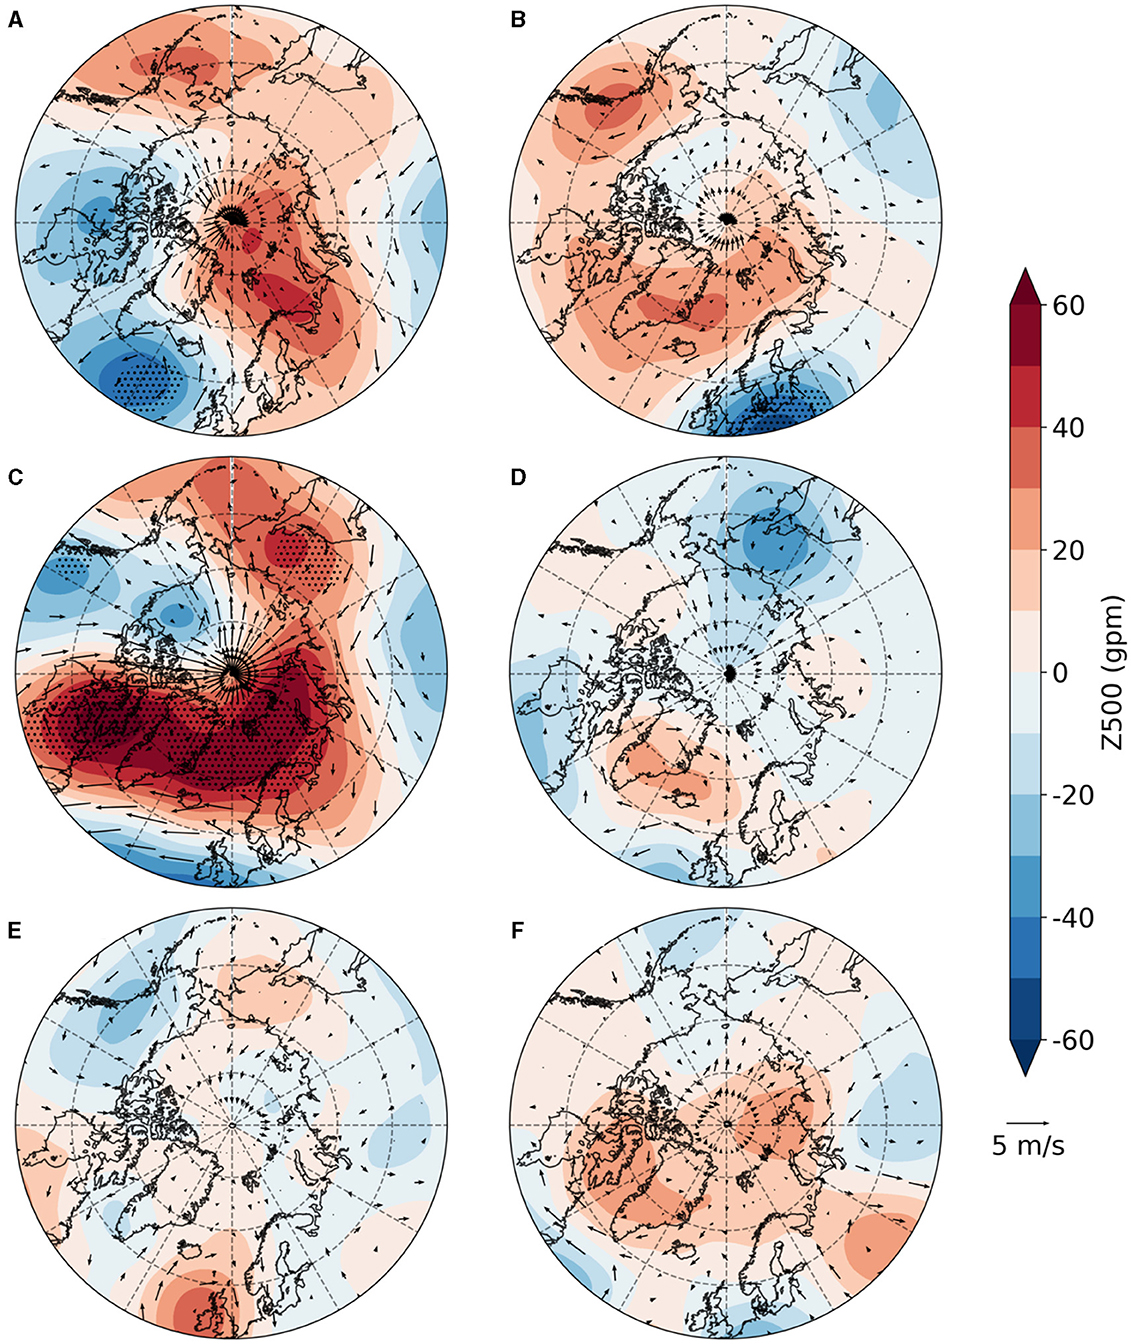
Figure 5. Composites of Z500 and 500 hPa wind vector anomalies for the following December to May, relative to the detrended autumn SIE in BKS below −0.8 standard deviation (low SON SIE). The dots highlight significant anomalies at a confidence level of 95%. (A) December. (B) January. (C) February. (D) March. (E) April. (F) May.
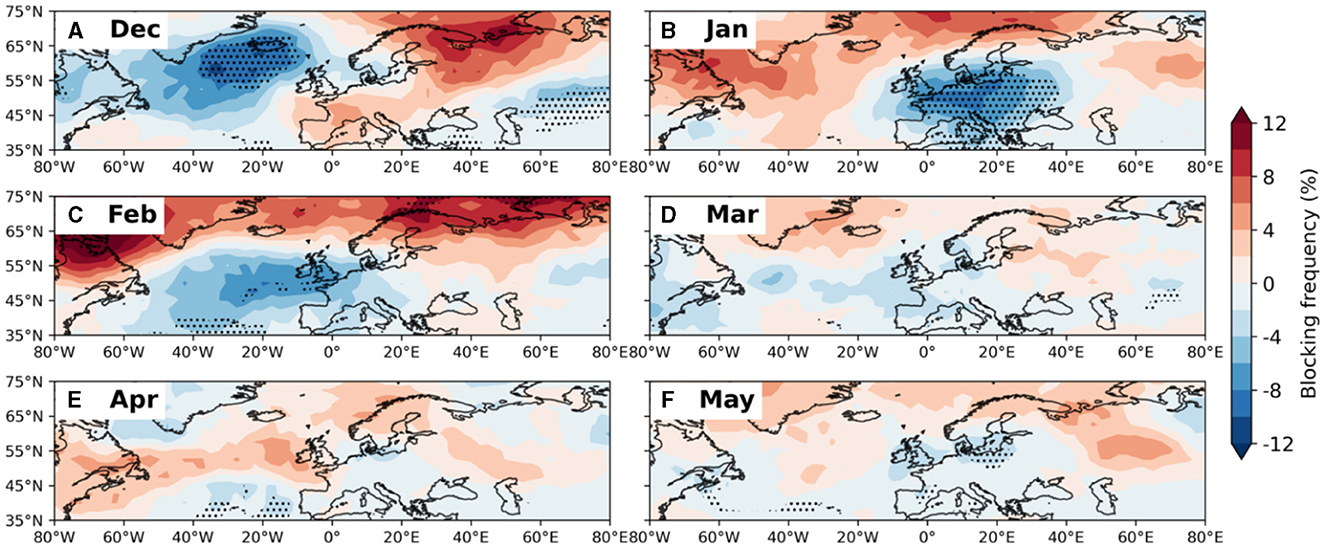
Figure 6. Blocking frequency composite maps for the following December to May, relative to the detrended autumn SIE in BKS below −0.8 standard deviation (low SON SIE). The dots highlight significant anomalies at a confidence level of 95%.
A major controlling factor for the classic winter cold-air outbreaks into mid-latitudes is the occurrence of SPV disruptions and displacements over the continents. This atmospheric response can be regarded as resulting from the stationary Rossby wave generated by the warming of the lower troposphere, which is caused by the decrease in autumn sea ice cover (Cohen et al., 2021). To better illustrate the factors contributing to SPV disruptions, Figure 4 shows the monthly evolution of the composite Z100 anomaly for the following December to May next year. The choice of such a low stratospheric level depends on this being particularly crucial for the troposphere-stratosphere coupling (Garfinkel et al., 2017).
The positive anomalies dominated the Arctic region for most of the study period, indicating a weakening of the polar vortex associated with stratospheric warming. However, the behavior of SPV in early winter (December) differs from that in mid-winter and spring. In December (Figure 4A), the vortex may be pushed away from the pole or split. The progressively weaker states of the SPV can be clearly seen from January (Figure 4B) to March (Figure 4D), mainly manifested as a positive Z100 anomaly centered over Greenland/Central Arctic. Climatologically, the SPV emerges in the autumn, reaches its strongest state in January, and gradually diminishes in the spring (Zhang et al., 2022). However, our results suggest that the SPV reaches its peak strength in February. The positive anomalies in February (Figure 4C) are more extensive than those in January (Figure 4B), with a focus from the Greenland Sea to the East Siberian Sea, intensifying the positive anomaly. This pattern is not perfectly symmetrical around the North Pole, but anticyclonic anomalies shift toward the western hemisphere. Besides, when examining the temporal evolution of their intensities, it is observed that the Z100 anomalies peak in intensity in February. This pattern diminishes in March and then gradually weakens at a slow pace in the following 2 months. In April (Figure 4E), the Z100 anomalies present an east-west contrast over the Arctic region, characterized by a positive anomaly center over Russia and a negative one over Canada.
Figure 5 tracks the monthly evolution of Z500 anomaly composite under low sea ice conditions. Generally, the anomaly composite maps exhibit a higher degree of zonal symmetry in the lower stratosphere (Figure 4), but wavy signatures dominate the troposphere with little zonal symmetry (Figure 5). The coherence of the positive and negative anomalies in the troposphere and the lower stratosphere suggests a downward influence by anomalous behavior of SPV on the tropospheric circulation from December to January, consistent with previous findings (e.g., Zhang et al., 2018). In addition, the most crucial feature of the Z500 anomalies corresponds to the intensification of the meridional component of the mid-troposphere circulation, which is visible in the following months (Figure 5). On the contrary, high SIE episodes are characterized by an intensification of the zonal circulation (Figure 2C).
When tracking the month-by-month evolutions, we find pronounced north-south meanders in 500 hPa circulation anomalies in December (Figure 5A), with negative anomalies in the mid-latitudes except over the northern Europe, which provided a dynamic setting driving cold polar air to plunge southward into Europe. In January (Figure 5B), the Z500 anomaly pattern shows some resemblance to the negative phase of the winter AO, and the jet stream gradually intensifies. Negative Z500 anomalies can be observed over southwestern Europe, while positive anomalies form in higher latitudes. This pattern expands slightly westward, even magnifying the positive anomalies and diminishing the negative ones, reaching its strongest state in February (Figure 5C). Two intense anticyclonic circulations associated with the positive anomalies develop, one around the west coast of Greenland and the other from the east coast of Greenland extending to the Barents Sea. Meanwhile, the negative anomaly diminishes and shifts toward the Atlantic, which is relevant for the heat transport into southern European. This situation is associated with an enforced north-south geopotential height gradient, and thus the atmospheric flow is diverted around it with an intense anomalous flow from the north, allowing cold air to penetrate southwards. In March (Figure 5D), the anticyclonic vortex anomaly decreases over southern Greenland, being accompanied by relatively weak positive Z500 anomalies. The anomalies associated with the south of the jet location are very similar to the negative pattern of the NAO, and the jet stream is located further south than its climatology. Specifically, a relatively elongated negative anomaly to the south indicates an increased meridional gradient and a strong jet stream lying to the south of the anticyclonic anomaly. Figures 5B–D illustrates that a weakened SPV is associated with tropospheric circulation anomalies during late winter, resembling characteristics of the negative phase of the NAO. As such, the anomalous propagation of the Rossby waves may be the precursor to forcing the NAO signals in the troposphere.
Atmospheric blocking is a large-scale mid-latitude atmospheric phenomenon primarily associated with persistent anticyclonic quasi-stationary high-pressure systems, which typically extend vertically throughout the troposphere. When the high-latitude jet stream develops large and nearly-stationary meanders (e.g., Figure 5A), the strong westerly winds shift to a more meridional flow instead of their typical zonal path, facilitating additional blocking events. It makes weather systems move more slowly or even become stationary (Rex, 1950), which is particularly important for the formation of extreme weather events. In winter, the east side of blocking events is often responsible for the equatorward advection of polar air masses, contributing to anomalously cold winter temperatures (Sillmann and Croci-Maspoli, 2009).
Starting in December, in low SIE conditions relative to high SIE, a center of enhanced blocking activity over Northeastern Europe, coupled with a center of relatively weaker blocking activity over Greenland, is observed (Figure 6A). The blocking activity over Greenland intensifies in January and moves down the southwest coast of Greenland, reaching its peak phase in February (Figure 6C) before vanishing over time. This movement can have significant implications for regional weather, potentially leading to abnormal conditions in areas affected by the block. The center of the blocking activity over Northeastern Europe remains and subsequently shifts to couple with a center of enhanced blocking activity over Barents Sea (Figures 6B, C), thus the more robust flow anomaly. Interestingly, there is a tendency for blocking events along the longitudes spanning from the Baffin Bay and Europe from January to February, suggesting a widespread disruption of typical atmospheric circulation. In February (Figure 6C), the positive anomalies merge and shift southward, extending more than in January, forming one broad and a continuous intensified block across Greenland and Northern Europe. Notably, Ural blocking (50°-70°N, 50°E−70°E) in February shows a pronounced intensification, which strengthens the Siberian High, facilitating the advection of cold Arctic air over the continent. The configuration of anomalous blocking frequency in March (Figure 6D) corresponds to Greenland blocking known to be associated with the negative NAO phase (Woollings et al., 2010), which is usually related to the splitting of the jet stream into two distinct branches (Trigo et al., 2004). Then, like other variables, the atmospheric circulation system adjusts to a stable state within a short period.
We examine furthermore the monthly evolution of the spatial structure of extreme cold events in Europe. Figure 7 shows the composite for TN10p anomalies, which appears to be influenced by the combined effect of the atmospheric circulation variables. The insignificant change in TN10p in December (Figure 7A) indicates that the cold air from the Arctic does not yet penetrate southwards into mid-latitudes, and the slight warming signals in central Europe may be related to the ridges transporting warm air northward. In January (Figure 7B), pronounced cold anomalies appear in Europe, especially over Norway and Ireland, while positive anomalies can be observed over Turkey. This pattern may be associated with the southerly inflow of warm and humid air masses from the Atlantic (Figure 5B). The widespread pattern of extreme cold remains robust in February (Figure 7C) with an amplified magnitude over the central and western Europe, while some regions in the south experience warmer conditions. Central and eastern continental cold winters are linked to increased Ural blocking frequency (Figure 6C), which amplifies cold advection and radiative cooling of the continental interior while weakening westerly flow and warm, moist air imports (Zhang et al., 2012). In relation with low SIE over the BKS, large parts of Europe (i.e., 36°-72°N, 12°W−36°E) experiences an increase of up to 4.32 days of cold nights in February. In March (Figure 7D), the cold European anomaly persists and extends to the east, while the warm anomalies in the southern part expand in coverage and extend to the northwest, but significant negative anomalies can be seen on the northeastern coast of the Black Sea. Even if there is no notable blocking at the same time (Figure 6D), the predominance of these cold anomalies may still relate to the persistence of blocking situation. In April (Figure 7E), the TN10p indicates weakened negative anomalies that gradually shift toward the western European. The cyclonic circulation around western Europe (Figure 5F) transports warmer Atlantic air masses to the continent, essentially shaping the general pattern encompassing Europe.
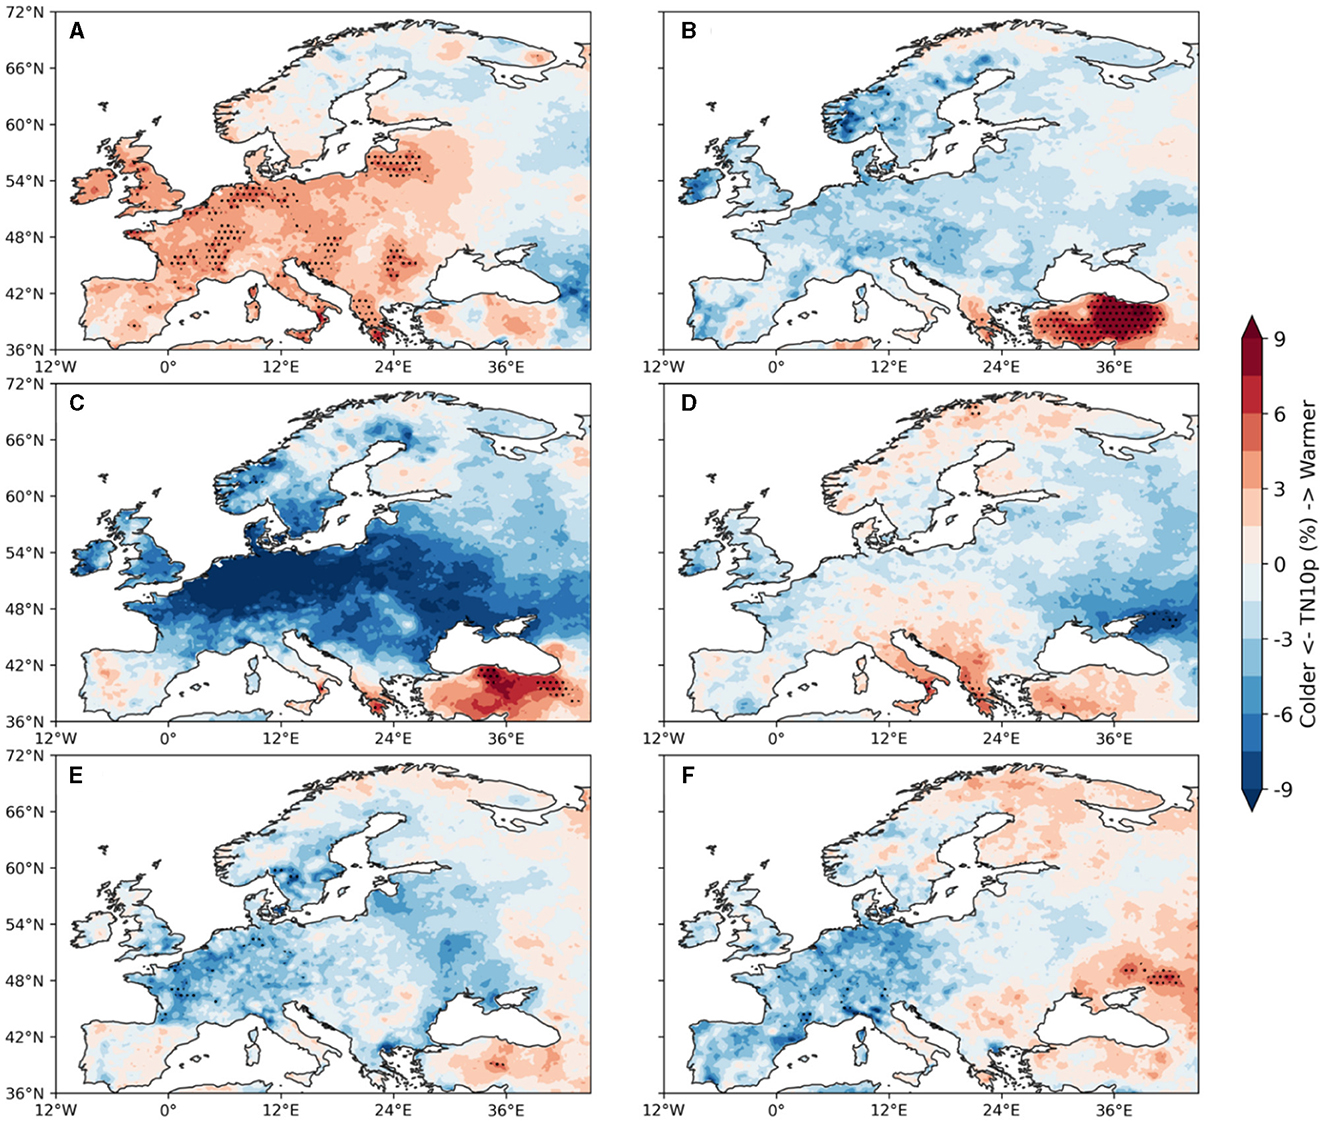
Figure 7. TN10p composite maps for the following December to May, relative to the detrended autumn SIE in BKS below −0.8 standard deviation (low SON SIE). TN10p values are presented in percentages, indicating the percent of cold nights per month. To enhance interpretability, values are presented with a negative sign, where blue indicates cooler conditions and red indicates warmer conditions. The dots highlight significant anomalies at a confidence level of 95%. (A) December. (B) January. (C) February. (D) March. (E) April. (F) May.
Supplementary Figure 4 presents the composite for TX10p anomalies, which align closely with the patterns observed in TN10p in terms of spatial distribution and temporal evolution. Notably, February (Supplementary Figure 4C) exhibits a pronounced increase in cold days across Europe, exhibiting stronger cooling anomalies compared to the concurrent period in TN10p (Figure 7C). Quantitatively, there is an increase of up to 5.90 days of cold days throughout the continent. Transitioning to April and May, localized cold anomalies become relatively prominent, with regions like the western side of Finland displaying cooling.
The robust features revealed that persistent winter cold extremes occur in the presence of atmospheric blocking. Overall, blocking influences the local weather conditions around the block, particularly the European cold extremes are associated with mid- and high-latitude blocking over the European continent as well as the North Atlantic. Europe is the dominant region because of the configuration of a strong and meridionally tilted storm track upstream of a large landmass (Kautz et al., 2022). Northerly advection anomalies mainly cause cold anomalies over most of Europe to the east of the blocking core. Over the North Atlantic, blocking is strongly correlated with the negative phase of the NAO that itself is associated with the development of cold European winters. During the negative phase of NAO, the synoptic pattern provides diffluent flow conditions favorable for the onset and maintenance of blocking systems (Luo et al., 2015). In addition, blocking occurs over Greenland (e.g., Figure 6D), which is associated with the negative phase of NAO and has strong downstream impacts in Europe (Rimbu and Lohmann, 2011; Kretschmer et al., 2018a,b).
4 Conclusions
In this study we examine the influence of autumn sea ice variation over the BKS on severe European extreme winters. Using observational data to track interannual variability, we show the sequential evolution in the spatial configuration of atmospheric variables and winter extremes. We investigate the evolution pathways of atmospheric circulation and blocking frequency that are associated with autumn low sea ice on a monthly timescale. While various, often multifaceted, factors contribute to European cold extremes, our focus is on discerning the potential linkage with autumn low sea ice year in the BKS. Employing a composite analysis of 14 distinct low and 15 high sea ice cases from 1950 to 2022, we aim to underscore consistent patterns. Our findings indicate a statistical relationship between low sea ice over the BKS during autumn and changes in large-scale atmospheric circulation patterns and the blocking dynamics, which are associated with extreme cold winters over Europe. Results suggest a connection between autumn sea ice variability in the BKS and European cooling; however, the analysis cannot clarify whether the link is causal or the result of internal variability in the climate system. It's important to note that this process is just one of many factors contributing to extreme weather events in Europe, and it doesn't operate in isolation. Overall, the relationship between low sea ice over the BKS and cold winters in Europe is part of a complex interplay of factors. As with the broader Arctic region, the sea ice reduction acts as a contributor, but it also interacts with other climatic drivers and feedback loops in the atmosphere (Cohen et al., 2020). Thus, the exact impact on European winters can vary from year to year, and the strength of causality vs. correlation can fluctuate accordingly.
The local and remote atmospheric circulation clearly links to sea ice change over the BKS, consistent with findings by Cohen et al. (2014) and subsequent studies. Dominant positive Z100 anomalies in the Arctic in winter indicate a weakening SPV, often associated with SSW events. The peak strength of SPV, observed in February, spans from the Greenland Sea to the East Siberian Sea. This dynamic may affect the tropospheric and surface circulation conditions within about 1 month. This downward influence mechanism explains the deformation in the spatial structure of the tropospheric circulation anomalies and the southward movement of the jet stream. Then, a negative AO/NAO pattern emerges as the dominant tropospheric circulation, which develops in December and reaches its largest amplitude in February.
In addition to changes in the large-scale atmospheric circulation, thermodynamic forcing from decreasing sea ice can also contribute to weather conditions through the internal shifts in atmospheric dynamics (Screen, 2017). In particular, blocking activity is critical to European flow changes due to its capability to interfere with the main cyclonic westerly flow, which typically leads to persistent weather conditions around the block for 1–2 months (Buehler et al., 2011). We demonstrate that cold extremes in Europe can be attributed to the presence and persistence of atmospheric blocking systems over Greenland and the North Atlantic, especially during late winter (e.g., February). However, the cold anomalies are usually not located directly below the blocking center, but rather downstream or south of it. This is why extreme cold temperatures are most pronounced over central Europe.
The results presented here indicate that not only the atmospheric circulation realignment but also variations in blocking frequency can be crucial for the frequency of occurrence of mid-latitude weather extremes. The negative phase of NAO provides diffuse flow conditions that further facilitate the onset and sustainment of blocking systems (Luo et al., 2015). The intensified blocking activity and the negative phase of NAO are closely related and work to reinforce each other, each associated with and jointly shaping the spatial distribution of cold anomalies over large parts of European continent (Rimbu et al., 2014; Wegmann et al., 2020). Specifically, cold anomalies at TN10p and TX10p in large parts of Europe are mainly caused by northerly flow anomalies in the eastern part of the blocking core region, while warm anomalies in southern Europe correspond to the cyclonic circulation in the North Atlantic associated with the negative phase of the NAO. Quantitatively speaking, there is an increase of up to 5.90 days of cold days and 4.32 days of cold nights throughout the European continent during February, showing the tangible impact of these atmospheric dynamics on regional climates.
Overall, the Arcti c sea ice does not merely respond passively to global climate change, but instead, its changes affect weather conditions in other regions bridging spatio-temporal scales (Lohmann et al., 2020; Outten et al., 2023). Our results imply that the autumn anomalous low BKS sea ice in autumn is associated with severe European extremes in subsequent winters. However, the application of t-tests for significance assessment and linear detrending for interannual variability may not adequately address the complex, non-linear interplays within climate data. This work acts as an initial step toward elucidating these connections, underlining the necessity for advanced statistical approaches and detrending methods to clarify causality. Continued examination of this association on a monthly timescale in imperative for enhancing our understanding of the sub-seasonal to seasonal predictability of midlatitude extreme events, thereby refining future climate projections.
Data availability statement
Publicly available datasets were analyzed in this study. This data can be found at: https://www.metoffice.gov.uk/hadobs/hadisst; https://www.ecmwf.int/en/forecasts/dataset/ecmwf-reanalysis-v5; https://etccdi.pacificclimate.org.
Author contributions
DC: Writing – original draft. GL: Writing – review & editing. XC: Writing – review & editing. MI: Writing – review & editing.
Funding
The author(s) declare financial support was received for the research, authorship, and/or publication of this article. This work was supported by BMBF through the project: Abrupt Climate Shifts and Extremes over Eurasia in Response to Arctic Sea Ice Change (ACE), under Grant 01LP2004A. This work was supported by the National Key R&D Program of China under Grant 2019YFA0607000. DC was also supported by the China Scholarship Council (202106330036).
Acknowledgments
We acknowledge support by AWI through its research infrastructure in the topic: Ocean and Cryosphere under climate change, as part of the Helmholtz Program: Changing Earth—Sustaining our Future. Support by the Helmholtz Climate Initiative REKLIM was gratefully acknowledged. We acknowledge the Hadley Center Sea Ice and Sea Surface Temperature data set (HadISST), the European Center of Medium-Range Weather Forecasts (ECMWF), and the Expert Team on Climate Change Detection and Indices (ETCCDI) for making their data available to us.
Conflict of interest
The authors declare that the research was conducted in the absence of any commercial or financial relationships that could be construed as a potential conflict of interest.
Publisher's note
All claims expressed in this article are solely those of the authors and do not necessarily represent those of their affiliated organizations, or those of the publisher, the editors and the reviewers. Any product that may be evaluated in this article, or claim that may be made by its manufacturer, is not guaranteed or endorsed by the publisher.
Supplementary material
The Supplementary Material for this article can be found online at: https://www.frontiersin.org/articles/10.3389/fclim.2024.1345763/full#supplementary-material
References
Blackport, R., Screen, J. A., van der Wiel, K., and Richard, B. (2019). Minimal influence of reduced Arctic sea ice on coincident cold winters in mid-latitudes. Nat. Clim. Chang. 9, 697–704. doi: 10.1038/s41558-019-0551-4
Buehler, T., Raible, C. C., and Stocker, T. F. (2011). The relationship of winter season North Atlantic blocking frequencies to extreme cold or dry spells in the ERA-40. Tellus A Dyn. Meteorol. Oceanogr. 63A, 212–222. doi: 10.1111/j.1600-0870.2011.00511.x
Cohen, J., Agel, L., Barlow, M., Garfinkel, C. I., and White, I. (2021). Linking Arctic variability and change with extreme winter weather in the United States. Science 373, 1116–1121. doi: 10.1126/science.abi9167
Cohen, J., Screen, J. A., Furtado, J. C., Barlow, M., Whittleston, D., Coumou, D., et al. (2014). Recent Arctic amplification and extreme mid-latitude weather. Nat. Geosci. 7, 627–637. doi: 10.1038/ngeo2234
Cohen, J., Zhang, X., Francis, J., Jung, T., Kwok, R., Overland, J., et al. (2020). Divergent consensuses on Arctic amplification influence on midlatitude severe winter weather. Nat. Clim. Chang. 10, 20–29. doi: 10.1038/s41558-019-0662-y
Cornes, R. C., van der Schrier, G., van den Besselaar, E. J. M., and Jones, P. D. (2018). An ensemble version of the E-OBS temperature and precipitation data sets. J. Geophys. Res. Atmos. 123, 9391–9409. doi: 10.1029/2017JD028200
Ding, Q., Schweiger, A., and Baxter, I. (2022). Nudging observed winds in the Arctic to quantify associated sea ice loss from 1979 to 2020. J. Clim. 35, 3197–3213. doi: 10.1175/JCLI-D-21-0893.1
Francis, J., Chen, W., Leathers, D., Miller, J., and Veron, D. (2009). Winter northern hemisphere weather patterns remember summer Arctic sea-ice extent. Geophys. Res. Lett. 36:L07503. doi: 10.1029/2009GL037274
Garfinkel, C. I., Son, S. W., Song, K., Aquila, V., and Oman, L. D. (2017). Stratospheric variability contributed to and sustained the recent hiatus in Eurasian winter warming. Geophys. Res. Lett. 44, 374–382. doi: 10.1002/2016GL072035
Hersbach, H., Bell, B., Berrisford, P., Hirahara, S., Horányi, A., Muñoz-Sabater, J., et al. (2020). The ERA5 global reanalysis. Q. J. Roy. Met. Soc. 146, 1999–2049. doi: 10.1002/qj.3803
Honda, M., Inoue, J., and Yamane, S. (2009). Influence of low Arctic sea-ice minima on anomalously cold Eurasian winters. Geophys. Res. Lett. 36:L08707. doi: 10.1029/2008GL037079
Hong, Y., Wang, S. Y. S., Son, S. W., Jeong, J. H., Kim, S. W., Kim, B., et al. (2023). Arctic-associated increased fluctuations of midlatitude winter temperature in the 1.5° and 2.0° warmer world. NPJ Clim. Atmos. Sci. 6:345. doi: 10.1038/s41612-023-00345-y
Hopsch, S., Cohen, J., and Dethloff, K. (2012). Analysis of a link between fall Arctic sea ice concentration and atmospheric patterns in the following winter. Tellus A Dyn. Meteorol. Oceanogr. 64A:18624. doi: 10.3402/tellusa.v64i0.18624
Ionita, M. (2023). The Arctic winter seasons 2016 and 2017: climatological context and analysis. Climate. 11, 1–19. doi: 10.3390/cli11010019
Ionita, M., Scholz, P., Lohmann, G., Dima, M., and Prange, M. (2016). Linkages between atmospheric blocking sea ice export through Fram Strait and the Atlantic Meridional Overturning Circulation. Sci. Rep. 6:32881. doi: 10.1038/srep32881
Kautz, L. A., Martius, O., Pfahl, S., Pinto, J. G., Ramos, A. M., and Sousa, P. M. (2022). Atmospheric blocking and weather extremes over the Euro-Atlantic sector—a review. Weather Clim. Dynam. 3, 305–336. doi: 10.5194/wcd-3-305-2022
Kretschmer, M., Coumou, D., Agel, L., Barlow, M., Tziperman, E., and Cohen, J. (2018a). More frequent weak stratospheric polar vortex states linked to mid-latitude cold extremes. Bull. Am. Met. Soc. 16:1. doi: 10.1175/BAMS-D-16-0259.1
Kretschmer, M., Coumou, D., Agel, L., Barlow, M., Tziperman, E., and Cohen, J. (2018b). More-persistent weak stratospheric polar vortex states linked to cold extremes. Bull. Am. Meteorol. Soc. 99, 49–60.
Li, Y., Zhang, L., Gan, B., Wang, H., Li, X., and Wu, L. (2023). Observed contribution of Barents-Kara sea ice loss to warm Arctic-cold Eurasia anomalies by submonthly processes in winter. Environ. Res. Lett. 18:e034019. doi: 10.1088/1748-9326/acbb92
Lohmann, G., Butzin, M., Eissner, N., Shi, X., and Stepanek, C. (2020). Abrupt climate and weather changes across timescales. Paleoceanogr. Paleoclimatol. 35:e2019PA003782. doi: 10.1029/2019PA003782
Luo, B., Luo, D., Dai, A., Simmonds, I., and Wu, L. (2022). Decadal variability of winter warm arctic-cold eurasia dipole patterns modulated by pacific decadal oscillation and atlantic multidecadal oscillation. Earth's Fut. 10:e2021EF002351. doi: 10.1029/2021EF002351
Luo, D. H., Yao, Y., Dai, A., and Feldstein, S. B. (2015). The positive north atlantic oscillation with downstream blocking and middle east snowstorms: the large-scale environment. J. Clim. 28, 6398–6418. doi: 10.1175/JCLI-D-15-0184.1
McCusker, K. E., Fyfe, J. C., and Sigmond, M. (2016). Twenty-five winters of unexpected Eurasian cooling unlikely due to Arctic sea-ice loss. Nat. Geosci. 9, 838–842. doi: 10.1038/ngeo2820
Mori, M., Watanabe, M., Shiogama, H., Inoue, J., and Kimoto, M. (2014). Robust Arctic sea-ice influence on the frequent Eurasian cold winters in past decades. Nat. Geosci. 7, 869–873. doi: 10.1038/ngeo2277
Outten, S., Li, C., King, M. P., Suo, L., Siew, P. Y. F., Cheung, H., et al. (2023). Reconciling conflicting evidence for the cause of the observed early 21st century Eurasian cooling. Weather Clim. Dynam. 4, 95–114. doi: 10.5194/wcd-4-95-2023
Overland, J. E., Ballinger, T. J., Cohen, J., Francis, J. A., Hanna, E., Jaiser, R., et al. (2021). How do intermittency and simultaneous processes obfuscate the Arctic influence on midlatitude winter extreme weather events? Environ. Res. Lett. 16:e043002. doi: 10.1088/1748-9326/abdb5d
Peings, Y., Davini, P., and Magnusdottir, G. (2023). Impact of Ural blocking on early winter climate variability under different Barents-Kara sea ice conditions. J. Geophys. Res. Atmos. 128:e2022JD036994. doi: 10.1029/2022JD036994
Peterson, T. C., Folland, C., Gruza, G., Hogg, W., Mokssit, A., and Plummer, N. (2001). “Report on the activities of the working group on climate change detection and related rapporteurs 1998-2001,” in WMO, Rep.WCDMP-47, WMO-TD 1071 (Geneva: WMO), 143. Available online at: https://nora.nerc.ac.uk/id/eprint/130144/
Petoukhov, V., and Semenov, V. A. (2010). A link between reduced Barents-Kara sea ice and cold winter extremes over northern continents. J. Geophys. Res. 115:D21111. doi: 10.1029/2009JD013568
Preece, J. R., Mote, T. L., Cohen, J., Wachowicz, L. J., Knox, J. A., Tedesco, M., et al. (2023). Summer atmospheric circulation over Greenland in response to Arctic amplification and diminished spring snow cover. Nat. Commun. 14:3759. doi: 10.1038/s41467-023-39466-6
Rayner, N. A., Parker, D. E., Horton, E. B., Folland, C. K., Alexander, L. V., Rowell, D. P., et al. (2003). Global analyses of sea surface temperature, sea ice, and night marine air temperature since the late nineteenth century. J. Geophys. Res. 108:4407. doi: 10.1029/2002JD002670
Rex, D. F. (1950). Blocking action in the middle troposphere and its effect upon regional climate. Part I. An aerological study of blocking action. Tellus 2, 196–211. doi: 10.3402/tellusa.v2i3.8546
Rieke, O., Årthun, M., and Dörr, J. S. (2023). Rapid sea ice changes in the future Barents Sea. Cryosphere 17, 1445–1456. doi: 10.5194/tc-17-1445-2023
Rimbu, N., and Lohmann, G. (2011). Winter and summer blocking variability in the North Atlantic region. Evidence from long-term observational and proxy data from southwestern Greenland. Clim. Past 7, 543–555. doi: 10.5194/cp-7-543-2011
Rimbu, N., Lohmann, G., and Ionita, M. (2014). Interannual to multidecadal Euro-Atlantic blocking variability during winter and its relationship with extreme low temperatures in Europe. J. Geophys. Res. 119, 13621–13636. doi: 10.1002/2014JD021983
Scherrer, S. C., Croci-Maspoli, M., Schwierz, C., and Appenzeller, C. (2006). Two-dimensional indices of atmospheric blocking and their statistical relationship with winter climate patterns in the Euro-Atlantic region. Int. J. Climatol. 26, 233–249. doi: 10.1002/joc.1250
Screen, J. A. (2017). Simulated atmospheric response to regional and pan-Arctic sea ice loss. J. Clim. 30, 3945–3962. doi: 10.1175/JCLI-D-16-0197.1
Screen, J. A., and Simmonds, I. (2010). The central role of diminishing sea ice in recent Arctic temperature amplification. Nature 464, 1334–1337. doi: 10.1038/nature09051
Serreze, M. C., and Meier, W. N. (2019). The Arctic's sea ice cover: trends, variability, predictability, and comparisons to the Antarctic. Ann. N. Y. Acad. Sci. 1436, 36–53. doi: 10.1111/nyas.13856
Sévellec, F., Fedorov, A. V., and Liu, W. (2017). Arctic sea-ice decline weakens the Atlantic meridional overturning circulation. Nat. Climate Change. 7, 604–610. doi: 10.1038/nclimate3353
Sillmann, J., and Croci-Maspoli, M. (2009). Present and future atmospheric blocking and its impact on European mean and extreme climate. Geophys. Res. Lett. 36:L10702. doi: 10.1029/2009GL038259
Stroeve, J., and Notz, D. (2018). Changing state of Arctic sea ice across all seasons. Environ. Res. Lett. 13:103001. doi: 10.1088/1748-9326/aade56
Stroeve, J., Serreze, M., Holland, M., Kay, J., Maslanik, J., and Barrett, A. (2011). The Arctic's rapidly shrinking sea-ice cover: a research synthesis. Clim. Chang. 110, 1005–1027. doi: 10.1007/s10584-011-0101-1
Sun, L., Perlwitz, J., and Hoerling, M. (2016). What caused the recent “warm Arctic, cold continents” trend pattern in winter temperatures? Geophys. Res. Lett. 43, 5345–5352. doi: 10.1002/2016GL069024
Tang, Q., Zhang, X., Yang, X., and Francis, J. A. (2013). Cold winter extremes in northern continents linked to Arctic sea ice loss. Environ. Res. Lett. 8:14036. doi: 10.1088/1748-9326/8/1/014036
Thompson, D. W. J., and Wallace, J. M. (1998). The Arctic oscillation signature in the wintertime geopotential height and temperature fields. Geophys. Res. Lett. 25, 1297–1300. doi: 10.1029/98GL00950
Tibaldi, S., and Molteni, F. (1990). On the operational predictability of blocking. Tellus A 42, 343–365. doi: 10.3402/tellusa.v42i3.11882
Trigo, R. M., Trigo, I. F., DaCamara, C. C., and Osborn, T. J. (2004). Climate impact of the European winter blocking episodes from the NCEP/NCAR Reanalyses. Clim. Dyn. 23, 17–28. doi: 10.1007/s00382-004-0410-4
Wegmann, E., Müller, S. M., Turel, O., and Brand, M. (2020). Interactions of impulsivity, general executive functions, and specific inhibitory control explain symptoms of social-networks-use disorder: an experimental study. Sci. Rep. 10:3866. doi: 10.1038/s41598-020-60819-4
Welch, B. (1947). The generalization of “student's” problem when several different population variances are involved. Biometrika 34, 28–35. doi: 10.2307/2332510
Woollings, T., Hannachi, A., Hoskins, B., and Turner, A. (2010). A regime view of the North Atlantic Oscillation and its response to anthropogenic forcing. J. Clim. 23, 1291–1307. doi: 10.1175/2009JCLI3087.1
Yamagami, Y., Watanabe, M., Mori, M., and Ono, J. (2022). Barents-Kara sea-ice decline attributed to surface warming in the Gulf Stream. Nat. Commun. 13:3767. doi: 10.1038/s41467-022-31117-6
Zhang, P., Wu, Y., and Smith, K. L. (2018). Prolonged effect of the stratospheric pathway in linking Barents-Kara Sea sea ice variability to the midlatitude circulation in a simplified model. Clim. Dyn. 50:527. doi: 10.1007/s00382-017-3624-y
Zhang, X., Fu, Y., Han, Z., Overland, J. E., Rinke, A., Tang, H., et al. (2022). Extreme cold events from East Asia to North America in winter 2020/21: comparisons, causes, and future implications. Adv. Atmos. Sci. 39, 553–565. doi: 10.1007/s00376-021-1229-1
Keywords: low sea ice, Barents-Kara Seas, European cold extremes, Rossby wave, atmospheric blocking
Citation: Cai D, Lohmann G, Chen X and Ionita M (2024) The linkage between autumn Barents-Kara sea ice and European cold winter extremes. Front. Clim. 6:1345763. doi: 10.3389/fclim.2024.1345763
Received: 29 November 2023; Accepted: 15 February 2024;
Published: 29 February 2024.
Edited by:
Xiang Gao, Massachusetts Institute of Technology, United StatesReviewed by:
Jennifer Francis, Woodwell Climate Research Center, United StatesBolan Gan, Ocean University of China, China
Juan C. Acosta Navarro, European Commission, Italy
Copyright © 2024 Cai, Lohmann, Chen and Ionita. This is an open-access article distributed under the terms of the Creative Commons Attribution License (CC BY). The use, distribution or reproduction in other forums is permitted, provided the original author(s) and the copyright owner(s) are credited and that the original publication in this journal is cited, in accordance with accepted academic practice. No use, distribution or reproduction is permitted which does not comply with these terms.
*Correspondence: Di Cai, ZGkuY2FpQGF3aS5kZQ==