 Asheley R. Landrum
- Department of Advertising and Brand Strategy, College of Media & Communication, Texas Tech University, Lubbock, TX, United States
Educational science programming on digital video platforms such as YouTube wrestle with sometimes significant gender disparities in viewership. When men engage with science and technology content on digital platforms more than women, gender gaps in the understanding of, engagement with, and interest in STEM may intensify. Therefore, there is a critical need for research aiming to aid in our understanding of these gender differences. This study provides evidence that the gender gaps may exist not in the use of YouTube itself, but in the engagement with science and technology content on the platform. Furthermore, there are gender differences in the reasons for engaging with such content, with women, perhaps, more motivated by instrumental purposes than to satisfy their science curiosity.
Introduction
In their July 2019 programming deck, PBS Digital Studios describes each of its YouTube channels and the audiences for those channels. This PowerPoint-styled document includes information and viewer metrics for 14 PBS Digital Studios shows, only three of which are not explicitly science relevant. For each of the science-relevant shows, there is a stark gender disparity in viewership. Crash Course, a series that is hosted by a variety of different internet personalities and experts (e.g., Wheezy Waiter, Dr. Shini Somara), and focuses on topics such as philosophy, engineering, and astronomy, has an audience that is 65% male. It's Okay to Be Smart, a series hosted by Joe Hanson, PhD, that highlights surprising connections between science and our world, has an audience that is 75% male. Physics Girl, a Webby award-winning series aiming to demonstrate basic physics concepts with the tag line “Physics for every atom and eve,” has an audience that is 80% male. Space Time, a series about space and astrophysics, hosted by Matt O'Dowd, PhD, has an audience that is 93% male. In contrast, two of the non-science relevant series have greater female viewership. The Art Assignment series' audience is 45% male and 55% female, and Say It Loud, a series celebrating Black culture, has an audience that is 38% male and 62% female.
Why do the educational science programs struggle to attract female viewers? There are two potential sources for an overall gender disparity: the YouTube platform and the science content showcased on that platform. In this study, I explore four questions. First, is it the case that men watch YouTube more frequently than women? If not, what is the relative importance of gender and what is the strongest predictor of YouTube use? Second, do women use the platform differently (or for different reasons) than men? Third, are men more inclined to watch science and technology video than women? And, fourth, when women do watch science video, why do they watch it?
There is a critical need for research aiming to fill the gap in our understanding of gender differences in engagement with digital video. When men engage with STEM content on digital platforms more than women, gender gaps in the understanding of, engagement with, and interest in STEM may intensify. Though an abundance of work exists that examines gender differences in, for example, the pursuit of STEM-careers (e.g., Sadler et al., 2012; Dasgupta and Stout, 2014; Stoet and Geary, 2018), there is a gap in understanding the potential two-tiered gender disparity involved with (a) consuming content on digital platforms like YouTube and (b) engagement with science media on those platforms. Specifically, understanding whether a gender-based participatory digital divide in engagement with science video exists, and if so, why does this divide exist, is critical to advancing informal science learning and broadening participation with STEM.
This research is seated in the uses and gratifications framework which seeks to explain how people use media to gratify their needs, to identify what motives people have for using media, and to identify potential positive and negative consequences of media use (see Ruggiero, 2000; Rubin, 2009). Prior research investigating the uses and gratifications of online science video suggests that people primarily use online science videos to satisfy learning goals (e.g., Moll and Nielsen, 2017). However, there are a variety of other uses and gratifications that may come into play given that YouTube is a website for social networking, entertainment, and information seeking. To that end, I used the items from Khan (2017); (adapted from Dholakia et al., 2004), which were expected to measure five motivations for YouTube consumption and participation: information-seeking, sharing information, status-seeking, social interaction, and entertainment.
Gender Disparities Exist in Informal Science Learning Broadly
Participating in informal science learning activities during childhood, such as going to the zoo or attending a science camp, can lead to working in STEM-related careers (Alexander et al., 2012; Bonnette et al., 2019; Todd and Zvoch, 2019). Past studies, however, have shown that girls are less likely to engage in these kinds of experiences than boys are (Hamilton et al., 1995; NSF, 2003). To address this disparity, informal science learning scholars have sought ways to create more gender inclusive environments using pedagogical and design strategies that would appeal to young women (e.g., Dancstep and Sindorf, 2018). These investments in gender inclusion might be working. For example, when investigating patterns of involvement in informal science learning experiences by gender, socioeconomic status, and area of residence (rural, urban), Hill et al. (2018) found that boys and girls generally did not differ in the quantity of their informal science experiences. When looking only at urban areas, however, girls actually participated more frequently than boys (Hill et al., 2018).
Fewer studies, however, investigate adult women's engagement with informal STEM learning experiences. One such study by Burks et al. (2017) examined gender-based engagement with their SciPop Talks! Program among college-aged adults. Although the audience was approximately gender balanced, the author reported surprising gender-based differences in the reasons given for attendance. More women said that they attended the event to earn class credit (47.3%) and fewer (40%) said they attended because they are interested in science. In contrast, a large majority of men (80.9%) said that they attended because they are interested in science, whereas fewer (38.3%) said they attended to earn class credit. This indicates a need to further investigate women's participation in informal science learning experiences, particularly investigating their motivations for engagement (i.e., their uses and gratifications, e.g., Ruggiero, 2000).
Public Media Is Also an Avenue for Informal Science Learning
Although museums and zoos, for example, are proven providers of informal science learning experiences, not all such experiences occur outside of the home. Informal science learning can occur through the use of science media, including traditional media (Maier et al., 2014) and digital media like YouTube (Tan, 2013; Rosenthal, 2018). Public media, in particular, offers credible educational programming across a variety of traditional and digital platforms (Donohue, 2017).
PBS, a private, non-profit corporation, provides over 1,200 h a year of educational and cultural programming for all ages. Though most of this content has traditionally been designed for television and radio, PBS recently has expanded onto digital, social media, and streaming platforms. For example, Boston Station WGBH, the largest content producer for PBS, launched the “Emerging Platforms Initiative” in 2019 to create original content on platforms like Snapchat, Instagram, Reddit, TikTok, and Twitch (Brewer, 2019). The first of such provisions was Escape Lab, a one-night, interactive escape room competition livestreamed on Twitch, aiming to generate enthusiasm for space and science (Brewer, 2019). As another example, PBS Digital Studios was created in 2012 to help develop multiplatform programming. PBS Digital Studios now includes a network of over 20 YouTube channels with over 22 million subscribers and over 2.2 billion lifetime views (About, 2020).
Media Producers Report Gender Disparities in Digital Video Use
With the extension onto digital, social media platforms, however, there is concern that the gender disparities will increase. Video streaming-type services, in particular, reportedly have largely male audiences (e.g., mediakix, 2017; Aslam, 2020). As described earlier, WGBH chose to create content for one of these emerging media platforms, Twitch, to engage younger audiences (ages 13–35). And, while Twitch's core demographic is young, it's audience is ~81.5% male (mediakix, 2017). There is mixed evidence on who composes the audience of YouTube. Market research firms tend to report that YouTube leans male; Digital marketing agency Omnicore, for example, states that 62% of YouTube users are male and 78% of U.S. men use YouTube; however, only 38% of YouTube users are female and 68% of U.S. women use YouTube (Aslam, 2020). This of female viewers (~38%) appears consistent with those reported by some of the science series for PBS Digital Studios. As stated earlier, Crash Course has an audience that is 65% male (and 35% female), and other shows like Deep Look (which typically showcases small creatures like fruit flies, ants, and earwigs) and This Is Chemistry have similar breakdowns in viewership by gender. Is 65%/35% the approximate base rate for male and female viewership? Have these shows, which appear to have gender disparities in viewership, actually reached gender parity given the existing audience on the platform? Not according to Google. The media giant reports that over 50% of YouTube's audience is female and attributes this statistic to a collaboration between themselves and Nielsen (Google, 2020). If this is true, then these shows do have a gender disparity in viewership and research ought to consider what might be the cause for the disparity and how to move forward.
Are Women a “Missing Audience” for Digital Science Video?
If there is a gender disparity in viewership of educational science programing on YouTube, then women are presumably a “missing audience.” The missing audience hypothesis (Kahan et al., 2016, 2017) proposes that there is an appetite for educational science programming among diverse audiences (such as minorities and women who traditionally are underrepresented in STEM), but certain cultural and/or social factors influence how these shows are perceived and the extent to which diverse audiences engage with them. After all, there is not much evidence to suggest that the typical audiences for educational science programming seen through data from Nielsen, for example, (often white, educated, liberal-leaning, and male) ought to be the only audiences targeted for such programming. For example, other types of science entertainment, like the CBS sitcom “Big Bang Theory” 1 and the popular hypothesis-testing reality TV show Myth Busters2, enjoy large and diverse audiences3. It is the apparently narrower reach of educational science programming that leads us to this conclusion.
Missing audiences for educational science media consist of individuals who are interested in engaging with science content, but for some yet unknown reason are not. To determine whom is interested in engaging with science content, my collaborators and I developed the “Science Curiosity Scale” (see also Kahan et al., 2017; Motta et al., 2019). Individuals' science curiosity scores are strongly predictive of their engagement with educational science video (Kahan et al., 2017) as well as other types of science media (Janét et al., 2020). In my collaborative research with KQED Science, we have found that in some cases, women were less likely than equally science curious men to agree to watch an educational science video (Kahan, 2019). For example, women who scored in the 95th percentile in science curiosity were ~26% less likely to agree to watch a nature video from Deep Look called “Turret Spiders Launch Sneak Attacks from Tiny Towers” than men who also scored in the 95th percentile in science curiosity (Kahan, 2019). This finding lends support to the hypothesis that women are a missing audience for digital science video.
The Current Study
Here, I evaluate data from two surveys that were collected between 2019 and 2020 to examine whether there is a gender disparity in YouTube use, whether there is a gender disparity in consumption of science content, and what are women's and men's uses and gratifications of science video on the platform. A unique feature of this study, for both surveys conducted, I asked participants to report their YouTube watch time data from the application. Although self-reported, this data is arguably more nuanced and accurate for estimating engagement with the platform compared to self-reported use on Likert-type scales (which I also included in the surveys) as it comes from an application that tracks participants' actual behavior. It is also worth noting that these data are from national, but not necessarily nationally representative, populations; thus, care should be taken when generalizing from the findings.
Materials and Methods
Data for this study come from two surveys.
Survey 1 (National Sample)
Participants (N = 1,003) were recruited by Qualtrics Research Services using quota sampling to approximate national representativeness in January 2020 as part of a larger study on alternative beliefs on YouTube (Landrum and Olshansky, 2020, Study 3). Approximately 45% of the sample's participants reported identifying as male and 55% reported identifying as female. The average age was 45.58 years (Median = 45, SD = 17.31, range 18–84). Most of the sample (62%) reported identifying as White and non-Hispanic/Latino, 14% identified as Black and non-Hispanic/Latino, 18% identified as Hispanic/Latino, 0.5% identified as Asian, and 2.5% identified as “other.” The remaining chose not to answer. Regarding political affiliation, 38.9% of the sample reported typically voting Democrat, 29.3% reported typically voting Republican, 12% reported voting independent or other, and 19.8% reported not voting. Furthermore, 32% of our sample reported having at least a college degree.
At the start of the survey, participants were told that we first wanted to capture actual information about how (and how often) people use YouTube. Therefore, in addition to answering a common self-report item (i.e., how often do you watch videos on YouTube?), participants were provided with instructions on how to access their “Time Watched” data from the YouTube application on their mobile devices and how to report these numbers. Instructions that participant saw for this task are shown in Figure 1.
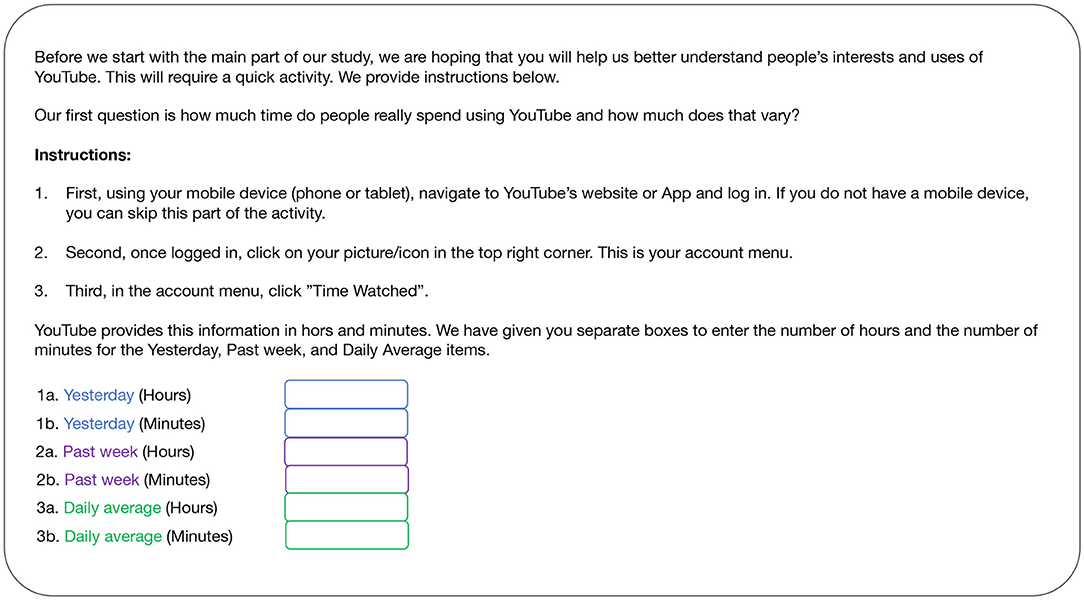
Figure 1. Instructions for reporting YouTube “Watch Time” metrics. Participants for Survey 2 also saw these instructions.
For this study, I used two metrics: “Time Watched—Last 7 Days” (M = 10.08 h, Median = 4.5, SD = 14.69, skew = 3.11) and “Time Watched—Daily Average” (M = 2.33 h, Median = 1.49, SD = 2.79, skew = 2.07). Although I also asked participants to report their metrics from “Yesterday” (as it is included in YouTube's reporting4 and I did not want to confuse participants), I did not plan to use this data because one date point could be idiosyncratic and the metrics spanning over a longer period (daily average, past week) would provide more accurate reflections of any one person's YouTube use. Only 574 participants in the sample reported the “Last 7 Days” number (nfemales = 312) and only 568 reported the daily average (nfemales = 310)5. Next, we asked participants to indicate the frequency with which they watched a variety of different video topics (e.g., government/politics, science, health and wellness, home repair, etc.) using the following scale: (1) never, (2) a few times a year at most, (3) a few times a month, (4), at least once a week, and (5) every day. We also collected standard demographics such as age, education, area of residence (rural, urban, suburban), religiosity, and political party. See Supplementary Materials.
Survey 2 (YouTube Users)
Participants (N = 556) were recruited using Cloud Research, a platform managed by Amazon's Mechanical Turk, during the summer of 2019. Using TurkPrime, I requested 500 participants who were categorized by the platform as “YouTube users” and were “naïve” workers (that is, the top 2% most active individuals with MTurk accounts, who are responsible for completing over 34% of the “human intelligence tasks,” or HITs, on the platform were excluded from being able to sign up for the study). Approximately 50% of the sample's participants reported identifying as male and 50% reported identifying as female. The average age was 35.07 (Median = 33, SD = 10.44, range 18–75). Most of the sample (69%) reported identifying as White and non-Hispanic/Latino, 13% identified as Black and non-Hispanic/Latino, 5% identified as Hispanic/Latino, 8% identified as Asian, and 2% identified as Native American. Regarding political affiliation, 48% of the sample reported typically voting Democrat, 24% reported typically voting Republican, 19% reported voting independent or other, and 9% reported not voting. Furthermore, 48% of the sample reported having at least a college degree.
Like for Survey 1, I collected multiple measurements of frequency of YouTube use including self-reported use (Never = 0%, Yearly = 1%, Monthly = 5%, Weekly = 26%, and Daily = 68%) and YouTube Watch Time data (last 7 days: M = 11.55 h, Median = 6.43, SD = 16.41, skew = 3.89; daily average: M = 1.9 h, Median = 1.1, SD = 2.44, skew = 2.87). Of the 556 participants for Survey 2, 460 participants (83%) reported the “Last 7 Days” number (nfemales = 211) and 457 (82%) reported the daily average (nfemales = 211). I also asked participants to report on their reasons for using YouTube more generally, following the uses and gratifications framework (see Ruggiero, 2000; Khan, 2017; Rosenthal, 2018). See Supplementary Materials.
In addition to measures of general YouTube use, I also asked participants questions about the specific kinds of topics and programming they watch on YouTube and I asked this in two ways. First, I asked how frequently participants watch different kinds of topics on YouTube (e.g., science, entertainment/celebrities, sports, new technologies, nature, or environment, etc.) using a 5-point scale (Never, A few times a year at most, A few times a month, at least once a week, or every day). Second, I asked participants to go into their YouTube history and report the last three videos that they watched, categorize those videos (see Supplementary Materials), and report their purpose for having accessed those videos, following the uses and gratifications framework (see Ruggiero, 2000; Rosenthal, 2018).
Unlike for Survey 1, Survey 2 included the science curiosity scale questionnaire (Kahan et al., 2017). These questions occurred at the beginning of Survey 2 and differed from the original SCS scale (Kahan et al., 2017) only in that I did not include the selection task item that typically requests that participants select an article set out of four choices (entertainment articles, business articles, sports articles, or science articles) before showing them an article from that set to read. Like prior uses of the scale, the scale was evaluated and scored for this study using item response theory. See the Supplementary Materials for more information.
Results
There Is Mixed Evidence That Female Participants Watched Less Video on YouTube
For this first analysis, I combined the data from the two surveys (combined N = 1,559). As I stated above, frequency of YouTube use was measured in three ways for both surveys: (1) participants' self-reported frequency of use (M = 4.14, SD = 1.21, Median = 5, range = 1–5) and participants' reports of their YouTube application watch time data (2) from the last 7 days (M = 10.73 h, SD = 15.49, Median = 5.6 h) and (3) the daily average (M = 2.14 h, SD = 2.65, Median = 1.25 h). Given that survey 2 was limited to YouTube users, participants from survey 2 were expected to report greater use across all three outcome variables than participants from survey 1. A preliminary MANOVA (valid N = 959) suggested a significant effect of survey (1 vs. 2, Pillai = 0.09, ~F = 29.55, p < 0.001) and a significant interaction effect between gender and survey (Pillai = 0.01, ~F = 3.80, p = 0.010). There was no significant main effect of gender (Pillai = 0.004, ~F = 1.41, p = 0.239). No other variables were included in the model. I followed up on the MANOVA with two-way ANOVAs for each dependent variable.
Self-Reported Frequency of Use
The ANOVA examining self-reported frequency of use also used the combined dataset (valid N = 1,479). Men (M = 4.21 of 5, SD = 1.21, median = 5, or “Daily,” n = 689) reported slightly greater frequency of use than women reported (M = 4.08 of 5, SD = 1.22, median = 4, or “Weekly,” n = 790), F(1,1,475) = 4.61, p = 0.032, d = 0.11, 95% CI[0.01, 0.21]. However, the difference in frequency of use between survey 1 (national sample: M = 3.89, SD = 1.36, n = 1,002) and survey 2 (YouTube users: M = 4.59, SD = 0.66, n = 556) participants was larger, F(1,1,475) = 127.15, p < 0.001, d = 0.61, 95% CI[0.50, 0.71]. There was no significant interaction effect between gender and survey on this outcome variable, F(1,1,475) = 2.46, p = 0.117.
YouTube Data: Total Watch Time (in Hours) for the Last Seven Days
The ANOVA examining total watch time for the last 7 days also used the combined dataset (valid N = 995). Participants from survey 2 (YouTube users: M = 13.65 hours, SD = 28.58, Median = 6.53 h, n = 460) reported a marginally greater, but not statistically different, watch time from the past 7 days than participants from survey 1 (national sample: M = 10.08 h, SD = 14.69, median = 4.5 h, n = 574), F(1, 991) = 2.99, p = 0.084, d = −0.10, 95% CI[−0.22, 0.03]. There was a significant, but small difference between men (M = 11.88 h, SD = 15.43, median = 7 h, n = 472) and women (M = 9.86 h, SD = 15.75, median = 4.53 h, n = 523), F(1, 991) = 4.19, p = 0.041, d = 0.13, 95% CI[0.01, 0.25]. There was no interaction effect between gender and survey, F(1, 991) = 1.06, p = 0.304. See Figure 1.
YouTube Data: Average Daily Watch Time (in Hours)
The ANOVA examining average daily watch time also used the combined dataset (valid N = 987). Participants' daily average differed by survey, but this time survey 1 participants (national sample: M = 2.33 h, SD = 2.79, median = 1.49 h, n = 568) reported a greater daily average than survey 2 participants reported (YouTube users: M = 1.9 hours, SD = 2.44, median = 1.1 h, n = 457), F(1, 983) = 5.92, p = 0.015, d = 0.17, 95% CI[0.04, 0.29]. There was not a significant difference between men (M = 2.29 h, SD = 2.6, median = 1.52 h, n = 466) and women (M = 2.04 h, SD = 2.68, median = 1.12 h, n = 521), F(1, 983) = 2.19, p = 0.139, d = 0.09, 95% CI[−0.03, 0.22]. There was also no interaction effect between gender and survey, F(1, 983) = 0.17, p = 0.685. See Figure 2.
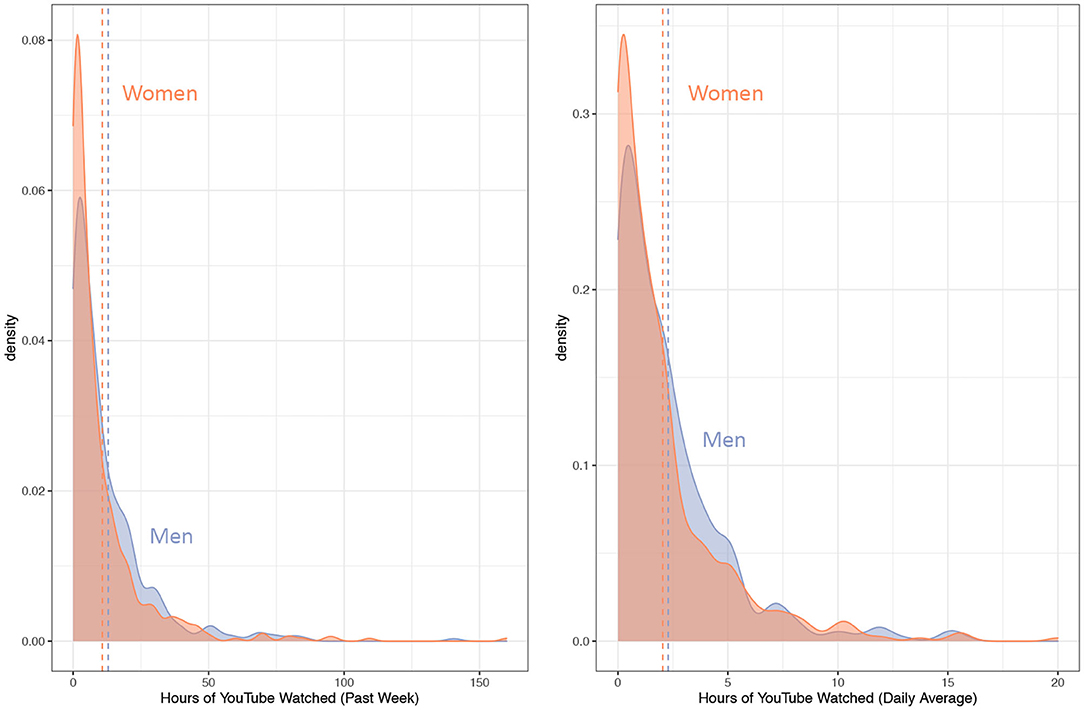
Figure 2. Distribution of watch time for men and women. Figure on the left is the number of hours watched in the past seven days (past week). Figure on the right is the number of hours watched on average each day (daily average). Dotted lines represent the average for each gender.
Age, Not Gender, Is the Strongest Predictor of Reported Frequency of YouTube Use
To examine the relative impact of gender on YouTube use (compared to other individual differences variables), I conducted lmg tests of relative importance (Lindeman et al., 1980; Grömping, 2006) on results from multiple regression analysis using general linear models (glm; See Table 1) to determine the demographic factor with the strongest influence on YouTube use. The lmg statistic (or average semi-partial) provides the average proportion of variance explained across all possible orderings of the variables in multiple regression using sequential sums of squares (Lindeman et al., 1980). These analyses also used the combined dataset (valid N for “use” model = 1,436; valid N for “past week” model = 965; valid N for “daily average” model = 956). Across all three dependent variables, age was an important predictor of YouTube use: perhaps unsurprisingly, younger participants reported greater use of the platform than older participants. Area of residence (suburban, urban, or rural) was generally the next strongest predictor, with urban-dwelling participants reporting greater use of the platform (Self-Report: M = 4.37, SD = 1.07; Last 7 Days: M = 13.22, SD = 17.74; Daily Average: M = 2.42; SD = 2.78) than suburban-dwelling (Self-Report: M = 4.03, SD = 1.27; Last 7 Days: M = 9.15, SD = 13.87; Daily Average: M = 1.84; SD = 2.43) and rural-dwelling ones (Self-Report: M = 3.94, SD = 1.29; Last 7 Days: M = 10.35, SD = 14.94; Daily Average: M = 2.28; SD = 2.72). Reporting that one identified as Black or African American was the relatively most important predictor of one's reported daily average (lmg = 2.19): Black participants reported a greater daily average (M = 3.17 h, SD = 3.09, Median = 2.08, n = 140) than non-Black participants reported (M = 1.98 h, SD = 2.53, Median = 1.12, n = 885, d = 0.426). See Table 1. Although gender was a statistically significant factor in predicting YouTube use, it was relatively less important than these other individual variables. This relative lack of importance can be clearly seen in Figure 3.
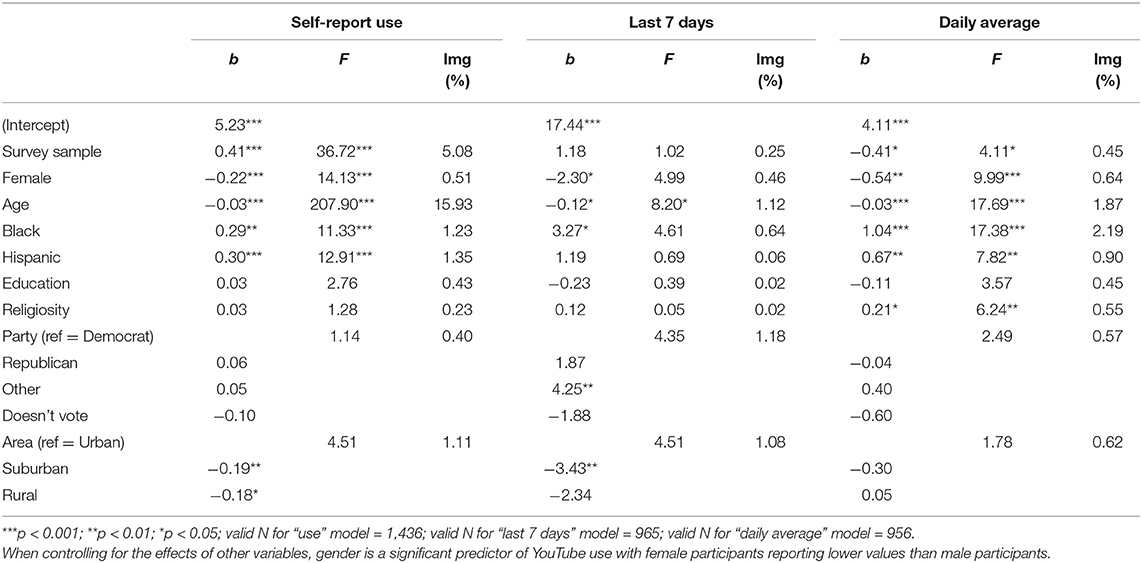
Table 1. Predicting YouTube Use with Survey 1 and 2 participants combined.
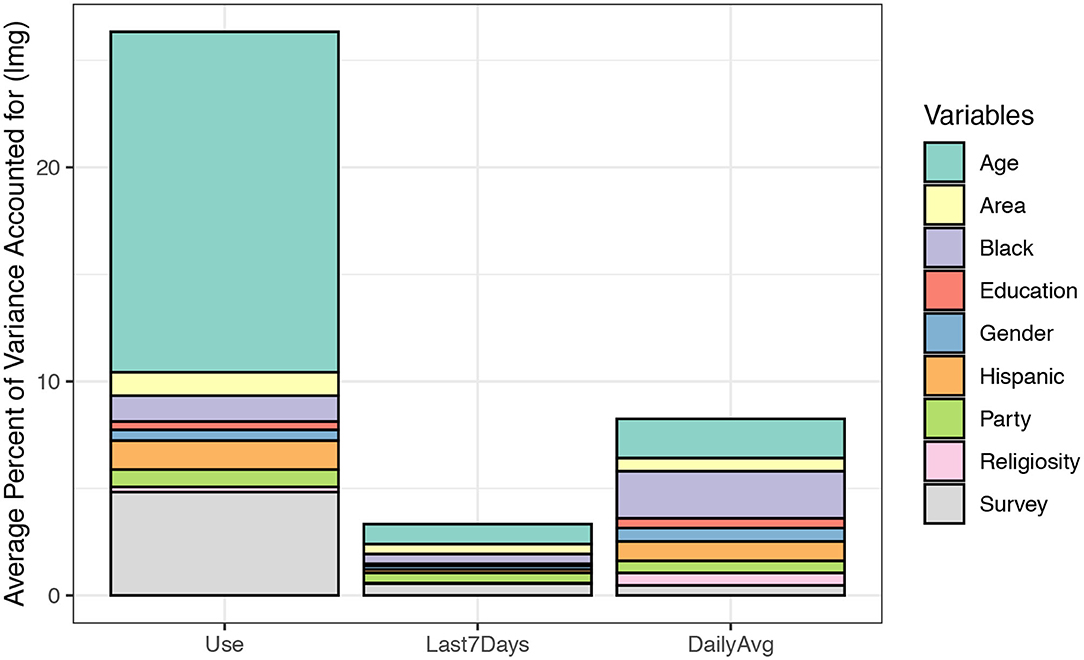
Figure 3. Relative importance of each of the individual difference variables. Age is the most important factor included in the model. Any effects of gender are negligible compared to the influence of age on frequency of YouTube use.
Women Report Using YouTube Generally for the Same Uses and Gratifications as Men
I also wanted to examine whether women's uses and gratifications of YouTube more broadly are different than men's and, if so, what predicts the propensity of these different reasons for use. As I described in the Materials and Methods section, Survey 2 included questions about participants' uses and gratifications of YouTube (Survey 1 did not), thus this analysis includes data only from the MTurk sample. A confirmatory factor analysis (valid N = 521) supported the 5-factor model of uses and gratifications from Khan (2017) using the standards described by Bowman and Goodboy (2020), χ2 = 1028.01, p < 0.001; SRMR = 0.07; RMSEA = 0.07, 95% CI[0.07, 0.08]; CFI = 0.86. These dimensions include using YouTube for information seeking, for entertainment, for sharing content, for status seeking, and for social networking. Scores were calculated for each of the factors by averaging across the items that load onto each factor. See Table 2.
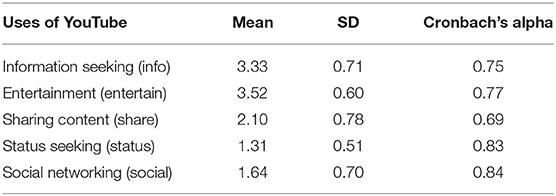
Table 2. Descriptive statistics for uses and gratifications subscales.
Next, I conducted a MANOVA predicting the five uses and gratifications of YouTube from age, gender, and science curiosity. Again, this analysis was conducted on the MTurk sample of YouTube users only (valid N = 501). There was a main effect of science curiosity (Pillai = 0.16, ~F = 19.14, p < 0.001), age (Pillai = 0.12, ~F = 13.31, p < 0.001), and gender (Pillai = 0.03, ~F = 3.15, p = 0.008). However, no interactions were significant (all ps > 0.169); thus, no interactions were included in the follow-up GLM analyses.
Next, I conducted follow-up GLM analyses (valid N = 501) predicting each of the uses and gratifications category scores (e.g., information seeking, entertainment) from participants' science curiosity scores, age, and gender. See Table 3. Science curiosity was a significant predictor of each of the YouTube use scores, except for entertainment. Age was negatively associated with using YouTube to impress others/status-seeking and for entertainment; younger participants had higher scores on these dimensions than older participants. The only gender difference was in the reported use of YouTube for impressing others. Although both genders reported low scores on this measure, Men (M = 1.42 of 5, SD = 0.63, n = 250) scored higher on using YouTube to impress others or seek status than women did (M = 1.22, SD = 0.33, n = 251, d = 0.40). Also see Figure 4.
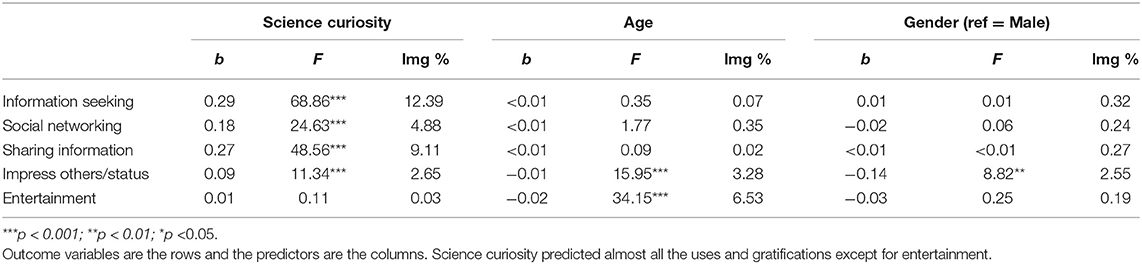
Table 3. Predicting the different uses and gratifications of YouTube.
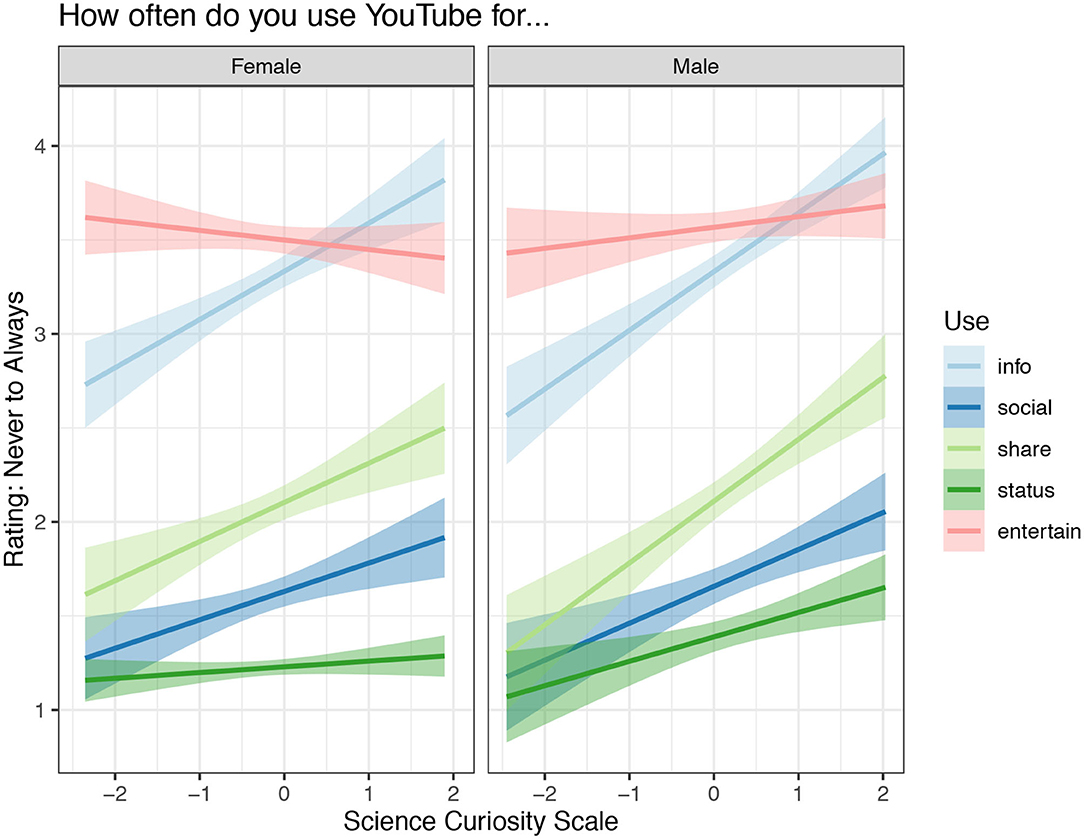
Figure 4. Predicting each of the five uses and gratifications of YouTube from participants' science curiosity scores by gender. Among our sample participants, science curiosity does not predict using YouTube for entertainment purposes, but this was the most common use among participants.
Men Report Watching More Videos About Science and Technology Than Women Do
To examine gender differences in frequency of watching digital video based on topic, I conducted a mixed-design ANOVA on the combined Study 1 and Study 2 data sets (valid N = 1,272) where video topic was treated as a within-subjects variable and gender and survey (1 vs. 2) were treated as between-subjects variables. As a reminder, participants rated each topic independently on a scale from never (1) to everyday (5), and the video topics included music, television, health and wellness, environment, science, home repair, technology, government, and sports.
There was no significant main effect of survey sample, F(1,1268) = 0.47, p = 0.492, < 0.001. There was a main effect, though, of gender, F(1,1,268) = 50.16, p < 0.001, = 0.038. Across the different topic types and surveys, female participants (M = 2.66 of 5, 95% CI[2.60, 2.73]) reported watching YouTube less frequently than male participants reported (M = 3.00, 95% CI[2.93, 3.06]). There was also a main effect of topic, F(8,10,144) = 238.01, p < 0.001, = 0.158. Planned contrasts comparing each of the video topics to the science topic finds that, collapsed across gender and survey, participants reported watching science videos (M = 2.72, 95% CI[2.66, 2.79]) significantly more often than sports videos (Msports = 2.52, 95% CI[2.44, 2.59], p < 0.001, = 0.018), government videos (Mgov = 2.62, 95% CI[2.54, 2.69], p = 0.007, = 0.006, home repair videos (Mhome = 2.51, 95% CI[2.45, 2.57], p < 0.001, = 0.031, and videos about the environment (Menv = 2.65, 95% CI[2.59, 2.72], p = 0.025, = 0.004. In contrast, participants reported watching science videos less often than watching television clips (Mtv = 3.15, 95% CI[3.09, 3.22], p < 0.001, = 0.094) and less often than listening to music on YouTube (Mmusic = 3.82, 95% CI[3.76, 3.89], p < 0.001, = 0.377).
Furthermore, we found a significant interaction effect between topic and gender, F(8,10,144) = 48.51, p < 0.001, = 0.037. Planned contrasts comparing the effect of gender for the science video to the effect of gender for each of the other topics find that the gender difference for watching science videos is bigger than the gender differences for watching music videos (p < 0.001, = 0.022), television clips (p < 0.001, = 0.020), health and wellness videos (p < 0.001, = 0.032), environmental videos (p < 0.001, = 0.021), and home repair videos (p < 0.001, = 0.013). However, the gender difference is smaller for watching science videos than for watching sports videos (p < 0.001, = 0.047) and videos about technology (p < 0.001, = 0.012). The gender difference for watching government videos is roughly equivalent to that of watching science videos (p = 0.823, < 0.001). See Figure 5, Table 4.
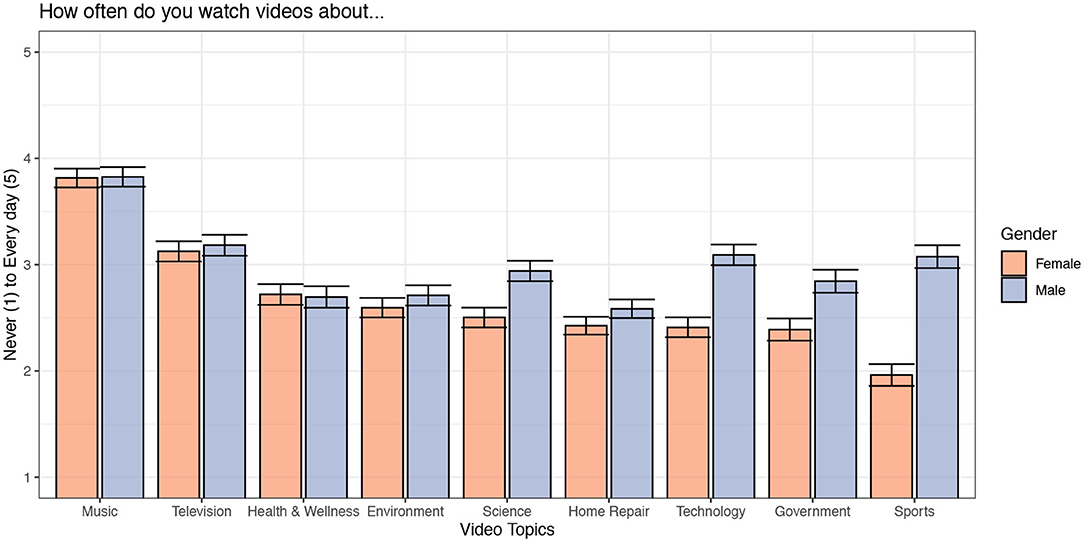
Figure 5. Estimated marginal means. Topics are sorted by females' ratings. Error bars represent 95% confidence intervals.
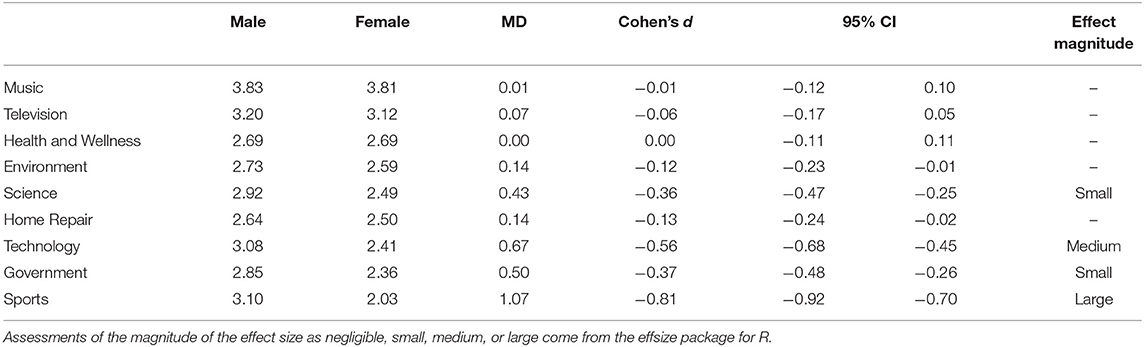
Table 4. Comparing average frequency of viewing for males and females across the different topics.
Notably, this data is based on self-reported exposure to these video topics and not their YouTube data.
Men Are More Likely to Have a Technology Video in Their Watch History
As part of Survey 2, I collected behavioral data by asking participants to open their YouTube histories and report the last three videos they had watched. For each video they listed, I asked participants to identify what categories they feel the video fit into (e.g., politics, science, sports, music; this was a check-all-that-apply question) and choose which of 5 response options best explains their purpose for having accessed the video: to get information, to be entertained, to relieve boredom, to connect with others, or other (please specify). Of course, this method is not without its limitations; participants could have lied or cherry-picked videos from their history based on how they would like to be perceived.
I recoded these responses in to four separate variables that accounted for whether participants categorized any one of those three videos as a science video, as a technology video, as a health and wellness video, and as an entertainment video. Of 556 participants, only 48 reported that at least one of the three videos they last watched on YouTube was a science video. Of this group, 20 were female. A chi-square test suggested no difference in the likelihood of having categorized one of the three videos as a science video based on participants' gender, = 0.62, p = 0.430. Also, 50 participants (17 women) reported that at least one of those three videos they listed was a video about technology. A chi-square test suggested that men were more likely to have reported watching a technology video than women, = 5.08, p = 0.024. Furthermore, 64 participants (46 female) reported that at least one of the videos they watched was a health and wellness video. A chi-square test suggested that women were more likely to have reported watching a health and wellness video than men, = 12.97, p < 0.001. Finally, 166 participants (79 female) reported that at least one of the videos they watched was an entertainment video. A chi-square test suggested no difference in the likelihood of having categorized one of the three videos as an entertainment video based on participants' gender, = 0.33, p = 0.567.
Supporting our prior work suggesting that our science curiosity scale (Kahan et al., 2017) predicts engagement with science media (e.g., Janét et al., 2020), logistic regression analyses show that science curiosity was positively associated with listing at least one science video (b = 0.59, exp(b) = 1.81, 95% CI[1.28, 2.60], p < 0.001) and at least one technology video (b = 0.53, exp(b) = 1.70, 95% CI[1.21, 2.41], p = 0.002). Notably, it was not associated with listing at least one health and wellness video (b = −0.09, exp(b) = 0.91, 95% CI[0.68, 1.23], p = 0.555) or entertainment video (b = 0.02, exp(b) = 1.01, 95% CI[0.82, 1.26], p = 0.883). Note that these were separate logistic regression analyses for each of the video topics and not multinomial logistic regression analyses nor logistic regression analyses where topic was a predictor. See Figure 6.
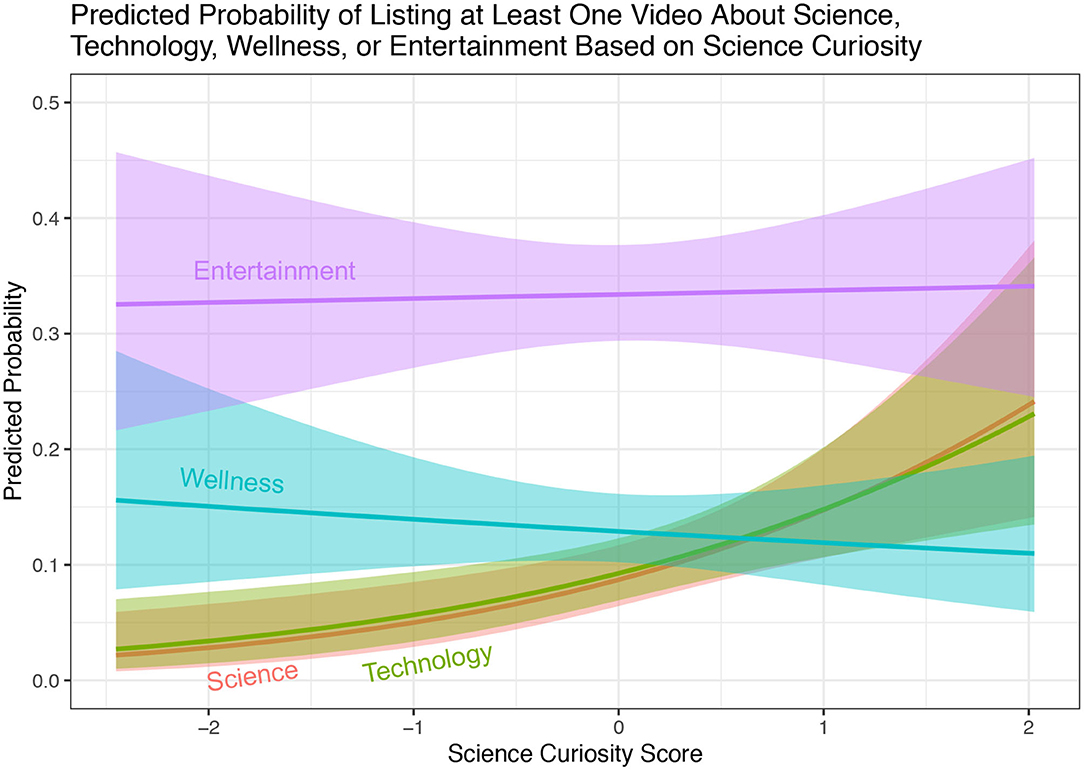
Figure 6. Predicted probabilities of listing at least one of each video types.
Women Seem More Likely to Access Science Videos for Information Gathering; Men Access Science Videos for Both Information Gathering and Entertainment
The reasons given for having accessed the science videos appear to vary based on gender. Of 34 total videos (categorized as “science” by the participants) that were listed by male participants, 38% were said to have been accessed for entertainment purposes and 53% were said to have been accessed for information gathering. In contrast, of the 27 total videos (categorized as “science”) that were listed by female participants, only 19% were said to have been accessed for entertainment, whereas 74% were said to have been accessed for information gathering purposes. We can compare these values to the other 72 videos that were listed by these same participants and not categorized as science. The group of men who had listed at least one science video had also listed a total of 42 non-science videos (videos that they did not categorize as science). Of these videos, 55% were said to have been accessed for entertainment purposes and 31% were said to have been accessed for information gathering. The group of women who had listed at least once science video had also listed a total of 30 non-science videos. Of these, 37% were said to have been accessed for entertainment purposes and 43% were said to have been accessed for information gathering.
Discussion
I used data from two surveys with non-probability samples to examine four questions. The first question asked whether it is the case that men watch YouTube more frequently than women, and if not, what is the relative importance of gender and what is the strongest predictor of YouTube use. I did not find resounding evidence that men watch more YouTube, generally, than women. Although men reported a slightly higher frequency of using YouTube, on average, than women when using the Likert-type scales, their reported data from YouTube shows no clear gender differences. One possibility for this lack of difference (should one exist in reality) is that women were less likely to answer the questions (i.e., report the analytics from their YouTube account) because they are less likely to use YouTube. Follow-up analyses, however, do not support this idea. When predicting the probability of not answering the two items asking participants to report their YouTube data, only age, education, and self-reported frequency of use (using the Likert-type scale) were significant. Indeed, people who reported using YouTube less often were more likely to skip those items (past week: b = −0.51, exp(b) = 0.60, p < 0.001; daily avg: b = −0.48, exp(b) = 0.62, p < 0.001). Older individuals were slightly more likely to skip those items than younger ones (past week: b = 0.03, exp(b) = 1.03, p < 0.001; daily avg: b = 0.03, exp(b) = 1.03, p < 0.001). Furthermore, people with less education were more likely to skip these items (past week: b = −0.12, exp(b) = 0.89, p = 0.003; daily avg: b = −0.14, exp(b) = 0.87, p < 0.001). Women were not more or less likely to skip these questions than men (past week: b = 0.12, exp(b) = 1.12, p = 0.354; daily avg: b = 0.07, exp(b) = 1.07, p = 0.586).
Even in the case where gender was a statistically significant predictor of YouTube use, its relative importance for predicting use is very low. Figure 3 illustrates this quite clearly. The strongest demographic predictor of YouTube use was younger age, but people who identify as Black or African American also reported greater use. It is important to keep in mind that only 13% of the participants (n = 205) reported identifying this way; therefore, these results may not be representative of Black/African Americans more generally. Future studies interested in examining differences in YouTube engagement based on race and/or ethnicity ought to oversample from the populations of interest.
The second question I asked was whether women use the platform differently (or for different reasons) than men. For the most part, participant gender did not predict the propensity of each of the different uses and gratifications of YouTube. The two primary uses of YouTube were information seeking and entertainment and the least common use was status seeking. The only gender difference was in self-reported use of YouTube for status seeking, with women reporting less use for this purpose than men; however, this was not a common reason for YouTube use among either group. Science curiosity was predictive of each of the uses except for entertainment. Notably, this is predicting general uses and gratifications of YouTube and not uses and gratifications of science content more specifically.
The third question I asked is whether men were more inclined to watch science and technology video than women. We did find support for the hypothesis that this is the case. In fact, small gender gaps exist for self-reported frequency of watching videos about science and government, medium gender gaps exist for watching technology videos, and large gender gaps exist for watching sports videos. There were no situations among those we asked about in which women reported greater viewership than men. See Figure 4. This finding is bolstered by participants' reports of the last three videos in their watch history (from the YouTube application), at least for technology videos; I found that men were much more likely to have a video in their recent watch history that they consider a “technology” video than women, but this was not the case for science videos. Women were, however, more likely than men to have a video in their recent watch history that they categorized as “health and wellness.” An important caveat here is that we asked participants to categorize the videos on their own. In the Supplementary Materials, I provide a table of all of the videos participants categorized as “Science.” There may be disagreement among participants (and between participants, scientists, and science media professionals) as to what ought to be categorized as science. For example, one participant reported a video he watched of two cars racing. A couple participants reported watching videos about UFOs. With co-authors, I've explored a similar question of who people think counts as a scientist (Suldovsky et al., 2019). Future research ought to follow-up on what videos lay audiences perceive to be “science content” and what the implications of that are for science acceptance and understanding.
The last question I asked is when women do watch science video, why do they watch them. Descriptively, there do seem to be differences between men and women in why they access videos that are consistent with the instrumental vs. curiosity-satisfying motivations described by Burks et al. (2017). In this study, women primarily said that they watched the science videos for informational purposes (74%) with only 19% citing entertainment. Men were more divided with about half citing information seeking as a motive and 38% citing entertainment. Future research ought to continue to examine gender differences in instrumental vs. curiosity-satisfying motivations for engaging with science media.
The purpose of this research was to determine whether such gender differences exist, but it does not address the reasons for the observed differences. Women appear to be a missing audience for science content on YouTube, but why? One hypothesis is that the characteristics of current science programming (and maybe even streaming platforms) unintentionally signal to women that the content (and/or the space) is not “for them.” Future work can pull from research on stereotype threat, stereotype fit, and gender schema theory to better understand the reasons for the gender disparities in engagement with STEM video on digital platforms. Once these reasons are better understood, then targeted interventions can be designed to create informal STEM learning content that reaches more diverse audiences.
Data Availability Statement
Publicly available datasets were analyzed in this study. This data can be found here: Open Science Framework: https://osf.io/a253m/.
Ethics Statement
The data used in this paper were from two studies (IRB218-1038, IRB2018-531) approved by the Institutional Review Board at Texas Tech University. The participants provided their written informed consent to participate in the study.
Author Contributions
The author confirms being the sole contributor of this work and has approved it for publication.
Funding
This research was supported in part by a collaborative National Science Foundation grant awarded to AL (DRL 1810990) and her public media collaborators S. E. McCann and S. Eris (DRL 1811019). The funders had no role in the study design, data collection and analysis, decision to publish, or preparation of the manuscript.
Conflict of Interest
The author declares that the research was conducted in the absence of any commercial or financial relationships that could be construed as a potential conflict of interest.
Supplementary Material
The Supplementary Material for this article can be found online at: https://www.frontiersin.org/articles/10.3389/fcomm.2021.610920/full#supplementary-material
Footnotes
1. ^https://yougov.co.uk/topics/media/explore/tv_programme/The_Big_Bang_Theory
2. ^https://today.yougov.com/topics/media/explore/tv_show/MythBusters
3. ^https://today.yougov.com/topics/media/articles-reports/2018/04/30/americas-most-popular-tv-shows
4. ^Since the data collection for these two surveys, YouTube has changed the metrics they report. Instead of “yesterday” they now provide “today” in addition to past week (last 7 days) and the daily average.
5. ^It is possible that the participants who did not answer these questions are not “missing at random”, and they didn't complete the task because they never watch YouTube or do not have a YouTube account. It is also possible, however, that the participants who did not complete this task vary in their YouTube use, but simply didn't feel like going through the trouble and skipped to the next question on the survey.
6. ^As the two samples have greatly different sample sizes and standard deviations, Hedges's g (g = 0.46) or Glass's delta (delta = 0.48) may be more appropriate measurements of effect size.
References
About (2020). PBS Digital Studios. Retrieved from: https://www.pbs.org/digital-studios/about/ (accessed July 18, 2020).
Alexander, J. M., Johnson, K. E., and Kelley, K. (2012). Longitudinal analysis of the relations between opportunities to learn about science and the development of interests related to science. Sci. Educ. 96, 763–786. doi: 10.1002/sce.21018
Aslam, S. (2020). YouTube by the Numbers: Stats, Demographics and Fun Facts. Available online at: https://www.omnicoreagency.com/youtube-statistics/ (accessed September 15, 2020).
Bonnette, R. N., Crowley, K., and Schunn, C. D. (2019). Falling in love and staying in love with science: ongoing informal science experiences support fascination for all children. Int. J. Sci. Educ. 41, 1626–1643. doi: 10.1080/09500693.2019.1623431
Bowman, N. D., and Goodboy, A. K. (2020). Evolving considerations and empirical approaches to construct validity in communication science. Ann. Int. Commun. Assoc. 44, 219–234. doi: 10.1080/23808985.2020.1792791
Brewer, S. (2019). WGBH Launches Escape Lab, a Live Escape Room Show To Stream on Twitch Sept. 9. Available online at: https://www.wgbh.org/foundation/press/wgbh-launches-escape-lab-a-live-escape-room-show-to-stream-on-twitch-sept-9 (accessed September 6, 2019).
Burks, R., Deards, K. D., and DeFrain, E. (2017). Where science intersects pop culture: an informal science education outreach program. J. Chem. Educ. 94, 1918–1924. doi: 10.1021/acs.jchemed.7b00070
Dancstep, T., and Sindorf, L. (2018). Creating a female-responsive design framework for STEM exhibits. Curator Museum J. 61, 469–484. doi: 10.1111/cura.12268
Dasgupta, N., and Stout, J. G. (2014). Girls and women in science, technology, engineering, and mathematics: STEMing the tide and broadening participation in STEM careers. Policy Insights Behav. Brain Sci. 1, 21–29. doi: 10.1177/2372732214549471
Dholakia, U. M., Bagozzi, R. P., and Pearo, L. K. (2004). A social influence model of consumer participation in network- and small-group-based virtual communities. Int. J. Res. Market. 21, 241–263. doi: 10.1016/j.ijresmar.2003.12.004
Donohue, C. (2017). “Public media and learning at home,” in Family Engagement in the Digital Age: Early Childhood Educators as Media Mentors, ed. C. Donahue (New York, NY: Routledge), 245–269. doi: 10.4324/9781315657707
Google (2020). The Latest YouTube Stats on Audience Demographics. Think With Google. Retrieved from: https://www.thinkwithgoogle.com/data-collections/youtube-viewer-behavior-online-video-audience/ (accessed August 5, 2020).
Grömping, U. (2006). Relative importance for linear regression in R: the package relaimpo. J. Stat. Softw. 17, 1–27. doi: 10.18637/jss.v017.i01
Hamilton, L. S., Nussbaum, E. M., Kupermintz, H., Kerkhoven, J. I. M., and Snow, R. E. (1995). Enhancing the validity and usefulness of large-scale educational assessments: II. NELS:88 science achievement. Am. Educ. Res. J. 32. doi: 10.3102/00028312032003555
Hill, P. W., Mcquillan, J., Hebets, E., Spiegel, A., and Diamond, J. (2018). Informal science experiences among urban and rural youth: exploring differences at the intersections of socioeconomic status, gender and ethnicity. J. STEM Outreach 1, 1–12. doi: 10.15695/jstem/v1i1.28
Janét, K., Richards, O., and Landrum, A. R. (2020). Headline format influences evaluation of, but not engagement with, environmental news. Journalism Practice 1–21. doi: 10.1080/17512786.2020.1805794
Kahan, D. M. (2019). Cracking the Code: A Deep Look at Gender Disparity. Available online at: https://drive.google.com/file/d/1PQ1PEukuz_Rgv3_icmLxw58VbtPkfpBj/view (accessed September 26, 2020).
Kahan, D. M., Carpenter, K., and Landrum, A. R. (2016). Evidence-Based Science Filmmaking Initiative: Study No. 1 (No. 1). doi: 10.2139/ssrn.2713563
Kahan, D. M., Landrum, A., Carpenter, K., Helft, L., and Hall Jamieson, K. (2017). Science curiosity and political information processing. Polit. Psychol. 38, 179–199. doi: 10.1111/pops.12396
Khan, M. L. (2017). Social media engagement: what motivates user participation and consumption on YouTube? Comput. Human Behav. 66, 236–247. doi: 10.1016/j.chb.2016.09.024
Landrum, A. R., and Olshansky, A. (2020). Third-person perceptions and calls for censorship of flat earth videos on YouTube. Media Commun. 8, 387–400. doi: 10.17645/mac.v8i2.2853
Lindeman, R. H., Merenda, P. F., and Gold, R. Z. (1980). Introduction to Bivariate and Multivariate Analysis. Scott: Foresman and Company.
Maier, M., Rothmund, T., Retzbach, A., Otto, L., and Besley, J. C. (2014). Informal learning through science media usage. Educ. Psychol. 49, 86–103. doi: 10.1080/00461520.2014.916215
mediakix (2017). Twitch Stats: 11 Twitch.tv Gaming Statistics Marketers Should Know. Mediakix. Available online at: https://mediakix.com/blog/top-twitch-statistics-live-streaming-game-platform/ (accessed February 18, 2017).
Moll, R., and Nielsen, W. (2017). Development and validation of a social media and science learning survey. Int. J. Sci. Educ. B 7, 14–30. doi: 10.1080/21548455.2016.1161255
Motta, M., Chapman, D., Haglin, K., and Kahan, D. (2019). Reducing the administrative demands of the Science Curiosity Scale: a validation study. Int. J. Public Opin. Res. 2019:edz049. doi: 10.1093.ijpor/edz049
NSF (2003). New Formulas for America's Workforce: Girls in Science and Engineering (NSF03-207). National Science Foundation. Available online at: https://www.nsf.gov/pubs/2003/nsf03207/nsf03207.pdf (accessed September 26, 2020).
Rosenthal, S. (2018). Motivations to seek science videos on YouTube: free-choice learning in a connected society. Int. J. Sci. Educ. B 8, 22–39. doi: 10.1080/21548455.2017.1371357
Rubin, A. M. (2009). “Uses-and-gratifications perspective on media effects,” in Media Effects: Advances in Theory and Research, 3rd Edn, eds. J. Bryant and M. B. Oliver (New York, NY: Routledge), 165–184.
Ruggiero, T. E. (2000). Uses and gratifications theory in the 21st century. Mass Commun. Soc. 3, 3–37. doi: 10.1207/S15327825MCS0301_02
Sadler, P. M., Sonnert, G., Hazari, Z., and Tai, R. (2012). Stability and volatility of STEM career interest in high school: a gender study. Sci. Educ. 96, 411–427. doi: 10.1002/sce.21007
Stoet, G., and Geary, D. C. (2018). The gender-equality paradox in science, technology, engineering, and mathematics education. Psychol. Sci. 29, 581–593. doi: 10.1177/0956797617741719
Suldovsky, B., Landrum, A., and Stroud, N. J. (2019). Public perceptions of who counts as a scientist for controversial science. Public Understand. Sci. 28, 797–811. doi: 10.1177/0963662519856768
Tan, E. (2013). Informal learning on YouTube: exploring digital literacy in independent online learning. Learn. Media Technol. 38, 463–477. doi: 10.1080/17439884.2013.783594
Keywords: informal science learning, public media, science communication, science media, women, YouTube
Citation: Landrum AR (2021) Are Women a Missing Audience for Science on YouTube? An Exploratory Study. Front. Commun. 6:610920. doi: 10.3389/fcomm.2021.610920
Received: 27 September 2020; Accepted: 12 March 2021;
Published: 14 April 2021.
Edited by:
Anders Hansen, University of Leicester, United KingdomReviewed by:
Sara K. Yeo, The University of Utah, United StatesMatt Motta, Oklahoma State University, United States
Copyright © 2021 Landrum. This is an open-access article distributed under the terms of the Creative Commons Attribution License (CC BY). The use, distribution or reproduction in other forums is permitted, provided the original author(s) and the copyright owner(s) are credited and that the original publication in this journal is cited, in accordance with accepted academic practice. No use, distribution or reproduction is permitted which does not comply with these terms.
*Correspondence: Asheley R. Landrum, YS5sYW5kcnVtQHR0dS5lZHU=