 Misa Ando1†
 Shushi Namba
 Kazuaki Abe
 Toshimune Kambara
- 1Program in Psychology, School of Education, Hiroshima University, Higashihiroshima, Japan
- 2Department of Psychology, Graduate School of Education, Hiroshima University, Higashihiroshima, Japan
- 3Psychological Process Team, BZP, Robotics Project, RIKEN, Kyoto, Japan
Verbal sounds can be associated with specific meanings, a phenomenon called sound symbolism. Previous findings of sound symbolism have shown that words including specific consonants or vowels or mouth shapes to pronounce specific vowels associate with specific and subjective physical and emotional evaluations. The purpose of this study was to examine whether each written vowel in a given language was individually associated with specific subjective evaluations. Six hundred and thirteen participants used five-point semantic differential scales for 10 features (size, closeness, thickness, width, weight, height, depth, affection, excitement and familiarity) to rate written Japanese vowels (a, i, u, e, and o). The results showed that the size, closeness, thickness and width of a, u and o were significantly higher than those of i and e, whereas the affection and familiarity of a were higher than the others. These results were consistent with previous findings in which vowels in sound-symbolic words have been associated with physical (i.e., size, closeness, thickness and width) and emotional (i.e., affection) evaluations. Our findings suggest that each written Japanese vowel itself, with its individual characteristics, could individually contribute to specific and subjective physical and emotional evaluations. These findings provide insights on how we could better use letters for communicative relationships among writers and readers.
Introduction
In psycholinguistic studies, while the dominant phenomenon would be arbitrariness–that words are arbitrarily associated with referents (De Saussure, 1916)—the parallel or competing phenomenon, which may appear more strongly in some languages than others, is sound symbolism. This means that words, including specific vowels and consonants, are non-arbitrarily associated with specific sensorimotor and emotional features (Hamano, 1998; Imai and Kita, 2014; Sidhu and Pexman, 2019; Kawahara, 2020). Psycholinguistic studies have assumed that the occurrence of the sound-symbolic phenomena would connect to the oral shape during the production of verbal sounds (e.g., Sapir, 1929; Namba and Kambara, 2020). Thus, the sound-symbolic phenomena can occur not only in a word, but also in a verbal sound itself, like a vowel. In fact, sound-symbolic phenomena occur in both real words and pseudowords (Sidhu and Pexman, 2019). For example, specific pseudowords (e.g., maluma or bouba) are significantly associated with round figures, while other specific pseudowords (e.g., takete or kiki) are associated with pointy figures (bouba-kiki effect, Köhler, 1947; Ramachandran and Hubbard, 2001; Westbury, 2005; Styles and Gawne, 2017; Aryani et al., 2020). In addition, French speakers associate pseudowords including round sounds or grammatically feminine endings with round shapes (Sidhu et al., 2019). The non-arbitrary relationships between pseudowords and referents also occur based on orthographically non-arbitrary relationships between pseudowords and figures. Cuskley et al. (2017) showed that both spoken and written pseudowords (e.g., gege) orthographically associate with meaningless figures (e.g., a round shape). Another study also found that participants quickly matched spiky frames with angular fonts (De Carolis et al., 2018). These findings suggest that while sound symbolism is not an illusion that would actually be explained by purely visual phenomena involving the shape of letters (especially since sound symbolism occurs in human communities who do not have a written system for their languages), the visual shape of written stimuli might lead to additional effects that might partially blur sound symbolic associations. Sound symbolism has been examined in behavioral experiments for word evaluation (Kambara and Umemura, 2021) and word learning (Imai et al., 2008; Kantartzis et al., 2011), and neuroscientific experiments for word comprehension (Osaka, 2011) and word learning (Asano et al., 2015; Yang et al., 2019). For instance, mismatched relationships between words (e.g., kipi) and referents (e.g., a round figure) increase mismatch negativity of event-related brain potentials around 400 ms after stimulus onset (N400) for 11-month-old infants compared to matched relationships between words (e.g., moma) and referents (e.g., a round figure; see Asano et al., 2015). Sound symbolism also facilitates word learning in first and second languages (Imai et al., 2008; Kantartzis et al., 2011; Imai and Kita, 2014; ), although previous findings have also suggested that participants also arbitrarily associate novel words, including unfamiliar and meaningless words, with referents (e.g., Kambara et al., 2013; Takashima et al., 2014; Takashima et al., 2017; Liu et al., 2021). A previous study reported that a group, who implicitly learned congruently sound-symbolic relationships between pseudowords and meaningless figures, performed matching pseudowords with meaningless figures better than another group, who explicitly learned incongruently sound-symbolic relationships between pseudowords and meaningless figures (Nielsen and Rendall, 2012). The voicing of consonants in sound-symbolic words affects subjective evaluations of the words (Kambara and Umemura, 2021). Vowels influence perception of objects and faces (Sapir, 1929; Newman, 1933; Perfors, 2004) and brand names/brand personalities (Klink, 2000; Yorkston and Menon, 2004; Wu et al., 2013). Klink (2000) reported that participants evaluated brand names with front vowels (e.g., i) as more bitter, colder, faster, more feminine, friendlier, lighter (relative to darker), lighter (relative to heavier), milder, prettier, smaller, softer, thinner and weaker than those with back vowels (e.g., o). Phonemes in European languages can connect to specific emotional features (especially, affection and arousal) in behavioral (Adelman et al., 2018; Aryani and Jacobs, 2018; Aryani et al., 2018a; Myers-Schulz et al., 2013) and neural processing (Aryani et al., 2018b; Aryani et al., 2019). Although these previous studies have reported that vowels and consonants in sound-symbolic words contribute to subjective evaluations including physical and emotional features, there is still no evidence of such subjective evaluations of written vowels.
The purpose of this study was to investigate differences among subjective evaluations of Japanese vowels. Many researchers have examined Japanese sound symbolism in terms of word evaluation, word comprehension and word learning (e.g., Hamano, 1986; Hamano, 1998; Imai et al., 2008; Shinohara and Kawahara, 2010; Osaka, 2011; Imai and Kita, 2014; Asano et al., 2015; Hoshi et al., 2019; Kawahara, 2020; Motoki et al., 2020; Kambara and Umemura, 2021), while many other researchers have also examined sound symbolism in other languages, especially in European languages (e.g., Sapir, 1929; Newman, 1933; Klink, 2000; Perfors, 2004; Yorkston and Menon, 2004; Myers-Schultz et al., 2013; Wu et al., 2013; Adelman et al., 2018; Aryani and Jacobs, 2018; Aryani et al., 2018a; Ariyani et al., 2018b; Aryani et al., 2019). One of the reasons why sound symbolism researchers have focused on Japanese is the large number of sound-symbolic words in Japanese (Hamano, 1986; Hamano, 1998; Imai and Kita, 2014). One dictionary lists 4,500 sound-symbolic words in Japanese (Ono, 2007). In addition, the Japanese writing system includes five written vowels (a, i, u, e, and o; see Goetry et al., 2005). Thus, in this study, Japanese participants evaluated five written Japanese vowels using five-point semantic differential scales for 10 features: size, closeness, thickness, width, weight, height, depth, affection, excitement and familiarity. We made three predictions, based on previous findings (Sapir, 1929; Newman, 1933; Klink, 2000; Shinohara and Kawahara, 2010; Namba and Kambara, 2020). First, participants would evaluate that the vowel i is smaller than the vowel a. This prediction was based on previous findings that participants evaluated words with the vowel i as smaller than words with the vowel a in certain languages (Sapir, 1929; Newman, 1933; Klink, 2000; Shinohara and Kawahara, 2010). Second, the vowel i would be rated more preferable and more familiar than other vowels. This prediction was consistent with other studies in which words including the front vowels were evaluated more positively, for instance prettier, than those including back vowels (Klink, 2000), and the mouth shape used to produce the vowel i was preferable and more familiar than that used for other vowels (Namba and Kambara, 2020). Third, we also predicted that there would be other differences among physical (size, closeness, thickness, width, weight, height, and depth) or emotional evaluations (affection, excitement, and familiarity) of vowels, as well as correlations among them. Although this survey study was an exploratory approach for globally assessing the sound symbolism of different vowels in a language (Japanese), some studies have theoretically suggested differences among subjective evaluations of vowels in words (e.g., Hamano, 1986; Hamano, 1998). In addition, because psycholinguistic features of words (e.g., familiarity, imageability, affection, and excitement) correlate with each other (e.g., Kambara et al., 2020), those of vowels would also correlate with one another.
Methods
Participants
Six hundred and thirteen Japanese participants (482 female; Mage = 16.98; SDage = 6.28) participated in this survey study. The participants were people that attended a lecture on introductory psychology in department of psychology at Hiroshima University. This survey study was conducted practically to introduce one example of psychological methods in the lecture. There was a majority of female participants due to enrollment in the psychology degree. Informed consent was obtained from each participant before the survey. After the lecture on introductory psychology, all participants received an A4 paper to complete the survey task voluntarily. Before the survey task, an author (TK.) explained this survey study approved by the ethical committee of the Graduate School of Education at Hiroshima University (approval code: 2019554).
Materials and Procedures
Five written Japanese vowels were used in this study. The five written Japanese vowels were associated with a (ア), i (イ), u (ウ), e (エ), and o (オ) sounds. The written Japanese letters were presented with Japanese katakana characters. Katakana includes a wide range of applications for the Japanese writing system, compared to other Japanese characters such as hiragana and kanji (e.g., Goetry et al., 2005). For example, in Japanese, katakana would be applied for both loanwords and non-loanwords including sound-symbolic words, while hiragana and kanji would be generally applied to non-loanwords only. Therefore, we decided to use katakana, not hiragana and kanji. The 10 semantic differential scales were based on previous studies in theoretical linguistics and psycholinguistics (Osgood et al., 1957; Hamano, 1998; Klink, 2000; Kambara et al., 2020; Namba and Kambara, 2020; Kambara and Umemura, 2021). These scales were associated with size (1: small; 5: big), closeness (1: far; 5: close), thickness (1: thin; 5: thick), width (1: narrow; 5: wide), weight (1: light; 5: heavy), height (1: low; 5: high), depth (1: shallow; 5: deep), affection (1: dislike; 5: like), excitement (1: calm; 5: excited) and familiarity (1: unfamiliar; 5: familiar). Participants evaluated each vowel on each scale, on A4 paper (Figure 1). The font size and style were 10.5 and Yu Mincho, respectively. The order of stimuli presentation was a, i, u, e, and o. The instruction at the beginning of the questionnaire was “Please select and circle a number associated with the most appropriate sensation or feeling to each katakana letter (a, i, u, e, and o).”
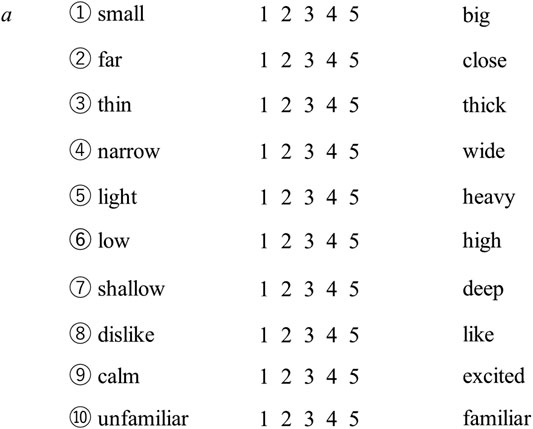
FIGURE 1. An example of 10 semantic differential features for a Japanese katakana letter (ア, a). In the questionnaire, all the items were shown in Japanese.
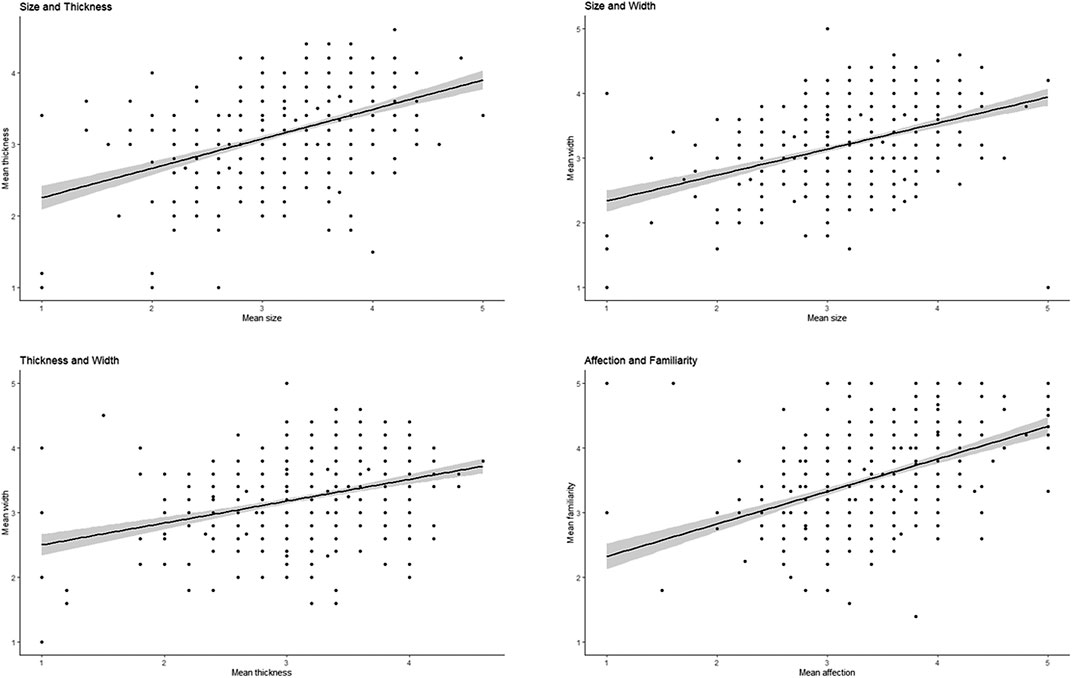
FIGURE 2. Scatter plots for correlations between mean scores of subjective evaluations (r > 0.30). An upper left figure shows a correlation between size and thickness. An upper right figure shows a correlation between size and width. A lower left figure shows a correlation between thickness and width. A lower right figure shows a correlation between affection and familiarity.
Analyses
Non-parametric one-way analysis of variance (ANOVA) tests (Friedman’s tests) were applied to each scale to assess the subjective evaluations of vowels. When the ANOVA test was significant, the post hoc analyses (Wilcoxon signed rank tests) were applied using a Benjamini-Hochberg correction (Benjamini and Hochberg, 1995). With the Benjamini-Hochberg (False Discovery rate: FDR) correction, the adjusted p-values (q-values) ranged from 0.005 (the statistical threshold of the first rank) to 0.05 (the statistical threshold of the tenth rank). Listwise deletions were applied for missing values in the ANOVA tests. These analyses were performed using the SPSS software on a desktop computer running Windows. In addition, we conducted Spearman rank correlation analyses among mean scores of the 10 subjective evaluations in order to examine the relationships among the subjective evaluations, using SPSS software on a Windows-based laptop. When the Benjamini-Hochberg correction (Benjamini and Hochberg, 1995) was also applied to Spearman rank correlation analyses, the adjusted p-values (q-values) ranged from 0.001 (the statistical threshold of the first rank) to 0.05 (the statistical threshold of the forty-fifth rank). Pairwise deletions were applied for missing values in the Spearman rank correlation analyses.
Results
Size (1: Small; 5: Big)
The Friedman’s test showed that there was a significant difference among the size ratings of the five Japanese written vowels (X2F(4) = 972.11, p < 0.001; Table 1). Medians (Inter Quartile Range: IQR) of a, i, u, e, and o were 4.00 (3.00–5.00), 2.00 (1.00–2.00), 3.00 (3.00–4.00), 3.00 (2.00–4.00), and 5.00 (4.00–5.00), respectively. The ratings of o were significantly higher than those for those of a (Z = −6.69, p <0.001), i (Z = −19.15, p <0.001), u (Z = −11.47, p <0.001), and e (Z = −13.92, p <0.001). The ratings of a were higher than those of i (Z = −18.78, p <0.001), u (Z = −5.29, p <0.001), and e (Z = −10.92, p <0.001). The ratings of u were higher than those of i (Z = −17.54, p <0.001) and e (Z = −6.28, p <0.001). Finally, the ratings of e were higher than those of i (Z = −15.27, p <0.001).
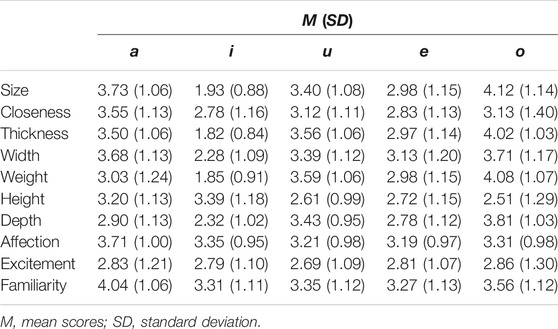
TABLE 1. Mean scores and standard deviations of subjective evaluations of five written Japanese vowels.
Closeness (1: Far; 5: Close)
There was a statistically significant difference among the closeness ratings of the five vowels (X2F(4) = 134.52, p <0.001; Table 1). Medians (IQR) of a, i, u, e and o were 4.00 (3.00–4.00), 3.00 (2.00–4.00), 3.00 (2.00–4.00), 3.00 (2.00–4.00) and 3.00 (2.00–4.00), respectively. The ratings of a were higher than those of i (Z = −10.29, p <0.001), u (Z = −6.91, p <0.001), e (Z = −9.71, p <0.001), and o (Z = −5.87, p <0.001). The ratings of u were higher than those of i (Z = −4.84, p <0.001) and e (Z = −4.27, p <0.001). The ratings of o were higher than those of i (Z = −4.18, p <0.001) and e (Z = −4.16, p <0.001). No significant difference was observed between u and o (Z = −0.26, p = 0.80) or between i and e (Z = −0.77, p = 0.45).
Thickness (1: Thin; 5: Thick)
There was a statistically significant difference among the thickness ratings of the five vowels (X2F(4) = 969.33, p <0.001). Medians (IQR) of a, i, u, e, and o were 4.00 (3.00–4.00), 2.00 (1.00–2.00), 4.00 (3.00–4.00), 3.00 (2.00–4.00), and 4.00 (3.00–5.00), respectively. The ratings of o were higher than those of a (Z = −8.99, p <0.001), i (Z = −19.39, p <0.001), u (Z = −8.04, p <0.001) and e (Z = −13.90, p <0.001). The ratings of u were higher than those of i (Z = −18.56, p <0.001) and e (Z = −8.98, p <0.001). In addition, the ratings of a were higher than those of i (Z = −18.50, p <0.001) and e (Z = −8.09, p <0.001). Finally, the ratings of e were higher than those of i (Z = −15.43, p <0.001). There was no significant difference between a and u (Z = −0.97, p = 0.33).
Width (1: Narrow; 5: Wide)
There was a statistically significant difference among the width ratings of the five vowels (X2F(4) = 441.41, p <0.001; Table 1). Medians (IQR) of a, i, u, e, and o were 4.00 (3.00–5.00), 2.00 (1.00–3.00), 3.00 (3.00–4.00), 3.00 (2.00–4.00), and 4.00 (3.00–5.00), respectively. The ratings of o were higher than those of i (Z = −15.06, p <0.001), u (Z = −4.95, p <0.001) and e (Z = −7.96, p <0.001). The ratings of a were also higher than those of i (Z = −15.44, p <0.001), u (Z = −4.09, p <0.001) and e (Z = −7.93, p <0.001). The ratings of u were higher than those of i (Z = −14.39, p <0.001) and e (Z = −4.03, p <0.001). In addition, the ratings of e were higher than those of i (Z = −11.43, p <0.001). There was no significant difference between the ratings of a and o (Z = −0.45, p = 0.65).
Weight (1: Light; 5: Heavy)
There was a statistically significant difference among the weight ratings of the five vowels (X2F(4) = 880.32, p <0.001; Table 1). Medians (IQR) of a, i, u, e, and o were 3.00 (2.00–4.00), 2.00 (1.00–2.00), 4.00 (3.00–4.00), 3.00 (2.00–4.00), and 4.00 (3.00–5.00), respectively. The rating of o was higher than those of a (Z = −13.36, p <0.001), i (Z = −19.03, p <0.001), u (Z = −8.43, p <0.001), and e (Z = −13.90, p <0.001). The ratings of u were higher than those of a (Z = −8.24, p <0.001), i (Z = −18.38, p <0.001), and e (Z = −8.71, p <0.001). In addition, the ratings of a were higher than those of i (Z = −14.77, p <0.001). Finally, the ratings of e were higher than those of i (Z = −15.23, p <0.001). There was no significant difference between a and e (Z = −0.64, p = 0.53).
Height (1: Low; 5: High)
There was a statistically significant difference among height ratings of five vowels (X2F(4) = 224.59, p < 0.001; Table 1). Medians (IQR) of a, i, u, e, and o were 3.00 (2.00–4.00), 4.00 (3.00–4.00), 3.00 (2.00–3.00), 3.00 (2.00–4.00), and 2.00 (1.00–3.00), respectively. The ratings of i were higher than those of the other vowels, including a (Z = −3.15, p <0.005), u (Z = −11.00, p <0.001), e (Z = −9.61, p <0.001) and o (Z = −10.42, p <0.001). The ratings of a were higher than those of u (Z = −9.36, p <0.001), e (Z = −6.87, p <0.001) and o (Z = −9.62, p <0.001). The ratings of e were higher than those of o (Z = −2.68, p = 0.007). The other comparisons (u vs. e, Z = −1.56, p = 0.12; u vs. o, Z = −1.59, p = 0.11) were not satisfied for the statistical threshold corrected with the Benjamini-Hochberg (FDR) method.
Depth (1: Shallow; 5: Deep)
There was a statistically significant difference among depth ratings of five vowels (X2F(4) = 546.92, p <0.001; Table 1). Medians (IQR) of a, i, u, e, and o were 3.00 (2.00–4.00), 2.00 (2.00–3.00), 3.00 (3.00–4.00), 3.00 (2.00–4.00), and 4.00 (3.00–5.00), respectively. The ratings of o were higher (deeper) than those of a (Z = −12.44, p <0.001), i (Z = −16.01, p <0.001), u (Z = −6.74, p <0.001), and e (Z = −13.37, p 0.001). The ratings of u were also higher than those of a (Z = −8.77, p <0.001), i (Z = −15.20, p <0.001), and e (Z = −10.04, p <0.001). The ratings of a were also higher than those of i (Z = −9.15, p <0.001). The ratings of e were also higher than those of i (Z = −7.21, p <0.001). In addition, a comparison between the ratings of a and e (Z = −1.87, p = 0.06) was not satisfied for the statistical threshold corrected with the Benjamini-Hochberg (FDR) method.
Affection (1: Dislike; 5: Like)
There was a statistically significant difference among affection ratings of five vowels (X2F(4) = 144.45, p < 0.001; Table 1). Medians (IQR) of a, i, u, e, and o were 4.00 (3.00–5.00), 3.00 (3.00–4.00), 3.00 (3.00–4.00), 3.00 (3.00–4.00), and 3.00 (3.00–4.00), respectively. The ratings of a were higher (more preferable) than those of the other vowels: i (Z = −6.63, p <0.001), u (Z = −8.82, p <0.001), e (Z = −8.79, p <0.001), and o (Z = −7.31, p <0.001). The ratings of i were higher than those of u (Z = −2.64, p = 0.008) and e (Z = −3.10, p <0.005). In addition, the ratings of o were also higher than those of e (Z = -2.16, p = 0.03). The other comparisons (i vs. o, Z = -0.50, p = 0.62; u vs. e, Z = −0.24, p = 0.81; u vs. o, Z = −1.77, p = 0.08) were not satisfied for the statistical threshold corrected with the Benjamini-Hochberg (FDR) method.
Excitement (1: Calm; 5: Excited)
There was not a statistically significant difference among the excitement ratings of the five vowels (X2F(4) = 5.58, p = 0.23; Table 1). Medians (IQR) of a, i, u, e, and o were 3.00 (2.00–4.00), 3.00 (2.00–4.00), 3.00 (2.00–3.00), 3.00 (2.00–4.00), and 3.00 (2.00–4.00), respectively.
Familiarity (1: Unfamiliar; 5: Familiar)
There was a statistically significance among familiarity ratings of five vowels (X2F(4) = 222.29, p <0.001; Table 1). Medians (IQR) of a, i, u, e, and o were 4.00 (3.00–5.00), 3.00 (3.00–4.00), 3.00 (3.00–4.00), 3.00 (2.00–4.00), and 4.00 (3.00–4.00), respectively. The ratings of a were higher (more familiar) than those of i (Z = −10.79, p <0.001), u (Z = −10.30, p <0.001), e (Z = −11.48, p <0.001) and o (Z = −7.82, p <0.001). In addition, the rating of o was also higher (more familiar) than those of i (Z = −4.04, p <0.001), u (Z = −3.69, p <0.001) and e (Z = −5.02, p <0.001). The other comparisons (i vs. u, Z = −0.82, p = 0.41; i vs. e, Z = −0.89, p = 0.37; u vs. e, Z = −1.71, p = 0.09) were not satisfied for the statistical threshold corrected with the Benjamini-Hochberg (FDR) method.
Correlations Among the Mean Scores of Subjective Evaluations
There were significant correlations among the mean scores of subjective evaluations of vowels. All significant correlations are shown in Table 2. The effect sizes (rs) of four significant positive correlations between subjective evaluations (size and thickness; size and width; thickness and width; affection and familiarity) ranged between 0.30 (medium effect size) and 0.50 (large effect size; Cohen, 1988). In addition, the effect sizes (rs) of all the other significant positive correlations between subjective evaluations (size and closeness; size and weight; size and depth; closeness and thickness; closeness and width; closeness and affection; closeness and familiarity; thickness and weight; thickness and depth; width and weight; width and depth; width and familiarity; weight and depth) ranged from 0.10 (small effect size) to 0.30 (medium effect size; Cohen, 1988), except for thickness and affection, while the effect sizes (rs) of the significant negative correlations between subjective evaluations (thickness and height; weight and height; weight and affection; affection and excitement; excitement and familiarity) also ranged from 0.10 (small effect size) to 0.30 (medium effect size; Cohen, 1988). Although the effect size (r) of the significant positive correlation between thickness and affection was lower than 0.10 (small effect size; Cohen, 1988), the positive correlation satisfied the statistical threshold of the Benjamini-Hochberg (FDR) correction.
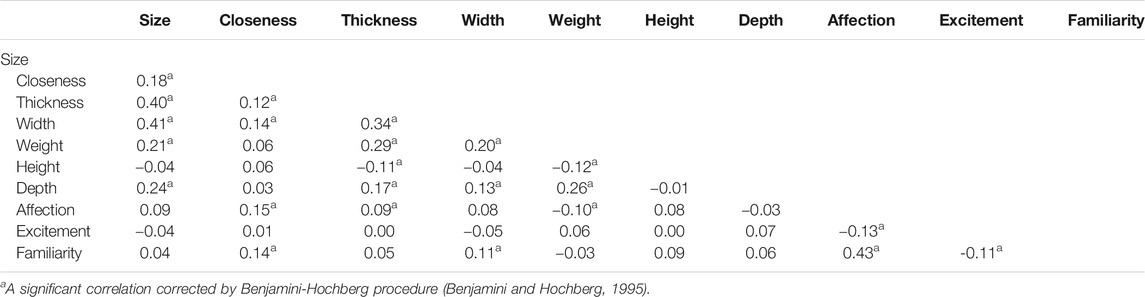
TABLE 2. Results of Spearman rank correlation analyses among mean scores of each subjective evaluation.
Discussion
The aim of the current study was to identify whether each written Japanese vowel was individually associated with specific subjective evaluations on 10 semantic differential scales (size, closeness, thickness, width, weight, height, depth, affection, excitement, and familiarity). Japanese native speakers rated the 10 features on five-point semantic differential scales for five presented written Japanese vowels (a, i, u, e, and o). The results showed that the size, closeness, thickness and width of a, u, and o were significantly higher than those of i and e, whereas the affection and familiarity of a was significantly higher than for the other vowels. In addition, we found correlations among the mean scores of subjective evaluations. These findings suggest that each written Japanese vowel could individually contribute to specific subjective evaluations. Furthermore, current findings contribute to developing a theory of orthographically non-arbitrary associations between new spoken or written letters and referents (e.g., Cuskley et al., 2017).
Subjective Evaluation of Physical Features
We found that the size, closeness, thickness and width of a, u, and o were significantly higher than those of i and e, as noted. In addition, there were significant correlations among the mean scores of the subjective evaluations. These findings were consistent with previous findings of sound symbolism. Based on previous studies of sound symbolism, vowels with high second formant (F2) are i and e, while vowels with low F2 are a, u, and o (Ohala, 1994; Berlin, 2006; Nishi et al., 2008). Vowels with high F2 are called front vowels (i and e), whereas low-F2 vowels are called back vowels (a, u, and o; see Berlin, 2006). Previous studies have reported that words including front vowels were ‘smaller’ than words including back vowels in certain languages (Sapir, 1929; Newman, 1933; Ohala, 1994; Klink, 2000; Berlin, 2006; Shinohara and Kawahara, 2010) and that size evaluations of vowels in words are associated with the size of the oral cavity or mouth shape when pronouncing them (Sapir, 1929; Ohala, 1984; Ohala, 1994; Shinohara and Kawahara, 2010; Namba and Kambara, 2020). Ohala (1994) called such associations between high acoustic frequency and smallness, and associations between low acoustic frequency and largeness, the “frequency code.” The current study suggests that physical evaluations (size, closeness, thickness and width) of written individual vowels could also be associated with the size of the oral cavity or mouth shape used to produce the vowels.
Regarding the relationship between stimulus effects and subjective evaluations to written vowels, the results of this study would also be affected by the orthographical features of the stimuli. The verbal stimuli of this study were written in katakana vowels in Japanese (i.e., a: ア; i: イ; u: ウ; e: エ; and o: オ), which might be in particular more angular than other Japanese characters (e.g., in hiragana, which is one of the Japanese character scripts, a: あ; i: い; u: う; e: え; and o: お). For instance, regarding subjective evaluations of physical features, participants might feel that the orthographical shape of i (イ) is thinner than the others. In fact, they judged the thickness ratings of i as lower (thinner) than the others. A study supports orthographically non-arbitrary associations between verbal stimuli and referents. Cuskley et al., (2017) prepared written and spoken pseudowords with curved graphemes (e.g., dede) and written and spoken pseudowords with angular graphemes (e.g., zeze) as verbal stimuli, while they also prepared round figures and spiky figures as figure stimuli (Cuskley et al., 2017). Participants judged how well a spoken or written pseudoword matches with a presented figure in their experiments (Cuskley et al., 2017). They found that both spoken and written pseudowords (e.g., dede) orthographically and non-arbitrarily associate (match) with meaningless figures (e.g., round shapes; see Cuskley et al., 2017). Grapheme-color synesthesia would also support orthographical associations between letters and referents (e.g., Rouw and Scholte, 2007; Asano and Yokosawa, 2013). Since the orthographical shapes of written stimuli might include additional effects that might partially blur sound symbolic associations, future studies also need to use spoken vowels, and examine orthographically non-arbitrary associations between spoken vowels and referents (subjective evaluations of physical and emotional features).
Our findings were also associate with the stimulus presentation order. In this paper-based survey study, the order of stimulus presentation was fixed. The presentation order of the vowels was a, i, u, e, and o, respectively. The fixed presentation order of stimuli might affect the results of this study. At least, effects of stimulus presentation order occur in spoken stimuli (Francis and Ciocca, 2003). Although randomizing the presentation of vowels does not guarantee an absence of such meta-strategies, it controls for the effects of the presentation order. If the order of presentation were randomized, order effects could be controlled for.
In addition, although previous findings have shown that both vowels or consonants in sound symbolic words and pseudowords associate with referential features (e.g., Klink, 2000; Cuskley et al., 2017; Kambara and Umemura, 2021), current findings focus on how an isolated written vowel associates with subjective evaluations of physical and emotional features. From here, vowels occurring in words or pseudowords could be further investigated. Also, since consonants in sound symbolic words and pseudowords have also been shown to associate with specific evaluations of physical and emotional features (e.g., Klink, 2000; Cuskley et al., 2017; Kambara and Umemura, 2021), interactions between vowels and consonants may occur in words and be further studied. Japanese might be a specific case here, since most katakana and hiragana characters associate a consonant and a vowel (Goetry et al., 2005). The comparison between katakana and hiragana could also be meaningful, and approached in future studies with the methods of this study.
Finally, as we mentioned in the Methods, all participants received an A4 paper to perform the survey task voluntarily after a lecture of introductory psychology. The participants might have directly compared between their subjective evaluations of vowels with this survey method. If so, their evaluations could reflect such meta-strategies of comparison. Thus, the explicit nature of judgments in this study might have affected the findings (e.g., Nielsen and Rendall, 2012). On the other hand, the participants might feel mental or physical fatigues before the survey study. Additionally, their mental or physical fatigues might affect subjective evaluations of vowels. In addition, since the majority of participants were female, the sample composition might have affected the findings of the current study.
Subjective Evaluation of Emotional Features
Affection and familiarity for the vowel a were higher than those of the other vowels (i, u, e, and o). In addition, the mean scores of affection positively correlated with those of familiarity. These results are associated with the order of vowels in the Japanese writing system, where a comes first of all vowels and all letters (Goetry et al., 2005), although a is also the first letter (vowel) in the Latin alphabet. Stockman et al. (1981) found that listeners could detect low front vowels including (e.g., /a/), back consonants (e.g., /h/), and schwa /ə/, which were about 70 percent of all the transcribed data on early baby vocalization from 7 to 21 months old, although vowels which infants produce in babbling would change in each period of infant development (Smith and Oller, 1981). Phonological segments a and i in languages have high frequency in a repository of cross-linguistically phonological inventory data (Moran and McCloy, 2019; see https://phoible.org/). The letter a might be cross-linguistically familiar and detectable for people. In addition, the mean scores of affection and familiarity correlated positively with those of closeness. Since the subjective evaluations of closeness are associated with other physical evaluations, the initial effect of the order of the vowels in the Japanese writing system might also be associated with the physical evaluation of vowel sounds. However, our findings were inconsistent with previous findings in which words with front vowels (e.g., i) were evaluated as associated with more positive emotions (e.g., prettier) than were those with back vowels (e.g., o; see Klink, 2000), and also in which the mouth shape used to pronounce a front vowel (e.g., i) was considered connected with being more positive, calm, and familiar about pronouncing a front vowel than that with a back vowel (e.g., o; Namba and Kambara, 2020). Although Ohala (1984) also claimed facial expressions sound-symbolically affect relationships between vowels and emotional features, the current findings did not support these previous studies. The first possible reason for this inconsistency between this and previous findings might be related to differences between languages. Indeed, some studies do not support universal sound symbolism (Maltzman et al., 1956; Brackbill and Little, 1957; Atzet and Gerard, 1965). The phonological information of words associates with word classes (e.g., nouns and verbs), but the phonological information is differently distributed in different languages (Monaghan et al., 2007). Thus, the current findings of written Japanese vowels might only show non-universal sound symbolic associations. The second possible reason for inconsistency between current and previous studies might be whether the presented stimuli were words (Klink, 2000), mouth shapes to pronounce vowels (Namba and Kambara, 2020), or vowels alone in this study. For example, in cases where the presented stimuli are full words, they would include both consonants and vowels, and the consonants in the words would involve their own sound-symbolic effects (e.g., Klink, 2000; Kambara and Umemura, 2021), which might in turn affect subjective evaluations of vowels in the words.
Conclusion
We examined whether each written Japanese vowel was associated with specific subjective features by using 10 semantic differential scales, respectively assessing subjective size, closeness, thickness, width, weight, height, depth, affection, excitement and familiarity. Japanese native speakers rated each written Japanese vowel (a, i, u, e, and o) on each five-point semantic differential scale. We found that the size, closeness, thickness and width of a, u, and o were significantly higher than those of i and e, whereas the affection and familiarity of a were higher than those of the other vowels (i, u, e, and o). We also found correlations among the mean scores of subjective evaluations. Taken together, these findings suggest that each written Japanese vowel individually contributes to specific subjective evaluations.
Data Availability Statement
The datasets presented in this article are not readily available because the data include personal information. Requests to access the datasets should be directed to Toshimune Kambara, tkambara@hiroshima-u.ac.jp.
Ethics Statement
The studies involving human participants were reviewed and approved by the Ethical Committee of the Graduate School of Education at Hiroshima University. Written informed consent from the participants’ legal guardian/next of kin was not required in accordance with the national legislation and the institutional requirements.
Author Contributions
Conceptualization, TK; methodology, MA, XL, YY, YY, SN, and TK; software, MA and TK; validation, MA; formal analyses, MA and TK; investigation, SN, KA and TK; resources, TK; data curation, MA, XL, YY, and YY; writing—original draft preparation, MA. and TK.; writing—review and editing, SN, KA, and TK; visualization, MA and TK; supervision, TK; project administration, TK; funding acquisition, TK All authors have read and agreed to the published version of the manuscript.
Funding
The corresponding author (TK) was supported by Hiroshima University Grant-in-Aid for Scientific Research, KAKENHI Grant-in-Aid for Research Activity Start-up, KAKENHI Grant-in-Aid for Early-Career Scientists and KAKENHI Grant-in-Aid for Scientific Research (C). In addition, this research was conducted as part of the School of Education Joint Research Project 2020 at Hiroshima University, and received research support from the School of Education.
Conflict of Interest
The authors declare that the research was conducted in the absence of any commercial or financial relationships that could be construed as a potential conflict of interest.
Acknowledgments
We would like to thank editors and reviewers who provided important suggestions to improve this article.
References
Adelman, J. S., Estes, Z., and Cossu, M. (2018). Emotional sound symbolism: languages rapidly signal valence via phonemes. Cognition 175, 122–130. doi:10.1016/j.cognition.2018.02.007
Aryani, A., Conrad, M., Schmidtke, D., and Jacobs, A. (2018a). Why “piss” is ruder than “pee”? The role of sound in affective meaning making. PLoS One 13 (6), e0198430. doi:10.1371/journal.pone.0198430
Aryani, A., Hsu, C.-T., and Jacobs, A. M. (2018b). The sound of words evokes affective brain responses. Brain Sci. 8 (6), 94. doi:10.3390/brainsci8060094
Aryani, A., Hsu, C. T., and Jacobs, A. M. (2019). Affective iconic words benefit from additional sound-meaning integration in the left amygdala. Hum. Brain Mapp. 40 (18), 5289–5300. doi:10.1002/hbm.24772
Aryani, A., Isbilen, E. S., and Christiansen, M. H. (2020). Affective arousal links sound to meaning. Psychol. Sci. 31 (8), 978–986. doi:10.1177/0956797620927967
Aryani, A., and Jacobs, A. M. (2018). Affective congruence between sound and meaning of words facilitates semantic decision. Behav. Sci. 8 (6), 56. doi:10.3390/bs8060056
Asano, M., Imai, M., Kita, S., Kitajo, K., Okada, H., and Thierry, G. (2015). Sound symbolism scaffolds language development in preverbal infants. Cortex 63, 196–205. doi:10.1016/j.cortex.2014.08.025
Asano, M., and Yokosawa, K. (2013). Grapheme learning and grapheme-color synesthesia: toward a comprehensive model of grapheme-color association. Front. Hum. Neurosci. 7, 757. doi:10.3389/fnhum.2013.00757
Atzet, J., and Gerard, H. B. (1965). A study of phonetic symbolism among native Navajo speakers. J. Personal. Soc. Psychol. 1 (5), 524–528. doi:10.1037/h0021882
Benjamini, Y., and Hochberg, Y. (1995). Controlling the false discovery rate: a practical and powerful approach to multiple testing. J. R. Stat. Soc. Ser. B (Methodological) 57 (1), 289–300. doi:10.1111/j.2517-6161.1995.tb02031.x
Berlin, B. (2006). The first congress of ethnozoological nomenclature. J. R. Anthropol. Inst. 12 (1), S23–S44. doi:10.1111/j.1467-9655.2006.00271.x
Brackbill, Y., and Little, K. B. (1957). Factors determining the guessing of meanings of foreign words. J. Abnorm. Psychol. 54 (3), 312–318. doi:10.1037/h0042411
Cohen, J. (1988). Statistical power analysis for the behavioral sciences. Hillsdale, NJ: Lawrence Erlbaum.
Cuskley, C., Simner, J., and Kirby, S. (2017). Phonological and orthographic influences in the bouba-kiki effect. Psychol. Res. 81 (1), 119–130. doi:10.1007/s00426-015-0709-2
De Carolis, L., Marsico, E., Arnaud, V., and Coupé, C. (2018). Assessing sound symbolism: investigating phonetic forms, visual shapes and letter fonts in an implicit bouba-kiki experimental paradigm. PLoS One 13 (12), e0208874. doi:10.1371/journal.pone.0208874
Francis, A. L., and Ciocca, V. (2003). Stimulus presentation order and the perception of lexical tones in cantonese. J. Acoust. Soc. Am. 114 (3), 1611–1621. doi:10.1121/1.1603231
Goetry, V., Urbain, S., Morais, J., and Kolinsky, R. (2005). Paths to phonemic awareness in Japanese: evidence from a training study. Appl. Psycholinguistics 26, 285–309. doi:10.1017/S0142716405050186
Hamano, S. (1986). The sound-symbolic system of japanese. Ph. D. Dissertation. Gainesville (FL): University of Florida.
Hoshi, H., Kwon, N., Akita, K., and Auracher, J. (2019). Semantic associations dominate over perceptual associations in vowel-size iconicity. Iperception 10, 2041669519861981. doi:10.1177/2041669519861981
Imai, M., Kita, S., Nagumo, M., and Okada, H. (2008). Sound symbolism facilitates early verb learning. Cognition 109, 54–65. doi:10.1016/j.cognition.2008.07.015
Imai, M., and Kita, S. (2014). The sound symbolism bootstrapping hypothesis for language acquisition and language evolution. Philos. Trans. R. Soc. Lond. B Biol. Sci. 369, 20130298. doi:10.1098/rstb.2013.0298
Kambara, T., Tsukiura, T., Shigemune, Y., Kanno, A., Nouchi, R., Yomogida, Y., et al. (2013). Learning-dependent changes of associations between unfamiliar words and perceptual features: a 15-day longitudinal study. Lang. Sci. 35, 80–86. doi:10.1016/j.langsci.2012.05.001
Kambara, T., and Umemura, T. (2021). The relationships between initial consonants in Japanese sound symbolic words and familiarity, multi-sensory imageability, emotional valence, and arousal. J. Psycholinguist Res. doi:10.1007/s10936-020-09749-w
Kambara, T., Umemura, T., Ackert, M., and Yang, Y. (2020). The relationship between psycholinguistic features of religious words and core dimensions of religiosity: a survey study with Japanese participants. Religions 11 (12), 673. doi:10.3390/rel11120673
Kantartzis, K., Imai, M., and Kita, S. (2011). Japanese sound-symbolism facilitates word learning in English-speaking children. Cognit. Sci. 35, 575–586. doi:10.1111/j.1551-6709.2010.01169.x
Kawahara, S. (2020). Sound symbolism and theoretical phonology. Lang. Ling. Compass 14, e12372. doi:10.1111/lnc3.12372
Klink, R. R. (2000). Creating brand names with meaning: the use of sound symbolism. Mark. Lett. 11 (1), 5–20. doi:10.1023/A:1008184423824
Liu, X., Horinouchi, H., Yang, Y., Yan, Y., Ando, M., Obinna, U. J., et al. (2021). Pictorial referents facilitate recognition and retrieval speeds of associations between novel words in a second language (L2) and referents. Front. Commun. doi:10.3389/fcomm.2021.605009
Maltzman, I., Morrisett, L. J., and Brooks, L. O. (1956). An investigation of phonetic symbolism. J. Abnormal Psychol. 53 (2), 249–251. doi:10.1037/h0048406
Monaghan, P., Christiansen, M. H., and Chater, N. (2007). The phonological-distributional coherence hypothesis: cross-linguistic evidence in language acquisition. Cogn. Psychol. 55 (4), 259–305. doi:10.1016/j.cogpsych.2006.12.001
S. Moran, and D. McCloy (Editors) (2019). Phoible 2.0. Jena, Germany: Max Planck Institute for the Science of Human History Available at: http://phoible.org (Accessed February 22, 2021).
Motoki, K., Saito, T., Park, J., Velasco, C., Spence, C., and Sugiura, M. (2020). Tasting names: systematic investigations of taste-speech sounds associations. Food Qual. Preference 80, 103801. doi:10.1016/j.foodqual.2019.103801
Myers-Schulz, B., Pujara, M., Wolf, R. C., and Koenigs, M. (2013). Inherent emotional quality of human speech sounds. Cogn. Emot. 27 (6), 1105–1113. doi:10.1080/02699931.2012.754739
Namba, S., and Kambara, T. (2020). Semantics based on the physical characteristics of facial expressions used to produce Japanese vowels. Behav. Sci. 10 (10), 157. doi:10.3390/bs10100157
Newman, S. S. (1933). Further experiments in phonetic symbolism. Am. J. Psychol. 45 (1), 53–75. doi:10.2307/1414186
Nielsen, A., and Rendall, D. (2012). The source and magnitude of sound-symbolic biases in processing artificial word material and their implications for language learning and transmission. Lang. Cognit. 4 (2), 115–125. doi:10.1515/langcog-2012-0007
Nishi, K., Strange, W., Akahane-Yamada, R., Kubo, R., and Trent-Brown, S. A. (2008). Acoustic and perceptual similarity of Japanese and American English vowels. J. Acoust. Soc. Am. 124, 576–588. doi:10.1121/1.2931949
Ohala, J. J. (1984). An ethological perspective on common cross-language utilization of F0 of voice. Phonetica 41, 1–16. doi:10.1159/000261706
Ohala, J. J. (1994). “The frequency code underlies the sound symbolic use of voice pitch,” in Sound symbolism. Editors L. Hinton, J. Nichols, and J. J. Ohala (Cambridge, United Kingdom: Cambridge University Press), 325–347.
M. Ono (Editors) (2007). Nihongo onomatope jiten (Japanese onomatopoeia dictionary). Tokyo, Japan: Shogakukan.
Osaka, N. (2011). Ideomotor response and the neural representation of implied crying in the human brain: an fMRI study using onomatopoeia. Japanese Psychol. Res. 53 (4), 372–378. doi:10.1111/j.1468-5884.2011.00489.x
Osgood, C. E., Suci, G., and Tannenbaum, P. (1957). The measurement of meaning. Urbana, IL: University of Illinois Press.
Perfors, A. (2004). “What’s in a name?: the effect of sound symbolism on perception of facial attractiveness,” in Proceedings of the twenty-sixth annual conference of the cognitive science society. Editors K. Forbus, D Gentner, and T Regier, Chicago, IL, August 4–7, 2004 (Chicago, IL: Cognitive Science Society), 1617.
Ramachandran, V. S., and Hubbard, E. M. (2001). Synaesthesia: a window into perception, thought, and language. J. Conscious. Stud. 8 (12), 3–34.
Rouw, R., and Scholte, H. S. (2007). Increased structural connectivity in grapheme-color synesthesia. Nat. Neurosci. 10, 792–797. doi:10.1038/nn1906
Shinohara, K., and Kawahara, S. (2010). “A cross-linguistic study of sound symbolism,” in Proceedings of the 36th annual meeting of the berkeley linguistics society, Berkeley, CA, February 6–7, 2010. Berkeley, CA: University of California Press, 396–410.
Sidhu, D. M., and Pexman, P. M. (2019). The sound symbolism of names. Curr. Dir. Psychol. Sci. 28 (4), 398–402. doi:10.1177/0963721419850134
Sidhu, D. M., Pexman, P. M., and Saint-Aubin, J. (2019). Is un stylo sharper than une épée? Investigating the interaction of sound symbolism and grammatical gender in English and French speakers. PLoS One 14 (12), e0225623. doi:10.1371/journal.pone.0225623
Smith, B. L., and Oller, D. K. (1981). A comparative study of pre-meaningful vocalizations produced by normally developing and down’s syndrome infants. J. Speech Hear. Disord. 46 (1), 46–51. doi:10.1044/jshd.4601.46
Stockman, I. J., Woods, D. R., and Tishman, A. (1981). Listener agreement on phonetic segments in Early infant vocalizations. J. Psycholinguist Res. 10 (6), 593–617. doi:10.1007/BF01067296
Styles, S. J., and Gawne, L. (2017). When does Maluma/Takete fail? two key failures and a meta-analysis suggest that phonology and phonotactics matter. Iperception 8 (4), 2041669517724807. doi:10.1177/2041669517724807
Takashima, A., Bakker, I., van Hell, J. G., Janzen, G., and McQueen, J. M. (2014). Richness of information about novel words influences how episodic and semantic memory networks interact during lexicalization. NeuroImage 84, 265–278. doi:10.1016/j.neuroimage.2013.08.023
Takashima, A., Bakker, I., van Hell, J. G., Janzen, G., and McQueen, J. M. (2017). Interaction between episodic and semantic memory networks in the acquisition and consolidation of novel spoken words. Brain Lang. 167, 44–60. doi:10.1016/j.bandl.2016.05.009
Westbury, C. (2005). Implicit sound symbolism in lexical access: evidence from an interference task. Brain Lang. 93, 10–19. doi:10.1016/j.bandl.2004.07.006
Wu, L., Klink, R. R., and Guo, J. (2013). Creating gender brand personality with brand names: the effects of phonetic symbolism. J. Marketing Theory Pract. 21 (3), 319–330. doi:10.2753/MTP1069-6679210306
Yang, J., Asano, M., Kanazawa, S., Yamaguchi, M. K., and Imai, M. (2019). Sound symbolism processing is lateralized to the right temporal region in the prelinguistic infant brain. Sci. Rep. 9, 13435. doi:10.1038/s41598-019-49917-0
Keywords: semantic differential scales, vowels, sound symbolism, japanese, physical evaluation, emotional evaluation
Citation: Ando M, Liu X, Yan Y, Yang Y, Namba S, Abe K and Kambara T (2021) Sound-Symbolic Semantics of Written Japanese Vowels in a Paper-Based Survey Study. Front. Commun. 6:617532. doi: 10.3389/fcomm.2021.617532
Received: 15 October 2020; Accepted: 05 February 2021;
Published: 18 March 2021.
Edited by:
Oliver Niebuhr, University of Southern Denmark, DenmarkReviewed by:
Niklas Erben Johansson, Lund University, SwedenChristophe COUPE, The University of Hong Kong, Hong Kong
Copyright © 2021 Ando, Liu, Yan, Yang, Namba, Abe and Kambara. This is an open-access article distributed under the terms of the Creative Commons Attribution License (CC BY). The use, distribution or reproduction in other forums is permitted, provided the original author(s) and the copyright owner(s) are credited and that the original publication in this journal is cited, in accordance with accepted academic practice. No use, distribution or reproduction is permitted which does not comply with these terms.
*Correspondence: Toshimune Kambara, dGthbWJhcmFAaGlyb3NoaW1hLXUuYWMuanA=
†These authors have contributed equally to this work