 Nan Zhao
- Department of Translation, Interpreting and Intercultural Studies, Hong Kong Baptist University, Kowloon, Hong Kong SAR, China
Validation is the process of conducting a validity study on a test, gathering evidence to support inferences made based on test scores. Using many-facet Rasch analysis this paper validates the result of a consecutive interpreting test from four aspects: rating scale, raters, examinees and interpreting tasks. The study also identifies factors that affect the test results through bias analysis. The results of this analysis show that: (1) this analytical rating scale and task design can effectively reflect the examinees' interpreting competence, thus making it suitable for validating interpreting assessments; (2) one of the sub-scales: interpreting skills and manners, has a slightly negative effect on the overall validity of the assessment, making further revision on this sub-scale desirable.
Research background
Validity refers to the degree to which a set of tests corresponds to what is measured, that is, whether a set of tests measures what is measured (Messick, 1989; Latief, 2009), also known as “the accuracy of measurement” (Sullivan, 2011, p. 1). It indicates the dependability of the assessment mainly by examining the consistency of testing results (Carmines and Zeller, 1979; Latief, 2009; Sullivan, 2011). As a special type of language test, interpreting tests relatively lack data-based validation, either on rating scale or on the interpretation test results. This results in the fact that the test results do not necessarily reflect what is measured. After more than fifty years' development, many-facet Rasch model has its unique advantages in analyzing language use and proficiency tests (Linacre, 2010), and it is also a more direct way to assess the construct bias of rating scale (Wright and Masters, 1982). Its “many-facet” analysis is especially suitable for validating analytic rating scale.
The practice of interpreting testing and assessment
Interpreting testing and assessment (ITA) plays an essential role in screening qualified interpreters and assisting researchers to reflect on and improve the training of interpreters. Interpreting scholars continuously endeavor to develop, standardise, and streamline ITA procedures. However, it is unclear whether ITA and its major components (e.g., rating scales, test results) accurately reflect the interpreting competence of trainees. Yeh and Liu (2006) reviewed the main studies on interpretation assessment. Table 1 excerpts the operation methods and rating scales.
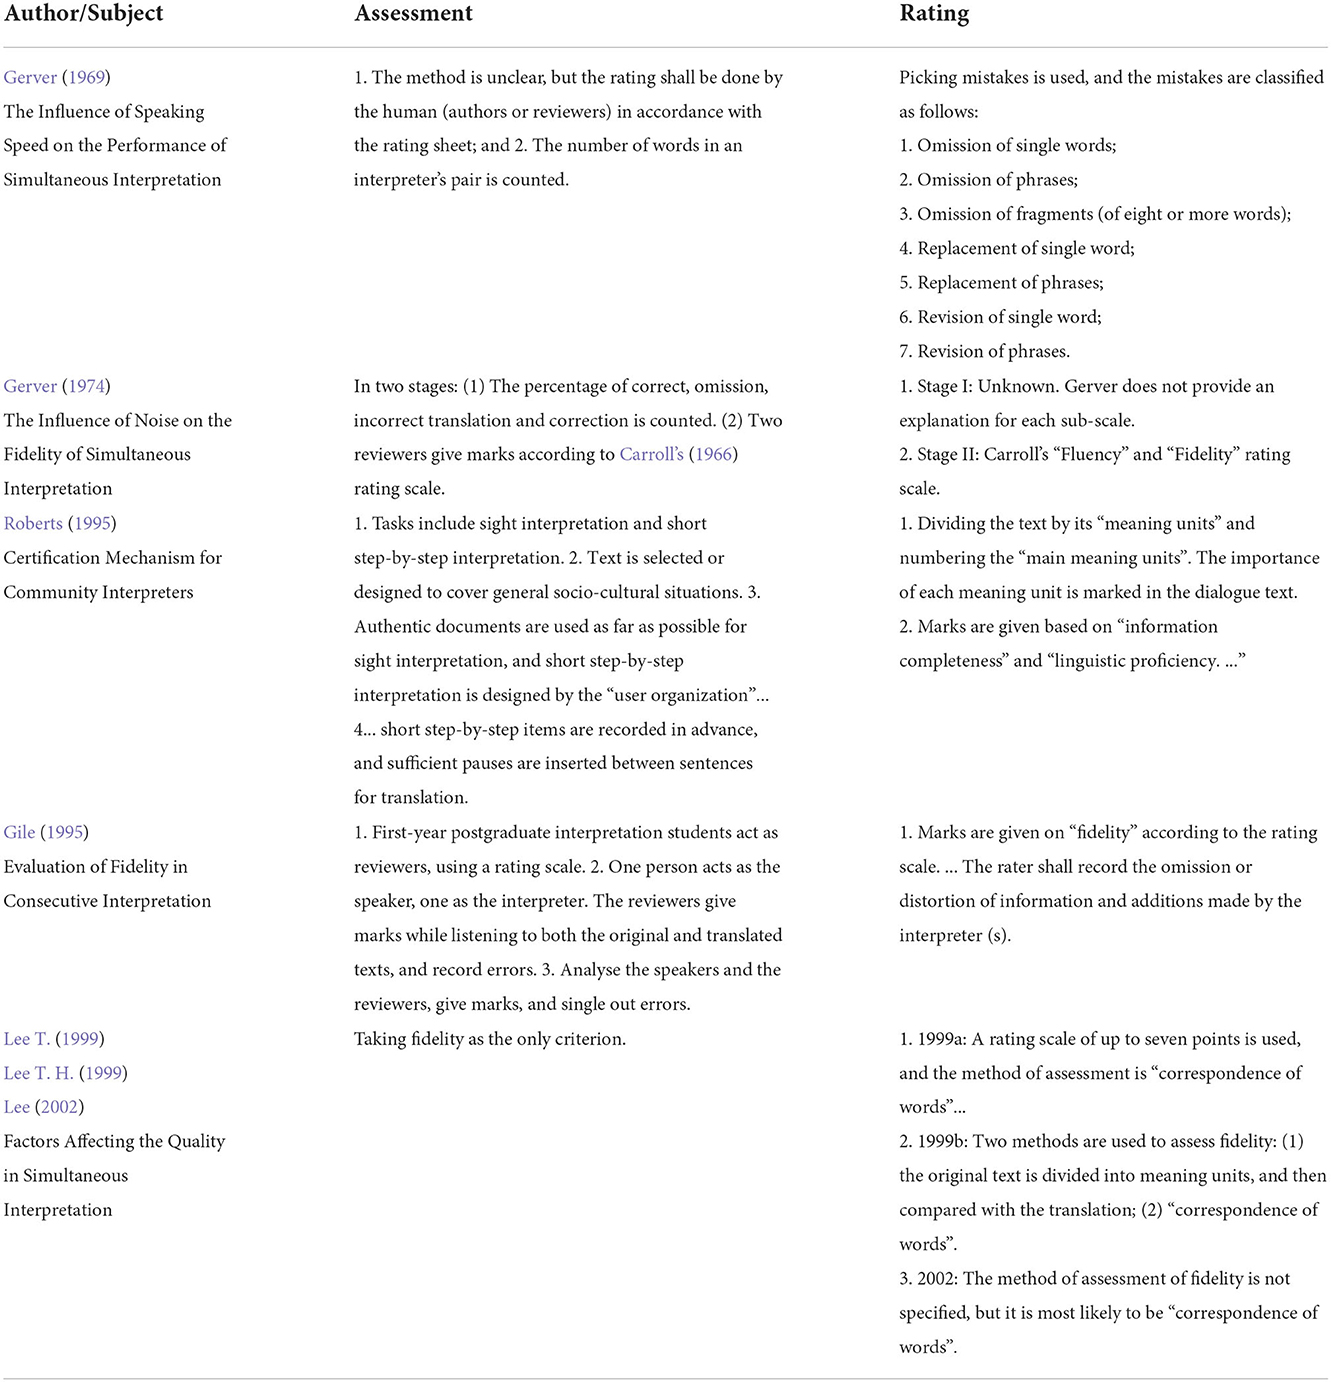
Table 1. Main studies on interpretation assessment before 2006 [excerpt from: Yeh and Liu (2006)].
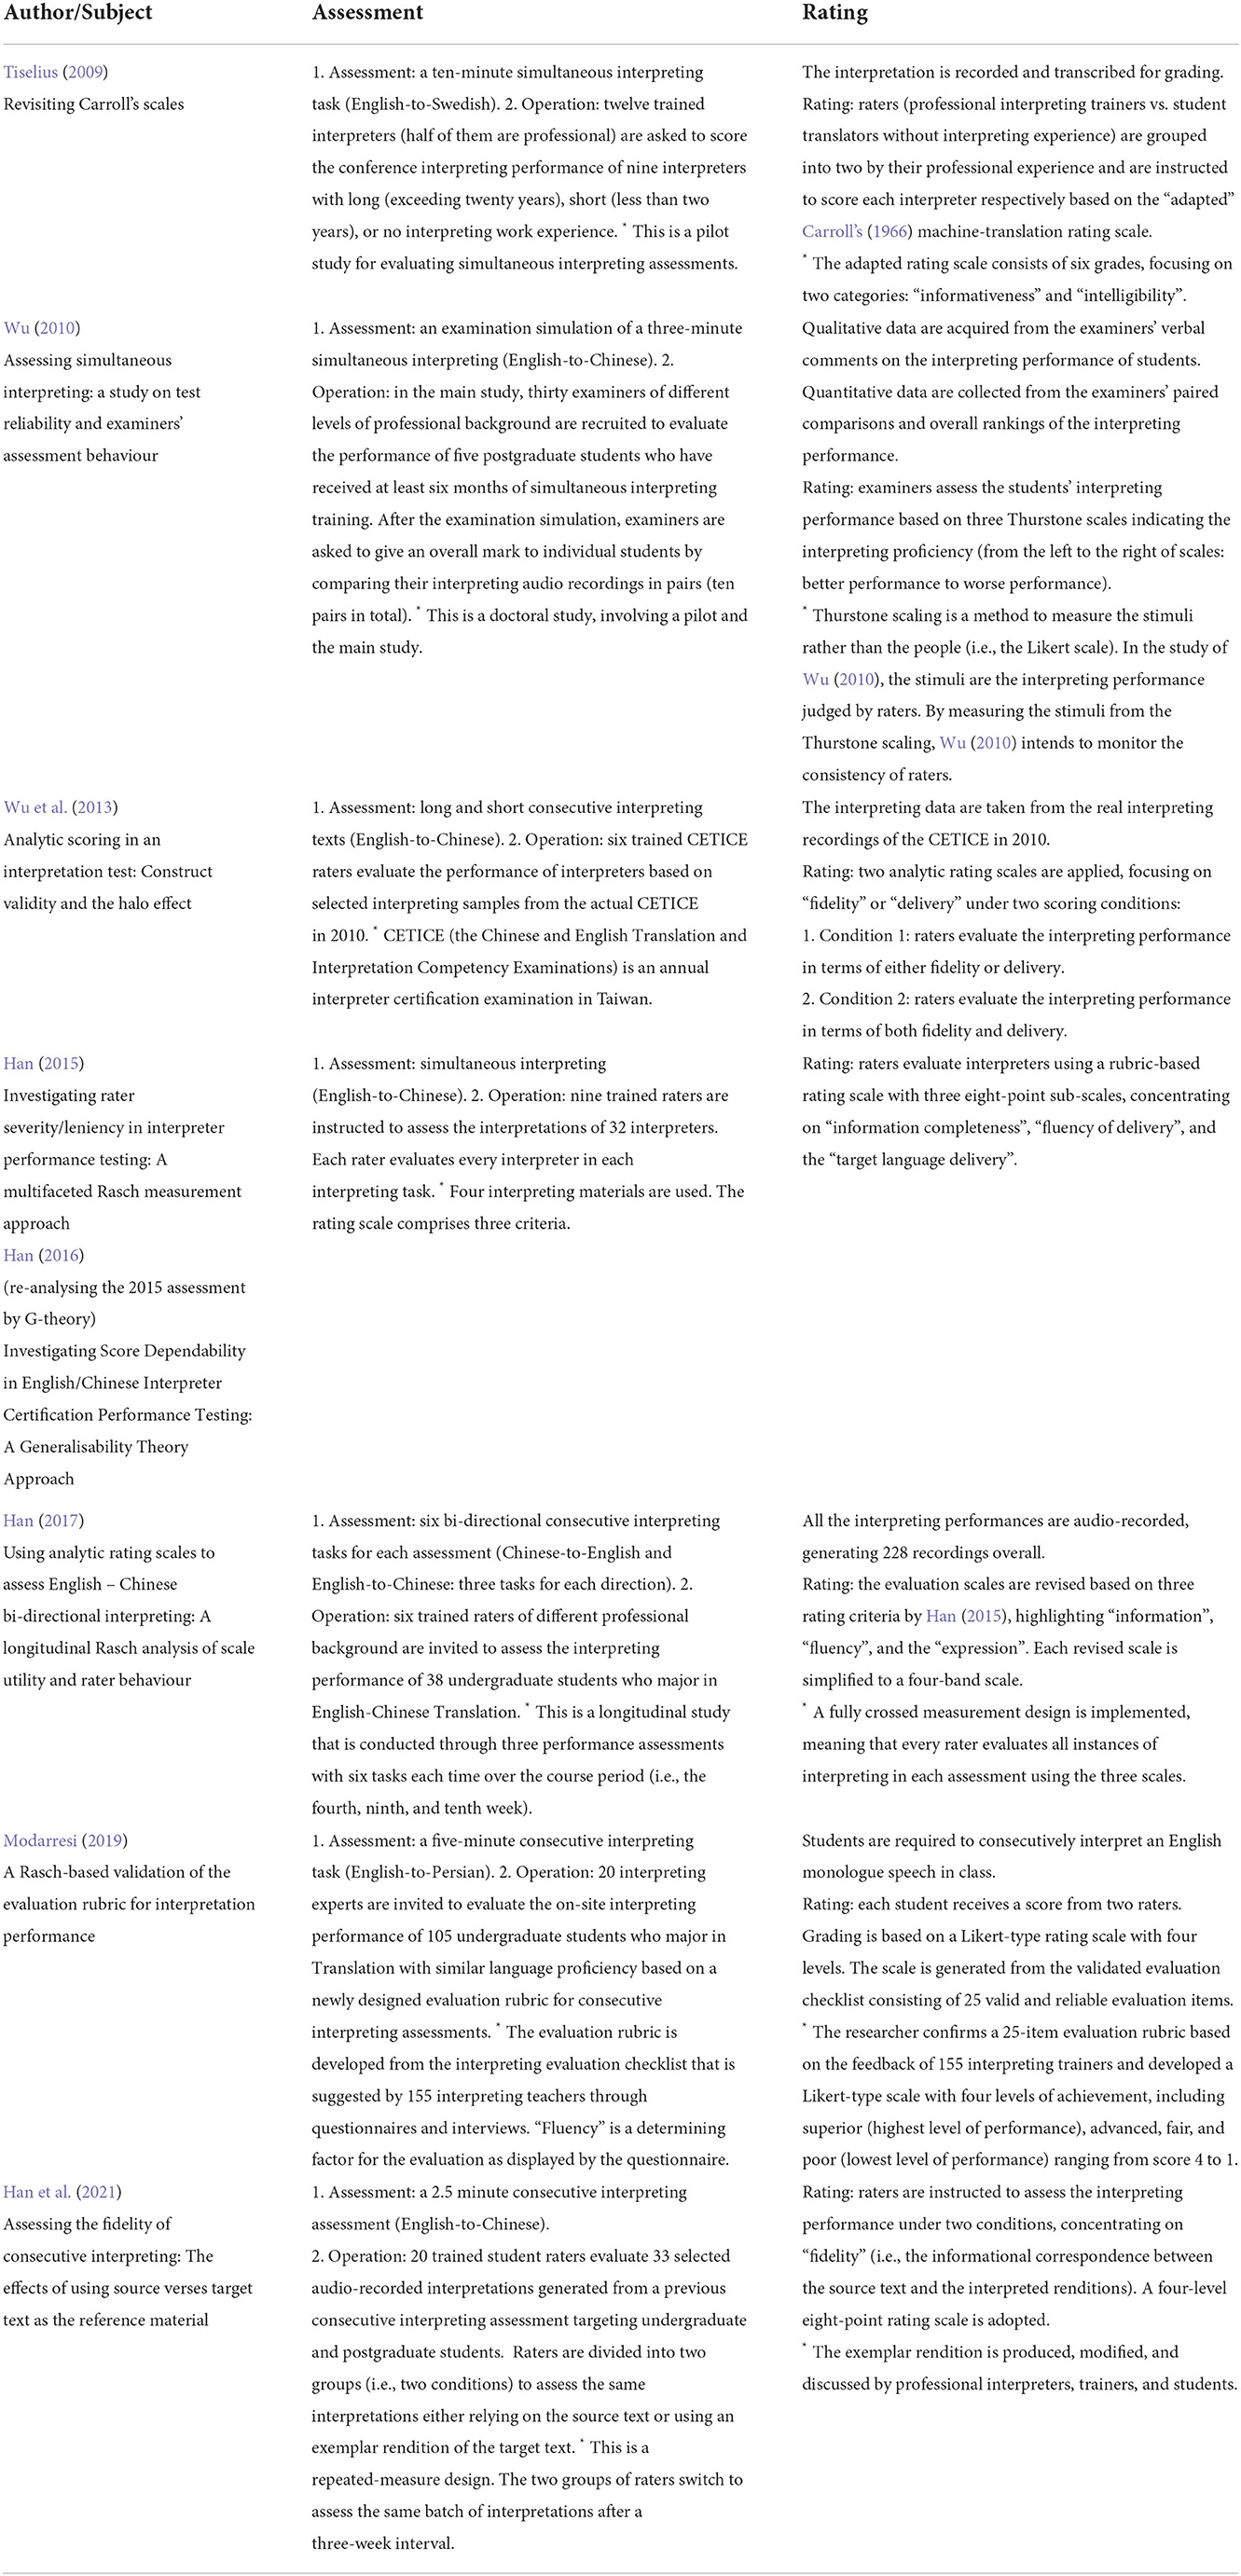
Table 2. Main studies on interpretation assessment (2006–2022).
In the past, rating scales for interpreting tests were often holistic, taking “faithfulness” or “information integrity” as the main criteria. User expectation surveys also reflect the importance of “accuracy” and “faithfulness” (see: Bühler, 1986; Kopczyński, 1994; Moser, 1996; Kurz, 2001). However, the description of a holistic rating scale often includes too many factors to be considered at the same time, and the weighting among the factors is often not clear. These make holistic ratings relatively subjective, and it is difficult to avoid rater effects. Analytic rating scale can compensate for this deficiency by weighing rating criteria according to their relative importance and by describing each rating criterion separately, so that the raters can better understand the scale. Up until 2006, very few studies have validated the rating scale, raters, examinees and the test results of interpreting assessment. As a type of language test, the design of interpreting tests does not fully meet the basic requirements and reasonable procedure of language testing. The author further reviews ITAs and their validation studies from 2006 to 2022.
In recent years, more ITAs using analytical rating scales have been validated by using various ‘psychometric approaches' such as the classical generalisability theory, and many-facet Rasch analysis (for comparison, see: Han, 2021, p. 106) to achieve valid test results. Tiselius (2009) employed Pearson product-moment correlation coefficient r to measure the inter-rater reliability by calculating the pair-wise correlation among raters as a pilot study of simultaneous interpreting. Wu (2010) used Cronbach's alpha to verify the scale reliability for a simulated examination of simultaneous interpreting. Han (2016) validated the score dependability for rater-mediated simultaneous interpreting based on generalisability theory (Brennan, 2001). Notably, the application of the many-facet Rasch measurement/model (MFRM) (Linacre, 1989) appears to be a relatively recent tendency in evaluating the validity of ITA. Validation using MFRM in interpreting studies has become more popular since the preliminary attempt by Clifford (2004), who investigated the construct validity of two interpreter certification tests using both quantitative and qualitative analytical methods based on psychometric principles. This study identified the ‘low' validity of the testing practices (lower than the acceptable level) and pointed out the limitations of existing validation methodologies, providing implications for future validation studies to collect diversified evidence for assessing the reliability of different components of ITA in a more comprehensive and systematic manner.
Based on the review, this study adopted MFRM, given its unique advantages and increasing applications in validating the ITA (Linacre, 2010; Han, 2021), to validate a consecutive interpreting test from four aspects: rating scale, raters, examinees and interpreting tasks.
The analytic rating scale of this study
Investigating the most widely used analytic rating scales including the ones by the Service Commun Interprétation-Conférences (SCIC) and over ten major translation and interpreting universities, including the Ecole de traduction et d'interprétation, Université de Genève, the author found “accuracy and completeness of the content” often serves as the primary factor in evaluating the interpreting performance, followed by “target language delivery”, and “interpreting skills and manners”.
The National Interpretation Competition (The National Interpreting Competition Committee, 2015) initiated by the Translators Association of China (TAC) adopts a rating scale in which each assessment factor is weighted according to the ratio of accuracy and completeness of the content (50%), target language delivery (30%) and interpreting skills and manners (20%). On this basis, an adapted analytic rating scale (see Table 3) is used in the current research. The assessment items such as “posture” and “stage presence” in the rating sub-scale of “interpreting skills and manners” are deleted as appropriate because raters grade interpreters by listening to their interpretation recordings rather than assessing onsite in this study. The weighting of this sub-scale has also been reduced to 10%, giving 60% weighting to “accuracy and completeness of the content”. This is because the analytical scale would mainly be used for training purposes. In addition, the “accuracy and completeness of the content” in the rating scale was mainly calculated according to the rate of correctness of critical sentences.
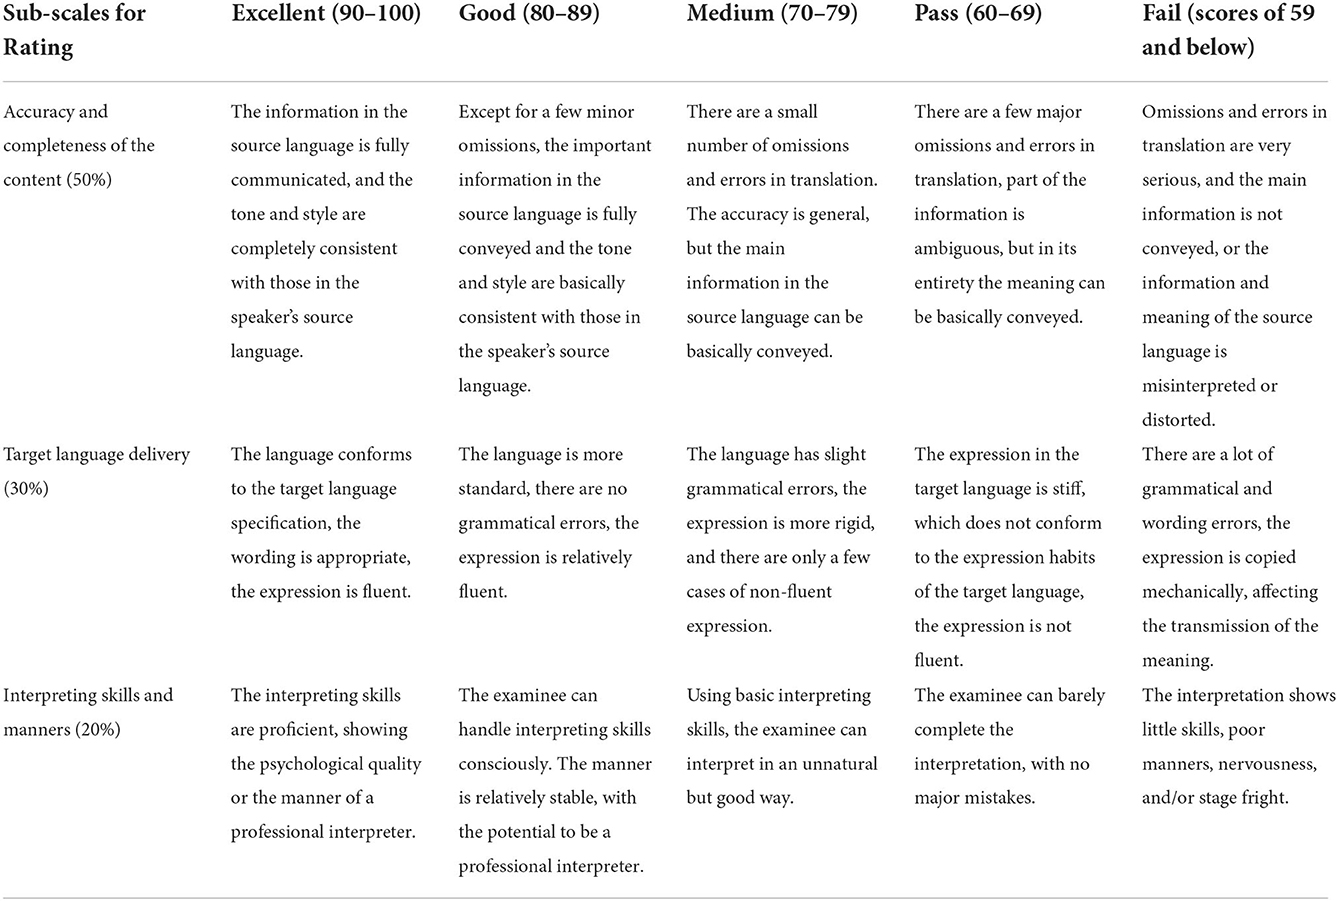
Table 3. Analytic rating scale for interpreting test (Adapted from the rating scale of the TAC national interpreting competition).
In this study, to assess consecutive interpreting competence, 68 interpreting stream examinees who have received more than half a year's interpreting training at a university are tested with an analytic rating scale that has been somewhat modified. After the raters have finished the first assessment, the second assessment and the final assessment, the author uses the MFRM to validate and analyse the bias of the four main aspects that affect the test results: rating scale, raters, examinees and tasks (English-Chinese interpreting, Chinese-English interpreting).
Research methods
Examinees
The examinees of this study are 68 third-year English majors who have received half a year's consecutive interpreting training in a university.
Experimental materials
To keep the testing conditions as authentic as possible, the consecutive interpreting tests were designed following these steps: selecting interpretation materials and generating test audios; allocating preparation materials to interpreters; assessing the difficulty level of interpretation materials; conducting the trial test and finally the formal test.
Selecting assessment materials and generating the test audio
To assess the interpreting competence, the design of interpreting tasks should have substantial content and progress logically, so that the test results can accurately reflect the interpreters' competence in different test periods. The test of consecutive interpreting competence in this study includes two tasks, English-Chinese interpreting and Chinese-English interpreting. The materials are selected from real conference recordings (8 minutes for each). The speakers have clear pronunciation and speak at a moderate speed with the fundamental frequency ranging between 500 and 4000 Hz. The content of the speech does not contain jargon and the information intensity is relatively balanced. The audio is segmented by meaning units, leaving enough time for the examinees to interpret. The speeches, prompts and instructions are generated by using TextAloud 4.0. Adobe Audition 23.0 is used to complete the editing and segmentation of speeches.
Allocating preparation materials to interpreters
To simulate the conference agenda and interpreting materials in real-life settings, the preparation materials that are administered to interpreters in this study include: (a) glossary (including new words, proper nouns, names of institutions and projects, etc.); (b) a conference agenda; (c) background information including conference topic and speakers. The validity of the test may be reduced if the preparation materials are given to students too early. Therefore, before the test all interpreters receive the preparation materials half an hour which is sufficient for them to finish preparing.
Assessing the difficulty level of interpretation materials
To ensure that the interpretation materials are suitable for this test and of moderate difficulty, the author develops and uses a 5-point Likert-type expert scale and an interpreter scale. Five experienced interpreting trainers from a university's advanced institute of translation filled in the expert scale. In the pilot test, 20 student interpreters randomly generated from the same cohort with the same amount of training as the examinees did completed the interpretation test and then filled in the interpreter scale. The results of the two scales show that the speech difficulty is moderate. According to the suggestions in the open-ended responses in the interpreter scale, the author further revises the pre-task preparation materials by providing two more key terminologies and the duration of the source speeches on the agenda.
Trial test
The language and interpretation proficiencies of the 20 examinees in the pilot test and the ones in the study are quite similar. Based on feedback in the pilot test, the author of this study adjusts the time intervals of speech segments and further revises the pre-task preparation materials.
Formal test
Two examiners attend the formal test and operate following “Test Instructions” step by step. The examinees use headphones to complete the interpretation task. The test time is 25 minutes for each task.
Rating
Rating of the test includes three steps: rater training, formal rating and grade transformation of the rating results.
Rater training and rating
The two main raters are both experienced interpreting trainers of a university with rich rating experience and have interpreted for more than 100 conferences. The raters and the author discuss specific sentences of the rating scale to confirm rating criteria. The two raters first grade the test recordings of five examinees, then compare and discuss the grade results to find out the reasons for big differences in individual scores and come to an appropriate rating standard. After the training, the raters formally grade the two-way interpretation of 68 examinees independently within a given period. The rating process includes preliminary evaluation, re-evaluation and final confirmation. In case of significant differences, the final scores are double-checked by a third rater who has the same qualifications as the first two raters.
Transformation of the rating results
After the formal rating, the author collects and organises the data. Prior to the verification by the MFRM analysis, the results derived from three rating sub-scales are classified into 10 grades by referring to the approach by Carroll (1966) to avoid insignificant subjective differences. Next, the grades are converted according to the data entry characteristics of the MFRM (see Table 4).
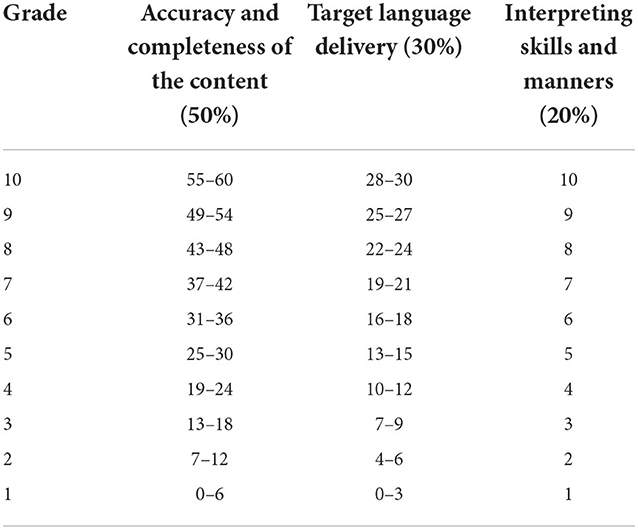
Table 4. Comparison of the grade transformation of the rating results.
Construction of the many-facet Rasch model and conceptual interpretation
In this study, the MFRM is used to test the validity and analyse the bias of the four main aspects that affect the validity of interpretation tests: rating scale, raters, examinees and tasks (English-Chinese interpreting and Chinese-English interpreting). The model measures each aspect on a common logit scale, calculates the estimation error of each measure, determines the degree of fit to the model and the possible interaction between each aspect. To test the validity of the analytic rating scale in response to the research questions, the author establishes an analysis model:
Where Pnijk denotes the probability that j, a rater, will give n, an examinee, a score of level k on the scale i, Pnijk−1 denotes the probability that j will give n a score of level k-1 on the scale i, Bn denotes the ability of n, Cj denotes the strictness of the rating by j, Di denotes the degree of difficulty of the sub-scale i, and Fk denotes the degree of difficulty of obtaining a score of level k on the scale i.
The MFRM results include the following concepts.
Measure
The numerical value of the examinees in each aspect on a common scale. Using the FACETS, a common programme to perform the MFRM analysis, to transform the measure of each individual in all aspects into a unified measure in logit units, which allows multiple variables or facets of a test to be analysed (Li and Kong, 2010). Based on the four dimensions, the strictness of raters, the competence (score) of examinees, the difficulty of the two interpreting tasks (E–C, C–E) and the utilisation of each dimension in the rating scale can be visually represented on the general level diagram.
Fit statistics
The degree of fit between actual observations and model predictions for individuals at each level. The fitted statistics are divided into the weighted mean square fitted statistics and the unweighted mean square fitted statistics. The latter is typically used as the basis for determining whether an individual might fit a model, as it is more susceptible to large individually discrepant data (Li and Kong, 2010). A fit between 0.5 and 1.5 is within the acceptable range (Weigle, 1998; Linacre, 2010), and a fit between 0.7 and 1.3 is highly correlated (Bonk and Ockey, 2003). Fit value = 1 indicates that the data is fully consistent with model prediction; fit value > 1 indicates that there is a random deviation in the data and model and is “not a fit”; while fit value <1 indicates that the difference between the data is smaller than what is predicted by the model and is “an overfit”. Fit statistics are usually judged in combination with Z value. Z > 2 is a significant non-fit, and Z <−2 is an overfit. In Rasch model analysis, fewer non-fits support a higher validity of the rating scale (Wright and Masters, 1982). The MFRM provides two fit indices (infit and outfit mean squares) for each element of every facet. Both fit indices manifest the degree of match between observed scores and “expected” scores as indicated by the Rasch model.
Separation and reliability
The degree of significant differences between individuals. For the competence of the examinees, the larger the value of separation coefficient and reliability, the stronger the discriminative power of the test is; for raters, the larger the value of separation coefficient and reliability, the greater the difference between raters and the lower the consistency of rating. The author uses Chi-square Statistics (χ2) to test whether the separation coefficient is significant. If p < 0.05, it indicates that there are statistically significant differences between individuals at that level.
Bias
The degree of deviation of the actual scores from the model predictions. The proportion of significant deviations to all sub-scales is within the acceptable range of about 5% (McNamara, 1996).
Results and discussion
The statistical software used in this study is Rasch model analysis software FACETS 3.67.1 (Linacre, 2010). Set forth below are 4 aspects of the statistical analysis results and discussions of this interpretation test.
General analysis
Figure 1 shows the general situations of the interpretation test with respect to the four levels of rating scales, raters, examinees and tasks.
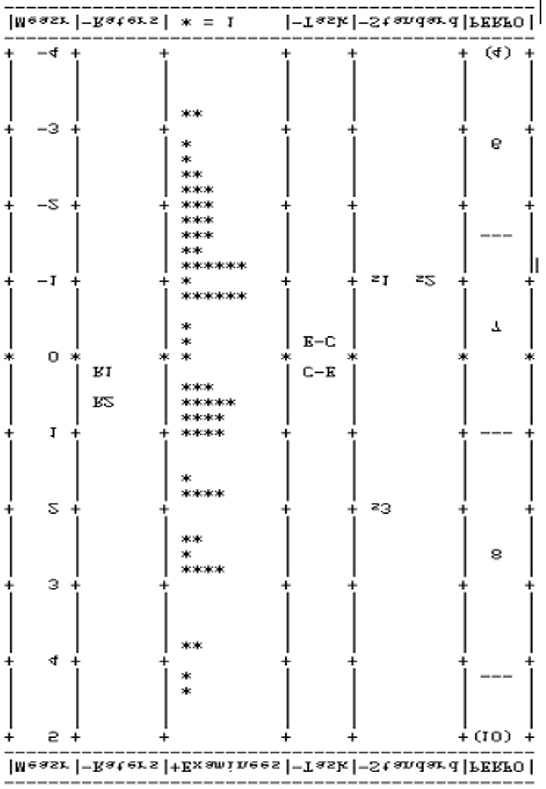
Figure 1. General distribution of testing results (Measure, logit scale; Raters, relative strictness of raters; *, two-direction interpretation competence of the examinees; Task, diculty of the task; Standard, sub-scales of the rating scale; PERFO, grades of each range on the rating scale).
The general level diagram consists of six columns, from left to right, including: (1) logit scale, (2) relative strictness of rater, (3) two-direction interpreting competence of examinees (each examinee is represented by a “*”), (4) difficulty of the task, (5) sub-scales of the rating scale and (6) grades of each segment on the rating scale. The statistical values of each level are represented by logit values (logits: the units of measurement). From the four levels of the rating scale, raters, examinees and tasks, Figure 1 illustrates: (i) Among the sub-scales of the rating scale, the result of the sub-scale “interpreting skills and manners” is 1.93 logits, indicating that the rater is more strict in evaluating this sub-scale and it is more difficult for examinees to get high scores in this sub-scale, while the rater strictness of the sub-scales “target language delivery” and “accuracy and completeness of the content” is consistent. (ii) The rater strictness is basically consistent, and the rating of rater No. 2 (0.51 logit) is slightly stricter than that of rater No. 1 (0.28 logit). But the difference between the two raters is only 0.23 logit and distributed between 0 and 1 logit, indicating that the raters' internal consistency is high. (iii) The distribution span of the competence of examinees is wide (7.6 logits), indicating that the 68 examinees have different competences, and this rating scale can effectively reflect and distinguish the examinees' interpreting competence. (iv) The difficulty of the task is basically consistent, but for the subjects, interpreting from Chinese to English (C-E) is slightly more difficult than interpreting from English to Chinese (E-C).
Multi-level analysis
Further detailed analysis is made in the following four levels: rating scale, rater, examinee and task.
Rating scale
The results of the rating scale level analysis show that the parting coefficient is 13.83 and the parting reliability is 0.99 [X2(2) = 601.9, p < 0.001].
The results show a significant difference between the difficulty values of the sub-scales of the analytic rating scale. The tests of fit showed that the Infit Mean Square values were 0.95, 1.00, and 1.02, respectively, which met the required range of fit. The logit value showed that raters were still strict on sub-scale 3 of the rating scale, and it was difficult for the examinees to get high scores on this sub-scale. Although the difference was not large, sub-scale 3 of the rating scale might still have an impact on the rating validity, which will be examined and analysed in detail in the part of bias analysis (Table 5).
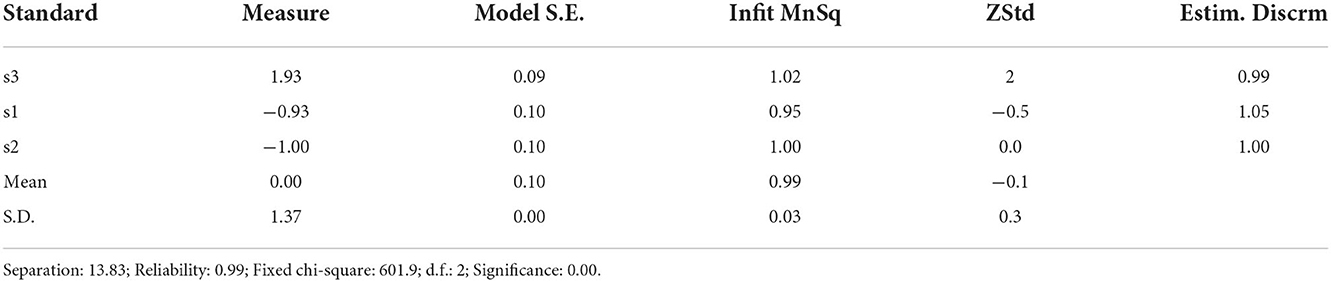
Table 5. Results of rating scale level analysis.
Raters
The results of rater level analysis show that the parting coefficient is 0.98, the parting reliability is 0.49 [X2(1) = 3.9, p = 0.05] (Table 6).
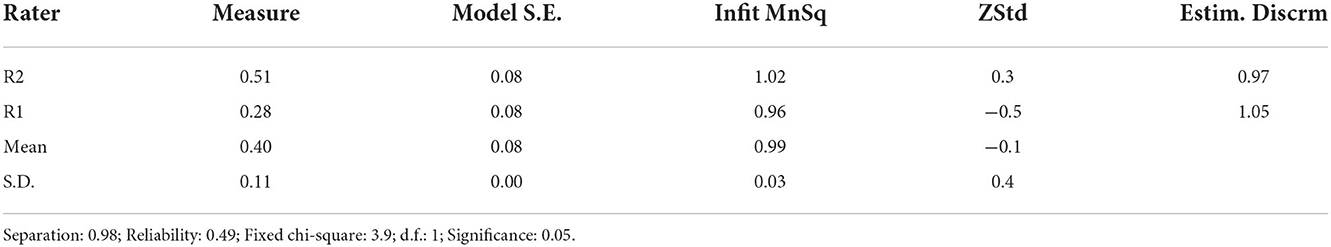
Table 6. Results of rater level analysis.
The tests of fit show that the Infit Mean Square values of the two raters are 0.96 and 1.02, respectively, and no non-fitting and overfitting phenomena occur. It shows that the inter-rater consistency and inter-rater stability were good, and the rating of the rater was credible.
Examinees
The results of examinee level analysis show that the parting coefficient is 3.90 and the parting reliability is 0.94 [X2(67) = 1110.8, p < 0.001) (Table 7).
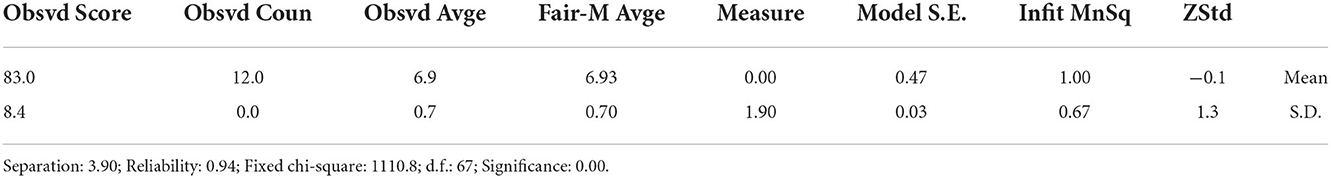
Table 7. Results of examinee level analysis.
The results showed that there were significant differences in the interpreting competence of the 68 examinees. As shown in row three of Figure 1, the examinee level is in a relatively neat normal distribution. This means that the interpreting test can distinguish the interpreting competence of the cohort. The tests of fit showed that among the 68 examinees, there were 3 cases with Z > 2 (significant non-fitting) and 3 cases with Z <−2 (significant over-fitting), but the average value of fit was 1.00, which was in full accordance with the model prediction.
Tasks
The results of task level analysis show that the logit values of the two tasks were −0.11 and 0.11 and the parting coefficient was 0.86, the parting reliability was 0.43 [X2(1) = 3.5, p > 0.05] (Table 8).
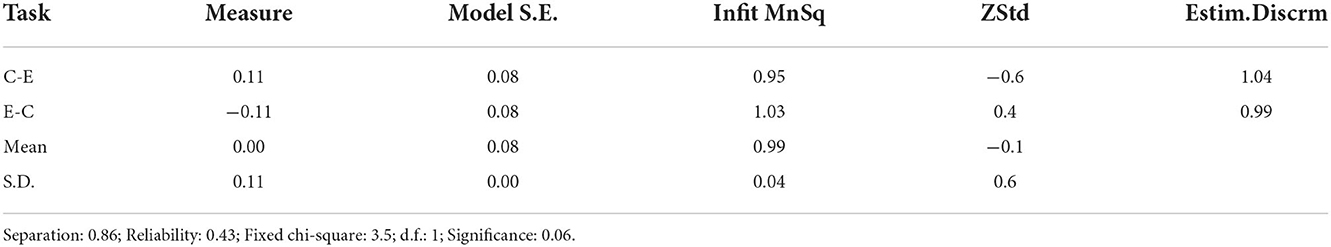
Table 8. Results of task level analysis.
The results show that, for the examinees, there was no significant difference in the difficulty of the two tasks. The logit value of C-E was 0.22 higher than that of E-C, which showed that for the examinees, the task of C-E was slightly more difficult than E-C. After interviewing the teachers of interpreting courses, the author found that the examinees practise E-C interpreting more than C-E interpreting. Therefore, the reason for the difference in task difficulty may be that the students' E-C interpreting competence is better than C-E interpreting competence, or it may be affected by the limitation of the examinees' ability of L2 production. The fitted values of the two tasks were 1.03 and 0.95, which were still highly fitted. The Z values were 0.4 and −0.6, respectively, which showed no non-fitting phenomenon.
Bias
Although t-test and ANOVA can indicate differences in rating strictness among raters, they cannot show the interactions among raters, examinees and the rating scale, while the MFRM can provide information of interactions and locate specific problems (Liu, 2005). In this study, the author conducted the bias analysis among rating scales, raters, examinees and tasks was analysed using the MFRM model to investigate the interactions among them and find out the specific factors that affect the validity of the test results.
Among a total of 816 interaction combinations generated by 68 examinees (interpreters), two raters, two interpreting tasks, and three rating criteria, only 17 contained significant biases, accounting for 2% of the total. Among them, there were three significant biases for the interaction between raters and examinees and two significant biases for the interaction between raters and the rating scale. It is generally considered that any combination with a significant bias within 5% is acceptable (McNamara, 1996). In the rating scale, the bias mainly existed in the third sub-scale (interpreting skills and manners) of the analytic rating scale. After interviewing the raters, the author found that there were still differences in the understanding of the third sub-scale among the raters who had been trained. In fact, no matter how rigorous the rater training was, there were always differences, but to different extents. Raters' professional background (e.g., rater training) is found to affect the rater consistency (Bonk and Ockey, 2003). The goal of rater training is to minimise the differences to an acceptable range and ensure the validity of the test. In view of this, the description of the third sub-scale (i.e., interpreting skills and manners) should be further defined and explained in future studies, so that raters can better understand and judge it.
Summary
The author analysed the validity and bias of four aspects of an interpreting assessment: rating scale, raters, examinees and tasks using the MFRM and found that the consecutive interpretation test was valid. First, the inter-rater consistency and inter-rater stability were good, and the rating of the rater was credible. Second, there were significant differences in the interpreting ability of the 68 examinees, meaning that the test can reflect and reasonably distinguish the examinees' interpreting competence. Third, there was no significant difference in the difficulty of the two tasks. The logit value of C-E was higher than that of E-C, meaning that for the examinees, the task of C-E was more difficult than E-C. Trainer interview showed that the examinees received more training on E-C than C-E interpreting. Therefore, future training could be more balanced by increasing the input of C-E interpreting skills and amount of practice. Further improvements can be made to improve the third sub-scale of rating. The logit value showed that raters were strict on sub-scale 3 “interpreting skills and manners” of the rating scale, and it was difficult for the examinees to get high scores on this sub-scale. This means this sub-scale still has problems that impact the validity of the test. Trainers may continue to improve this sub-scale by providing clearer definition (e.g., on “manner”) and more specific details for raters to distinguish the different levels of competence on “interpreting skills and manners”.
In previous validation studies, Messick (1995, 1996) divided validity (constructional validity) into 6 main aspects: content validity, authenticity validity, construct validity, summary validity, external validity and result validity. Based on previous studies, Weir (2005) divided validity into five classes: theory-based validity, contextual validity, rating validity (reliability), criterion-related validity and result validity. Thus, it can be seen that the validation of ITA has many aspects, which is an ongoing process that is related to the degree of validity. How to determine and control the main factors that affect the validity in interpreting test design to ensure that the test can reflect and distinguish the competence of examinees effectively? First, in terms of content, the interpreting assessment materials could be revised based on the real-life interpreting settings. Selected materials should match the learning progress of student interpreters and can accurately manifest their interpreting competence in different learning stages. Han (2022) systematically classified the leading ITA practices into three domains according to different practical purposes: education and training, accreditation and certification, and empirical research. Second, in terms of the rating scale and rating process, this study used the MFRM to verify the applicability and validity of the criteria in a consecutive interpreting test. In addition, rater training can help different raters unify their understanding of the rules of the rating scale, improve rater consistency and minimise rater effect, so as to improve the validity of the test results. Third, in terms of test results analysis, the MFRM effectively separates the various factors that affect the test validity, such as the four facets in this study: the rating scale, raters, examinees and interpreting tasks, as well as parameterises the degree of these facets to show the valid range of the test and discover the specific factors that affect the validity.
In summary, verifying the validity and reliability of the major facets of ITA ensures the utility/effectiveness of the interpreting test, regardless of its purposes or application domains. The MFRM allows researchers to collate multiple variables (i.e., aspects/facets) of the assessment in a common equal-interval metric (i.e., logit) for overall analysis. The MFRM calibrates all variables on the same scale so that researchers can compare different facets involved in an assessment directly. Facets can influence the performance of the stakeholders of ITA, such as test takers, examiners and raters (Bond and Fox, 2012). As per the ITA studies over the past two decades, as profiled in Table 2, the MFRM is commonly applied to estimate the rater reliability and other aspects either in the educational setting or within the credential context. Therefore, the MFRM may be considered for validating test results and rating scales in future interpretation tests. Results and findings identified in this paper may be conducive to improving the rating scale of the ITA and to improving the overall validity of the test and the quality of interpreting teaching.
Data availability statement
The raw data supporting the conclusions of this article will be made available by the authors, without undue reservation.
Ethics statement
Ethical approval was not provided for this study on human participants because student interpreters from Guangdong University of Foreign Studies signed an agreement in participating this research. All data is treated as anonymous and for research purpose only. The patients/participants provided their written informed consent to participate in this study.
Author contributions
The author confirms being the sole contributor of this work and has approved it for publication.
Conflict of interest
The author declares that the research was conducted in the absence of any commercial or financial relationships that could be construed as a potential conflict of interest.
Publisher's note
All claims expressed in this article are solely those of the authors and do not necessarily represent those of their affiliated organizations, or those of the publisher, the editors and the reviewers. Any product that may be evaluated in this article, or claim that may be made by its manufacturer, is not guaranteed or endorsed by the publisher.
Supplementary material
The Supplementary Material for this article can be found online at: https://www.frontiersin.org/articles/10.3389/fcomm.2022.1047389/full#supplementary-material
References
Bond, T. G., and Fox, C. M. (2012). Applying the Rasch Model: Fundamental Measurement in the Human Sciences. New York, NY: Routledge.
Bonk, W. J., and Ockey, G. J. (2003). A many-facet Rasch analysis of the second language group oral discussion task. Lang. Test. 20, 89–110. doi: 10.1191/0265532203lt245oa
Bühler, H. (1986). Linguistic (semantic) and extra-linguistic (pragmatic) criteria for the evaluation of conference interpretation and interpreters. Multilingua 5, 231–236.
Carmines, E. G., and Zeller, R. A. (1979). Reliability and Validity Assessment. Thousand Oaks, CA: SAGE Publications.
Carroll, J. (1966). An experiment in evaluating the quality of translations. Mech. Trans. Comput. Ling. 9, 55–66.
Clifford, A. (2004). A preliminary investigation into discursive models of interpreting as a means of enhancing construct validity in interpreter certification (Thesis). University of Ottawa, Ottawa, ON, Canada. doi: 10.20381/ruor-12761
Gerver, D. (1969). “The effects of source language presentation rate on the performance of simultaneous conference interpreters,” in Proceedings of the 2nd Louisville Conference on Rate and/or Frequency Controlled Speech. Louisville: University of Louisville, 162–184.
Gerver, D. (1974). The effects of noise on the performance of simultaneous interpreters: accuracy of performance. Acta Psychol. 38, 159–167. doi: 10.1016/0001-6918(74)90031-6
Gile, D. (1995). Fidelity assessment in consecutive interpretation: an experiment. Target 7, 151–164. doi: 10.1075/target.7.1.12gil
Han, C. (2015). Investigating rater severity/leniency in interpreter performance testing: a multifaceted Rasch measurement approach. Interpreting 17, 255–283. doi: 10.1075/intp.17.2.05han
Han, C. (2016). Investigating score dependability in english/chinese interpreter certification performance testing: a generalizability theory approach. Lang. Assess. Q. 13, 186–201. doi: 10.1080/15434303.2016.1211132
Han, C. (2017). Using analytic rating scales to assess English–Chinese bi-directional interpreting: a longitudinal Rasch analysis of scale utility and rater behaviour. Ling. Antverpiensia 16, 1. doi: 10.52034/lanstts.v16i0.429
Han, C. (2021). “Detecting and measuring rater effects in interpreting assessment: A methodological comparison of classical test theory, generalizability theory, and many-facet rasch measurement,” in Testing and Assessment of Interpreting, eds J. Chen and C. Han (Singapore: Springer), 85–113. doi: 10.1007/978-981-15-8554-8_5
Han, C. (2022). Interpreting testing and assessment: a state-of-the-art review. Lang. Test. 39, 30–55. doi: 10.1177/02655322211036100
Han, C., Xiao, R., and Su, W. (2021). Assessing the fidelity of consecutive interpreting: the effects of using source vs. target text as the reference material. Interpreting 23, 245–268. doi: 10.1075/intp.00058.han
Kopczyński, A. (1994). Quality in conference interpreting: some pragmatic problems. Trans. Stu. Interdis. 2, 189. doi: 10.1075/btl.2.24kop
Kurz, I. (2001). Conference interpreting: Quality in the ears of the user. Meta. 46, 394–409. doi: 10.7202/003364ar
Latief, M. A. (2009). Reliability in the research data on language learning (Thesis). State University of Malang, Malang, Indonesia and University of Pittsburgh, Pittsburgh, PA, United States. Available online at: https://sastra.um.ac.id/wp-content/uploads/2009/11/Reliability.pdf (accessed January 4, 2023).
Lee, T. (1999). Speech proportion and accuracy in simultaneous interpretation from english into korean. Meta J. Trad. 44, 260–267.
Lee, T. H. (1999). Simultaneous listening and speaking in english into korean simultaneous interpretation. Meta J. Trad. 44, 560–572. doi: 10.7202/003444ar
Lee, T. H. (2002). Ear voice span in english into korean simultaneous interpretation. Meta J. Trad. 47, 596–606. doi: 10.7202/008039ar
Li, Q., and Kong, W. (2010). Validation of TEM-4 writing; Analytic rating scale: Multi-facet rasch measurement. Comput. Assist. Foreign Lang. Educ. China. 1, 19–25.
Linacre, J. M. (1989). Many-faceted Rasch measurement-ProQuest. Available online at: https://www.proquest.com/openview/9947a2b1a43f10331c468abcca2ba3e6/1?pq-origsite=gscholar&cbl=18750&diss=y (accessed January 4, 2023).
Linacre, J. M. (2010). A User's Guide to FACETS. Rasch-Model Computer Programs. Program Manual. Available online at: https://docplayer.net/124022787-A-user-s-guide-to-facets-rasch-model-computer-programs-program-manual-by-john-m-linacre.html (accessed January 4, 2023).
Liu, J. (2005). A many-facet analysis of written discourse completion test. Modern Foreign Lang. 28, 157–169.
Masters, G. (1982). A Rasch model for partial credit scoring. Psychometrika 47, 149–174. doi: 10.1007/BF02296272
Messick, S. (1989). Meaning and values in test validation: The science and ethics of assessment. Educ. Res. 18, 5–11. doi: 10.3102/0013189X018002005
Messick, S. (1995). Validity of psychological assessment: validation of inferences from persons' responses and performances as scientific inquiry into score meaning. Am. Psychol. 50, 741–749. doi: 10.1037/0003-066X.50.9.741
Messick, S. (1996). Validity and washback in language testing. Lang. Test. 13, 241–256. doi: 10.1177/026553229601300302
Modarresi, G. (2019). A Rasch-based validation of the evaluation rubric for interpretation performance. Sendebar 30, 221–224. doi: 10.30827/sendebar.v30i0.8512
Moser, P. (1996). Expectations of users of conference interpretation: Interpreting 1, 145–178. doi: 10.1075/intp.1.2.01mos
Roberts, R. P. (1995). “An assessment tool for community interpreting,” in Proceedings of the 36th Annual Conference of the American Translators Association (Nashville, TN), 135–145.
Sullivan, G. M. (2011). A primer on the validity of assessment instruments. J. Grad. Med. Educ. 3, 119–120. doi: 10.4300/JGME-D-11-00075.1
The National Interpreting Competition Committee (2015). Rating Scale of The 2010 TAC National Interpreting Competition. Translators Association of China. Available online at: from http://www.tac-online.org.cn/index.php?m=contentandc=indexanda=showandcatid=631andid=1096 (accessed September 15, 2022).
Tiselius, E. (2009). Revisiting Carroll's scales. Test Assess. Transl. Int. Scales 22, 95–121. doi: 10.1075/ata.xiv.07tis
Weigle, S. C. (1998). Using FACETS to model rater training effects. Lang. Testing 15, 263–287. doi: 10.1177/026553229801500205
Weir, C. J. (2005). Language testing and validation: an evidence-based approach. Mod. Lang. J. 91, 316. doi: 10.1057/9780230514577
Wright, B., and Masters, G. (1982). Rating Scale Analysis. Measurement and Statistics. Available online at: https://research.acer.edu.au/measurement/2 (accessed January 4, 2023).
Wu, J., Liu, M., and Liao, C. (2013). Analytic Scoring in an Interpretation Test: Construct Validity and the Halo Effect. p. 277–292. Available online at: https://www.researchgate.net/publication/271770356_Analytic_scoring_in_an_interpretation_test_Construct_validity_and_the_halo_effect (accessed January 4, 2023).
Wu, S. -C. (2010). Assessing simultaneous interpreting?: A study on test reliability and examiners' assessment behaviour (Thesis). Newcastle University, Newcastle upon Tyne, United Kingdom. Available online at: http://theses.ncl.ac.uk/jspui/handle/10443/1122 (accessed January 4, 2023).
Keywords: many-facet Rasch analysis, validity, consecutive interpreting, analytic rating scale, interpreting assessment
Citation: Zhao N (2023) A validation study of a consecutive interpreting test using many-facet Rasch analysis. Front. Commun. 7:1047389. doi: 10.3389/fcomm.2022.1047389
Received: 18 September 2022; Accepted: 16 November 2022;
Published: 01 February 2023.
Edited by:
Binhua Wang, University of Leeds, United KingdomReviewed by:
Fang Tang, Guangdong University of Foreign Studies, ChinaXiaoman Wang, University of Leeds, United Kingdom
Copyright © 2023 Zhao. This is an open-access article distributed under the terms of the Creative Commons Attribution License (CC BY). The use, distribution or reproduction in other forums is permitted, provided the original author(s) and the copyright owner(s) are credited and that the original publication in this journal is cited, in accordance with accepted academic practice. No use, distribution or reproduction is permitted which does not comply with these terms.
*Correspondence: Nan Zhao, bmFuemhhb0Boa2J1LmVkdS5oaw==