 Eric A. Jensen
 Kalina Maria Borkiewicz
 Jill P. Naiman
- 1Advanced Visualization Lab, National Center for Supercomputing Applications, University of Illinois at Urbana-Champaign, Urbana, IL, United States
- 2School of Information Sciences, University of Illinois at Urbana-Champaign, Champaign, IL, United States
Presenting data in visually appealing formats has long been a useful science communication technique. Millions of people around the world have encountered scientific visualizations through documentary films on giant and small screens. Visual effects software from the film industry can increasingly be used to visualize scientific data. Such cinematic scientific visualization should be (a) based on real data, (b) understandable, and (c) entertaining for a public audience. To investigate what is known about how audiences respond to this type of science communication, this essay presents an overview of the literature on this topic, highlighting key findings, gaps, and directions for future research. The sprawling nature of the theoretical and empirical research literature on audience responses to cinematic scientific visualization makes it difficult to achieve comprehensive coverage of relevant studies and theoretical models. Recurring methodological limitations present further challenges to establishing a foundation of reliable knowledge on this topic. Nevertheless, prior research has identified several factors that affect how public audiences respond to cinematic scientific visualizations. Here, we discuss findings relating to intelligibility, film content, and immersion. These results offer a basis for hypotheses to be tested by future confirmatory studies of audience responses to cinematic scientific visualizations.
Introduction
Presenting data in visually appealing formats has long been a useful science communication technique. Its earliest vestiges can be seen in depictions of astronomical phenomena over 2000 years ago (e.g., Friendly, 2008). Using charts to present scientific data in a recognizably modern way gained ascendancy in the nineteenth century (e.g., Friendly, 2005). The advent of computing made it easier for scientists and science communicators to create more complex visualizations of three-dimensional, time-evolving data in the form of video, starting around the 1970's-80's (Johnson, 2004).
Scientific visualization is a subset of data visualization (Figure 1) which focuses on the creation of images from spatial data (e.g., galaxies, tornadoes, molecular structures) rather than relational data (e.g., bar charts, scatterplots, networks). While there has been some variation in terminology in the literature referring to similar phenomena, the term cinematic scientific visualization is used to describe an aesthetically oriented, cinematic-quality presentation of spatiotemporal datasets.
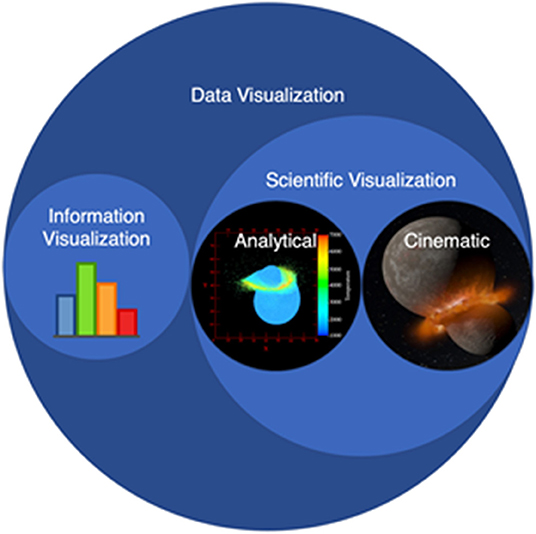
Figure 1. Locating cinematic scientific visualization within the wider domain of data visualization. Image Credit: Planetary collision simulation by Robin Canup, Southwest Research Institute; visualization by AVL, NCSA.
The use of artistic techniques from the world of film production with the aim of delivering effective science communication to public audiences sets this kind of scientific visualization apart.
Cinematic scientific visualizations turn complex scientific phenomena and concepts into stunning graphics and make them easier for the general public to comprehend (Shih et al., 2019, p. 1).
These public audiences encounter such cinematic scientific visualizations in leisure-oriented settings such as movies, television, science centers, and planetariums. The science films that feature such visualizations can reach millions of people worldwide, and often have lifespans of 10+ years. For example, the fulldome show “Black Holes: The Other Side of Infinity” was released in 2007 and is still playing in theaters in 14 languages. As of March 2021, “Solar Superstorms” (2015) was played on international television in 16 countries, played in 68 planetariums, has 4.6 million views on YouTube alone, and is additionally available for streaming on Amazon Prime and MagellanTV.
The topic of audience reception of cinematic scientific visualization therefore sits at a crossroads in the academic literature, with relevant research published in several distinct subject areas:
• Data visualization, with strong ties to computer science and data science
• Public engagement with science through entertainment media
• Informal science learning, including in science centers, planetariums and museums
• Science communication using visual methods
• Visual communication
In addition to these specific domains, key theories associated with the related academic disciplines tied to each of these domains have also been brought to bear to a limited extent to study this topic. Relevant theory from art and design, psychology, communication, media research, and other relevant fields can help to clarify likely audience impacts associated with cinematic scientific visualization.
Borkiewicz et al. (2019) argue that scientific visualization aimed at public audiences should take advantage major advancements in the quality of computer-enhanced graphics seen in movies, television, and video games:
The aim of cinematic visualization is to be not only educational and compelling but also aesthetically pleasing and entertaining in order to have broader appeal... (1) Experts can make use of these tools to better communicate with those not in their field, and (2) scientific visualization will look increasingly anachronistic if we cannot keep pace with advancements in the arts (Borkiewicz et al., 2019, p. 1, 11).
Cinematic scientific visualization is defined by (a) its use of authentic research data, (b) its aim of achieving intelligibility for a general public audience and (c) its entertainment value. In other words, cinematic scientific visualization should be (a) based on real data (b) understandable and (c) entertaining for a public audience. Given that (b) and (c) can only be accurately assessed from the audiences' perspective, the impact of this kind of visualization on public audiences is of overriding concern.
What is the Role of Cinematic Scientific Visualization in Public Science Communication?
The importance of visual aspects of science communication is self-evident. Yet, this is a relatively under-developed dimension of the empirical research literature, with much more focus on the content aspects of television, film and newspapers. This pattern of limited coverage is even more evident with a specific topic such as cinematic scientific visualization, despite its history and the large audiences it has been used to engage.
Relevant research must be drawn from a diverse set of cognate areas to piece together an understanding of the likely role of cinematic scientific visualization in public science communication. A meta-analytic study focusing on the summative evaluations conducted for 10 National Science Foundation-sponsored films focusing on students came to a set of positive conclusions about the educational value of giant screen films (Flagg, 2005). Flagg (2005, p. 66) points to evidence from these evaluations to conclude that education-oriented giant screen films increase science understanding while reducing stereotypes about scientists. These optimistic conclusions are drawn from the assessments of knowledge conducted by the summative evaluations analyzed: “measured by paper-and-pencil tests, using true/false, multiple choice, and short answer questions” (Flagg, 2005, p. 52). All the films assessed showed “increased student knowledge of the content assessed” (Flagg, 2005, p. 53). Beyond knowledge, Flagg (2005, p. 65) noted that “giant screen films can successfully push viewers to broaden their image of scientists beyond the stereotype of white-coated lab researchers” (Flagg, 2005, p. 56). Yet, on the question of science attitudes, there was insufficient evidence available: “Giant screen films may influence attitudes, but we have little information on the success of such efforts” (Flagg, 2005, p. 56).
A meta-analysis looking more broadly at adult informal science learning through media brought together research studies and evaluations assessing the outcomes of educational programs using television, radio, film/IMAX, and web (Rockman et al., 2007). This larger review was far less optimistic in its overall assessment:
The preponderance of studies have failed to find significant, consistent, and meaningful impacts of the treatments they have studied (Rockman et al., 2007, p. 22).
Yet, studies zooming into the specific dynamics of audience response to scientific visualizations that are more or less cinematic have identified measurable effects in audiences, as well as factors driving those effects.
Key Factors in Cinematic Scientific Visualization's Science Communication Role
Prior research has identified several factors that affect how public audiences respond to cinematic scientific visualizations. Here, we discuss findings relating to the narrative voice, content and framing, immersion, annotation, and intelligibility.
Narrative Voice, Content, and Framing
There is some evidence that the specific narrative focus of the content is critical to the audience outcomes.
Science media should focus more on science as a process than providing information on an interesting phenomenon or fact. Public understanding of science and science literacy may depend more on people learning that science is a complex activity, building on past learning and being willing to change based on new information (Rockman et al., 2007, p. 29).
Indeed, going beyond “fun facts” or phenomena to instead center the content on valuable “take away” points may be an important factor, in line with prior research on informal learning settings (e.g., Land et al., 2020).
Aside from the scientific content, Heimlich et al. (2010) found that the cultural content and framing in scientific documentary films can play an important role in affecting audience reception. The finding from this study that content can have differential effects for audiences coming from different cultural backgrounds, depending on the framing of the narrative, is also in line with prior research and theory in informal learning settings (Dawson and Jensen, 2011; Jensen et al., 2011).
Moreover, the way that the narrative voice is presented can also be important. A study (n = 514) asking for audience feedback on different practices in narrative visualization of scientific documentary films to investigate the use of “voice-of-god” narration and other storytelling techniques. This study found “participants preferred having a strong voice narrating the presentation of evidence regardless of topic or video presentation” (Bradbury and Guadagno, 2020, p. 348). More specifically, the “audible voice of god commentary…was found to be a significant variable outperforming the alternative video without voiceover narrative. Participants preferred the observational videos with voice-of-god narrative 66.84% (113/169) over the second observational video without voice-of-god narrative 33.14% (56/169)” (Bradbury and Guadagno, 2020, p. 348).
A qualitative follow-up question in this study by Borkiewicz et al. (2019, p. 348) inquired about the reasons for preferring a particular factual documentary film. This qualitative aspect of the research highlighted the importance of “narration” in general and the voiceover in particular. Another identified preference was for having the narration come from a participatory character in the documentary and the presentation of the data visualizations. Moreover, there was a clear preference for an “entertaining” style and “better production quality” (Bradbury and Guadagno, 2020, p. 348). Qualitative responses also pointed to audiences valuing learning from the films (Bradbury and Guadagno, 2020, p. 348). These findings have clear implications for cinematic scientific visualization.
Immersive Experience
Existing literature indicates that immersive shows and experiences can have a distinctive impact on audiences.
It appears that heightened levels of immersion allow learners to more easily understand scientific concepts (Fraser et al., 2012, p. 182).
The most well-established indicator of immersion's importance is the research on audience responses to scientific visualizations on different sizes of screen. An experimental study by Yu et al. (2016) tested the importance of screen size as a driver of science learning, in this case focusing on undergraduate students in an introductory astronomy course. This study employed a complicated design, with all of the groups (treatment and control) receiving a lecture designed to target common misconceptions about astronomy. Learning was evaluated using a multiple-choice test administered on a repeated basis. The evidence gathered by the study indicates that the treatment group that viewed the accompanying film offering a virtual tour of the Solar System in the Planetarium showed the greatest learning impact. The authors contend that this is because immersion is greater with larger, more expansive screens, the level of impact, there is also greater learning impact from the same film viewed on a larger screen.
We propose that visual immersion itself has benefits for learning by reducing cognitive load and increasing attention (Yu et al., 2016, p. 102).
However, the experimental design employed in this study did not control for the novelty effect of an outside-the-classroom field trip to a Planetarium, given that the control group remained within the classroom setting throughout. Nevertheless, Yu et al. (2016) note that their conclusion has support in the empirical research literature on how different screen sizes affect audiences (e.g., Lombard et al., 2000) as well as the research on giant screens and learning (e.g., Fraser et al., 2012). Indeed, Heimlich et al. (2010) came to the same conclusion based on a separate experimental study comparing different screen sizes used with the same film.
The emphasis on immersion's value for science communication and informal learning comes from a variety of angles. For example, research investigating audience responses to virtual reality has also highlighted the value of immersion within informal learning experiences (Yu et al., 2015, p. 43). Another study also went a step further than the typical cinematic immersion, exploring the effects of introducing interactivity into educational visualizations integrated into a game engine:
As our results showed that adding interactivity increased our participants' enjoyment of the visualization, and game engines are well-established for developing interactive applications, our finding suggests that there is value in developing interactive cinematic scientific visualizations in a game engine for educational purposes (Shih et al., 2019, p.2).
Such convergent findings in the literature suggest that the feeling of immersion could be an important factor in audience responses to cinematic scientific visualization.
Annotation
One of the key unanswered questions in this domain is regarding the impact of labeling or annotation of cinematic scientific visualizations on audiences. A priori, there are good theoretical reasons for thinking the annotations will be important drivers of learning, for example, drawing on concepts such as scaffolding from Vygotsky. Prior research is also generally supportive of the importance of priming or contextualizing scientific film content for audiences.
It would appear that presence can be enhanced by an audience's previous familiarity with a topic or by priming the audience prior to the film experience through stimuli such as sounds and images related to the topic (Fraser et al., 2012, p. 185).
While labeling is a default practice in conventional data visualization, its use in entertainment-based public oriented cinematic visualizations is more contested. This contestation focuses on the issue of whether the immersive experience of cinematic scientific visualizations- and the audience impact associated with that immersion- is undermined by labeling.
While no studies have directly examined this issue in the context of cinematic scientific visualization, there have been some relevant research published on audience responses to still images of space phenomena. Smith et al. (2015) conducted a study of labels in a museum exhibition of still deep-space images using an experimental design. This study investigated what kind of label information museum visitors were looking for when they encountered these images. This study reported the following categories of interests expressed by those viewing these deep-space images: “the most common question that people asked was: ‘What is it?’ or “What is it made of?” after that, the next most asked questions were about how the images were made (p. 290).
Smith et al. (2015) conclude that the comprehension of the underlying science for space images and appreciation of those images increases with the addition of informative labels. A similar finding is apparent from the much larger web-based study conducted by some of the same authors. Smith et al. (2017) further reinforce their argument that images should not be left to “speak for themselves,” but rather require explanations, including “information about colors used, size, scale, and location of the object” (p. 1) represented in the visualization. Smith et al. (2010) highlight the importance of annotations but complicate the picture by showing differences in outcomes depending on how expert or novice an audience member thinks they are.
Clearly, the use of annotations must be targeted to avoid distracting viewers with non-essential details. Moreover, prior research in other contexts suggests that there may be differential responses to annotations depending on the audience's level of prior knowledge about that topic. Those with greater knowledge of the topic were better able to take in the additional detail offered by annotations (Hurzlmeier et al., 2021). This raises the idea that annotations may come with tradeoffs between broad accessibility and precise understanding for non-technical audiences. Therefore, finding the right balance in the use of annotations is a key practical challenge for the professionals producing cinematic scientific visualizations.
Intelligibility
Whether audience members can make sense of a scientific visualization- cinematic or otherwise- is the ultimate de facto arbiter of success in this science communication game. The extent to which intelligibility is a primary or secondary factor in audience response remains unresolved in the literature. For example, Smith et al. (2017) argue that non-expert public audiences “work from an initial reaction to an image of “WOW!” to questions about the science” (p. 3). Rockman et al. (2007) on the other hand view the intelligibility of a scientific film is a primary factor, affecting the nature of the audience that a film can attract, as well as downstream outcomes such as impact: “Accessibility has an impact not only on types of viewers and listeners, but also on the total audience size and frequency of their viewing and listening” (p. 4).
There is no systematic research available on the relative priorities of the makers of scientific films destined for giant screens, but Rockman et al. (2007) infer that entertainment is being privileged over depth in general: “IMAX and similar types of giant screen films shows are more likely to go for excitement and delight, rather than in-depth, issue-oriented science concepts” (Rockman et al., 2007, p. 7).
Conclusion
There are multiple developments pointing toward the increasing potential for high quality, entertainment-industry standard scientific visualization. For example, in informal learning spaces such as museums, there is an ever-growing focus on developing immersive media experiences, extending beyond the giant screen shows that already heavily feature cinematic scientific visualizations. In the context of research, Borkiewicz et al. (2019, p. 11) have argued that science should “make use of visual effects tools [that] will allow for the creation of higher-fidelity visualizations that meet the high bar set by modern cinema.” Because the outer limits of practice in this domain are extending every year with the technology, cinematic scientific visualization is a perpetual frontier in science communication for public audiences.
Audiences are central to cinematic scientific visualization, as they are in science communication more generally (Jensen, 2011, 2014, 2020). This in turn makes the question of how producers of such visualizations can most effectively create audience impact equally central. Indeed, producers of cinematic scientific visualizations and scientific documentary films agree on the paramount role of the audience (e.g., Nucci, 2018). Yet to date, studies have provided only a limited picture of how public audiences perceive cinematic scientific visualization in different settings, with the most extensive literature available in the context of informal science learning and giant screen (dome) shows. This disconnect between the audience focus of professional practice and the under-developed research literature on audience responses to this means of science communication is yet another example of the multi-faceted research-practice divide in the various fields working on science communication topics (Jensen and Gerber, 2020).
The sprawling nature of the theoretical and empirical research literature on audience responses to cinematic scientific visualization makes it particularly difficult to achieve comprehensive coverage of relevant studies and theoretical models. While there is limited evidence available on the details of how audiences respond to cinematic scientific visualization, this essay has identified factors that are likely to be relevant to the question of audience impact. Key issues remain under-explored, such as the effects of specific storytelling techniques when overlaid on a cinematic scientific visualization and whether audience outcomes may differ for ethnically or culturally diverse audiences (Kennedy et al., 2018; Jensen et al., 2021).
At the same time, it is evident that major gaps remain in knowledge about this science communication pathway that has already reached many millions of people around the world via giant screen shows, streaming video services, Youtube, and other means. To advance evidence-based practice in this still-emerging frontier of public science communication, applied research is needed that will shed light on how specific choices and techniques affect audience responses and outcomes.
Author Contributions
EJ prepared the main body of the initial draft. KB and JN reviewed, edited, and supplemented with additional content, particularly in the introduction. All authors contributed to the article and approved the submitted version.
Funding
This research was funded by The Brinson Foundation as part of the Civic Science Fellows program.
Conflict of Interest
The authors are currently employed at the Advanced Visualization Lab at the National Center for Supercomputing Applications, University of Illinois at Urbana-Champaign. This Lab focuses on producing cinematic scientific visualizations.
Publisher's Note
All claims expressed in this article are solely those of the authors and do not necessarily represent those of their affiliated organizations, or those of the publisher, the editors and the reviewers. Any product that may be evaluated in this article, or claim that may be made by its manufacturer, is not guaranteed or endorsed by the publisher.
References
Borkiewicz, K., Naiman, J. P., and Lai, H. (2019). Cinematic visualization of multiresolution data: ytini for adaptive mesh refinement in Houdini. Astron. J. 158, 1–18. doi: 10.3847/1538-3881/ab1f6f
Bradbury, J., and Guadagno, R. (2020). Documentary narrative visualization: features and modes of documentary film in narrative visualization. Inf. Vis. 19, 339–352. doi: 10.1177/1473871620925071
Dawson, E., and Jensen, E. (2011). Towards a 'contextual turn' in visitor research: evaluating visitor segmentation and identity-related motivations. Visitor Stud. 14, 127–140. doi: 10.1080/10645578.2011.608001
Flagg, B.. (2005). Beyond entertainment: educational impact of films and companion materials. Big Frame 22, 50–66. Available online at: https://www.informalscience.org/sites/default/files/Beyond-Entertainment-Flagg.pdf
Fraser, J., Heimlich, J., Jacobsen, J., Yocco, V., Sickler, J., Kisiel, J., et al. (2012). Giant screen film and science learning in museums. Museum Manage. Curatorship 27, 179–195. doi: 10.1080/09647775.2012.674322
Friendly, M.. (2005). “Milestones in the history of data visualization: a case study in statistical historiography,” in Classification: The Ubiquitous Challenge, eds C. Weihs and W. Gaul (New York, NY: Springer), 34–52. doi: 10.1007/3-540-28084-7_4
Friendly, M.. (2008). “A brief history of data visualization,” in Handbook of Data Visualization, eds C. Chen, W. Härdle, and A. Unwin (Heidelberg: Springer), 15–56. doi: 10.1007/978-3-540-33037-0_2
Heimlich, J., Sickler, J., Yocco, V., and Storksdieck, M. (2010). Influence of Immersion on Visitor Learning: Maya Skies Research Report. Submitted to Chabot Space and Science Center. Institute for Learning Innovation.
Hurzlmeier, M., Watzka, B., Hoyer, C., Girwidz, R., and Ertl, B. (2021). Lernergebnisse und individuelle Prozesse des Physik-Lernens mit auditiven und visuellen Hinweisen. Zeitschrift für Pädagogische Psychologie. 1–18. doi: 10.1024/1010-0652/a000331
Jensen, A. M., Jensen, E. A., Duca, E., and Roche, J. (2021). Investigating diversity in European audiences for public engagement with research: who attends European Researchers' Night in Ireland, the UK and Malta? PLoS ONE 16:e0252854. doi: 10.1371/journal.pone.0252854
Jensen, E.. (2014). The problems with science communication evaluation. J. Sci. Commun. 1:C04. doi: 10.22323/2.13010304
Jensen, E., Dawson, E., and Falk, J. (2011). Dialogue and synthesis: developing consensus in visitor research methodology. Visitor Stud. 14, 158–161. doi: 10.1080/10645578.2011.608003
Jensen, E. A.. (2020). Re-examining research on motivations and perspectives of scientists relating to public engagement. Proc. Natl. Acad. Sci. U.S.A. 117:10628. doi: 10.1073/pnas.2000633117
Jensen, E. A., and Gerber, A. (2020). Evidence-based science communication. Front. Commun. 4, 78. doi: 10.3389/fcomm.2019.00078
Johnson, C.. (2004). Top scientific visualization research problems. IEEE Comput. Graph. Appl. 24, 13–17. doi: 10.1109/MCG.2004.20
Kennedy, E. B., Jensen, E. A., and Verbeke, M. (2018). Preaching to the scientifically converted: evaluating inclusivity in science festival audiences. Int. J. Sci. Educ. Part B 8, 14–21. doi: 10.1080/21548455.2017.1371356
Land, A., Bakker, L., and Jensen, E. A. (2020). “Informal science education,” in Science Communication: An Introduction, eds F. Dam, L. Bakker, A. Dijkstra, and E. A. Jensen (Singapore: World Scientific Publishing) 91–117. doi: 10.1142/9789811209888_0005
Lombard, M., Reich, R. D., Grabe, M. E., Bracken, C. C., and Ditton, T. B. (2000). Presence and television: the role of screen size. Hum. Commun. Res. 26, 75–98. doi: 10.1111/j.1468-2958.2000.tb00750.x
Nucci, M.. (2018). Social media and participatory authorship in giant screen films. Curator 61, 285–300. doi: 10.1111/cura.12251
Rockman, S., Bass, K., and Borland, J. (2007). Media-Based Learning Science in Informal Environments. Commissioned Paper prepared for Learning Science in Informal Environments Committee of the National Research Council and National Academy of Science.
Shih, J., Borkiewicz, K., Christensen, A. J., and Cox, D. (2019). “Interactive cinematic scientific visualization in unity,” in Proceedings of SIGGRAPH'19 Posters (New York, NY: ACM). doi: 10.1145/3306214.3338588
Smith, L. F., Arcand, K., Smith, R., Bookbinder, J. A., and Smith, J. S. (2017). Capturing the many faces of an exploded star: communicating complex and evolving astronomical data. J. Sci. Commun. 16:A02. doi: 10.22323/2.16050202
Smith, L. F., Smith, J. K., Arcand, K. K., Smith, R. K., and Bookbinder, J. A. (2015). Aesthetics and astronomy: how museum labels affect the understanding and appreciation of Deep-Space Images. Curator 58, 282–297. doi: 10.1111/cura.12114
Smith, L. F., Smith, J. K., Arcand, K. K., Smith, R. K., Bookbinder, J. A., and Keech, K. (2010). Aesthetics and astronomy: studying the public's perception and understanding of imagery from space. Sci. Commun. 33, 201–238. doi: 10.1177/1075547010379579
Yu, K. C., Sahami, K., Denn, G., Sahami, V., and Sessions, L. (2016). Immersive planetarium visualizations for teaching solar system moon concepts to undergraduates. J. Astron. Earth Sci. Educ. 3, 94–110. doi: 10.19030/jaese.v3i2.9843
Keywords: science communication, scientific visualization, public engagement with research, public engagement with science and technology, data visualization, science education, informal learning, planetarium
Citation: Jensen EA, Borkiewicz KM and Naiman JP (2022) A New Frontier in Science Communication? What We Know About How Public Audiences Respond to Cinematic Scientific Visualization. Front. Commun. 7:840631. doi: 10.3389/fcomm.2022.840631
Received: 21 December 2021; Accepted: 09 February 2022;
Published: 15 April 2022.
Edited by:
Sabine Tan, Curtin University, AustraliaReviewed by:
André Bresges, University of Cologne, GermanyCopyright © 2022 Jensen, Borkiewicz and Naiman. This is an open-access article distributed under the terms of the Creative Commons Attribution License (CC BY). The use, distribution or reproduction in other forums is permitted, provided the original author(s) and the copyright owner(s) are credited and that the original publication in this journal is cited, in accordance with accepted academic practice. No use, distribution or reproduction is permitted which does not comply with these terms.
*Correspondence: Eric A. Jensen, amVuc2VuQGdhdGVzc2Nob2xhci5vcmc=; orcid.org/0000-0002-8332-4507