 Olanrewaju Lawal
- Department of Geography and Environmental Management, Faculty of Social Sciences, University of Port Harcourt, Port Harcourt, Nigeria
Since the emergence of COVID-19 in 2020, various actions have been taken by governments and agencies globally to curtail its spread and devastating effects. Risk communication is an essential component of such actions. Examination of public interest, risk perception and new cases of COVID-19 is vital to understanding the effectiveness of risk communication strategies implemented. With data paucity plaguing policymaking in Nigeria, there is a need to examine new data sources to support the enhancement of risk communication. The study explored Google Trends (GT) and Google Mobility Reports (GMR) in monitoring public restlessness and risk perception, respectively, toward COVID-19 in Nigeria. This is geared toward understanding the effectiveness of the national risk communication strategy. COVID-19 case statistics, stringency index, mobility, and search indices for selected terms were collated (February 28 to June 30, 2020). Temporal dynamics were examined while correlation analysis was carried out to examine the association. Public attention peaked just around the commencement of the nationwide lockdown and declined considerably afterwards despite increasing new cases. Mobility toward most place categories showed a sharp decline at the beginning of the pandemic, except for residential areas. This trend also reversed soon after the lockdown. COVID-19 case statistics were found to be negatively correlated with the public interest. Public interest had a weak but both negative and positive association with the stringency index, while mobility exhibited a weak negative association with the case statistics (except residential area mobility). The results indicated that the risk communication efforts were inadequate in providing a prolonged health behavior change. The initial risk communication and lockdown created a positive outcome, however, the impact soon faded out. The evidence suggests that risk perception may have been poorly targeted by risk communication interventions. It is recommended that continuous monitoring of public interest and risk perception is implemented during an emergency and risk communication adjusted accordingly.
Introduction
Pandemics characteristically alter a lot of human activities, and the COVID-19 outbreak of 2020 was no exception. Globally, lockdowns were instituted at the beginning of the disease outbreak to curtail the spread. Consequently, the closure of businesses and public facilities translates to economic grounding, which invariably takes a toll on people—strangulating livelihoods. This action puts the whole society at risk, socially and economically. But the risk to people in communities varies. Thus, lockdown or quarantine for some is a luxury (they can afford it), while for others it is a hardship or solitary confinement. In essence, this laid bare the challenges of sustainable and inclusive development in our public infrastructure, economy, and society. This extensive impact across the various facets of society highlights the complex interrelationship, often overlooked by all.
With over 5 million deaths and more than 240 million cases and three waves of the disease, as well as new variants (Worldometer, 2021), there is a need to do better. Many low- and middle-income countries faced significant challenges in curtailing the spread of the disease, some of which include porous borders, the burden of communicable and non-communicable diseases, poverty, poor health literacy, infodemic overcrowding, and weak health systems (Lucero-Prisno et al., 2020). Despite these challenges, African countries escaped mostly the wrath of the disease. But the lesson from the pandemic must be learned, as we may not be lucky next time. With the pandemic evolving and new variants identified, it is necessary to examine public attention and ongoing risk communication programmes. This is an important aspect that must be enhanced to ensure better management of infectious diseases. To enhance risk communication, there is a need to identify new data and avenues to monitor and understand the populace. Such would provide an evidence-based approach to risk communication and a locally relevant approach to the implementation of risk communication programmes. The work examined the possibility of examining the effectiveness of risk communication using crowdsourced data. This was in response to the lack of monitoring data in most countries. The study utilized Google Trends and Google Mobility Data to understand their usefulness in gauging the effectiveness of risk communication during the pandemic.
We live in a global village, and thus our health and socioeconomic reality are becoming more and more interwoven. Most importantly, our health is linked regardless of distance. According to risk society theory (Giddens, 2003), modern life creates comfort, which results in unintended and unforeseen consequences. COVID-19 brought this closer home. The global reach of air travel and trade created an unintended consequence of the ease of spread of communicable diseases. In a similar view, the increasing interconnectivity and interdependence increased the gap between the have and have-nots, so also is the risk to the entire system that both depend on for survival. Globally, the COVID-19 pandemic exposed the fragility of various sectors of the economy and the interrelationships in various aspects of our lives, revealing their corresponding deficiencies.
Risk perception captures a person's perceived susceptibility to certain threats and hazards. It is well-known that inadequate risk perception affects preventive behavior. This could be attributed to the underestimation of the situation, and a lack of fear or anxiety about the appropriate situation. Thus, actions taken by people (prevention and avoidance) are a function of their perception of the hazard (Coppola, 2011). People's knowledge, experience, values, attitudes, and feelings influence the judgement and decision about the acceptability and seriousness of the risk, thus their risk perception (Slovic, 1987). Therefore, to achieve the desired change in health behavior, as in the case of COVID-19, adequate targeting of risk perception with interventions is pertinent.
Differences exist between voluntary (knowingly taken risk) and involuntary (risk we are unable to control or not aware of) risk perception. According to Smith (2013), the willingness of the public to accept voluntary risk is several folds greater than that of involuntary risks (Smith, 2013). The way people view or perceive risk is a major problem for disaster risk mitigation. This is particularly important in the case of the COVID-19 pandemic. Risk perception skews how people view the consequences and the likelihood of them getting impacted—in the current situation getting infected with COVID-19.
Knowledge and information provided or available could modify risk perception and subsequent behavior. Exposure to falsehood or misinformation could warp risk perception, thereby changing the dynamic of the spread of an infectious disease such as COVID-19. As the pandemic progressed, misinformation “infodemic” (many conspiracies and false news about the virus) was widely circulated on social networks and the Internet (Zarocostas, 2020). In most cases, governments were playing catch up in trying to correct the misinformation. This pervasiveness of the misinformation created widespread skepticism about the pandemic globally. Similarly, various write-ups and messages about instant remedies for the virus and targeted fake news were being propagated across online mass media and social media (Rathore and Farooq, 2020). The Protective Action Decision Model (PADM) as revised by Lindell and Perry (2012), explained core perception that could form the basis for response decisions by receptors of risk information. Furthermore, the model considered situational facilitators and impediments as factors capable of producing a behavioral response. Applying the PADM ensures that risk communication considers the phase of the hazard phase. For example, risk communication during the emergency and before the emergency needs to be finely tuned to stimulate adequate response suitable for such situations. Thus, effective risk communication must take place within the understanding of people's perception, pre-decision processes, situational factors, and how information flow within the context of the emergency. After the design and implementation of the risk communication programmes, there is always the need to monitor and evaluate the programmes. It is in this context that this work become relevant.
The foregoing highlighted the relevance of risk communication in influencing risk perceptions. The challenge of social media networks became apparent (echo chamber) through the pandemic. People are stuck on certain social networks and receive the same falsehood repeatedly echoed, leaving no room for the truth. It should be noted that social media provides a viable means of disseminating information to the citizenry, and some people hide behind the anonymity it offers to perpetuate the evil of misinformation (Obi-Ani et al., 2020). The poor coverage and most probably the paucity of public education campaigns gave room for the spread of misinformation, making the disease more difficult to curtail. The work of Olatunji et al. (2020) showed that COVID-19 conspiracy theories were driven majorly by social media networks, a dearth of trust in political leadership, and the “sensationalisation” of inaccurate COVID-19 news by traditional media. Other studies showed that news media reporting lacked in-depth coverage. They are often alarming and panic-inducing reporting; public sensitisation and education were sparingly captured (Apuke and Omar, 2020). The Herculean task of keeping up with the speed and spread of misinformation on social media cannot be left to chance, due to its importance in shaping people's perception of risk. Thus, lessons must be learnt by the various authorities on the need to build trust. They must understand the dynamics of misinformation on social media and other media.
It could be noted that measuring belief or risk perception is generally difficult to evaluate, and since our risk perception is often threat-specific, i.e., we do not hold the same risk perception about car accidents and COVID-19. Risk perception will often change according to the available information, but it also has deliberative, affective, and experiential components (Ferrer and Klein, 2015).
Most of the data available and research for understanding the restlessness or public attention or risk perception are usually derived from survey data and generalized to a spatial unit. Thus, there is a data gap, in this respect. Google Trends and Google Mobility data could fill this data gap. Google Trends provides data on online search queries and offers a unique opportunity for gauging the restlessness or attention of people on many issues. Coupled with the availability of geographic context and time for these queries, it provides an opportunity to carry out a spatial analysis of the pattern formed by the online search data. Google Trend and other search data have been used in many works across different fields. For example, in the analysis of public attention on housing prices in China (Zhang and Tang, 2016); tracking public opinion, economy, anxieties, etc. (Hubbard, 2011); housing price and sales (Wu and Brynjolfsson, 2015); inflation expectation (Guzman, 2011); syndromic surveillance (Johnson et al., 2004; Eysenbach, 2006; Hulth et al., 2009; Pelat et al., 2009); unemployment forecast (Askitas and Zimmermann, 2009; Naccarato et al., 2015); economic indicators (Choi and Varian, 2012); voters roll-off (Reilly et al., 2012); attention on virtual security (Lawal, 2017).
Aggregated mobility data could indicate people's behavior and behavior is the result of the perception of risk during an emergency. Thus, people will make decisions or opt for different choices despite the constraints (Zsolnai, 1998) of the pandemic based on their perception of the risk of exposure and risk of contracting the disease. Travel restrictions were implemented to slow down the spread of the disease globally. behaviors breaching such restrictions are bound to indicate how groups of people perceive their risk of contracting the disease or even dying from the disease. For example, Lawal and Nwegbu (2020) analyse the level of compliance with the travel restrictions during the lockdown in Nigeria. The study utilized aggregated Google Mobility data at the State level to characterize the risk perception of COVID-19 across the States. They concluded that from the evolution of the mobility to different place categories, the mobility pattern indicated that people are accepting the risk of contracting COVID-19 as an involuntary risk they need to accept. This work showcased the possibility of the utlisation of Google mobility data for risk perception analysis.
Data and Methods
Data
Mobility data was sourced from the Google COVID-19 mobility report (Google LLC, 2020). The dataset represents the percentage change in mobility around six place categories from their baseline. The baseline period is 5 weeks between January 3 and February 6, 2020. The places categories captured are:
1. Grocery and pharmacy (GRPH): grocery markets, food warehouses, farmers' markets, speciality food stores, drug stores, and pharmacies.
2. Parks (PARK): local parks, national parks, public beaches, marinas, dog parks, plazas, and public gardens.
3. Transit stations (TRST): public transport hubs such as subway, bus, and train stations.
4. Retail and recreation (RTRC): restaurants, cafes, shopping centers, theme parks, museums, libraries, and movie theaters.
5. Residential (RESD): places of residence.
6. Workplaces (WKPL): places of work.
Google trend data are a time series index of the volume of queries (search) submitted by users in each geographic area, each data point is divided by the total searches for the location and time range it represents (Lawal, 2017). To derive the data points, the total query volume for the search term (for example “COVID-19”) is divided by the total number of queries (all the queries) during the period of interest for a location or region of interest. The data is then normalized to have values ranging between 0 and 100, showing the search term's proportion to all searches across all topics in the region (Google Inc., 2017). Six search terms were considered: Covid, Covid19, corona, Coronavirus, coronavirus, and COVID-19.
For COVID-19 case statistics (total cases and new cases), data was sourced from the COVID-19 Data Repository by the Center for Systems Science and Engineering (CSSE) at Johns Hopkins University (Dong et al., 2020). Additional case statistics, such as new cases per million and an indicator of the stringency of government response and policies (stringency index) were collated from the Our World in Data COVID-19 data repository (https://covid.ourworldindata.org/).
Search index, new cases data and mobility data were collated for the period between February 28th 2020 to June 30th 2020, covering the day from the first confirmed case to the day the Government Response Index declined to below 66 (relaxing of stringency), according to data collated by Hale et al. (2021) for Nigeria.
Methods
To examine the temporal pattern of Public Restlessness, the search index data was plotted over time in comparison to the daily number of cases. A similar approach was adopted to compare the underlying pattern of mobility and newly recorded cases. Descriptive statistics were computed to summarize the distribution across the period under consideration. Spearman Rank Correlation analysis was carried out to examine the strength and direction of association across the variables of interest (mobility, search index and COVID-19 case statistics) in the study.
Results and Discussion
Analysis of Public Restlessness From Google Trend Data
The search terms “Coronavirus” and “coronavirus” had a similar trend throughout the period considered and peaked around 26 March 2020, and a spike to the same peak was recorded on 2 April 2020 (Figure 1A). The search index for these two terms trended upwards from the record of the 1st case of COVID-19 in Nigeria. The trend turned downward from the peak on March 26, for both terms, and continued even through the announcement of the institution of the Nationwide lockdown on March 28, 2020. It would have been expected that the institution of lockdown would have stimulated more interest in the disease. The decline in interest (and alternatively public restlessness) continued until the 12th of April with a spike in interest on the 2nd and 8th of April 2020. The upward trend resumed on the 13th of April coinciding with the increasing number of cases; this continued until the 17th of April, with sharp variation in interest for these search terms until the 26th of April, when a consistent downward trend in interest resumed. Despite the growing number of new cases of COVID-19, the search index for these two terms continued to downtrend consistently, this is a very curious situation.
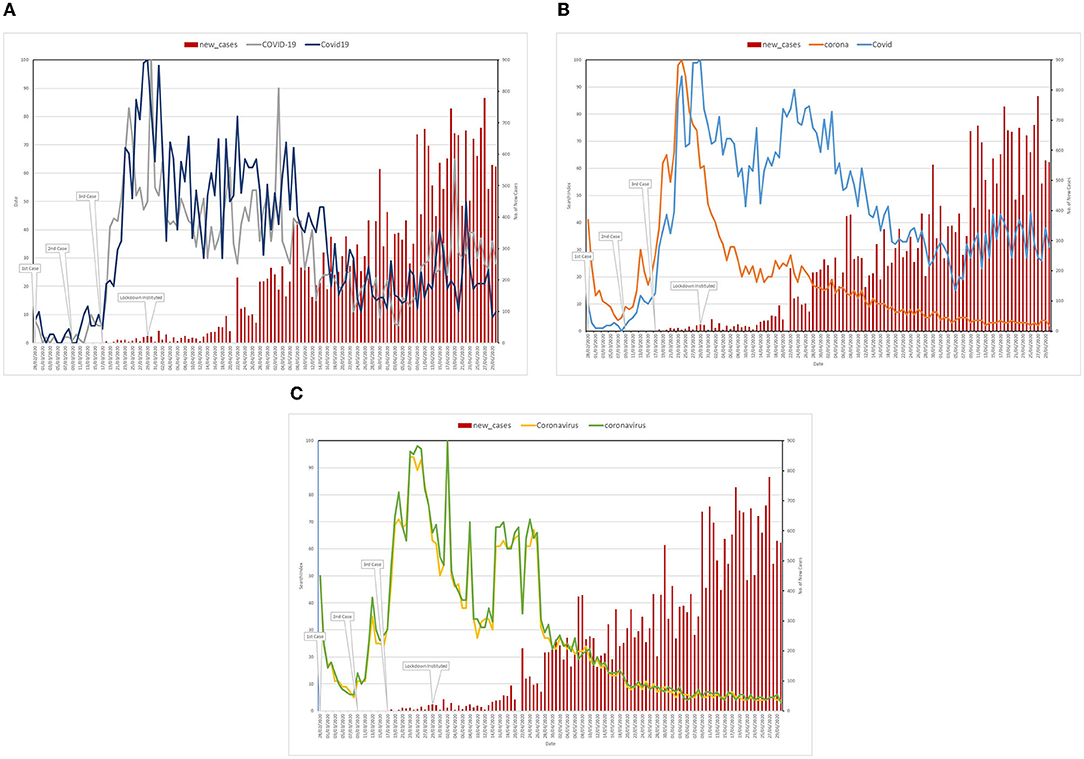
Figure 1. Trend of public attention on COVID-19 related search terms and new COVID-19 cases (A) Search terms: Coronavirus and coronavirus (B) Search terms: corona and Covid, and (C) Search terms: COVID-19 and Covid19.
In the case of search terms “corona” and “Covid” (Figure 1B), the public interest for them trended upward generally from the discovery of the first case until the 24th of March. Search interest for “Covid” after a sharp decline on the 25th of March continued in an uptrend, achieving a peak on the 29th of March (a day after the institution of the Lockdown).
Search interest for the “corona” decreased sharply from the peak achieved on 25 March, and this continued throughout the period under consideration. This is despite the almost constant increase in the number of new cases of COVID-19 in Nigeria. The search interest for “Covid” recorded a general downward trend from the peak achieved on 29 March until 10 April and 14 April, when a new uptrend was established lasting 9 days (23rd of April). A new downtrend in public interest started and continued until 5 June. From the 5th of June, a fluctuating pattern of public interest in the search term emerged. This new trend continued until the end of the period considered. After the decline which ended on 5 June, the changes in the public interest for the search term “Covid” showed a variation analogous to the variation in new cases of COVID-19.
Figure 1C showed that an initial increase in the public interest was also observed similar to the observation in Figures 1A,B for the search terms “COVID-19” and “Covid19.” Although the two achieved peaks at different times, 29 March for ‘COVID-19” and 1 April for “Covid19,” just at the beginning of the National Lockdown). These search terms witnessed declined generally from their respective peaks in late March, reaching a base around the 2nd and 1st week of May after which a new downward trend begins until the 25th of May (Covid19) and the 4th of June (COVID-19) when the variation in public interest somewhat mimic the changes in the announcement of new cases of the disease. For all search terms, the trend of public interest or public restlessness is more pronounced at the beginning (during the 30 days of the first case emergence in Nigeria) than in subsequent months, during which the country recorded more cases and an increase in the spread of the disease.
Mobility Trend and COVID Cases
Mobility was used as a proxy to capture the perception of the populace in terms of the COVID-19 epidemic and the potential effectiveness of the risk communication efforts. The trend of new cases and the trend of mobility toward place categories are presented in Figure 2. The comparison showcased the potential association between mobility trends and COVID 19 cases, thus providing an opportunity to examine how risk communication shapes perception and consequently the number of new cases in the country.
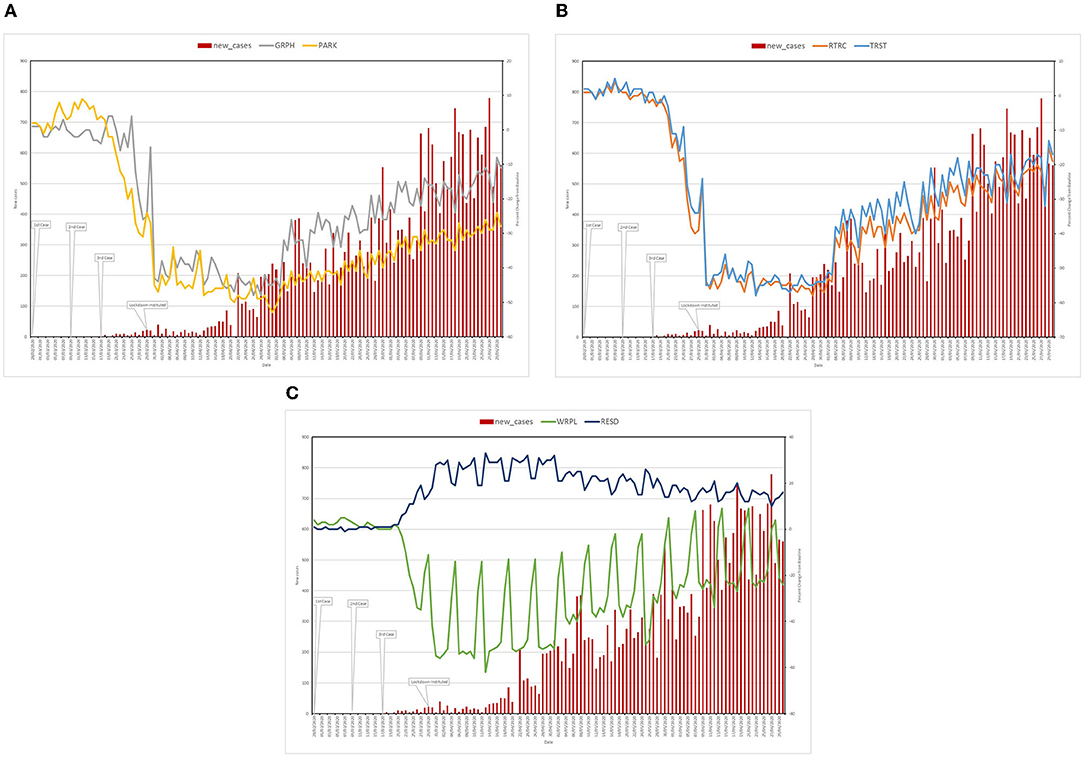
Figure 2. Trend of new cases and percentage changes in mobility from baseline to selected destinations (A) Place categories: WRPL and RESD (B) Place categories: RTRC and TRST, and (C) Place categories: GRPH and PARK.
A comparison of WKPL and RESD mobility trends with new cases of COVID-19 (Figure 2A) showed that considerable changes in mobility were observed for these place categories around the time of the institution of national lockdown in Nigeria. The trend showed that many gravitate toward the residential areas (increase in percentage change from baseline aggregated mobility), while gravitation toward the workplace witnessed a much sharper decline. In terms of the number of new cases, there was a decrease that mimicked the trend of mobility toward WKPL at the initial phase of the pandemic.
However, as the mobility trend (downward for WKPL and upward trend for RESD categories) peaked around the second week of April, the number of new cases started increasing with similar changes in mobility toward workplace and residential areas. Albeit the fluctuations in the mobility trends, the general trend shows increased mobility toward workplaces and a gradual movement away from residential areas. Essentially, there seem to be more people going to work and leaving their residences, and the general trend for the number of new cases was upward in line with the mobility trend.
Mobility trends for RTRC and TRST were compared to the new cases (Figure 2B). The result showed that mobility toward these two place categories is almost moving in lockstep, and both witnessed a decline which peaked around the second week of April 2020. The percentage change from baseline for these two fluctuated −46% and −58% from the time of the institution of the lockdown and the first week of May 2020. The consolidation of mobility during this period showed no association with the number of new cases. Although the peak of mobility decline for these two coincides with the trough of the new cases which occurred on the 13th of April 2020. From this date, despite the consolidation observed for mobility, new cases started on another uptrend. The uptrend continued with increasing gravitation toward these place categories.
The percentage changes in mobility toward parks (PARK) and grocery and pharmacy (GRPH) were also compared with the number of new cases in Figure 2C. The trend was like what was observed for RTRC and TRST. However, the points at which the peak of the decline was observed were different (1st week of May 2020 for PARK and the 4th week of April for GRPH). More so, the consolidation observed for RTRC and TRST was also absent for PARK and GRPH. The number of new cases showed no clear association with the mobility trend for these two place categories up till the first week of May. From this point onward the number of new cases and mobility trend started a concurrent uptrend.
Analysis of Public Restlessness, Mobility and Case Numbers
To quantify the strength and identify the direction of association between public restlessness (captured by the Google search index), mobility (captured by percentage change from baseline mobility), and COVID 19 case statistics, correlation analysis was carried out.
For the search terms utilized in this study, three (corona, Coronavirus, and coronavirus) displayed a statistically significant (P < 0.05) and strong negative association with total cases, new cases, and new cases per million (Table 1). The stringency index represents the strictness of government policies to control the spread of the virus. Results in Table 1 showed that the index has a statistically significant and weak positive association with some of the search terms (COVID19, Covid, and Covid19) while it displayed a statistically significant but weak negative association with the search term “corona.”
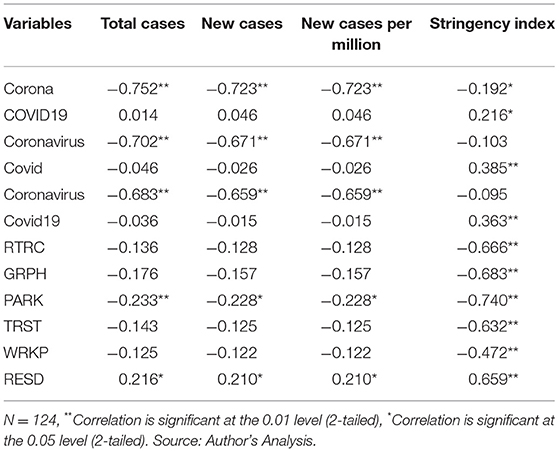
Table 1. Correlation analysis results testing the association between restlessness, mobility, and COVID-19 case numbers.
The observed association between some of the search terms and case statistics indicated that increasing public restlessness is associated with a lower number of cases. In the case of public restlessness indicators (search terms) and the indicator of COVID-19 government policy strictness, a positive association was observed.
Comparison of the mobility and stringency index showed statistically significant and moderate to strong (correlation coefficient between 0.5 and 0.7) negative association with all the place categories except RESD. Changes in mobility for RESD displayed a strong positive and statistically significant relationship with the stringency index. This suggests that an increase in stringency index is associated with a decrease in percentage change from baseline mobility toward most places categories (RESD displayed the opposite).
Mobility toward PARK and RESD showed association with COVID-19 case statistics. The place category PARK displayed a statistically significant but weak negative association with total cases, new cases, and new cases per million. RESD displayed a weak positive but statistically significant association with the three case statistics. The relationship observed that mobility played a very small role in explaining the COVID-19 case statistics.
Discussion
Public restlessness, as captured by the Google search index, captured the increased attention of the public toward the pandemic. The analysis of the search terms revealed the dynamics of the public attention or restlessness over the period under consideration. Essentially, attention peaked early across Nigeria and most especially just around the time of the institution of the nationwide lockdown. Thus, restlessness declined considerably after the introduction of the lockdown, as reflected by the decline in the search index for all the search terms, despite the increase in the number of cases. It is plausible to deduce that after the lockdown, most people became complacent about the disease. This is similar to the findings of Effenberger et al. (2020) which highlighted that public interest in COVID peaked across some countries in Europe, North America, North Africa, and Asia before the peak of the new COVID-19 cases. This was also corroborated by similar work in Taiwan (Husnayain et al., 2020). The finding thus indicated the potential of the search index for gauging public interest or restlessness under emergency or disaster conditions.
Mobility toward most place categories showed a sharp decline at the beginning of the pandemic, except for residential areas (which witnessed an increase). This signifies that, as the populace gets more aware of the pandemic, the understanding and potentially the fear of contracting the diseases drove many away from places they usually go to and stayed at home. This reaction was reflected temporarily in the number of cases (slight decline), but the upward trend in new cases resumed shortly. As the mobility began an upward trend after a short consolidation of the trend, the number of new cases continued. The trend for the magnitude of new cases surpassed previous numbers despite a marked percentage decline in mobility across most place categories. This could be because of increasing testing capacity, as well as the inadequate implementation of non-pharmaceutical interventions (NPI). There are indications that many people are not able to maintain social distance, had challenges in maintaining a livelihood, and had little or no access to NPI (e.g., lack of access to a handwashing facility with water and soap, and nose masks were unaffordable or unavailable). The mobility restriction led to income losses and a reduction in purchasing power among the poorest households), thus making it very difficult for many to continue to abide by the lockdown. A recent report showed that state-level mobility restrictions reduced the probability of non-farm business activities participation by 11% and increased the household experience of food insecurity by 13% (Amare et al., 2021).
The relationship between COVID-19 case statistics and some indicators of public restlessness indicated that, as interest declines, the number of cases increases. This is contrary to the observation of Effenberger et al. (2020). Their results showed that the number of new cases has a negative association with selected search terms in Iran but, for all the other countries examined (North Africa, Asia, North America, Europe), the association is positive. The disparity could be attributed to the differences in the public risk communication programme, and most importantly, the risk perception of the people. In the Nigerian situation, the fatalistic attitude of society is a dangerous one that often dissuades the prioritisation of prevention and preparedness. Thus, exacerbating losses and damages. For example, a cross-sectional survey of knowledge and preventive practise in the Southeastern city of Enugu revealed that the use of face masks and the avoidance of crowds was poorly practised as COVID-19 NPI (Nwonwu et al., 2020).
In the case of the association between the stringency index and public restlessness, the observation indicated that while a weak association was recorded, the stricter the policy, the higher the public restlessness or interest. Thus, stricter government policy can stimulate interest to some extent. There is an indication that stringency and public interest increased to a point after which people have had enough, in essence, a point of information fatigue. This is in agreement with the findings of Skulmowski and Standl (2021). They showed as time passes the need for information about COVID-19 declines (attention and restlessness), as such, even when new waves are being reported, very little behavioral change can be expected.
The weak negative relationship observed between case statistics and mobility for all place categories except RESD indicated that the role of mobility may be small, but it is not negligible. This is in line with the findings of Ajide et al. (2020) who found that the RESD is a positively signed predictor of new COVID-19 cases, while all the others are negatively signed predictors. The weak association could be attributed to the fact that, after the initial decline and compliance with restrictions, people consciously or otherwise accepted the risk and carried on with their daily activities (Lawal and Nwegbu, 2020). This could be expected as fatigue sets in, and because of the lack of social safety (many are unable to earn income for their upkeep and survival)—are thus motivated to seek their proverbial “daily bread.” Many consequently deduced that the health risk due to COVID-19 infection is not as bad as dying of hunger under the mobility restriction. The finding thus shows that mobility toward certain places (except residential areas) is associated with lower infection rates. In the same vein, mobility toward residence, if not backed up with adequate NPI, can result in increasing infection (Ajide et al., 2020). It is plausible to deduce that in households and across communities where NPI is not practical, it will be difficult to be successful in curtailing the spread of the disease. This has made some dubbed the pandemic as the inequal virus, as some people have the luxury of staying at home because they have the financial wherewithal and the adequate space, while others are forced to live in cramped conditions (further spreading the disease).
The association between percentage change in mobility from baseline showed that the index mirrors what is going on across the country concerning the lockdown which restricts mobility. The observation of a moderate to a strong association between stringency index and mobility indicates that people heard and changed their actions. But the changes appeared to be only limited to mobility for some time. Other actions to limit the spread were not effective in reducing the number of cases—as the number of cases continues to rise, despite the heightened stringency. The other plausible explanation is that people are not able to follow the guidelines as specified by the government policies.
Policy strictness appeared to have worked to some extent, most especially for mobility. This showed that the mobility data from the Google dataset was able to reflect some aspects of the stringency of government policies for preventing the spread of the disease. There is a possibility that, by looking at the two—mobility and stringency index, there is a possibility of identifying where the policy gaps are present in the response. For example, the stringency index for Nigeria reached a peak around the date of the institution of the lockdown and remained relatively the same, all through the period considered. A similar plateau was found in Latin America, as reported by Zhu et al. (2020). When this is compared to the growing number of cases, there is evidence that suggests that there is a gap in the policy response. Zhu et al. (2020) in their comparison of stringency index and mobility across Latin America between February and May 2020, identified divergence between the mobility and stringency index. The evidence suggests that the policy responses (as captured by the stringency index) are not nimble or responsive enough to ensure that cases reduce in line with the policies. This represents a major learning opportunity for a public health emergency response for Nigeria and many countries. This gap was further highlighted by Dzator et al. (2021) from their global analysis of Stringency and COVID-19 cases. They reported that case statistics have an inverted U-shaped relationship with stringency. A similar relationship was reported between case statistics and the population with access to basic handwashing facilities. Thus, the effect reaches a peak and begins to decline gradually, implying that other measures and policies are required to bring the case numbers down.
Limitations
It should be noted that not everyone uses Google as their search engine, therefore there is a part of the population that is not captured in the Google Trend Dataset. However, as it is the most widely used search engine, the data is robust enough. The same problem of potentially incomplete data also plagued the Google Mobility Dataset. Some people may not activate their location tracking and some are not using Google Android Operating System for mobiles which allowed location tracking. However, these datasets are useful indicators while other sources of data are developed, and data collected.
Conclusion and Recommendation
The analysis revealed that public restlessness can be captured by examining the trend in relevant keywords across the country. This can be useful in targeting risk communication to meet the needs and interests of the people, and most important to stimulate the required actions toward emergencies like the COVID-19 pandemic. Mobility restriction was observed for some time. However, compliance wanes after a short period. This waning was also reflected in the number of new COVID cases. Similarly, public interest waned, while the number of new cases increased. From the evidence, we can conclude that people heard the message and adhere to the policies they found practical for their lives. But after a while, they got tired.
From the foregoing, it is apparent that:
1. Many got tired of the message and lost interest in the message hence stop responding
2. Many have little or no wherewithal to respond adequately to the government policy responses
3. Government policy responses lack adequate flexibility and nimbleness to adapt to public restlessness and opinion and thereby limit the spread of COVID-19.
Conclusively, the evidence suggests that risk perception was poorly targeted by the various risk communication interventions and policies. So also, the risk communication and policy interventions remain rigid. Thus, the unsuccessful attempt at changing risk perceptions was partly responsible for the undesirable health behaviors noticed during the period examined.
In light of this, there is a need to continuously examine the impact of public communication during an emergency and adjust accordingly for subsequent emergencies. Risk communication must be adapted to ensure the fatigue is prevented. For example, communication should be more personalized, thus information strategies that could avoid information overload should be prioritized. This would avoid inducing negative emotions and ensure that personally relevant information is shared.
Furthermore, the use of the Google trend provides a tool for which relevant agencies can monitor restlessness and interest. This could offer evidence to use in the modification of risk communication strategies to ensure effective communication. The divergence between mobility and stringency shows that mobility restrictions should not be the only action, and it is equally important to provide the necessary support to ensure people can act on measures to curtail the spread of infectious diseases. Thus, it is necessary to do the hard work of acting on socio-economic inclusiveness and enhancement of the wellbeing of the people. Poverty increases vulnerability, while also limiting the capacity to respond to warnings and the ability to take precautionary measures. Thus, the effectiveness of risk communication can be limited by poverty. The institution of policies that improve income, job quality, education, housing, health, and equality not only improve the wellbeing of the poor and disadvantaged but will also enhance the resilience and adaptative capacities of the people. This ultimately improves the effectiveness of risk communication. As such, the pandemic reminded us that we are as strong as the weakest among us.
Data Availability Statement
The original contributions presented in the study are included in the article/supplementary material, further inquiries can be directed to the corresponding author.
Author Contributions
OL conceptualized, analyzed, and reported this work.
Conflict of Interest
The author declares that the research was conducted in the absence of any commercial or financial relationships that could be construed as a potential conflict of interest.
Publisher's Note
All claims expressed in this article are solely those of the authors and do not necessarily represent those of their affiliated organizations, or those of the publisher, the editors and the reviewers. Any product that may be evaluated in this article, or claim that may be made by its manufacturer, is not guaranteed or endorsed by the publisher.
References
Ajide, K. B., Ibrahim, R. L., and Alimi, O. Y. (2020). Estimating the impacts of lockdown on Covid-19 cases in Nigeria. Transp. Res. Interdiscip. Perspect. 7, 100217–100217. doi: 10.1016/j.trip.2020.100217
Amare, M., Abay, K. A., Tiberti, L., and Chamberlin, J. (2021). COVID-19 and food security: panel data evidence from Nigeria. Food Policy 101, 102099. doi: 10.1016/j.foodpol.2021.102099
Apuke, O. D., and Omar, B. (2020). How do Nigerian newspapers report COVID-19 pandemic? The implication for awareness and prevention. Health Educ. Res. 35, 471–480. doi: 10.1093/her/cyaa031
Askitas, N., and Zimmermann, K. F. (2009). Google econometrics and unemployment forecasting. Appl. Econ. Quart. 55, 107–120. doi: 10.3790/aeq.55.2.107
Choi, H., and Varian, H. (2012). Predicting the present with Google Trends. Econ. Rec. 88, 2–9. doi: 10.1111/j.1475-4932.2012.00809.x
Coppola, D. P. (2011). “Risk and vulnerability,” in Introduction to International Disaster Management, 2nd ed (Burlington: Butterworth-Heinemann), 138–207. doi: 10.1016/B978-0-12-382174-4.00003-3
Dong, E., Du, H., and Gardner, L. (2020). An interactive web-based dashboard to track COVID-19 in real time. Lancet Infect. Dis. 20, 533–534. doi: 10.1016/S1473-3099(20)30120-1
Dzator, J., Acheampong, A. O., Dzator, M., Paolucci, F., Yawe, B. L., Asmah, E. E., et al. (2021). Policy stringency, handwashing and COVID-19 cases: evidence from global dataset. Health Policy Technol. 11, 100574. doi: 10.1016/j.hlpt.2021.100574
Effenberger, M., Kronbichler, A., Shin, J. I., Mayer, G., Tilg, H., and Perco, P. (2020). Association of the COVID-19 pandemic with Internet Search Volumes: a Google TrendsTM analysis. Int. J. Infect. Dis. 95, 192–197. doi: 10.1016/j.ijid.2020.04.033
Eysenbach, G. (2006). “Infodemiology: tracking flu-related searches on the web for syndromic surveillance, in AMIA Annual Symposium Proceedings (Washington, DC).
Ferrer, R. A., and Klein, W. M. P. (2015). Risk perceptions and health behavior. Curr. Opinion Psychol. 5, 85–89. doi: 10.1016/j.copsyc.2015.03.012
Giddens, A. (2003). Runaway World: How Globalization is Reshaping Our Lives. New York, NY: Routledge.
Google Inc. (2017). Where Trends Data Comes From? Google. Retrieved from: https://support.google.com/trends/answer/4355213?hl=en&ref_topic=6248052 (accessed July 21, 2020).
Google LLC (2020). COVID-19 Community Mobility Report. Available online at: https://www.google.com/covid19/mobility/index.html?hl=en (accessed June 5, 2020).
Guzman, G. (2011). Internet search behavior as an economic forecasting tool: the case of inflation expectations. J. Econ. Soc. Meas. 36, 119–167. doi: 10.3233/JEM-2011-0342
Hale, T., Angrist, N., Goldszmidt, R., Kira, B., Petherick, A., Phillips, T., et al. (2021). A global panel database of pandemic policies (Oxford COVID-19 Government Response Tracker). Nat. Human Behav. 5, 529–538. doi: 10.1038/s41562-021-01079-8
Hubbard, D. W. (2011). Pulse: The New Science of Harnessing Internet Buzz to Track Threats and Opportunities. Mahwah, NJ: John Wiley & Sons. doi: 10.1002/9781119200956
Hulth, A., Rydevik, G., and Linde, A. (2009). Web queries as a source for syndromic surveillance. PLoS ONE 4, e4378. doi: 10.1371/journal.pone.0004378
Husnayain, A., Fuad, A., and Su, E. C.-Y. (2020). Applications of Google Search Trends for risk communication in infectious disease management: a case study of the COVID-19 outbreak in Taiwan. Int. J. Infect. Dis. 95, 221–223. doi: 10.1016/j.ijid.2020.03.021
Johnson, H. A., Wagner, M. M., Hogan, W. R., Chapman, W. W., Olszewski, R. T., Dowling, J. N., et al. (2004). Analysis of Web Access Logs for Surveillance of Influenza. San Francisco, CA: Medinfo.
Lawal, O. (2017). Gleaning public attention from Big Data: a spatio-temporal assessment of attention on virtual security in Nigeria. J. Geographic Thought Environ. Stud. 15, 68–87.
Lawal, O., and Nwegbu, C. (2020). Movement and risk perception: evidence from spatial analysis of mobile phone-based mobility during the COVID-19 lockdown, Nigeria. GeoJournal 87, 1543–1558. doi: 10.1007/s10708-020-10331-z
Lindell, M. K., and Perry, R. W. (2012). The protective action decision model: theoretical modifications and additional evidence. Risk Anal. 32, 616–632. doi: 10.1111/j.1539-6924.2011.01647.x
Lucero-Prisno, D. E. III., Adebisi, Y. A., and Lin, X. (2020). Current efforts and challenges facing responses to 2019-nCoV in Africa. Glob. Health Res. Policy 5, 21. doi: 10.1186/s41256-020-00148-1
Naccarato, A., Pierini, A., and Falorsi, S. (2015). Using Google Trend Data to Predict the Italian Unemployment Rate. Rome.
Nwonwu, E. U., Ossai, E. N., Umeokonkwo, C. D., and Ituma, I. B. (2020). Knowledge and preventive practice to COVID-19 among household heads in Enugu metropolis, South-East Nigeria. Pan Afr. Med. J. 37, 63–63. doi: 10.11604/pamj.2020.37.63.23986
Obi-Ani, N. A., Anikwenze, C., and Isiani, M. C. (2020). Social media and the Covid-19 pandemic: observations from Nigeria. Cogent Arts Humanities 7, 1799483. doi: 10.1080/23311983.2020.1799483
Olatunji, O., Ayandele, O., Ashirudeen, D., and Olaniru, O. (2020). Infodemic in a pandemic: COVID-19 conspiracy theories in an African country. Soc. Health Behav. 3, 152–157. doi: 10.4103/SHB.SHB_43_20
Pelat, C., Turbelin, C., Bar-Hen, A., Flahault, A., and Valleron, A.-J. (2009). More diseases tracked by using google trends. Emerg. Infect. Dis. 15, 1327–1328. doi: 10.3201/eid1508.090299
Rathore, F. A., and Farooq, F. (2020). Information overload and infodemic in the COVID-19 pandemic. J. Pak. Med. Assoc. 70(Suppl. 3), S162–S165. doi: 10.5455/JPMA.38
Reilly, S., Richey, S., and Taylor, J. B. (2012). Using google search data for state politics research: an empirical validity test using roll-off data. State Politics Policy Quart. 12, 146–159. doi: 10.1177/1532440012438889
Skulmowski, A., and Standl, B. (2021). COVID-19 information fatigue? A case study of a German university website during two waves of the pandemic. Human Behav. Emerg. Technol. 3, 350–356. doi: 10.1002/hbe2.260
Smith, K. (2013). Environmental Hazards: Assessing Risk and Reducing Disaster, (6th Edn.). Abington: Routledge. doi: 10.4324/9780203805305
Worldometer (2021). COVID Live Update. Available online at: https://www.worldometers.info/coronavirus/?zarsrc=130 (accessed November 4, 2021).
Wu, L., and Brynjolfsson, E. (2015). “The future of prediction: how Google searches foreshadow housing prices and sales,” in Economic Analysis of the Digital Economy (Chicago, IL: University of Chicago Press), 89–118. doi: 10.7208/chicago/9780226206981.003.0003
Zarocostas, J. (2020). How to fight an infodemic. Lancet 395, 676. doi: 10.1016/S0140-6736(20)30461-X
Zhang, Z., and Tang, W. (2016). Analysis of spatial patterns of public attention on housing prices in Chinese cities: a web search engine approach. Appl. Geograp. 70, 68–81. doi: 10.1016/j.apgeog.2016.03.004
Zhu, D., Mishra, S. R., Han, X., and Santo, K. (2020). Social distancing in Latin America during the COVID-19 pandemic: an analysis using the Stringency Index and Google Community Mobility Reports. J. Travel Med. 27, taaa125. doi: 10.1093/jtm/taaa125
Keywords: risk communication, risk perception, public restlessness, COVID-19, Nigeria, Google Trends, Google Mobility Index
Citation: Lawal O (2022) Understanding Risk Communication Effectiveness From Public Interest, Mobility, and COVID-19 Cases: A Case Study of COVID-19 in Nigeria. Front. Commun. 7:921648. doi: 10.3389/fcomm.2022.921648
Received: 16 April 2022; Accepted: 14 June 2022;
Published: 08 July 2022.
Edited by:
Chioma Daisy Onyige, University of Bonn, GermanyReviewed by:
Douglas Ashwell, Massey University Business School, New ZealandLucia Velotti, John Jay College of Criminal Justice, United States
Copyright © 2022 Lawal. This is an open-access article distributed under the terms of the Creative Commons Attribution License (CC BY). The use, distribution or reproduction in other forums is permitted, provided the original author(s) and the copyright owner(s) are credited and that the original publication in this journal is cited, in accordance with accepted academic practice. No use, distribution or reproduction is permitted which does not comply with these terms.
*Correspondence: Olanrewaju Lawal, b2xhbGF3QGhvdG1haWwuY29t