 Carol J. Friedland1,2,3*
 Yong-Cheol Lee2
 Rubayet Bin Mostafiz1,3,4
 Jiyoung Lee5Shifat P. Mithila6
 Robert V. Rohli3,4
 Md Adilur Rahim1,7
 Ehab Gnan2Monica Teets Farris8
- 1LaHouse Resource Center, Department of Biological and Agricultural Engineering, Louisiana State University Agricultural Center, Baton Rouge, LA, United States
- 2Bert S. Turner Department of Construction Management, Louisiana State University, Baton Rouge, LA, United States
- 3Coastal Studies Institute, Louisiana State University, Baton Rouge, LA, United States
- 4Department of Oceanography and Coastal Sciences, College of the Coast and Environment, Louisiana State University, Baton Rouge, LA, United States
- 5Department of Geography and Anthropology, Louisiana State University, Baton Rouge, LA, United States
- 6Division of Computer Science and Engineering, School of Electrical Engineering and Computer Science, Louisiana State University, Baton Rouge, LA, United States
- 7Engineering Science Program, Louisiana State University, Baton Rouge, LA, United States
- 8Center for Hazards Assessment, Response and Technology, University of New Orleans, New Orleans, LA, United States
Freeboard—elevation of a structure above the base flood elevation (BFE)—is a critical component in mitigating or avoiding flood losses. However, the unrevealed benefits and savings of freeboard installation have prevented communities from adopting this approach. To improve decision-making for residents, prospective residents, and other stakeholders in flood-vulnerable communities and enhance flood risk mitigation strategies, this study presents the methodology underlying a new webtool, FloodSafeHome, that estimates comprehensively the economic benefits and savings of freeboard installation for new construction of residential buildings. Specifically, the proposed evaluation framework has been designed to calculate monthly savings for individual buildings by assessing freeboard cost, insurance savings per year, and expected annual flood loss. This new evaluation method is built into a web-based, decision-making tool for use by the public and community leaders in three southeastern Louisiana parishes (i.e., counties), to identify expected future benefits of building residences with freeboard and enhance their decision-making processes with interactive risk/benefit analysis features. For example, results indicate the levels of freeboard that optimize the cost-benefit ratio for flood-insured homes in the study area. This approach is expected to improve long-term flood resilience and provide cost-efficient flood mitigation strategies, particularly in disaster vulnerable regions.
1. Introduction
Flood is the most impactful natural disaster in the U.S. and continues to cause significant damage and losses (Doocy et al., 2013). Despite a suggestion that new development within the 100-year flood zone [i.e., special flood hazard area (SFHA; Al Assi et al., 2023a)] decreased nationwide (but with widely varying trends across space) between 2001 and 2011, an estimated 25.3 million people in the U.S. resided within the 100-year flood zone in 2011 (Qiang et al., 2017). Currently, average annual loss (AAL; Rahim et al., 2022a) is $13.2 and $19.1 billion within and outside the SFHA, respectively, and is projected to rise by 33.8% ($17.6 billion) and 21.2% ($23.1 billion) by 2050, respectively (Wing et al., 2022). The susceptible population faces increasing exposure to damage and losses from anticipated sea level rise and increased flood frequency and intensity due to the effects of climate change (Lin and Shullman, 2017; Xian et al., 2017).
To reduce flood risk in flood-prone areas, it is critical and urgent to provide optimized adaptation and mitigation strategies to vulnerable residents (Dewan, 2013). Previous studies indicate that adopting flood risk mitigation strategies is a sound financial investment with a benefit-cost ratio (BCR) of 5:1 when exceeding relevant provisions of model building codes (Multihazard Mitigation Council, 2017). One of the most effective and feasible approaches is raising the first-floor elevation (FFE). This additional height above the base flood elevation (BFE) is known as freeboard (Sharp, 2018; van Duin et al., 2021).
Even though the benefits of installing freeboard have been identified broadly, implementation has been hindered, in part because the lack of quantified financial benefits in relation to cost has dampened public demand for this mitigation practice. The evaluation process requires consideration of the many economic aspects that vary by environment and individually-customized requirements for each building project. However, such a comprehensive approach has rarely been available to the public, particularly for flood-prone communities. Even in the absence of such detailed information, the need for providing stakeholders and practitioners with the best actionable information available for more robust flood risk assessment requires advances in freeboard benefit estimates (Mostafiz et al., 2022a).
In addition, communication about the benefits of freeboard is hindered by the lack of a suitable web-based decision-making tool (to the best knowledge of the authors) that helps the public access freely and evaluate flexibly the customized levels and optimized financial benefits of freeboard. This concern is complicated by the fact that different users have distinct perspectives regarding the financial costs and benefits of freeboard. While tenants have little influence in decision-making regarding freeboard implementation as homeowners do, they play an indirect role in that they must take into consideration safety from the flood hazard when they choose their residence. Moreover, tenants are vulnerable to content-related flood losses. Landlords, by contrast, are generally immune to content-related flood losses but are vulnerable to building-related losses. Community leaders may be affected only indirectly by either type of loss but are likely to be most concerned about resilience at the neighborhood scale. Communications between the leaders and other resilience stakeholders are affected by their widely-ranging perceptions of the role of citizens in flood risk management (Wehn et al., 2015).
Several web portals provide decision-making tools that include flood risk, expected frequency of events, and management strategies, which are generally applicable to broad areas but fail to provide customized detailed financial benefits for the various stakeholders. Such portals may include static risk representation features that are not customizable to user-defined roles, preferences, and location and/or include jargon and contextual language that can be an obstacle for the public to understand and utilize. Moreover, the tone of the message in communicating risk seems to be important, as Poussin et al. (2014) found that encouragement via coping rather than discouragement via threats seem to have the better impact on flood mitigation behavior. Thus, an intuitive web-based, flood risk and freeboard decision-making portal with robust features for analyzing customized flood risk and freeboard financial benefits is needed to encourage homeowners, tenants, landlords, developers, insurance adjusters, community leaders, and other stakeholders to understand flood information easily and take needed action for flood mitigation promptly, at the individual building level (Mostafiz et al., 2022a). These barriers have continued to impede resilience to the flood hazard.
To ameliorate these identified gaps, the overarching goal of this study is to establish a web-based, decision-making system that suggests the most cost-efficient freeboard height for mitigating future flood risk to residential buildings for new construction. The proposed method is designed to estimate freeboard savings under various future scenarios by considering relevant variables including freeboard cost, flood risk, and insurance, with results freely and instantaneously available.
2. Literature review
Quantification of flood risk by identifying the optimized mitigation measures and providing appropriate information to stakeholders is a fundamental baseline for flood risk management (De Risi et al., 2018). Benefit-cost analysis (BCA; Al Assi et al., 2023b) is a common method to identify the best choice between multiple options. It compares each option's expected financial benefits and cost with current “no-action” scenario (Zarekarizi et al., 2020). While the cost of adding freeboard is often modest, the lifetime savings on flood insurance premiums and the benefits of prevented flood losses, as revealed by life-cycle benefit-cost analysis (LCBCA), can be substantial (Gnan et al., 2022a). Other life-cycle benefits of freeboard implementation include reduced suffering, faster recovery, increased building value, and enhanced individual and/or community resilience (Gnan et al., 2022a). In addition, life is protected and rental cost during displacement is avoided (Xian et al., 2017). In terms of freeboard decision making processes, few studies focus on developing frameworks to estimate the optimal freeboard for single-family homes and analyze the home elevation decision (e.g., Xian et al., 2017; Zarekarizi et al., 2020). While these studies represent a significant step forward, they only considered either premium savings or flood reduction in their decision criteria. The inclusion of both flood reduction and premium savings allows for better evaluation of freeboard financial benefits (FEMA, 2008).
Previous studies and currently operational web portals collect and provide diverse flood-related information from/to the public. Li et al. (2006) implemented a web-based flood forecasting system (WFFS) for the Shuangpai region in China to help hydrologists and other engineers to make more-informed decisions. By using the WFFS, hydrologists in China can reduce the processing time by circumventing manual calculation in traditional flood forecasting, and the tool aims to reduce the data analysis and processing time for providing flood forecasting information rapidly. This tool also uses a real-time flow model and provides alternatives for authorized users, so decision makers can choose an ideal option by comparing their pros and cons. Holz et al. (2006) created a web-based flood management system for water level observation using artificial neural network (ANN) models. Users can explore a real-time web portal and receive SMS and email of flood warning from the system. The Victorian flood web portal, targeting the Victoria area in Australia, collects information about the demands and the possible benefits from potential users of their website based on telephone survey and provides relevant flood risk and mitigation information on the website before, during, and after a flood event (Molino, 2009). The Flood Information System (FIS) for the Somesul Mare area in Romania (Almoradie et al., 2013) supports the following three features: flood risk management (FRM) awareness, flood information, and public participation. The advantages of this tool include enhancement of flood risk management, reduced costs of process, and shared information among different stakeholders (Almoradie et al., 2013). Khalid and Ferreira (2020) generated a web-based, real-time, flood prediction tool for the Chesapeake Bay area. This tool is well-organized and designed to incorporate a variety of resources, such as wave level guidance systems, storm surge and wave prediction models, hydrodynamic models, extreme weather forecasts, and ensemble forecasts.
Several other websites show potential for providing flood risk data and mitigation strategies to flood-prone residents (Figure 1). Flood Factor (https://floodfactor.com/) is a free online website tool that helps Americans find past-to-future flood risk generated by the First Street Foundation. Using this tool, the public can acquire a variety of static information regarding generalized flood risk. Iowa Flood Information System (IFIS), created at the Iowa Flood Center (IFC) at the University of Iowa (https://ifis.iowafloodcenter.org/ifis/app/), is also a free, one-stop, online tool for providing community-based flood conditions, forecasts, inundation maps, and flood-related information. This website not only explains how to use the tool on the website using text and photos, but also provides a video guide to enhance the user's understanding of the tool. However, since this tool provides information on a broad and large area, there is a considerable limitation in that users cannot obtain detailed information customized to a specific area. Aqueduct Flood (https://www.wri.org/applications/aqueduct/floods/) is a free online data platform that helps governments, companies, and the public understand flood risk in coastal and riverine areas, and conducts a BCA of the flood protection investment. This tool provides important information including annual total cost vs. benefits, cumulative net benefits, cumulative maintenance costs, and evolution of flood protection. However, the portal does not output personalized information because it is designed to provide a community-level based analysis report. U.S. Flood Inundation Map Repository (USFIMR, https://sdml.ua.edu/usfimr/) and Global Flood Inundation Map Repository (GloFIMR, https://sdml.ua.edu/glofimr/) have been created at the University of Alabama to provide historical inundation extent maps. These portals also provide general historical flood information and inundation maps with interaction features with maps, but customized flood and adaptation information are not provided. In addition, various studies on flood monitoring have been conducted for large study areas such as countries (Limlahapun and Fukui, 2009), states (Sunkpho and Oottamakorn, 2011), rivers (Hagemeier-Klose and Wagner, 2009; Mure-Ravaud et al., 2016), and reservoirs (Ghobadi and Kaboli, 2020). However, to date, a product that facilitates the freeboard decision-making process at the individual building level has not yet been developed.
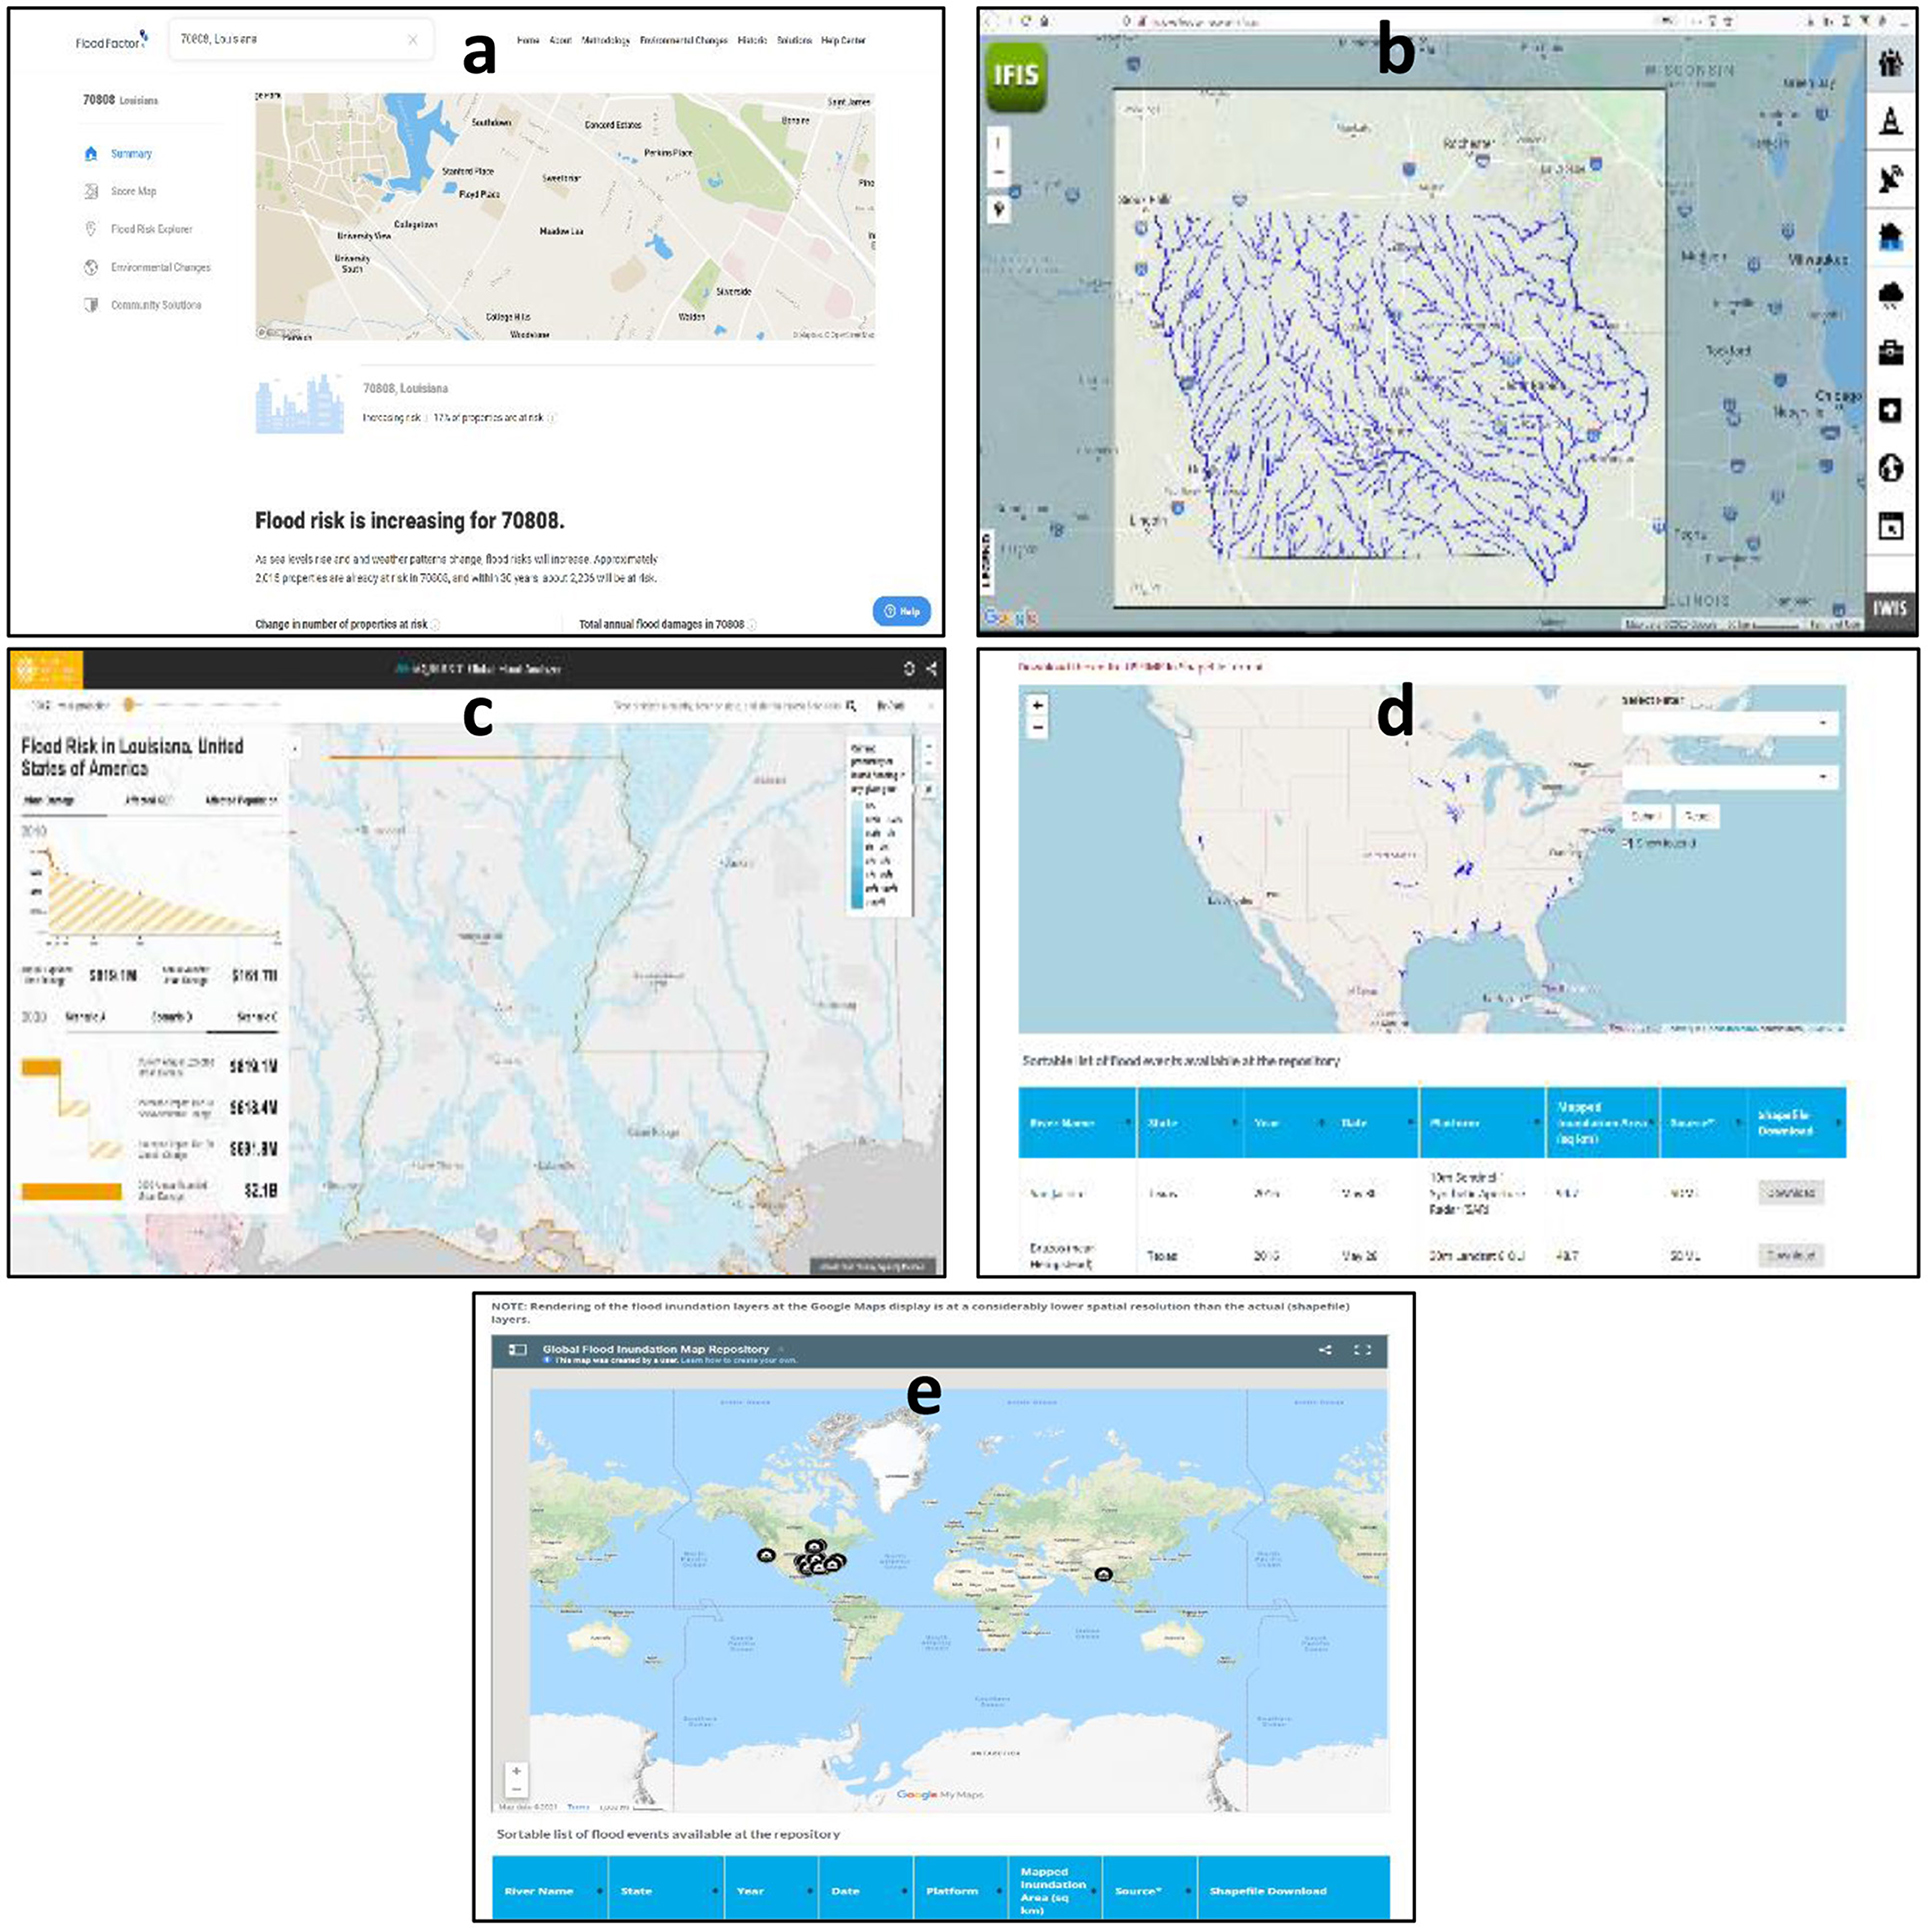
Figure 1. Existing free online tools for flood website. From top left to bottom right: (a) Flood Factor, (b) Iowa Flood Information System, (c) Aqueduct Flood, (d) U.S. Flood Inundation Map Repository, and (e) Global Flood Inundation Map Repository.
3. Methodology
3.1. Freeboard benefits and savings
The methodology identifies the optimal freeboard height based on the maximum (monthly) savings by calculating costs and benefits of increasing freeboard using building attributes, user insurance coverage and deductible selection, and local flood hazard characteristics as inputs. Figure 2 presents the conceptual framework and data/analysis flows of the cost-benefit optimization approach for individuals.
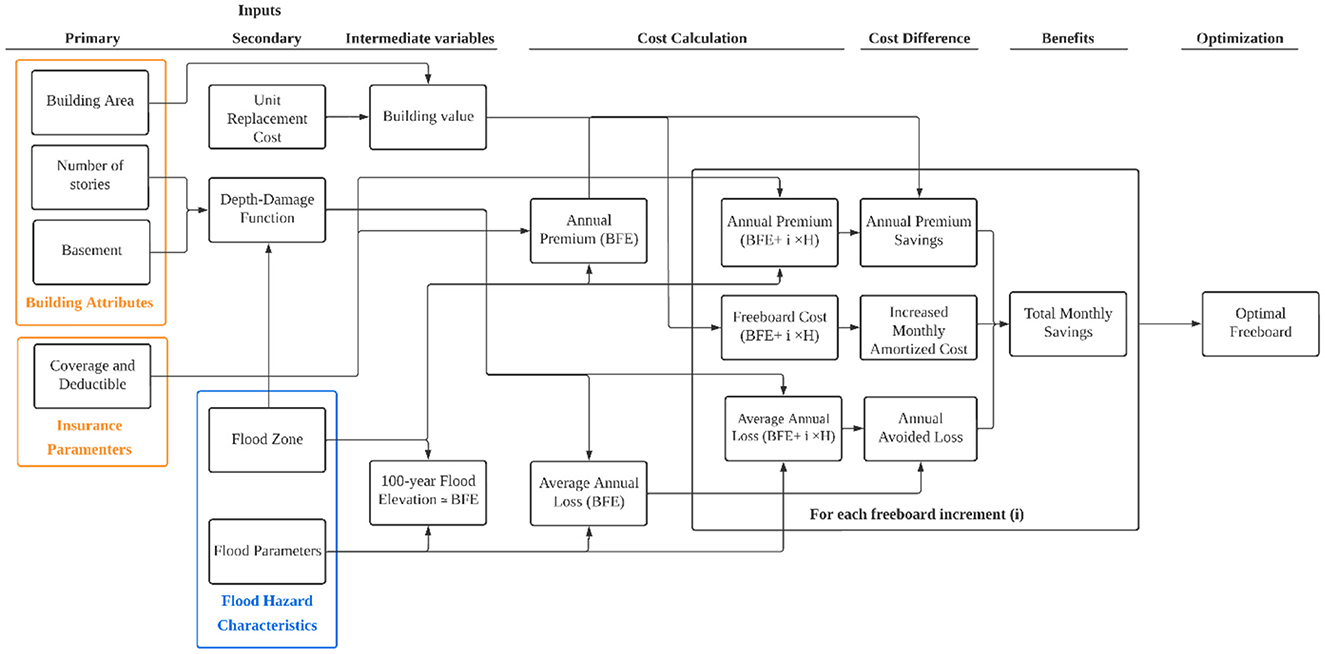
Figure 2. The developed methodological approach.
3.1.1. Inputs
Three input types are used in the methodology: building attributes, insurance parameters, and local flood hazard characteristics. The input data sources are of two types: primary, which is provided by the user, and secondary, which is taken from external sources. The specific input type and data sources are described in the following paragraphs.
3.1.1.1. Building attributes
Building area (A), unit replacement cost (CR), number of stories, and presence/absence of basement are the building specific attributes. The A is the total enclosed livable space, which will be provided by the user. The CR is the local average unit cost for constructing a new home (Doheny, 2021). The building value of interest is the replacement construction value (VR, in USD), calculated as the product of A and CR (in USD) for single-family construction (Equation 1). The user is also prompted for the number of stories (integer) and basement (yes/no).
3.1.1.2. Insurance parameters
The insurance coverage and deductible are the user-defined insurance parameters used to calculate the annual insurance premium by flood zone, freeboard height, and community rating system (CRS). To calculate insurance coverage and deductible, the authors utilized generic guidelines of building insurance coverage defined by National Flood Insurance Program (NFIP) Flood Insurance Manual (FEMA, 2021). For single-family homes, $60,000 and $25,000 are the basic building and contents coverages, respectively, with limits of $250,000 for the building and $100,000 for its contents (FEMA, 2021). The minimum deductible is $1,000 for coverage up to $100,000 and $1,250 for coverage over $100,000, and the maximum deductible is $10,000, for building and contents separately (FEMA, 2021).
3.1.1.3. Flood hazard characteristics
Flood zone and parameters are the factors defined from external sources that represent the local flood hazard characteristics. Flood zones are the geographic areas defined by FEMA according to the level of flood risk (Al Assi et al., 2022). Flood parameters are the site-specific location (u) and scale (α) parameters that define the Gumbel extreme value distribution function (Mostafiz et al., 2021a, 2022b; Rahim et al., 2021; Mostafiz, 2022). BFE is taken as the expected depth of the 1% annual chance flood (i.e., 100-year flood), where the FFE or first-floor height (FFH) is generally located (FEMA, 2008). FFE is the elevation of the top of finished floor for A-Zone homes and the bottom of the lowest horizontal structural member for V-Zone homes (Jones et al., 2006; FEMA, 2008). Depth-damage functions (DDFs), which represent the relationship between flood depth above the FFH and percent of damage as a function of the VR, used in the flood loss calculation vary for building attributes (i.e., number of stories, presence of basement) and flood zone (Mostafiz et al., 2021b,c).
3.1.1.4. Freeboard scenarios
Freeboard is the additional height of construction above BFE, which is the basic parameter for the optimization process. Freeboard scenario (Fi) is defined as the FFE corresponding to freeboard height i.
3.1.2. Cost calculation
3.1.2.1. Insurance premium
Annual flood insurance premiums for each scenario are calculated based on the rate tables of post-FIRM construction for single-family homes from the NFIP Flood Insurance Manual (FEMA, 2021). Basic coverage rates for building and contents are applied to every $100 of the basic building and contents coverage limits; separate additional rates for building and contents are used for every $100 of additional coverages.
For each scenario, the total building basic insurance premium (GbB) is the basic coverage limit (PbB) for the building multiplied by its basic rate (RbB). Total additional insurance premium for the building (GaB) is the additional coverage amount (PaB) multiplied by the building additional rate (RaB).
For PbB <= $60,000;
for $60,000< PbB <= $250,000,
Total contents basic insurance premium (GbCt) is the basic coverage limit (PLCt) for contents multiplied by its basic rate RbCt. Total additional insurance premium for contents (GaCt) is the additional coverage amount (Pact) multiplied by the contents additional rate (RaCt). For PLCt <= $25,000,
For $25, 000 < PLCt < =$100,000,
GbB is added to GaB and GbCt is added to GaCt to calculate the principal premium (PPL).
PPL is multiplied by the deductible factor d (FEMA, 2021) for the chosen deductible to obtain the deducted premium (Pd).
According to FEMA (2021), the annual premium is calculated as follows: The calculated Pd is added to the Increased Cost of Compliance (ICC) premium, then reduced by the CRS discount. The Reserve Fund Assessment (RFA) percentage is added to the total premium after the ICC premium and CRS premium discount have been calculated. The Homeowner Flood Insurance Affordability Act of 2014 (HFIAA) surcharge and federal policy fee (FPF) are added to determine the total annual premium (P, in USD).
3.1.2.2. Construction cost of freeboard
The cost of freeboard construction is estimated by multiplying the VR by an incremental cost factor (Ci) that varies with flood zone (i.e., V-zone, Coastal A-zone, and A-zone) and freeboard heights (FEMA, 2008). Freeboard cost is calculated as:
where Fci is the cost of freeboard (in USD) corresponding to height i.
3.1.2.3. Average annual loss (AAL)
AAL is the average expected flood loss over a long period of time. It is calculated by integrating the DDF over the range of flood probabilities (P; Quinn et al., 2019; Gnan et al., 2022b; Rahim et al., 2022b). For a given building, AALB%and AALC% represent the building and content losses, respectively, in percent of home replacement cost value (VR). The AALuse, months represents the loss (Luse) for the restoration time.
where
I is the initiation point of the DDF with respect to FFH. As an example, the value of I will be −2 feet for the building and 0 feet for the contents in the USACE (2000) DDF.
AALB$, AALC$, and AALuse$ are the losses in absolute currency for building, contents, and restoration time, respectively, which vary with occupant types (i.e. owner-occupant, landlord, and tenant; Gnan et al., 2022c). AALT is the total loss, which is the summation of AALB$, AALC$, and AALuse$. For owner-occupants and landlords, the AALuse$ is calculated based on AALuse, months and rent loss (Rl) during the repair time (to renovate the home). Rl is calculated by assuming that 1 year of rent is equal to one-seventh of VR (Amoroso and Fennell, 2008). For tenants, AALuse$ is calculated based on AALuse, months and per night hotel rent (HR) for D days (i.e., to rent a new home), as described by Mostafiz et al. (2022c) and (Al Assi et al., 2023c).
Owner-occupant:
Landlord:
Tenant:
3.1.3. Cost-benefit analysis
3.1.3.1. Annual premium savings
Annual premium savings (PSFi) is the reduction in premiums as the result of the lower flood risk when increasing the elevation. For each i, the PSFi is the difference between the annual premium for the “at BFE no action” scenario (PN) and the annual premium of the freeboard (PFi), or
3.1.3.2. Monthly amortized freeboard cost
The amortized freeboard cost is the expected additional periodic loan payment of the freeboard cost, which will be part of the amortized new construction mortgage. The freeboard cost (Fci, in USD) is used as additional loan principal to calculate the monthly payment Fcp, where r is the interest rate, n is the number of payments per year, and t is the loan term in years. The resulting additional principal monthly payment Fcp is added to the monthly loan fees Lf to obtain the total freeboard monthly loan payment Fcm.
3.1.3.3. Avoided annual loss
Avoided annual loss is the avoided expected annual flood loss as the result of increasing the home elevation. For each freeboard scenario (i), the annual avoided loss (ALFi) is difference between the AAL of the “at BFE no action” scenario (AALN) and the AAL of the freeboard scenario (AALFi), or
3.1.3.4. Total monthly savings
Total monthly savings provides the expected monthly savings when adding the freeboard. For each freeboard scenario Fi, the monthly total savings (SMFi) is the freeboard cost monthly payment (Fcmi) subtracted from the sum of the monthly premium savings of the freeboard and its monthly avoided flood loss, or
3.1.4. Optimization
Financial benefits are assessed for freeboard scenarios (Fi) to determine the optimal freeboard (Fioptimal) that yields the maximum SMFi.
3.2. Web-based, decision-making tool
The development procedure of a web-based, decision-making tool consists of front-end and back-end development (Figure 3). While the front-end, often known as “client-side,” development focuses on what users virtually see on their browser or application, the back-end makes the website function. Although the two parts and their operations are considerably different from each other, they must communicate with each other seamlessly and operate as a single unit to maintain and improve the website's functionalities for calculating freeboard benefits and providing optimized freeboard heights.
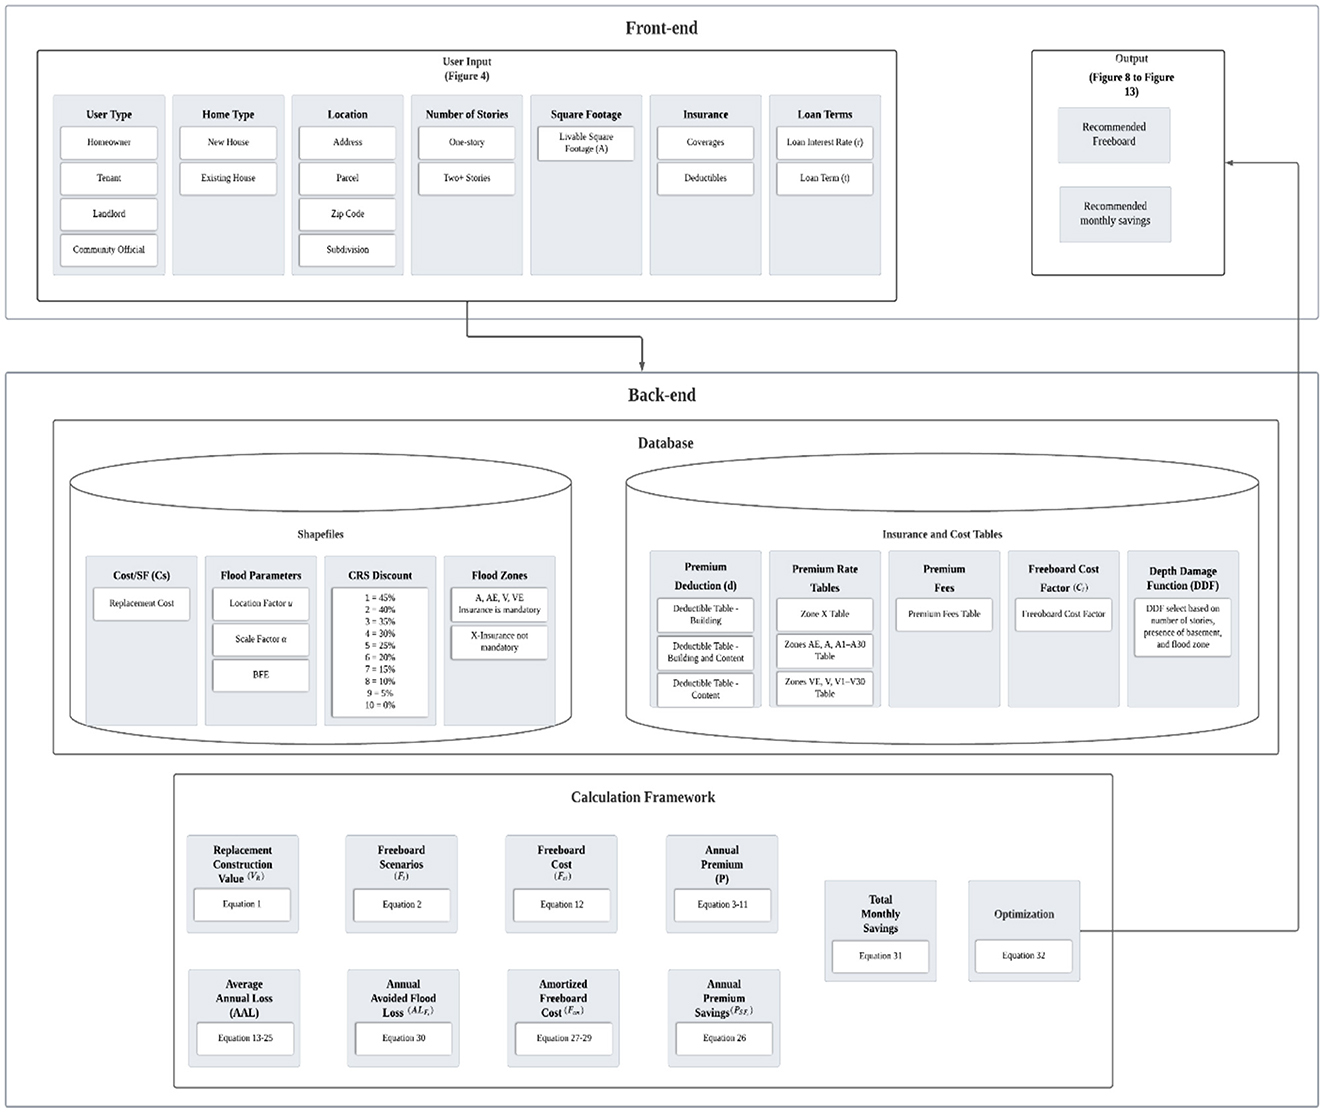
Figure 3. Front-end and back-end relationship (https://floodsafehome.lsu.edu/).
3.2.1. Back-end system
A back-end system is the “server side” of a web development that maintains the communication between a database and a browser. Users are not allowed to access or interact with this portion of the software directly but have indirect access through the front-end applications. The multiple reasons that building a decision-making tool needs back-end support generally include hosting purposes, central data access, privacy and security, integration, resource constraints, and resource cost distribution. These functionalities are essential for establishing a large-scale freeboard-related dataset, maintaining users' analysis information, storing freeboard estimate information, and disseminating the decision-making system to the public. Our goal is to have an optimized back-end system so that this project facilitates the complicated calculation processes of multiple freeboard-related components and provides the outcomes without latency, while enabling users to access the webtool freely by using a computer or mobile device.
Django, which is a python programming language-based web-framework, was used for webtool development. This open-source tool follows a model-template-view architectural pattern, has an automated and secure admin interface, and uses its own database management tools depending on the functional needs. For database management, this webtool uses PostgreSQL to handle spatially-enabled data and GeoDjango to build geographic information systems (GIS; Kawamura et al., 2014) web applications. The decision-making tool provides information about flood risk and freeboard financial benefits, which is analyzed based on location. This location information is used to retrieve particular parameters for flood risk and cost analyses, and the database is updated in the admin panel of Django to make the query time-efficient and the web development hassle-free. The built database has several fields for this webtool: address, street, flood zone, zip code, latitude, longitude, parish, number of floors, and site-specific flood hazard location parameter (i.e., u-intercept) and scale parameter (i.e., α –slope). When the user inputs an address or street information, a query in the database on the back-end retrieves the location information that best matches with the input. Then, it selects the flood zone, parish, number of floors, u-intercept, and α-slope information of that location from the database. This information and other user inputs such as square footage and number of stories are used to calculate the necessary function values using the methodology described in Section 3.1.2. All the methods from Section 3.1. are exclusively coded in the rootApp/views.py file where rootApp is the Django application of the website. Figure 3 depicts the communication and relationship between the front-end, server-side back-end, and database exclusively.
This web portal supports diverse advanced features including “autocomplete,” display of error messages, interactive help center page, and presentation of optimal results implemented in the webtool to enhance user friendliness. The “autocomplete” feature is done with jquery autocomplete, which can search for addresses in the database that begin with a input by the user. For example, if the user inputs 1, it will give suggestions that start with 1, such as 112.., 122.., 162.., 183…, then if the next number the user types is 5, it will give suggestions that start with 15, that is, 154.., 155.., 157… etc. In a similar way, street names are suggested, with suggestions that contain user input street values shown. For example, if the user types a “y” for the street, suggestions of the street values that contain the word “y” will be returned, such as “YANNI DR,” “YOSEMITE ST,” “OLYMPIC ST,” etc. To minimize the search time through the large database, the system shows the first 10 matching queries. In the error messages feature, if the user search does not match the database queries, a result will show as a json response “no results found” from the autocomplete feature. For cases in which users input an incorrect address/input and hit “submit,” the error message “Enter a valid address!” is returned. For the community level analysis, user is allowed to choose several addresses instead of one or a parcel number. In the back-end, the list of addresses is obtained from the search, and for each of these addresses, a query is made in the database to extract the necessary information. Then, the calculation is performed according to the methodology, and the output is sent to the front-end in the form of a dictionary to visualize in the interface.
3.2.2. Front-end system
A front-end system is the “client-side” of an interface with which the user interacts with the input box, buttons, service, and features. Through this interface, the user can easily explore information and request analysis of the database in the back-end server. Hypertext Markup Language (HTML), Cascading Style Sheets (CSS), and JavaScript are the main languages for the front-end system. HTML is used to build the basic structure, with CSS styling the website, and then JavaScript is used to manipulate and validate the data as well as update HTML and CSS. The main goal of the front-end system is to implement a user-friendly and an interactive decision-making tool. Specifically, the public can easily identify expected future financial benefits from installing freeboard in their homes and make risk-informed decisions within Jefferson, St. Tammany, and Terrebonne parishes (i.e., counties) in Louisiana.
To tackle the current challenge in obtaining customized flood risk and optimal freeboard height information, the proposed FloodSafeHome tool allows users to enter their building information and obtain a customized freeboard cost analysis evaluated based on their preferences and demands. The “Building information” form in the tool solicits the user type (homeowner, tenant, landlord, or community official), the building type (a new building), the address of the building, the square footage, and the number of stories from users, and returns synthesized information responsive to their input. Addresses or parcel IDs are filled out automatically based on the back-end server. This front-end information contributes to filling the gap between user's needs and information of new residential developments. The customized freeboard analysis report includes an interactive web-based map, monthly savings, monthly freeboard cost, monthly insurance premium savings, and monthly savings from flood loss reduction.
To facilitate users' interactions with the system, the authors have developed the interactive web-based map using leaflet (Figure 4). Based on the searched address, the location will be shown on the map. The interactive web-based map provides dynamic zoom in/out with dynamic scale and pops up the address information when the user clicks on a specific location on the map. Once the user obtains the tailored report, the searched address will appear on the map as a point icon, and the user sees the flood zone information by clicking the icon. A point-based building shapefile (labeled as “address”) is provided by the Jefferson Parish Department of Floodplain Management and Hazard Mitigation, Terrebonne Parish Consolidated Government, and St. Tammany Parish Government.
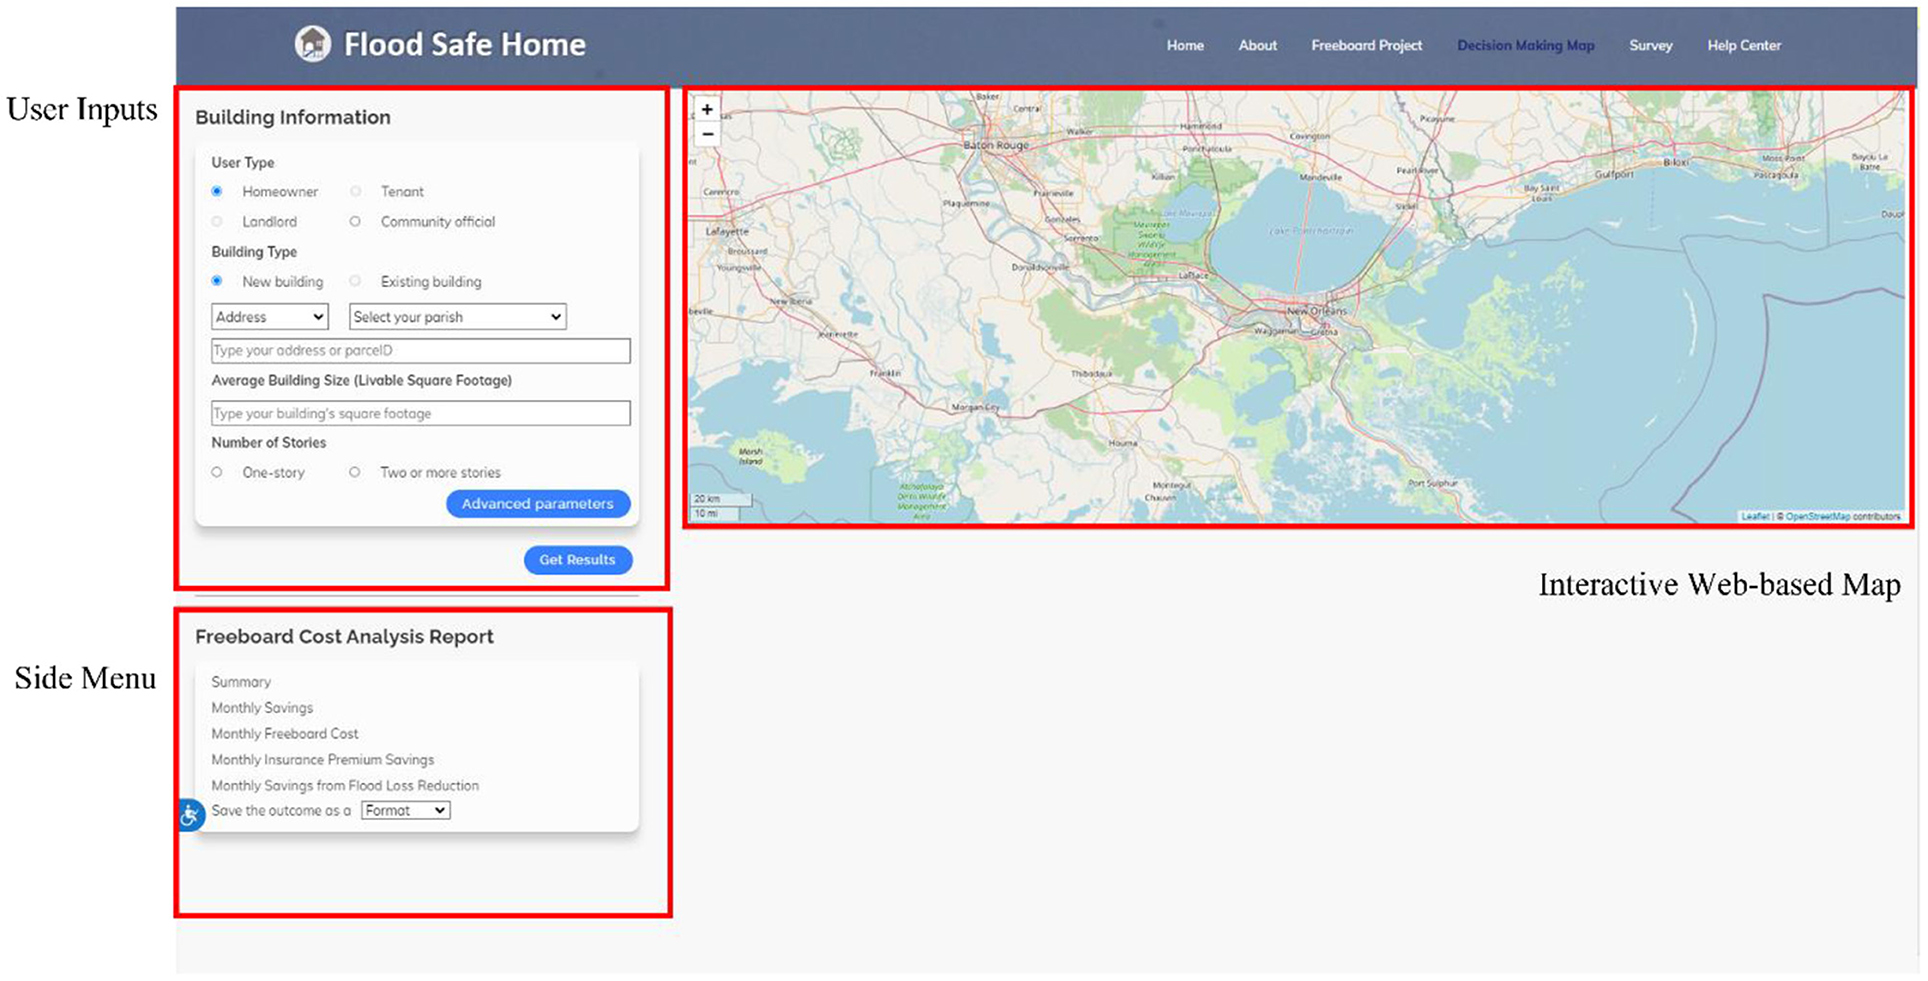
Figure 4. Initial interface of the decision-making tool; information about user type, building type, address(es), average building size, and number of stories is obtained through the user and is then synthesized in the tailored report.
The calculated freeboard financial benefits and suggested freeboard level identified based on the greatest monthly savings amount are represented in the customized freeboard cost analysis report. The first part of the customized report summarizes the freeboard analysis and provides optimal freeboard height based on monthly savings. In addition to suggesting an optimal freeboard height, multiple results according to various scenarios of freeboard construction from one to four feet are provided. The interactive feature allows the slide to move, so that users can explore savings, costs, and total savings from mitigation, cost of mitigation, and total monthly savings for different freeboard level scenarios. Rather than simply providing detailed information in text format, this system also provides both chart and text descriptions to the users so they can understand and follow the analyses easily. Based on the estimate methodologies of freeboard financial benefits mentioned above, the calculated values from Python in the back-end server are returned to JavaScript in the front-end server and then visualized in a ZingChart API application programming interface (https://www.zingchart.com/) to represent all charts. Users can check the value of each graph when they hover a mouse above the graph and easily navigate the report by using the side menu. The tool also contains various user-friendly functions: a disclaimer (Figure 5), a quick tour guide (Figure 6), a web accessibility solution for Automated Web Accessibility (ADA) and Web Content Accessibility Guidelines (WCAG) compliance, as well as a navigation menu. Web accessibility solution for ADA and WCAG compliance is supported by EqualWeb (https://www.equalweb.com/) with twelve features, including a text reader, magnifier, color adjustment, content adjustment, highlighting headers and links, and more.
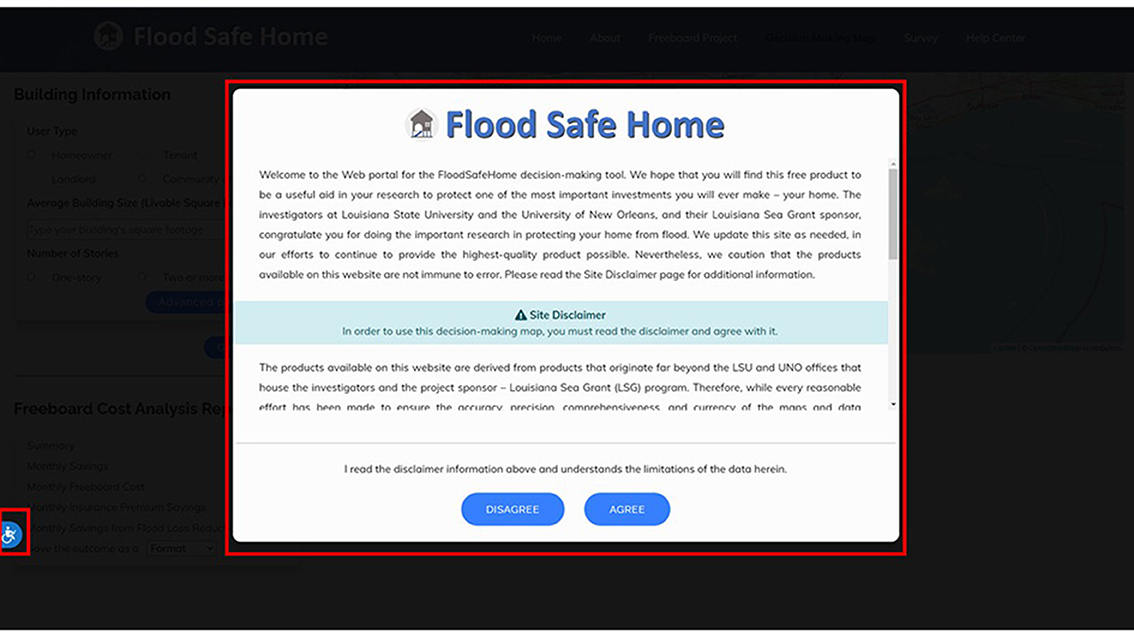
Figure 5. The decision-making tool with disclaimer and ADA compliance.
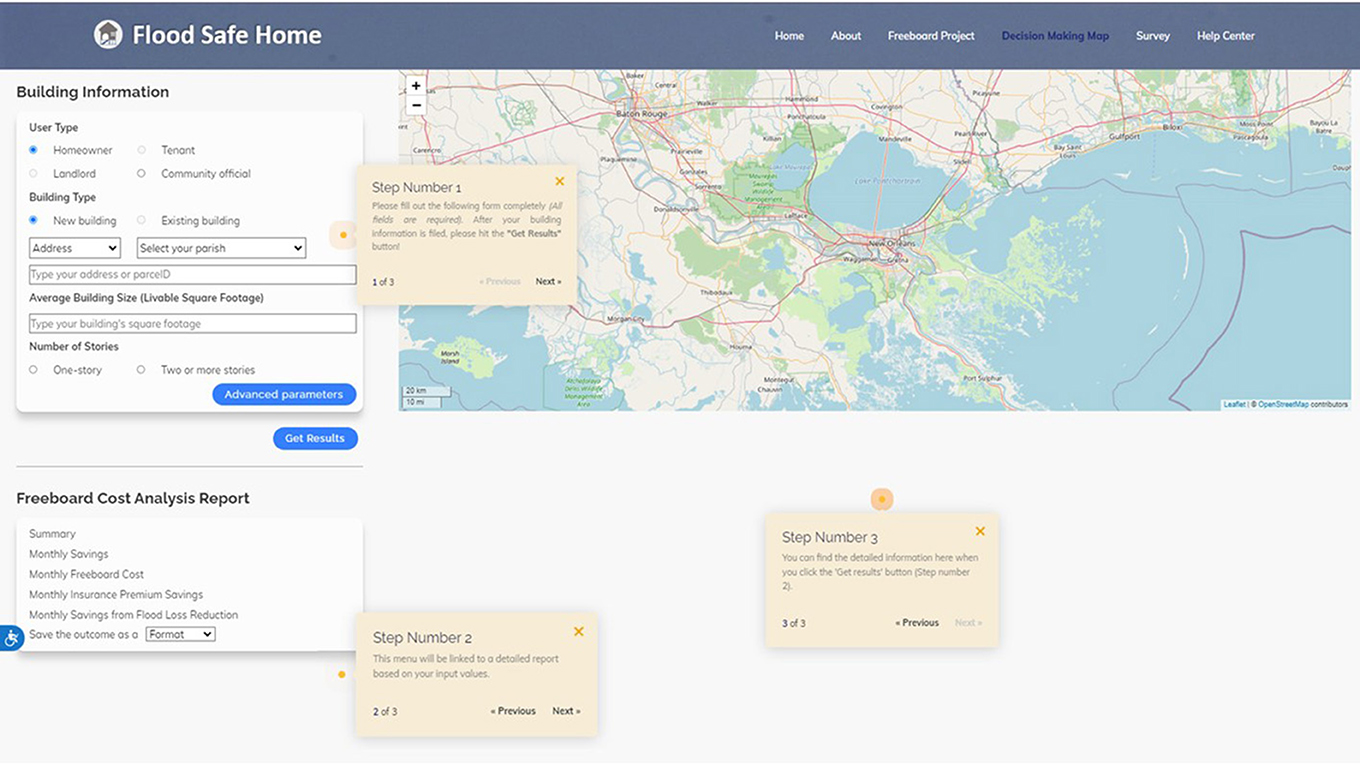
Figure 6. Quick tour guide which provides three steps showing how user can use this tool.
4. Implementation of the decision-making tool and analysis report
This section describes the developed features of the web-based decision-making tool and the detailed analyses of the customized report. In addition, case studies and their implementations are included to show the functionalities and implications of the developed web-based decision-making tool.
4.1. General building information
As shown in Figure 7, a user can input the building type, address, square footage, and number of stories necessary for analyses. Because of space limitations, output is displayed only from the perspective of a homeowner, who is vulnerable to both building and content losses. To calculate one building's freeboard financial benefits, the “Homeowner” user type is selected, the “new building” option is defined, the address, “129 <Street Name> PL, Kenner, 70065, LA” is used, “2000” is specified for square footage, and “one–story” building is chosen. In addition, other parameters are automatically selected: building and contents coverage and deductibles. To calculate the building value, the square footage input from the user is multiplied by CR (Doheny, 2021) of the single-family residence in that area determined using a zip code-wide construction cost shapefile. The minimum deductible used is $1,000 for both building and contents if the building coverage is equal to or <$100,000, and a $1,250 minimum deductible is used if the building coverage exceeds $100,000. Annual flood premiums are estimated based on the total estimated building value. However, users have the option to select different deductibles and coverages.
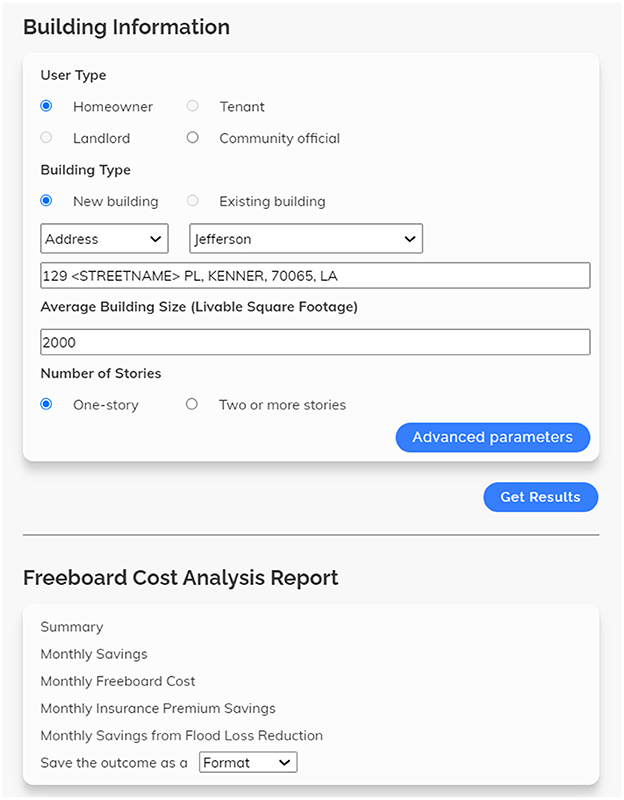
Figure 7. Basic user interface for the building information.
4.2. Freeboard cost analysis report
Figure 8 shows the freeboard cost analysis report, including summary, monthly savings, monthly freeboard cost, monthly insurance premiums savings, and monthly savings from flood loss reduction. The report provides calculation results based on user inputs and flood zones. The following sections illustrate the freeboard cost analysis report (Figures 8–13) generated based on the user input (Figure 7). Graphs are created using the ZingChart library (Figures 10–13), and name and value information of the corresponding graph are found by placing the mouse cursor on the bar chart. Charts can be downloaded as PDF, SVG, CSV, or XLS by clicking the right mouse button.
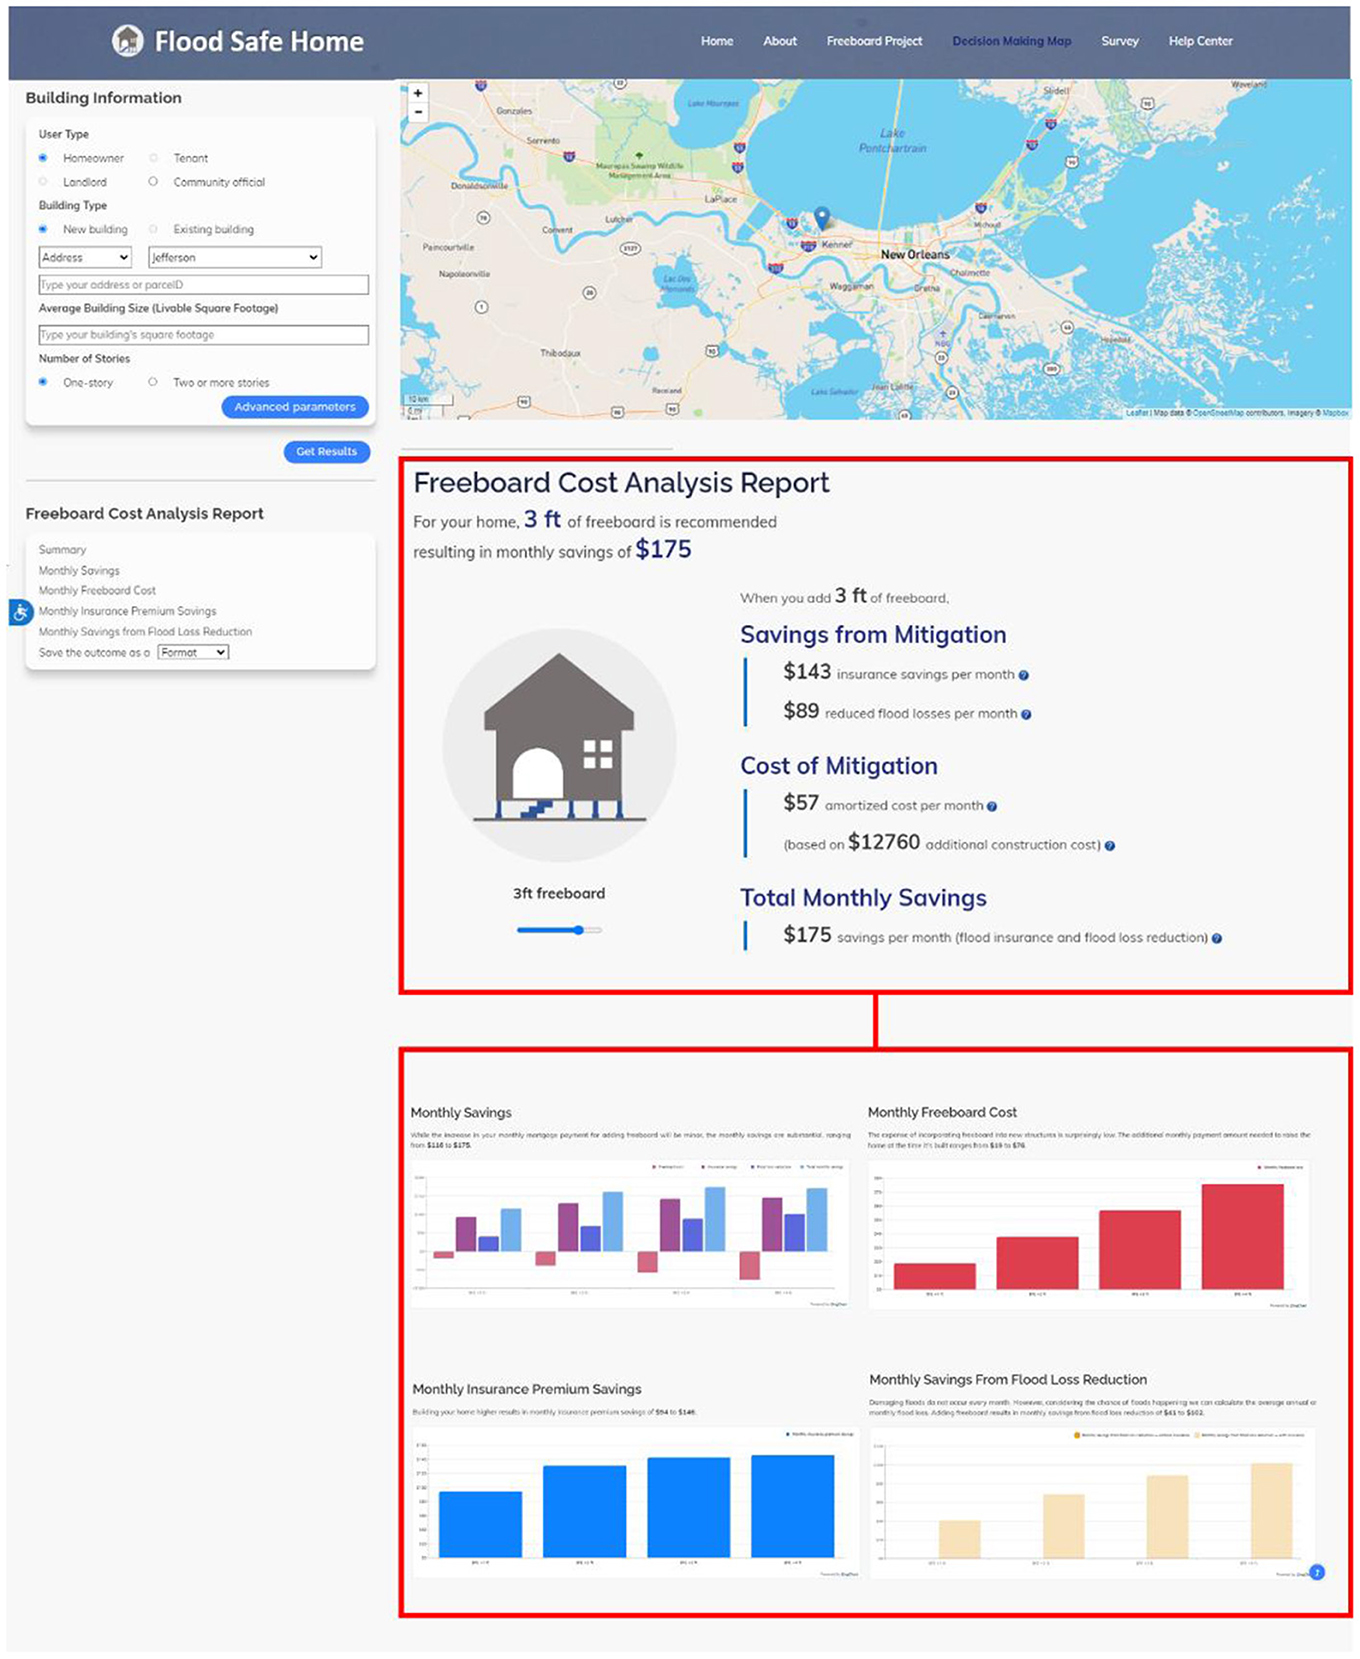
Figure 8. Freeboard cost analysis report, including summary, monthly savings, monthly freeboard cost, monthly insurance premiums savings, and monthly savings from flood loss reduction.
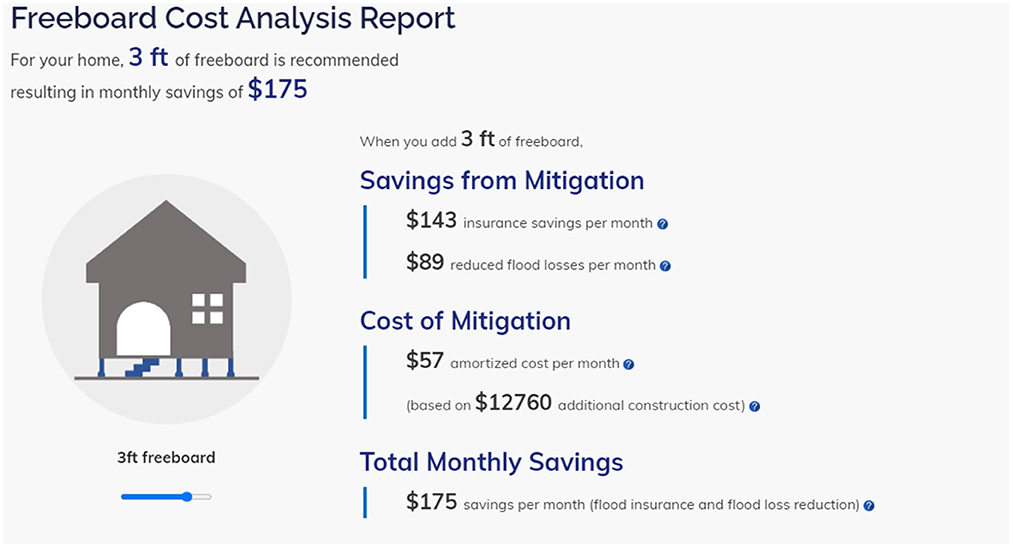
Figure 9. Summary of analysis report. In this report, total monthly savings is $175, and 3 ft of freeboard is recommended.
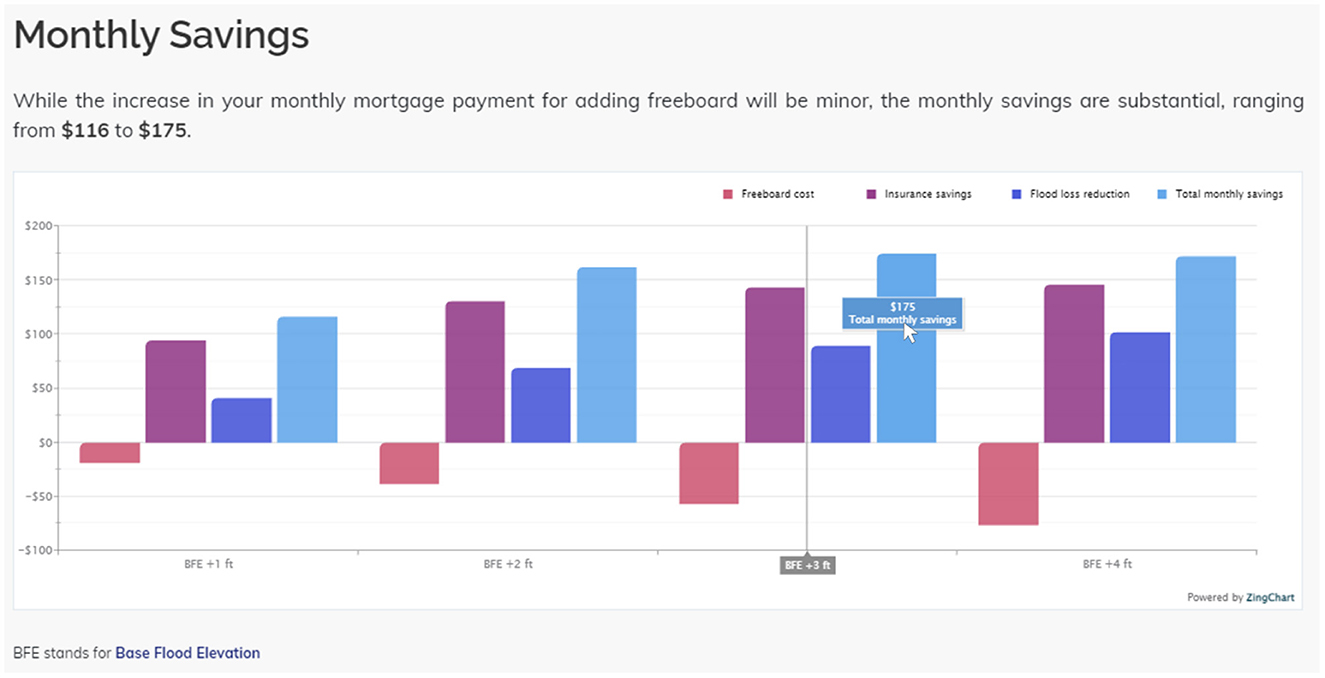
Figure 10. A monthly savings graph with freeboard cost, insurance savings, flood loss reduction, and total monthly savings.
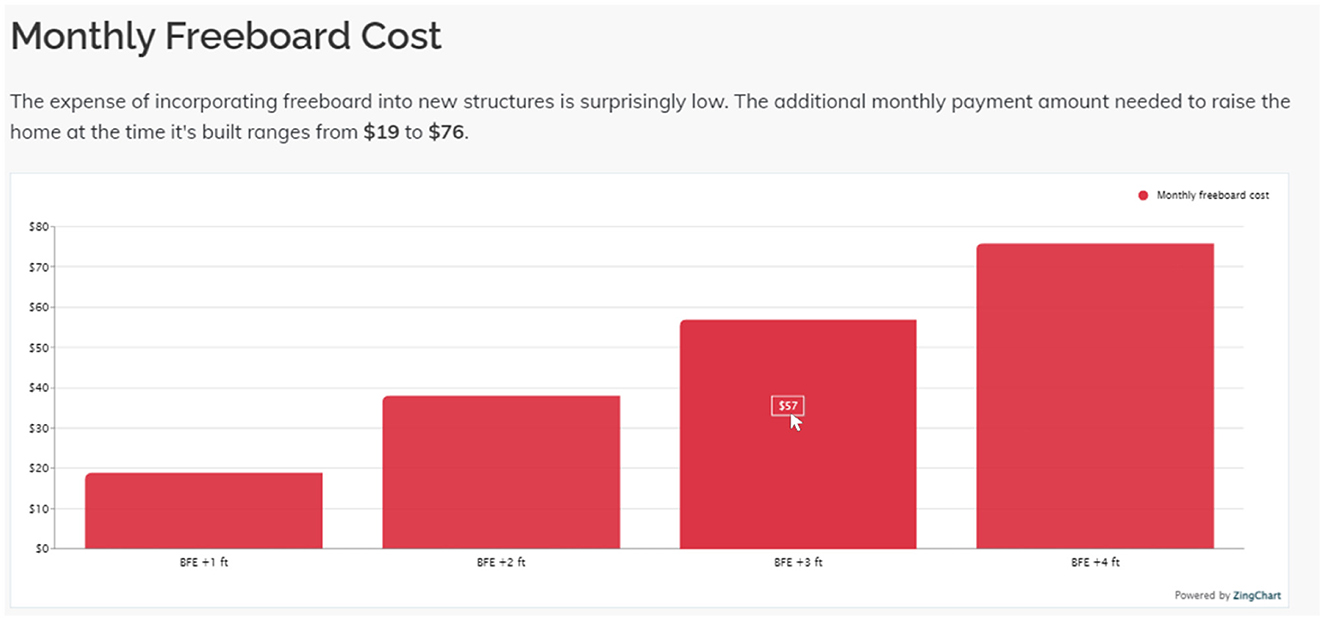
Figure 11. Monthly freeboard cost graph.
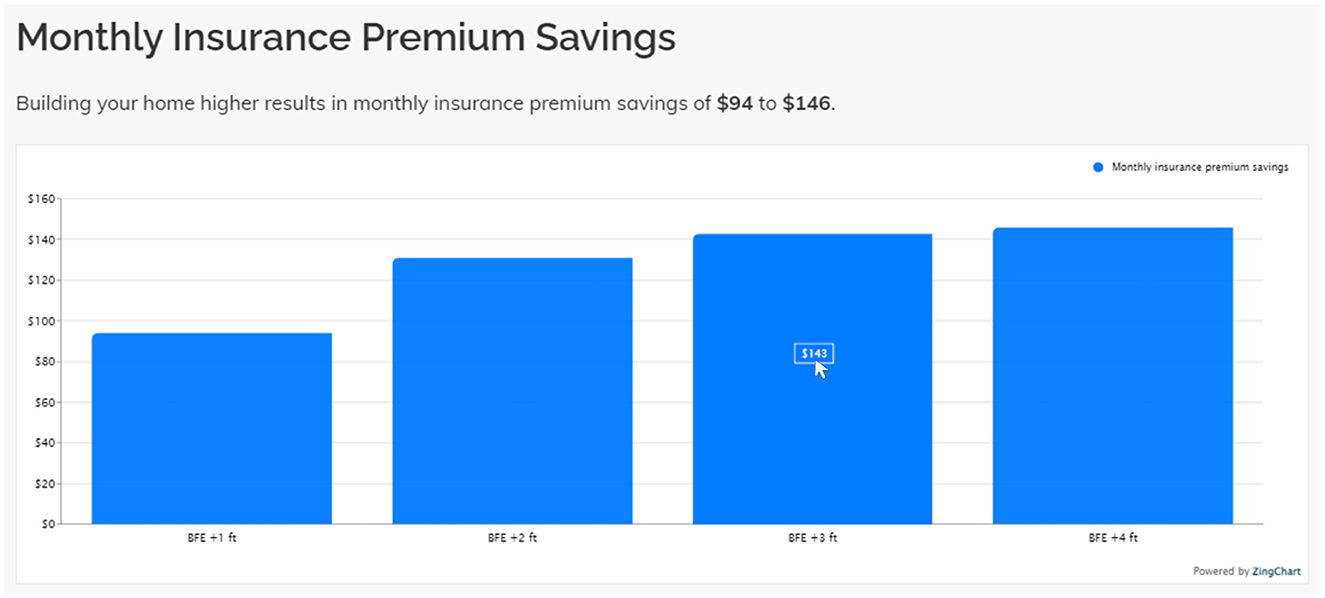
Figure 12. A monthly insurance premium savings graph.
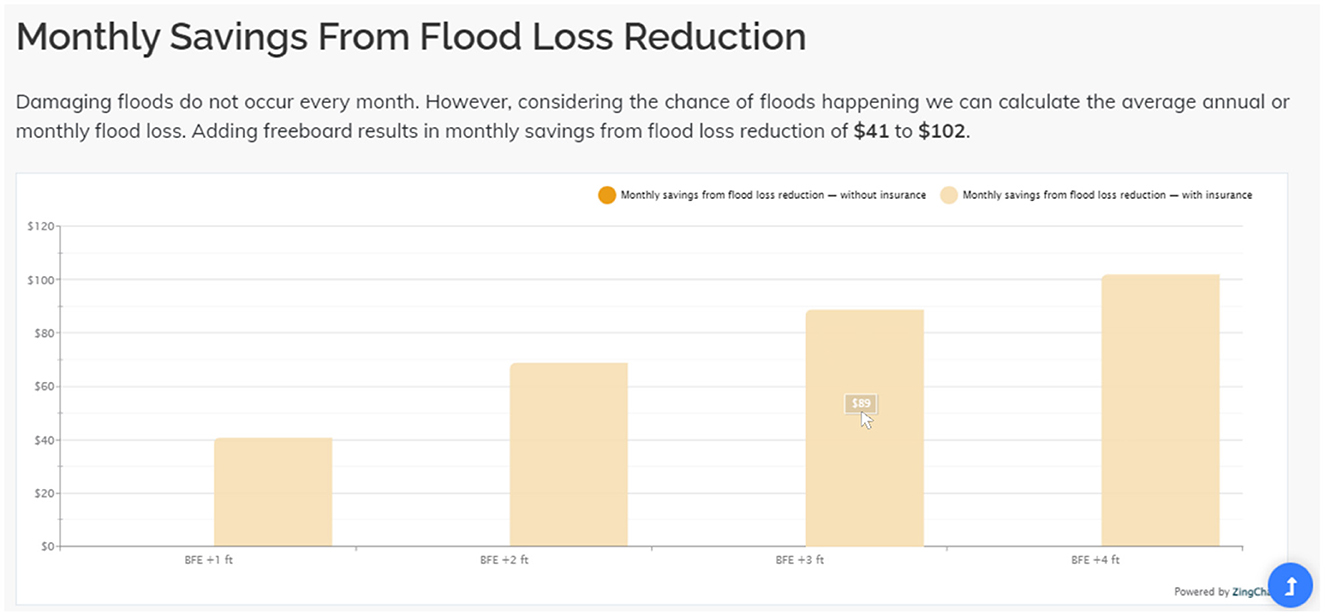
Figure 13. Monthly savings from flood loss reduction graph.
4.2.1. Summary of analysis report
As shown in Figure 9, the freeboard cost analysis report provides the summary of output results. The overall results indicate that for this location, adding 3 ft of freeboard represents the economically optimal option, where total monthly savings is at its highest value of $175. Elevating the home to the optimal 3 ft of freeboard adds $57 to the 30-year monthly mortgage payment with fixed rate of 3%. The insurance savings and reduced flood losses per month are $143 and $89, respectively (Figure 9).
4.2.2. Monthly savings
The results shown here indicate that all freeboard scenarios outperform the BFE scenario and result in monthly savings. Adding freeboard results in total monthly savings ranging from $116 to $175 with the highest value at 3 ft of freeboard.
4.2.3. Monthly freeboard cost
The cost of adding freeboard is evaluated based on the estimated total building construction cost of $220,680. Freeboard costs are also calculated as a part of a 30-year mortgage with fixed rate of 3%. The cost of adding the optimal 3 ft of freeboard is $12,760, while the monthly amortized cost of adding freeboard ranges from $19 to $76. While the increase in freeboard cost is modest, the long-term avoided losses and savings on insurance premiums are substantial.
4.2.4. Monthly insurance premium savings
For each freeboard scenario, the corresponding annual flood insurance premium is estimated using calculations based on the building and contents value of $225,000 and $90,000, respectively. Constructing a home with additional freeboard saves between $94 and $146 for monthly building and contents flood insurance premiums, respectively, compared to $197 when building at the BFE. Constructing the home with the optimal 3 ft of freeboard reduces monthly building and contents flood insurance premiums by 72%.
4.2.5. Monthly savings from flood loss reduction
Adding freeboard reduces expected monthly direct flood losses from flooding events by $41 to $102, from the $1,587 annual flood loss if the home were built at BFE. Constructing the home with the optimal 3 ft of freeboard reduces monthly flood loss reduction by 67%.
5. Conclusions and limitations
Individuals are often unaware of flood risk in their residential areas. A robust approach that allows them to quantify the expected losses and obtain actionable information while also considering the future flood hazard has been unavailable. Thus, several vulnerable communities remain unaware of the risk and lack the opportunity to enjoy the possible benefits of mitigation strategies such as elevation increase (Warren-Myers et al., 2018). Providing communities with flood risk information including possible mitigation strategies and the related financial impacts is imperative in informing the decision-making process and thus enhancing long-term resilience. Many homeowners, tenants, landlords, and other community stakeholders still have not been exposed to this vital risk information and flood adaptation approaches such as adding freeboard. In addition, corresponding benefits of taking mitigation measures have not been fully realized by homeowners, particularly in disaster-prone areas. A reliable tool that quantifies the expected financial benefits of adding freeboard in a way that communicates clear results and provides actionable information to stakeholders is needed.
This study provides a new approach for integrated estimation of a variety of economic aspects of freeboard installation. A new location-based method of assessing freeboard financial benefits and savings for improved flood risk mitigation and decision-making is proposed. Thus, the primary contribution of this study is in the combined approach that enables calculation of freeboard benefits and savings for an individual building with specific property and flood risk information. The inclusion of both flood reduction and insurance premium savings in the calculation procedure allows for comprehensive and customized evaluation of freeboard benefits for an individual property. In addition, the interactive web-based framework allows the public to explore individually-tailored flood risk and freeboard benefit information for residences. The web-based decision-making tool (floodsafehome.lsu.edu) provides actionable information to stakeholders such as homeowners, tenants, landlords, designers, builders, and planners without revealing private information. The tool analyzes possible freeboard alternatives, along with the expected cost and benefits. Users are provided with estimated construction costs, amortized costs per month, savings per month, and flood loss reduction, by entering only location information, the building area, and number of floors. The info-graphic output is designed to communicate information quickly and clearly to users.
The specific findings of the case study show that
• elevation of a new home by 3 ft above the base flood elevation is optimal to maximize monthly savings ($175).
• the cost of adding the optimal 3 ft of freeboard is $12,760, while the monthly amortized cost of adding freeboard is $57.
• constructing the home with the optimal 3 ft of freeboard reduces monthly insurance premiums and flood loss by 72 and 67%, respectively.
Information regarding the optimal freeboard levels and associated benefits is expected to be vital to assist homeowners, tenants, landlords, and other stakeholders who promote community wellbeing. Minimizing the number of flooded homes, particularly repetitive-loss properties, saves homeowners from repeated heartache, moving expense, and inconvenience, and it also assists the community by circumventing a reputation that would decrease property values.
Despite the beneficial information produced from this decision-making system, several limitations that will be addressed in future research must be considered. First, the scope of implementation is limited, to date. More specifically, this study used static flood zone information to develop an approach, which was generated by FEMA on 16 February 2021. The back-end system database must be updated when FEMA updates the flood zone information. In addition, the methodology should be improved to incorporate FEMA's RISK Rating 2.0 flood insurance rating system (Rahim et al., 2023). Moreover, the calculations designed in this methodology only consider direct physical economic losses. Other relevant and possible losses such as displacement, disruption, and relocation are not currently included in the calculation. In Jefferson Parish, for example, flood depth grids at multiple return periods are available only for the areas within the levee-protected area. In St. Tammany and Terrebonne parishes, only flood depth data for the 100-year return period are available, and in some areas, even the 100-year depths are unavailable. Nevertheless, as data become more abundant, the back-end of the portal should be updated accordingly. The output and analyzed outcomes are dependent on the input data including the accuracy of the flood depth grid, flood zone, and user-input data. In addition, the proposed website currently does not incorporate future flood scenarios based on climate change. The consideration of future climate change is necessary to provide accurate flood risk and associated freeboard cost and benefits into the future. Furthermore, the social, psychological, and environmental benefits are not addressed in benefit evaluation due to various uncertainties and underlying limitations. Thus, the benefits of adding freeboard are considerably underestimated. Finally, technology can sometimes exclude rather than include some marginalized and vulnerable populations, so implementation of the tool is likely to be limited unless community members can make explicit efforts to communicate its message to those who may not be aware of it. Future work will focus on expanding the scalable and customizable approach for increased geographical coverage and for community-level decision making.
Since the proposed system is scalable and customizable, the authors will continually improve the system by addressing the limitations. In addition, the system will be expanded and updated periodically, for covering other areas of Louisiana and ultimately the flood-vulnerable homes and areas throughout the U.S. In addition, based on this decision-making system, the authors will establish a new feature for community-level decision making that supports estimating freeboard benefits and savings of multiple residences or subdivisions in order to assist community practitioners or contractors in identifying flood risk, cost-efficient freeboard levels, and savings for their communities.
Data availability statement
The raw data supporting the conclusions of this article will be made available by the authors, without undue reservation.
Author contributions
CF provided original ideas and advice on the overall project methodology and edited the text. Y-CL supervised the web-tool development and edited the initial text. RM collected and analyzed the data and edited the text. JL developed the front-end of the web-tool and developed the initial text. SM developed the back-end of the web-tool and edited the text. RR edited early and late drafts of the text. MR developed the code and edited the text. EG developed the initial text. MF helped to develop the original ideas of the web-tools. All authors contributed to the article and approved the submitted version.
Funding
This research was funded by the Louisiana Sea Grant College Program (Omnibus cycle 2020-2022; Award Number: NA18OAR4170098; Project Number: R/CH-03; Omnibus cycle 2022-2024; Award Number: NA22OAR4710105; Project Number: R/CH-05). Any opinions, findings, conclusions, and recommendations expressed in this manuscript are those of the authors and do not necessarily reflect the official policy or position of the funders. The publication of this article is supported by the LSU AgCenter LaHouse Resource Center.
Conflict of interest
The authors declare that the research was conducted in the absence of any commercial or financial relationships that could be construed as a potential conflict of interest.
Publisher's note
All claims expressed in this article are solely those of the authors and do not necessarily represent those of their affiliated organizations, or those of the publisher, the editors and the reviewers. Any product that may be evaluated in this article, or claim that may be made by its manufacturer, is not guaranteed or endorsed by the publisher.
Author disclaimer
Any opinions, findings, conclusions, and recommendations expressed in this manuscript are those of the authors and do not necessarily reflect the official policy or position of the funders.
References
Al Assi, A., Friedland, C. J., Rohli, R. V., and Mostafiz, R. B. (2022). Quantifying flood risk of the shaded X zone in the United States. Chicago, Illinois: American Geophysical Union (AGU) Fall Meeting 2022. p. 12–16
Al Assi, A., Mostafiz, R. B., Friedland, C. J., Rahim, M. A., and Rohli, R. V. (2023c). Flood risk assessment for residences at the neighborhood scale by owner/occupant type and first-floor height. Front. Big Data. 5, 997447. doi: 10.3389/fdata.2022.997447
Al Assi, A., Mostafiz, R. B., Friedland, C. J., Rohli, R. V., and Rahim, M. A. (2023a). Homeowner flood risk and risk reduction from home elevation between the limits of the 100-and 500-year floodplains. Front. Earth Sci. 11, 1051546. doi: 10.3389/feart.2023.1051546
Al Assi, A., Mostafiz, R. B., Friedland, C. J., Rohli, R. V., Taghinezhad, A., and Rahim, M. A. (2023b). Cost-effectiveness of federal CDBG-DR Road Home Program mitigation assistance in Jefferson Parish, Louisiana. Nat. Hazards. doi: 10.1007/s11069-023-05904-3
Almoradie, A., Jonoski, A., Stoica, F., Solomatine, D., and Popescu, I. (2013). Web-based flood information system: Case study of Somes Mare, Romania. Environm. Eng. Manag. J. 12, 1065–1070. doi: 10.30638/eemj.2013.130
Amoroso, S. D., and Fennell, J. P. (2008). A Rational Benefit/Cost Approach to Evaluating Structural Mitigation For Wind Damage: Learning ‘'the Hard Way” and Looking Forward. Vancouver, British Columbia, Canada: Structures Congress 2008. doi: 10.1061/41016(314)249
De Risi, R., De Paola, F., Turpie, J., and Kroeger, T. (2018). Life cycle cost and return on investment as complementary decision variables for urban flood risk management in developing countries. Int. J. Disaster Risk Reduct. 28, 88–106. doi: 10.1016/j.ijdrr.2018.02.026
Dewan, A. M. (2013). “Vulnerability and risk assessment,” in Floods in a Megacity. Springer Geography. Dordrecht: Springer. doi: 10.1007/978-94-007-5875-9
Doocy, S., Daniels, A., Murray, S., and Kirsch, T. D. (2013). The human impact of floods: a historical review of events 1980–2009 and systematic literature review. PloS Curr. Dis.5, 1–19. doi: 10.1371/currents.dis.f4deb457904936b07c09daa98ee8171a
FEMA (2008). 2008 Supplement to the 2006 Evaluation of the National Flood Insurance Program's Building Standards. Available online at: https://www.fema.gov/sites/default/files/2020-07/fema_nfip_2008_freeboard_report_0.pdf (accessed March 27, 2023).
FEMA (2021). National Flood Insurance Program- Flood Insurance Manual. Available online at: https://www.fema.gov/sites/default/files/documents/fema_nfip-all-flood-insurance-manual-apr-2021.pdf (accessed March 27, 2023).
Ghobadi, M., and Kaboli, H. S. (2020). Developing a Web-based decision support system for reservoir flood management. J. Hydroinformat. 22, 641–662. doi: 10.2166/hydro.2020.185
Gnan, E., Friedland, C. J., Mostafiz, R. B., Rahim, M. A., Gentimis, T., Taghinezhad, A., et al. (2022a). Economically optimizing elevation of new, single-family residences for flood mitigation via life-cycle benefit-cost analysis. Front. Environm. Sci. 10, 889239. doi: 10.3389/fenvs.2022.889239
Gnan, E., Friedland, C. J., Rahim, M. A., Mostafiz, R. B., Rohli, R. V., Orooji, F., et al. (2022b). Improved building-specific flood risk assessment and implications for depth-damage function selection. Front. Water. 4, 919726. doi: 10.3389/frwa.2022.919726
Gnan, E., Mostafiz, R. B., Rahim, M. A., Friedland, C. J., Rohli, R. V., Taghinezhad, A., et al. (2022c). Freeboard life-cycle benefit-cost analysis of a rental single-family residence for landlord, tenant, and insurer. Nat. Hazards Earth Syst. Sci. doi: 10.5194/nhess-2022-222
Hagemeier-Klose, M., and Wagner, K. (2009). Evaluation of flood hazard maps in print and web mapping services as information tools in flood risk communication. Nat. Hazards Earth Syst. Sci. 9, 563–574. doi: 10.5194/nhess-9-563-2009
Holz, K. P., Hildebrandt, G., and Weber, L. (2006). Concept for a Web-based information system for flood management. Nat. Hazards. 38, 121–140. doi: 10.1007/s11069-005-8605-5
Jones, C. P., Coulbourne, W. L., Marshall, J., and Rogers, Jr., S. M. (2006). Evaluation of the National Flood insurance Program's Building Standards. American Institutes for Research. Available online at: https://www.fema.gov/sites/default/files/2020-07/fema_nfip_eval_building_standards.pdf (accessed March 27, 2023).
Kawamura, Y., Dewan, A. M., Veenendaal, B., Hayashi, M., Shibuya, T., Kitahara, I., et al. (2014). Using GIS to develop a mobile communications network for disaster-damaged areas. Int. J. Digital Earth 7, 279–293. doi: 10.1080/17538947.2013.808277
Khalid, A., and Ferreira, C. M. (2020). Advancing real-time flood prediction in large estuaries: iFLOOD a fully coupled surge-wave automated Web-based guidance system. Environm. Modell. Software. 131, 1–24. doi: 10.1016/j.envsoft.2020.104748
Li, X., Chau, K., Cheng, C., and Li, Y. (2006). A Web-based flood forecasting system for Shuangpai region. Adv. Eng. Software. 37, 146–158. doi: 10.1016/j.advengsoft.2005.05.006
Limlahapun, P., and Fukui, H. (2009). “Flood monitoring and early warning system integrating object extraction tool on web-based,” in 2009 ICCAS-SICE, Fukuoka, 2639–2643. Available online at: https://ieeexplore.ieee.org/abstract/document/5335170 (accessed March 27, 2023).
Lin, N., and Shullman, E. (2017). Dealing with hurricane surge flooding in a changing environment: Part I. Risk assessment considering storm climatology change, sea level rise, and coastal development. Stoch. Environ. Res. Risk Assess. 31, 2379–2400. doi: 10.1007/s00477-016-1377-5
Molino, S. (2009). “Unifying flood information – The Victorian flood web portal,” in Joint NSW and Victorian Flood Management Conference – Albury Wodonga 16 – 20 February 2009. Available online at: https://www.researchgate.net/publication/238081222_Unifying_Flood_Information_-_The_Victorian_Flood_Web_Portal (accessed March 27, 2023).
Mostafiz, R. B. (2022). Estimation of Economic Risk from Coastal Natural Hazards in Louisiana. LSU Doctoral Dissertations. p. 5880. Available online at: https://digitalcommons.lsu.edu/gradschool_dissertations/5880/ (accessed March 27, 2023).
Mostafiz, R. B., Assi, A. A., Friedland, C. J., Rohli, R. V., and Rahim, M. A. (2022c). A Numerically-Integrated Approach for Residential Flood Loss Estimation at the Community Level. Vienna, Austria: European Geophysical Union General Assembly 2022. doi: 10.5194/egusphere-egu22-10827
Mostafiz, R. B., Bushra, N., Rohli, R. V., Friedland, C. J., and Rahim, M. A. (2021b). Present vs. future property losses from a 100-year coastal flood: a case study of Grand Isle, Louisiana. Front. Water. 3, 763358. doi: 10.3389/frwa.2021.763358
Mostafiz, R. B., Friedland, C. J., Rahim, M. A., Rohli, R. V., and Bushra, N. (2021a). “A data-driven, probabilistic, multiple return period method of flood depth estimation,” in American Geophysical Union Fall Meeting 2021, 13–17 December, New Orleans, LA. Available online at: https://www.authorea.com/doi/full/10.1002/essoar.10509337.1 (accessed March 27, 2023).
Mostafiz, R. B., Friedland, C. J., Rahman, M. A., Rohli, R. V., Tate, E., Bushra, N., et al. (2021c). Comparison of neighborhood-scale, residential property flood-loss assessment methodologies. Front. Environm. Sci. 9, 734294. doi: 10.3389/fenvs.2021.734294
Mostafiz, R. B., Rahim, M. A., Friedland, C. J., Rohli, R. V., Bushra, N., and Orooji, F. (2022b). A data-driven spatial approach to characterize the flood hazard. Front. Big Data. 5, 1022900. doi: 10.3389/fdata.2022.1022900
Mostafiz, R. B., Rohli, R. V., Friedland, C. J., and Lee, Y. C. (2022a). Actionable information in flood risk communications and the potential for new Web-based tools for long-term planning for individuals and community. Front. Earth Sci. 10, 840250. doi: 10.3389/feart.2022.840250
Multihazard Mitigation Council (2017). Natural Hazard Mitigation Saves: 2017 Interim Report. Washington, DC: National Institute of Building Sciences. Available online at: https://www.fema.gov/sites/default/files/2020-07/fema_ms2_interim_report_2017.pdf (accessed March 27, 2023).
Mure-Ravaud, M., Binet, G., Bracq, M., Perarnaud, J. J., Fradin, A., and Litrico, X. (2016). A web based tool for operational real-time flood forecasting using data assimilation to update hydraulic states. Environm. Model. Software. 84, 35–49. doi: 10.1016/j.envsoft.2016.06.002
Poussin, J. K., Botzen, W. W., and Aerts, J. C. (2014). Factors of influence on flood damage mitigation behaviour by households. Environ. Sci. Policy 40, 69–77. doi: 10.1016/j.envsci.2014.01.013
Qiang, Y., Lam, N. S., Cai, H., and Zou, L. (2017). Changes in exposure to flood hazards in the United States. Ann. Am. Assoc. 107, 1332–1350. doi: 10.1080/24694452.2017.1320214
Quinn, N., Bates, P. D., Neal, J., Smith, A., Wing, O., Sampson, C., et al. (2019). The spatial dependence of flood hazard and risk in the United States. Water Resour. Res. 55, 1890–1911. doi: 10.1029/2018WR024205
Rahim, M. A., Freidland, C., Rohli, R., Bushra, N., and Mostafiz, R. B. (2021). A Data-Intensive Approach To Allocating Owner vs. NFIP Portion of Average Annual Flood Losses. New Orleans, LA: American Geophysical Union (AGU) Fall Meeting 2021. doi: 10.1002/essoar.10509884.1
Rahim, M. A., Friedland, C., Mostafiz, R. B., Rohli, R., and Bushra, N. (2022a). Apportionment of average annual flood loss between homeowner and insurer. Res. Square. doi: 10.21203/rs.3.rs-1483728/v1
Rahim, M. A., Gnan, E. S., Friedland, C. J., Mostafiz, R. B., and Rohli, R. V. (2022b). An Improved Micro Scale Average Annual Flood Loss Implementation Approach. Vienna, Austria: EGU General Assembly 2022. doi: 10.5194/egusphere-egu22-10940
Rahim, M. A., Mostafiz, R. B., and Friedland, C. (2023). Disseminating Flood Risk Information in the USA through Risk Rating 2.0. Vienna, Austria: EGU General Assembly 2023. doi: 10.5194/egusphere-egu23-16893
Sharp, J. (2018). Eye of the Storm: Report of the Governor's Commission to Rebuild Texas. Retrieved from State of Texas. Available online at: https://twu-ir.tdl.org/bitstream/handle/11274/12043/Danley-Scott.pdf?sequence=1 (accessed March 27, 2023).
Sunkpho, J., and Oottamakorn, C. (2011). Real-time flood monitoring and warning system. Songklanakarin J. Sci. Technol. 33, 227–235.
USACE (2000). “Economic Guidance Memorandum (EGM) 01-03, Generic Depth Damage Relationships,” in Memorandum from USACE (United States Army Corps of Engineers) p. 1–3. Available online at: https://planning.erdc.dren.mil/toolbox/library/EGMs/egm01-03.pdf (accessed March 27, 2023).
van Duin, B., Zhu, D. Z., Zhang, W., Muir, R. J., Johnston, C., Kipkie, C., et al. (2021). Toward more resilient urban stormwater management systems—Bridging the gap from theory to implementation. Front. Water. 3, 671059. doi: 10.3389/frwa.2021.671059
Warren-Myers, G., Aschwanden, G., Fuerst, F., and Krause, A. (2018). Estimating the potential risks of sea level rise for public and private property ownership, occupation and management. Risks. 6, 37. doi: 10.3390/risks6020037
Wehn, U., Rusca, M., Evers, J., and Lanfranchi, V. (2015). Participation in flood risk management and the potential of citizen observatories: agovernance analysis. Environ. Sci. Policy. 48, 225–236. doi: 10.1016/j.envsci.2014.12.017
Wing, O. E. J., Lehman, W., Bates, P. D., Sampson, C. C., Quinn, N., Smith, A. M., et al. (2022). Inequitable patterns of US flood risk in the anthropocene. Nat. Clim. Chang. 12, 156–162. doi: 10.1038/s41558-021-01265-6
Xian, S., Lin, N., and Kunreuther, H. (2017). Optimal house elevation for reducing flood-related losses. J. Hydrol. 548, 63–74. doi: 10.1016/j.jhydrol.2017.02.057
Keywords: web-based decision-making tool, flood risk mitigation, average annual loss (AAL), base flood elevation (BFE), life-cycle benefit-cost analysis (LCBCA), first-floor elevation (FFE), amortized freeboard cost, avoided annual loss
Citation: Friedland CJ, Lee Y-C, Mostafiz RB, Lee J, Mithila SP, Rohli RV, Rahim MA, Gnan E and Farris MT (2023) FloodSafeHome: evaluating financial benefits and savings of freeboard for improved decision-making in flood risk mitigation. Front. Commun. 8:1060901. doi: 10.3389/fcomm.2023.1060901
Received: 03 October 2022; Accepted: 21 March 2023;
Published: 11 May 2023.
Edited by:
Subhrajit Dutta, National Institute of Technology, Silchar, IndiaReviewed by:
Md Islam, University of Alabama, United StatesLucia Velotti, John Jay College of Criminal Justice, United States
Copyright © 2023 Friedland, Lee, Mostafiz, Lee, Mithila, Rohli, Rahim, Gnan and Farris. This is an open-access article distributed under the terms of the Creative Commons Attribution License (CC BY). The use, distribution or reproduction in other forums is permitted, provided the original author(s) and the copyright owner(s) are credited and that the original publication in this journal is cited, in accordance with accepted academic practice. No use, distribution or reproduction is permitted which does not comply with these terms.
*Correspondence: Carol J. Friedland, Q0ZyaWVkbGFuZEBhZ2NlbnRlci5sc3UuZWR1