 Barbara E. Bierer
 Sylvia Baedorf Kassis
- 1Multi-Regional Clinical Trials Center of Brigham and Women's Hospital and Harvard, Boston, MA, United States
- 2Division of Global Health Equity, Department of Medicine, Brigham and Women's Hospital, Boston, MA, United States
- 3Department of Medicine, Harvard Medical School, Boston, MA, United States
The ability to understand and use numeric information in healthcare and clinical research is a critical component of informed decision-making for patients and study participants. Health numeracy levels in the general population, however, tend to be quite low and as such, the responsibility falls on communicators to ensure that the information being shared is designed to facilitate recipient comprehension and support their autonomy. Here, we introduce health numeracy considerations within the clinical research context and outline specific areas that can benefit from thoughtful communication strategies, including the presentation of visual information to augment the interpretation of, and learning about, research studies. Specifically, we discuss seven categories of numeric concepts that arise throughout the course of research participation and important considerations when presenting such information. Increasing awareness amongst communicators about health numeracy and the need to include supportive visual representations when developing and sharing clinical research-related information will help support the creation of tailored information that meets the needs of the intended audience.
Introduction
Over the past few decades, health literacy, or the degree to which individuals have the capacity to obtain, process, and understand basic health information needed to make appropriate health decisions (Nielsen-Bohlman et al., 2004), has been the subject of focus and attention. Numeracy, however, has not garnered the same degree of interest. Health numeracy has been defined as “the degree to which individuals have the capacity to access, process, interpret, communicate, and act on numerical, quantitative, graphical, biostatistical, and probabilistic health information needed to make effective health decisions” (Golbeck et al., 2005). Much of the information that is given to patients and participants in written and electronic health and research communications is quantitative, including content such as medication schedules, nutrition information, laboratory values, and the risks and benefits of therapies (Ancker and Kaufman, 2007). For healthcare practitioners, sharing complex numeric information related to health and research in a way that is understandable to the patient is challenging. Whether it is the probability of experiencing a side effect, the statistical significance of a specific result, or making sense of a particular health score, the information must be presented with the end user's experience and comprehension in mind. The ability to understand and use numerical and mathematical concepts in daily life, or numeracy, is foundational for people to understand their health, medical conditions, risks, and options for medical care. This health numeracy is also applicable in the context of clinical research when people are deciding whether to enroll or to stay in a study, as well as when they receive research results.
Despite its importance, however, adult numeracy skills tend to be quite limited. The Programme for the International Assessment of Adult Competencies (P.I.A.A.C.) which measures proficiency of adults aged 16–65 years in key information-processing skills, is one tool that includes a numeracy measure. In the U.S., the P.I.A.C.C.'s 2017 numeracy results (O.E.C.D., 2019) show that the average numeracy score was significantly lower than the O.E.C.D. average, and that almost two thirds of the survey population either struggle with or are unable to complete numeracy-related tasks.
Given limited numeracy levels and appreciating that raising individual and population numeracy skills is desirable but difficult, there is now an increased emphasis not on the recipient of the information but on the communication team's role and responsibility to share clear information. This focus on the communicator follows from Healthy People 2030's updated definition of health literacy that expands beyond personal health literacy to include organizational health literacy defined as “the degree to which organizations equitably enable individuals to find, understand, and use information and services to inform health-related decisions and actions for themselves and others” (U. S. Department of Health Human Services, 2019). Health numeracy could benefit from a similarly expanded definition.
It is important that medical- and research-related content, including numeric information, be developed and communicated in ways that support recipient comprehension. The communicator should develop the skills and abilities to transfer information in ways that are understandable and usable by people across a range of proficiency levels. To our knowledge, there are no freely available training and capacity-building programs that focus explicitly and exclusively on the communication of complex numeric information in the clinical research context, thus our intention is to present strategies that support numeric comprehension across the life cycle of a study. Here we focus on health numeracy considerations for communicating and visualizing numeric information in clinical research. Although we anticipate that well-developed content could present a learning opportunity and have sustained impact for participants, our focus here is not on the numeracy levels of the recipients of the information but rather on methods that can strengthen the presentation of numeric research-related content by communicators, with an emphasis on accompanying visuals that can support user understanding. We end with recommendations to enhance communication of numeric and mathematical relationships relevant to clinical research.
Health numeracy in clinical research
Health numeracy is necessary for people to understand their health, medical conditions, risks, options for medical care and research involvement, and the financial consequences of seeking treatment or joining a research study. Limited health numeracy is associated with distorted perceptions of risks and benefits of screening, reduced medication compliance, delayed treatments, impaired risk communication, and adverse medical outcomes (Reyna et al., 2009). Participation in clinical research is also impacted by limited health numeracy. For example, an informed decision about research participation can require a person to understand the probability of experiencing a potential risk of an experimental intervention or the concept of “randomization”. Participants' ability to follow through with the expectations of the research requires an understanding of the study schedules and procedures, and of dosages and timing. In the clinical research context, appreciating the risks and benefits, the trade-offs, and importantly, the likelihood of those risks, benefits, and alternatives occurring, ground informed consent and enable autonomy.
The Belmont Report (The National Commission for the Protection of Human Subjects of Biomedical Behavioral Research, 1979), Declaration of Helsinki (World Medical Association, 2013), and the Council for International Organizations of Medical Sciences (C.I.O.M.S.) (C.I.O.M.S., 2016), all set forth principles of autonomy and respect for persons. Both the HHS Common Rule (U. S. Department of Health Human Services, 2018) and FDA research regulations at 21 CFR 50 (U.S. Food and Drug Administration, 1999) require that “information that is given to the subject or the representative shall be in language understandable to the subject or the representative”. “A language understandable”—and participant understanding—extends beyond the informed consent form to include recruitment materials, participant instructions, patient-reported outcomes, surveys, and plain language summaries, among others. “Language understandable” also refers to any numeric information provided to participants. Recruitment, consent, and other research-related information must strive for patient and participant understanding to support values-concordant decision-making.
Understanding, and understanding numbers specifically, is especially important in the clinical research context. The premise of conducting valid clinical research is the expectation that generalizable knowledge will result. While some research studies have the possibility of benefit for the individual, there is no guarantee that an intervention will be helpful, and there is always the risk of harm. People considering research participation must therefore understand concepts such as risk, randomization, as well as likelihood, uncertainty, and potentiality, and these concepts are often accompanied by numbers, percentages, rates, probabilities, and graphics. For all individuals, regardless of baseline health literacy and numeracy levels, the complexity of research information can contribute to cognitive burden, thus requiring extra attention by communicators to support comprehension. Research on health literacy and numeracy has found that each were independently associated with people's interest in participating in future research studies (Kripalani et al., 2019). Further, numeracy proficiency positively correlated with interest in research even when adjusted for age, race, education, and income, each of which are known to correlate with research interest (Kripalani et al., 2019). Communicating numeric information clearly, therefore, will also help support research engagement and inclusion that undergirds equity, leading to more representative participation in, and satisfaction with, biomedical research.
Health numeracy and the clinical research life cycle
While numeracy is often subsumed under the broader umbrella of health literacy, it is its own area of expertise. The presentation of meaningful numeric information is important throughout the participant journey and in each stage of the clinical research life cycle, which can be loosely broken down into five stages (Baedorf Kassis et al., 2019). At the first stage, which can be thought of as a time of discovery and awareness, a person learns about research and related concepts more generally. Next, the recruitment stage is when a person is informed about a specific study for which they might be eligible and is invited to learn more. This second stage includes targeted, relevant written and verbal invitations to join a research study. The third stage refers to the consent process, when a person receives details about the study requirements verbally and in writing and then decides whether to participate. Those who consent to participate in research enter the fourth stage which consists of being on-study and partaking in the study activities. At this stage the participant may continue to receive information, instructions, and reminders about ongoing research procedures, data collection and adverse event reporting. Finally, the fifth stage is the end of the study, when individual study participation ends and, later, when the study closes. This is when results information in the form of plain language summaries, which include numerical information, could be shared with participants. The five stages of the clinical research life cycle, potential health numeracy opportunities, and examples of uses and graphics are described in Table 1.
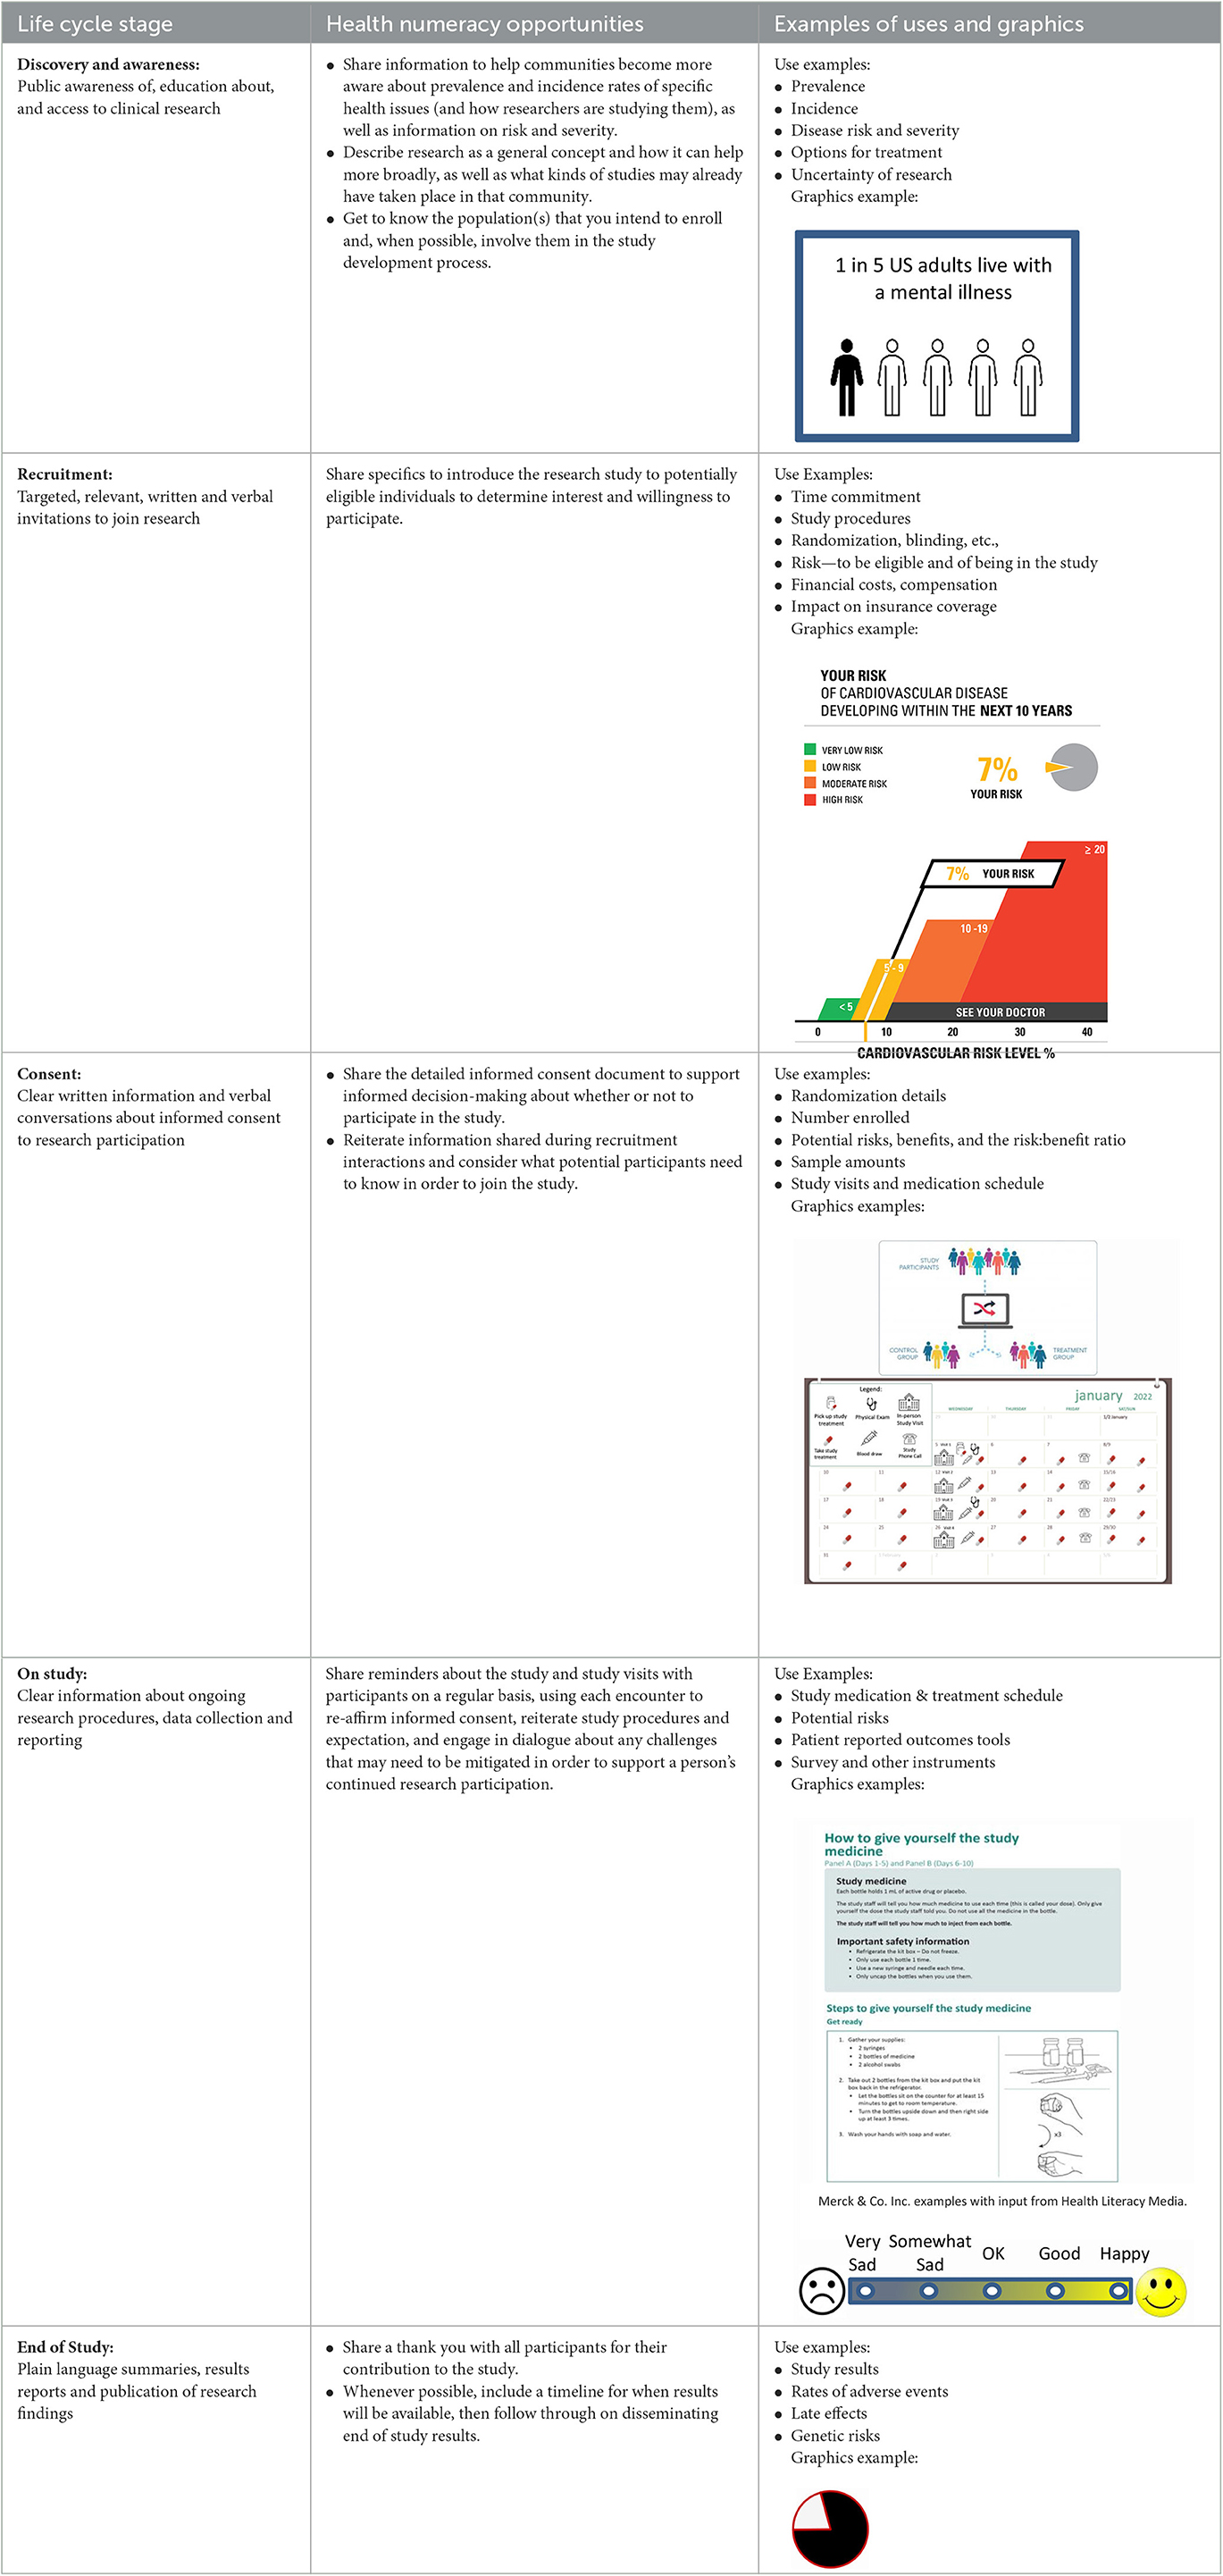
Table 1. The clinical research life cycle, health numeracy opportunities, and examples of uses and graphics.
Critical health numeracy concepts across the clinical research life cycle
The numeric information most often shared in the course of clinical research correlates, and can be aligned, with existing frameworks such as the Health Numeracy Framework (Schapira et al., 2008), which includes three broad conceptual domains (primary, applied, and interpretive health numeracy) and related sub-categorical elements that apply in the clinical research context (e.g., dates and time, medication adherence, absolute and relative risks and benefits, risk and probability, chance and uncertainty). With this framework in mind, and based on our experience in clinical research and work with investigators and study teams, we present seven common numeric concepts in clinical research for which optimizing the presentation of information for patients, participants, and their caregivers can support informed decision-making and engaged research participation. In addition, we illustrate where graphical representation and applying health numeracy best practices might be helpful.
Understanding risks and potential benefits
Deciding whether to participate in clinical research is based, at least in part, on an understanding of risks, burdens, and potential benefits not only of the condition or disease but also of the study itself, and potential alternatives. That understanding is essential for an effective informed consent process. When considering the potential participant, the communicator must attend to the character of the condition that is the subject of the study on the continuum of (1) severity from mild (e.g., intermittent migraine, eczema) to severe (e.g., metastatic cancer, major depression with suicidality), (2) impact on quality of life from modest (e.g., mild discomfort when climbing stairs) to significant (e.g., bedridden in severe pain), (3) timeframe from self-limited (e.g., a headache) to persistent (e.g., arthritis) to relapsing (e.g., multiple sclerosis) to progressive (e.g., dementia), among others. The available treatment alternatives, how well they are tolerated, and the risk of doing nothing are also important. Thus, the consequences of a severe illness—and therefore the choices made—may differ for a young adult than for a 97-year-old with multiple chronic conditions. A clear presentation of the current medical state and treatment alternatives is necessary, only after which a potential participant can consider whether the risks and potential benefits of participation in research are acceptable. Yet, weighing the risks and potential benefits involves understanding probability, a concept that is challenging for many.
Limited health numeracy has been found to distort perceptions of the risks and benefits of screening, reduce medication compliance, impede access to treatments, impair risk communication (limiting prevention efforts among the most vulnerable) and, adversely affect medical outcomes (Reyna et al., 2009). Low numeracy is also associated with greater susceptibility to extraneous factors [i.e., factors that do not actually change the objective numerical information such as how information is presented (e.g., frequencies vs. percentages) and to bias (e.g., positive vs. negative framing bias)] (Reyna et al., 2009).
Principles and guidance for how to present numerical risk information in a way that is understandable are applicable within the clinical research context (Table 2).
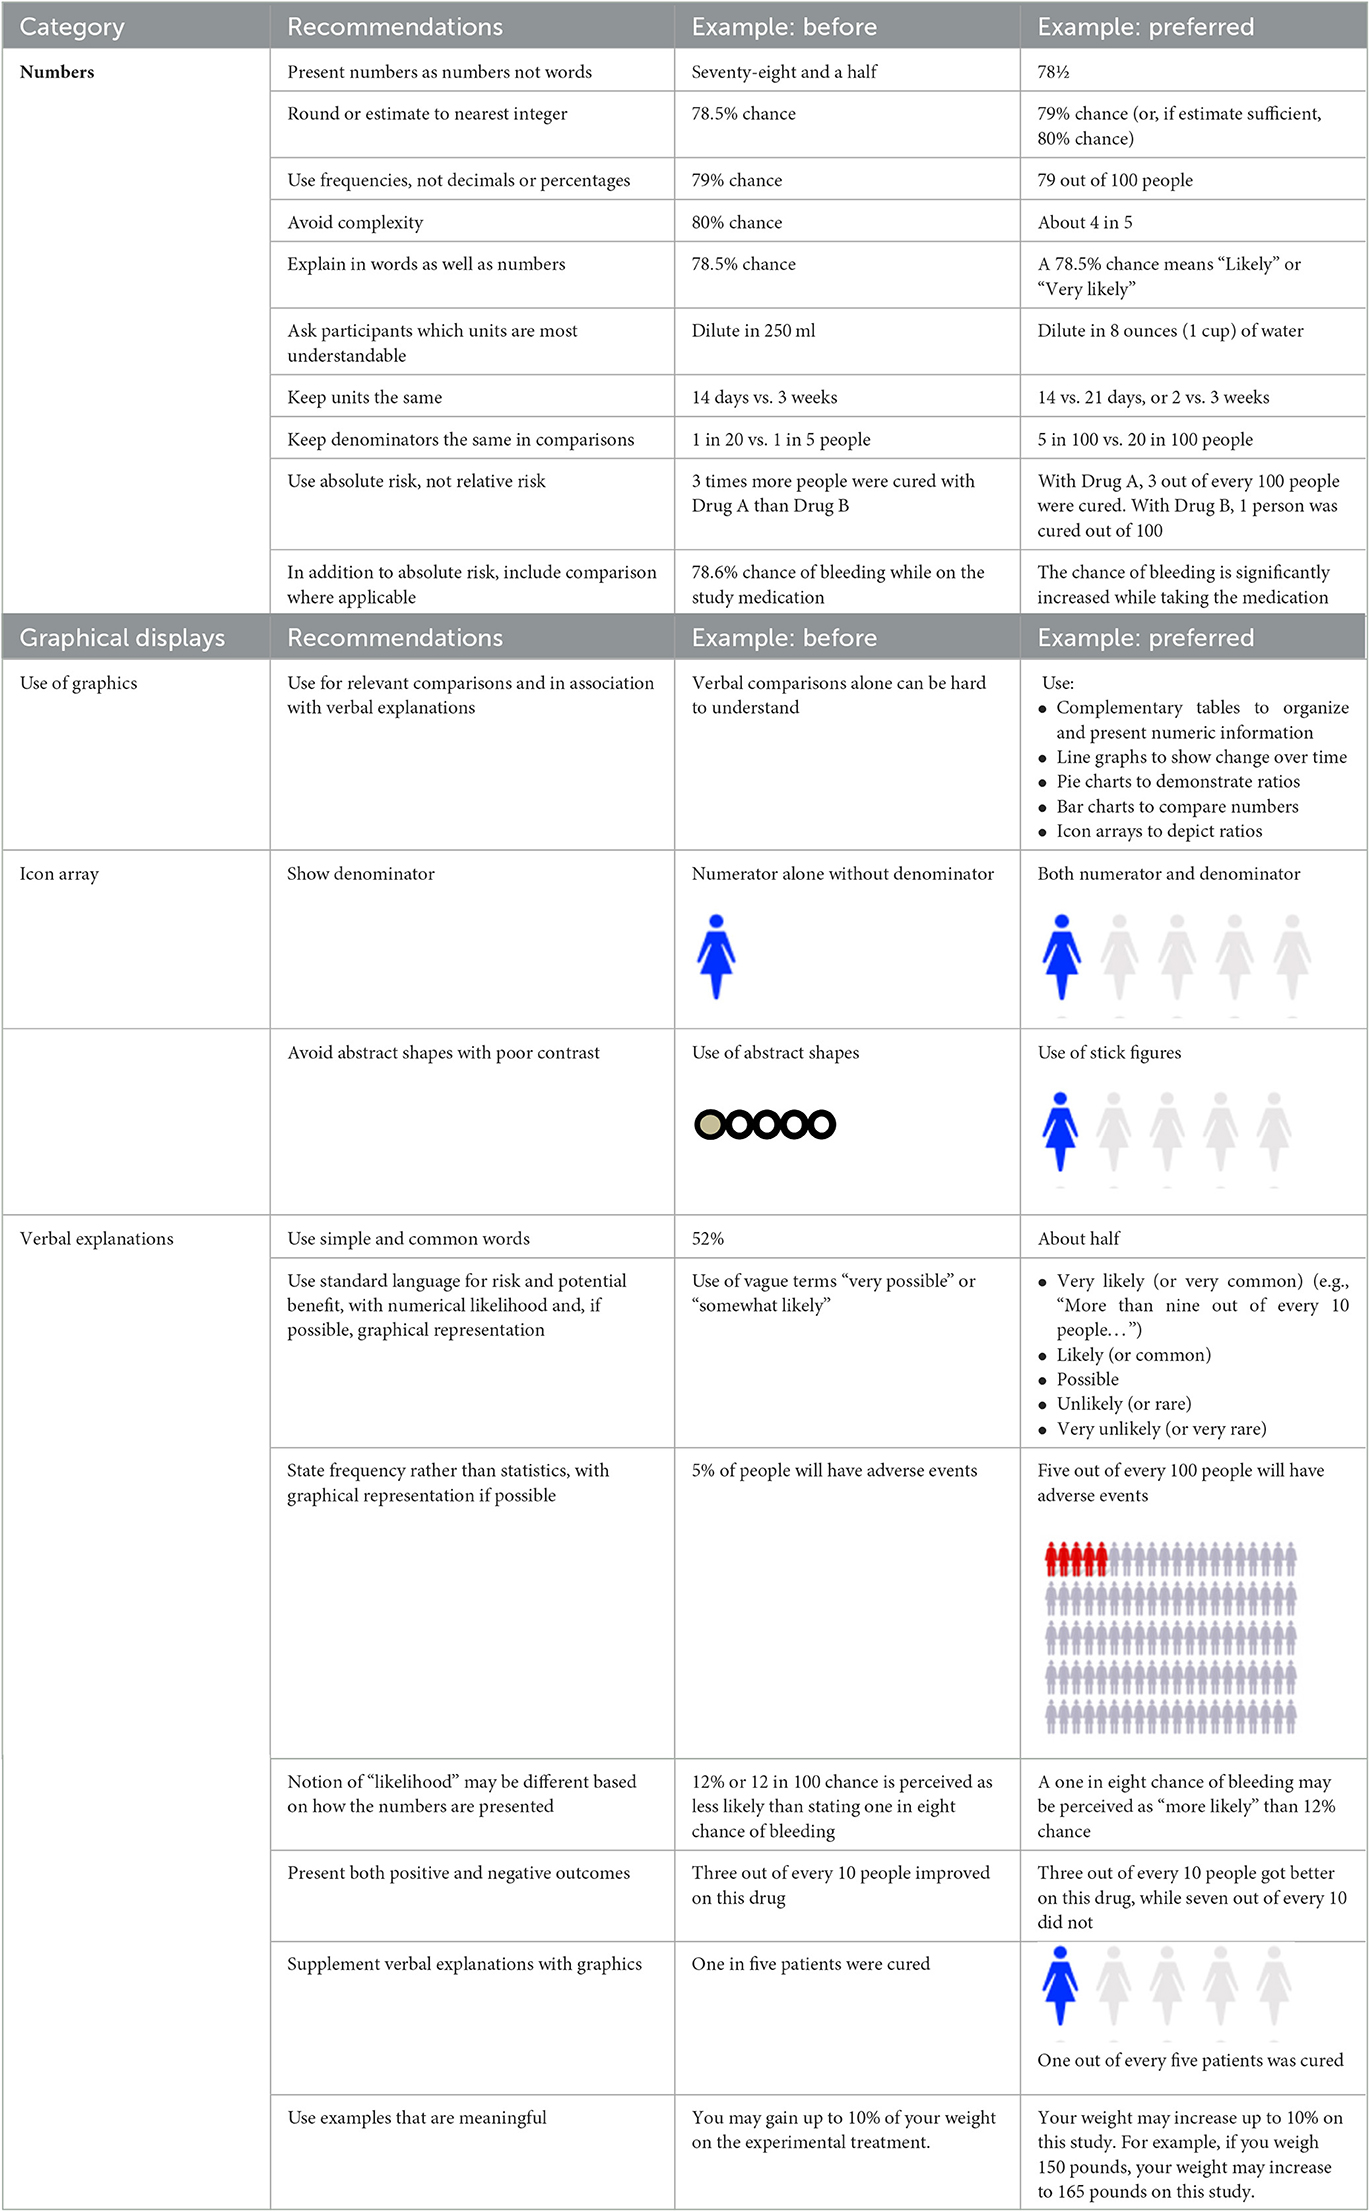
Table 2. Communicating numeric information: recommendations and examples.
Written documents and verbal explanations should be annotated with and supplemented by graphical representations whenever possible (Lipkus and Hollands, 1999). Numbers should be expressed numerically, not in words and preferably without using decimals (e.g., “78” not “seventy-eight and one half” or “78.5”) and, unless precision is necessary, rounded to the nearest whole number (79 or 80%) and preferably also expressed as a ratio (“about 4 out of 5”) (Brase et al., 1998; Lipkus, 2007). When ratios are given or comparisons are made, examples to everyday life are helpful. It is also important to focus on the numbers, explanations, and graphics that make up the critical elements of a decision. For example, serious adverse events, even if rare, are important to explain given the significance of the consequences if they occur; conversely, likely adverse events may be important to discuss, given their frequency, even if mild.
People learn and understand differently, so data, whether pertaining to risks, instructions, or results, should be presented in multiple formats, including graphics and visualizations, when possible, in addition to verbal explanations. For representation of risk, icon arrays may be helpful (Lipkus, 2007): numerators should be accompanied by denominators (Reyna and Brainerd, 2008), color contrast should be sufficient to be visible (Post and Goode, 2020), and bias should be avoided (Petrova et al., 2014) (see Figure 1A). If data sets have a relatively small number of categories, pie charts can demonstrate risks, potential benefits, and results (Mendenhall et al., 2012); showing both positive and negative results is important, and the communicator should consider not only the order of presentation—whether to present positive or negative first—but also the color dominance, size, and balance (Figure 1B).
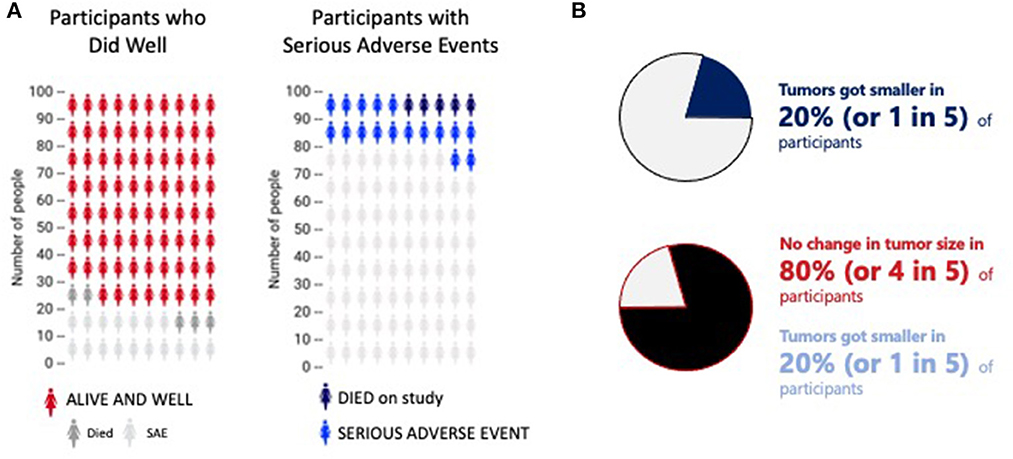
Figure 1. Two different representations of ratios. (A) Two sample icon arrays. The first indicates how many people did well (red) compared to those who died (dark gray) and/or experiences a serious adverse event (light gray). The second shows how many experienced a serious adverse event (blue) or died (black). The data is the same; the emphasis very different. This image is based on original research and designs from Visualizing Health, a collaborative project between the University of Michigan and the Robert Wood Johnson Foundation made publicly available via Creative Commons license. Use of this image is not an endorsement from Visualizing Health. For more information, visit www.vizhealth.org. (B) A pie chart to depict the potential difference in interpretation of the same information presented in different ways. Presenting the first emphasizes the positive response; the second is a more fair and balanced representation of the same data.
Other graphical representations of risk are available to be adapted to specific situations (Figure 2) (Visualizing Health, 2022). When representing risk, a red (e.g., “bad”) green (e.g., “good”) color scheme is often used. It is important to annotate color scales with numbers to guard against misinterpretation and to address the needs of people with color vision deficiency. While graphics may be intuitive and self-explanatory, the communicator should nevertheless keep inclusivity and accessibility aspects in mind, such as using neutral, plain language words to explain the information (Table 2).
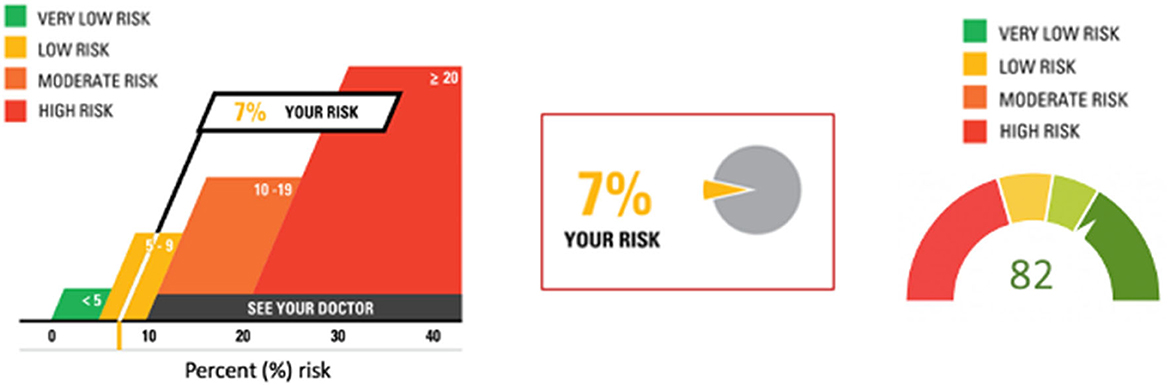
Figure 2. Three different presentations of risk. The first and second images are based on original research and designs from Visualizing Health, a collaborative project between the University of Michigan and the Robert Wood Johnson Foundation made publicly available via Creative Commons license. Use of this image is not an endorsement from Visualizing Health. For more information, visit www.vizhealth.org.
When either explaining (in words) or showing (in graphics) risks or benefits, care should be taken to present absolute rather than relative probabilities, frequency estimates not single-event probabilities, and mortality rates rather than survival rates (Gigerenzer et al., 2007; Naik et al., 2012). Describing the risks and benefits of a screening test, Gigerenzer et al. (2007) clarified the differences in a helpful example. In relative risk reduction, a biannual screening test will reduce the chance of dying by one-third over the next 10 years. In terms of absolute risk reduction, the biannual screening test will reduce the chance of dying from 3 in 1000 to 2 in 1,000 over 10 years. For health economists (and some patients), the number needed to treat is a different but helpful concept: if 1,000 people have the biannual screening test, one person will be saved from dying every 10 years. While each of these statistics reflect the same data set, the implications differ. How a prospective participant interprets the information will also vary and likely impact their decision-making.
Uncertainty
As an extension of understanding probabilities is the consideration of uncertainty. Given limitations in scientific knowledge, medicine is uncertain in its diagnostics, therapeutics, and preventive approaches (Bhise et al., 2018; Kim and Lee, 2018). In recognizing medical uncertainty for the population, however, a paradox emerges that further complicates an individual's decision: while statistics are important to garner a sense of the likelihood of an outcome, for any given participant, the outcome is 100%. The likelihood of curing a certain cancer may be 0.01% or 1 in 10,000, but if that single person is “the 0.01%”, that person is cured. Similarly, it is important to understand that a serious adverse event may be very rare, but the consequences for the participant, when it occurs, are significant. With this knowledge, a participant's character and disposition—and even their current mood—may impact choice, independent of health numeracy proficiency (Reyna et al., 2009; Fehr-Duda et al., 2011). A strictly scientific approach to any decision is further imperiled by “therapeutic misconception” (Appelbaum et al., 1987; Miller and Brody, 2003), the participant's belief that the investigator, like the clinician, always acts in the best interest of the patient and that, therefore, the research has therapeutic intent. Finally, investigators and their study staff, often responsible for explaining the purpose, risks, burdens, and potential benefits of a proposed study to the patient, may be (and often are) biased themselves (Gluud, 2006; Benjamin et al., 2022).
There are at least two kinds of uncertainty built into the scientific process. The first uncertainty relates to the intervention(s) being studied and the prior knowledge about that intervention. A first-in-human study (European Medicines Agency, 2017; Shen et al., 2019), during which a novel investigational product is introduced for human testing for the first time is more uncertain (e.g., “risky”) than a comparative effectiveness trial comparing two approved drugs that are both routinely used in medical care. A first-in-human and first-in class trial (Suntharalingam et al., 2006; Attarwala, 2010)—in which the investigational product represents a new class of compounds—is more uncertain than a first-in-human trial of a second-generation product. These uncertainties are embedded in the study itself: both known unknowns (e.g., safety, effective dose) and unknown unknowns (e.g., unpredictable and unexpected serious adverse events) exist.
The second uncertainty relates to being assigned to one intervention or another, as the risks inherent with each intervention may differ (Nusbaum et al., 2017; Coyle and Gillies, 2020). One intervention may be high risk (e.g., significant toxicity and risk of death) but high reward (e.g., high likelihood of cure if the participant survives) while the other arm may be low risk (e.g., little toxicity) but low reward (e.g., low likelihood of cure). A young adult may decide differently from an elderly person with comorbid conditions; there is no “right” answer. The prospective participant should also understand the probability and consequence of experiencing a rare but serious side effect (e.g., Guillain-Barré Syndrome) compared to a frequent but less serious side effect (e.g., a headache), both of which, for instance, may impact the decision to volunteer for a vaccine trial.
Using visual tools to demonstrate probabilities and uncertainty are helpful and might facilitate participant understanding but cannot, in two or even three dimensions, adequately represent the complexity of all the factors that impact any given decision. It is therefore important to consider the consequences of what someone might come to think of as being a “bad” decision. What is the risk of being wrong? Does the possibility of a significant and serious adverse event (e.g., chronic debility, death) outweigh the possible benefit (e.g., cure)? Value judgements about decisions (e.g., whether to enroll in a clinical trial or not) should be assessed at the time that the decision is being made; it is important to remind the participant that understanding the statistics or likelihood is helpful to make the decision, but any outcome, for them, will be unique (and 100%). And regardless of the outcome, they should be advised not to “look back” to reevaluate the decision itself. Advice should include the recommendation to take the time needed, acquire whatever available information exists, and make the best decision in that moment. Communications should acknowledge that risks and potential benefits, and the uncertainty of either, should reasonably be compared to the outcome of not participating in clinical research at all. Consideration should be given to whether the risk of a serious adverse event is “worth” the potential benefit, given the likelihood of each. Decisions will differ based on underlying conditions (e.g., mild vs. severe disease, stable vs. progressive disease, age and general health of the individual, etc.) as well as what alternatives are already on the market and have proven safety and efficacy for the condition. While more commonly referenced within the clinical care setting, models of shared decision-making can be helpful in guiding clinical research conversations that include the understanding and interpretation of complex numeric information (Agency for Healthcare Research Quality, 2014).
Randomization and clinical equipoise
Foundational ethical principles of prospective clinical trials that compare two or more interventions demand that, at the start of the trial, after risks have been minimized, the study arms have at least an equivalent likelihood of a beneficial outcome (Emanuel et al., 2000). Study populations are defined by eligibility criteria, and the participants are recruited, enrolled, and assigned by chance, or randomized, to either one intervention or another, to either the experimental arm or the comparator. Importantly, randomization controls for differences between individuals, whether those differences are known or unknown; randomization can mitigate or minimize bias (Suresh, 2011; Berger et al., 2021).
Detailed explanations of the concepts of randomness (chance) and randomization can be helpful. Beyond the simple description of randomization as study arm assignment by chance, often utilizing a computer-generated program, explaining the rationale behind randomization—to control both intrinsic bias and for unknown unknowns—is important. It may be helpful to illustrate random assignment with the assistance of an image (Figure 3). The explanation will necessarily incorporate some components of the scientific method and research integrity, thereby reinforcing the necessity of maintaining the “blind” assignment, of completing research procedures as planned, and of reporting outcomes honestly.
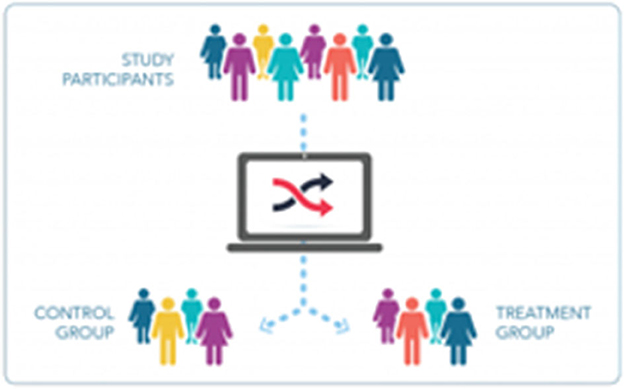
Figure 3. Graphics help to complement verbal or written explanations. The graphic presented here illustrates the concept of randomization.
The validity of the scientific results depends upon enrolled participants following through on the study plan (Eliasson et al., 2020) and therefore requires that participants understand expectations. In this regard, attention to health numeracy via verbal explanations and graphical representations can support a participant's ability to follow-through with study expectations, to which we now turn.
Understanding dates, times and schedules
In many cases, clinical research participation requires participants to plan for and accommodate the study activities within the necessities of their other daily responsibilities. Interpreting a schedule of required research procedures (e.g., medication administration, laboratory and radiographic tests, clinic or home visits, timely completion of outcome measurements, etc.), often included in participant instructions, requires health numeracy skills. The formal tabular study schemas that are used in research are often unfamiliar to participants, dense with information, and complicated to interpret (Figure 4A). Schedules often start with “Day 0” or even “Day −28;” and language is often intended for study teams and not for the participant.
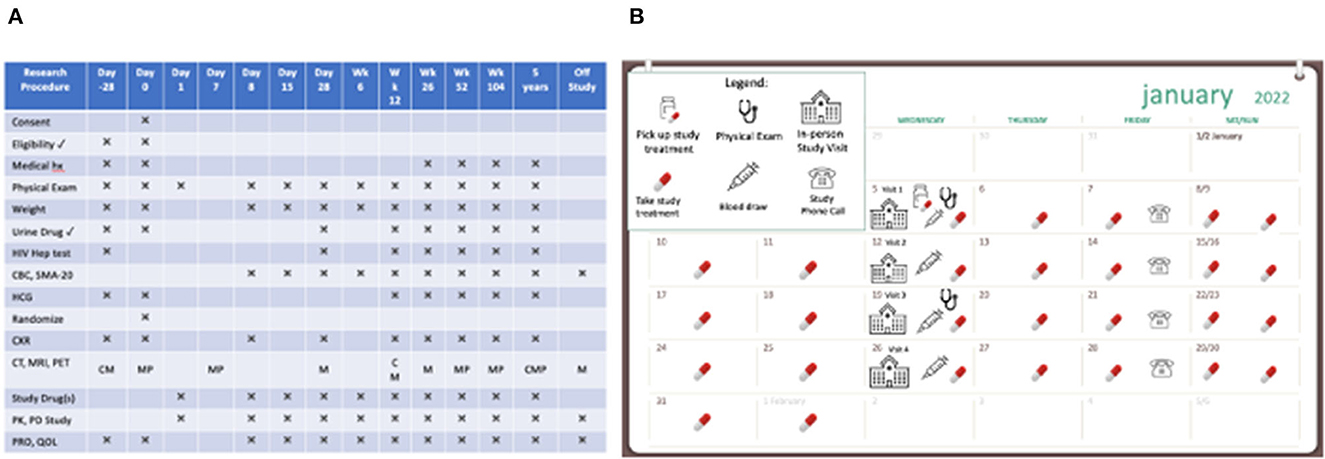
Figure 4. Two presentations of scheduled clinical trial events. (A) A dense and complex schedule of events in a clinical research study. (B) A user-friendly calendar to show how study activities fit into the participant's day-to-day life.
Tools to support participant follow-through, especially as they pertain to study schedules and calendars, the frequency and duration of study visits, specific procedures and timing, and other expectations (e.g., patient-reported outcome diaries) can be helpful. Considering different visual (and verbal) approaches can be beneficial for participants and their ability to complete the study (Figure 4B). For example, calendars can be based on actual calendar month, day, and year, and annotated with visible marks or icons that give the study context and allow the participant to visualize participation in the context of their other life responsibilities (Payne, 1993; Tungare et al., 2008; Weber and Pollack, 2008). Medication schedules should be clear, visual, based on time of day with other needed instructions available (Figure 5) and buttressed by reminders (e.g., phone calls/voice messages, texts, and emails), as appropriate (Fenerty et al., 2012; Costa et al., 2015).
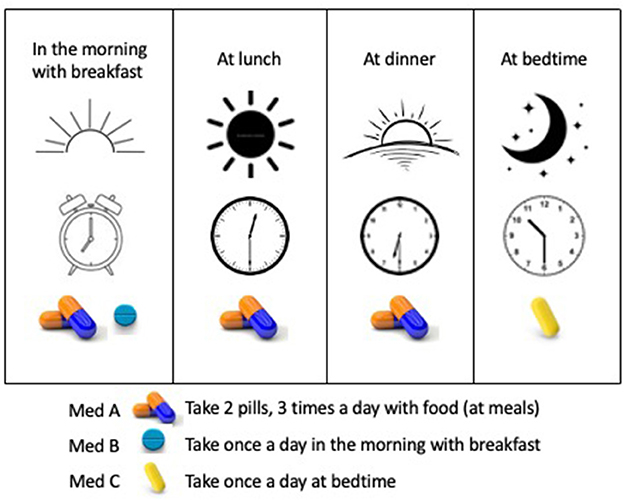
Figure 5. A user-friendly medication schedule using time of day and medication visuals. The schedule is explained in words and illustrated by time of day visualized by sunrise to sunset, clocks depicting the intended time, and images of the medications to be taken.
Following numbers-based instructions
Throughout the clinical trial journey, a participant is frequently expected to follow numbers-based instructions, including the frequency of specific procedures, dosage calculations, or steps for preparing and taking a study medication. Dense, written information (Figure 6A) should be replaced with instructions that are plain language, adequately spaced, with visual representations of the activity (Figure 6B). Visuals can show action tasks and augment informational text (Wolf et al., 2011; Mullen et al., 2018; U.S. Food Drug Administration, 2022). For example, a well-planned graphic allows a participant to more fully understand how to safely store, handle, use, and dispose of an investigational product.
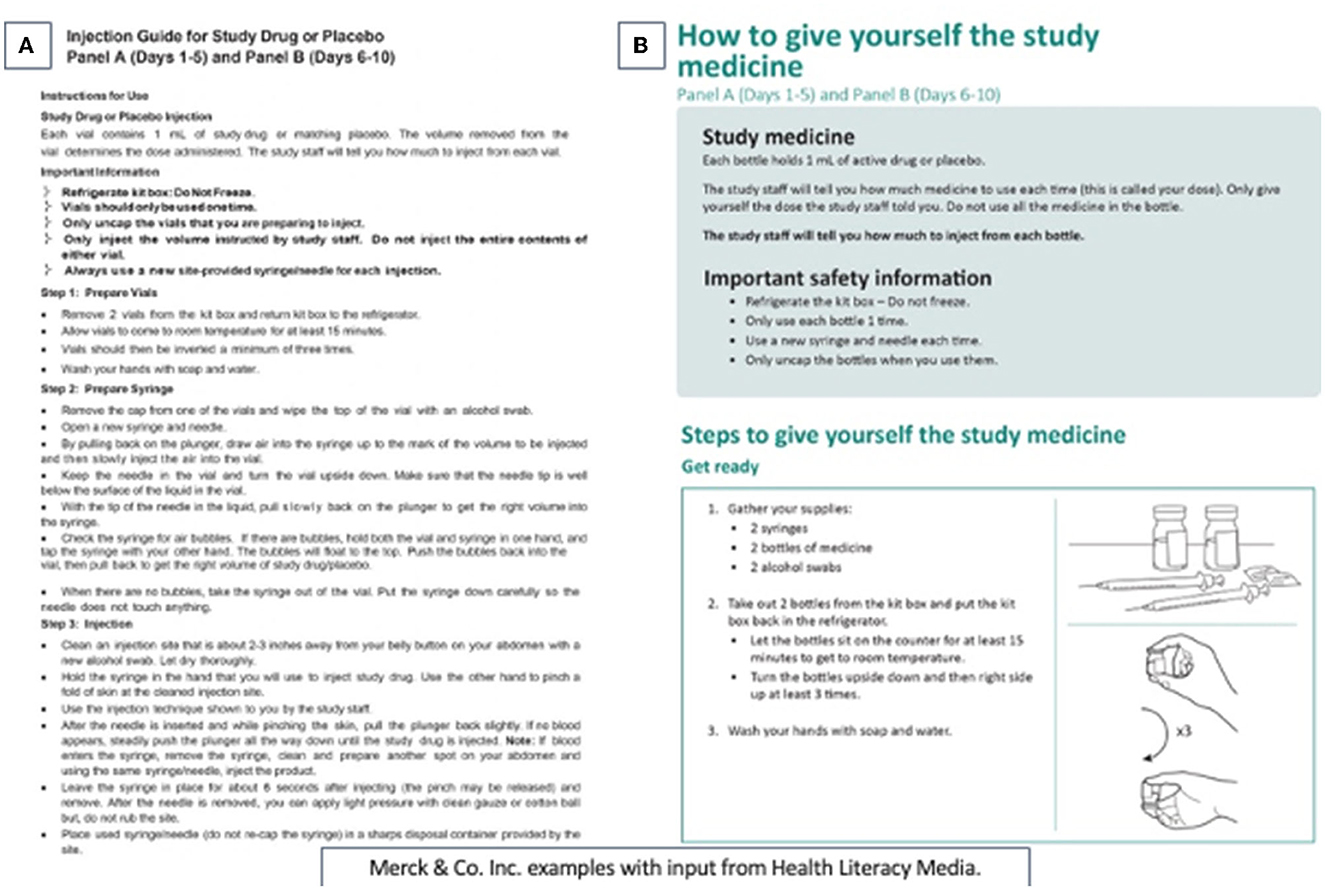
Figure 6. Health literate and visual representation of medication administration instructions. (A) Difficult to follow instructions on how to prepare and administer the study medication. (B) A participant-centric health numeracy approach to presenting instructions on how to take the study medication. This image is used with permission from Merck and Health Literacy Media.
Interpreting scales and graphs
Identifying the right graphical tool for presenting specific information so that it is balanced, non-promotional, and interpretable can be challenging. If charts or graphs are shown, they should be fit-for-purpose and based on best practices (Ancker and Kaufman, 2007; Tomboc, 2021; Tableau, 2022) whenever possible.
The choice of the graph or visualization depends upon the relationship of the variables being presented, as well as the ease of interpretation. A bar chart is often useful for different groups or categories measured on the same scale or endpoint, where the comparison between the different groups is important. Line graphs show changes or trends, often over linear time. Ratios are shown by icon arrays and pie charts (Figures 1A, B; Table 2); many other simple (e.g., scatter plot) and complex (e.g., interactive, geophysical, and geospatial maps; heat maps) visualizations exist. What is important is that the data are represented faithfully, that the axes start at zero unless well-explained and highlighted on the graph, that the relationships between the measured variables are based in science (e.g., categorical subgroups can be arrayed in a bar chart but not a line graph), and the graphic representation is balanced.
Presenting balance between positive and negative data is especially important in clinical research when a primary objective of showing that information is to help the participant make voluntary decisions consistent with their values and current state, especially since individuals with low health literacy are more likely to overestimate risk (Zikmund-Fisher et al., 2014). It can be difficult to recognize “nudging”, or presenting data to emphasize one outcome over another (Figures 1A, B), which is a concept borrowed from behavioral economics (Sunstein and Thaler, 2008). On one side, nudging in medicine can be used to promote better prescribing behavior (Lamprell et al., 2021), in decision-support in learning health systems (Chen et al., 2022), and in clinical research, to increase enrollment (VanEpps et al., 2016). But when helping participants understand clinical research where uncertainty is embedded in the science, data, and decision-making, the responsibility of the communicator is to be balanced, fair, and non-promotional. Whether nudging should be used to increase enrollment (VanEpps et al., 2016) requires further study to ensure participants' fair understanding of the decisions before them. A study finding that 20% of participants had their tumor shrink must be presented with the accompanying finding that 80% of participants had their tumor stay the same or increase in size (Figure 1B). And communicators must consider that presenting the favorable result before the negative result might prime a listener to overemphasize the benefit, further highlighting the need for a measured communications approach to help address therapeutic misconception. The goal of visual presentation of the data is to avoid misinterpretation and misunderstanding.
Many patient-reported outcomes, surveys, and quality of life instruments rely on participants communicating their symptomatology, experience, level of agreement, or opinion through numerical scales. When conceptualizing any scale, consideration should be given to the order of presentation and accompanying explanation: on a scale of one to ten, is one best or worst? Each choice, whether a number or fillable circle, should be accompanied by an explanation in words (Figure 7). If appropriate, color variation can be used not only to indicate a continuum but also to align with the measure; the extremes of a scale can be anchored by images (Figure 7). Each of these methods (e.g., numerical scale, written explanation, image representation, color enhancements) should be user-tested and validated.
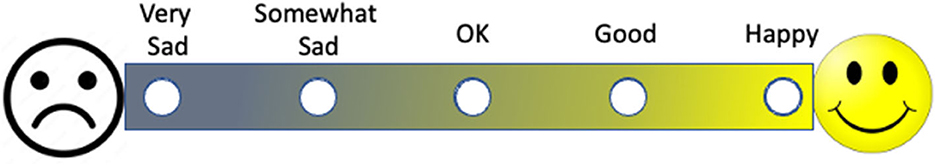
Figure 7. A visual patient reported outcome measure. Note that the outcome measure is represented by words, color, and images that complement one another.
Making sense of statistics, fractions, percentages, decimals, and ratios
Most numeric presentations involve the communication of fractions, percentages, decimals, ratios, and some statistics, often in conjunction with other complex written or graphical information. Different people process information differently; using verbal explanations, written descriptions, and graphic visualization can therefore optimize participant understanding by offering a variety of displays.
There are some general principles that should be understood as presented in Table 2 that outlines recommendations for communicating numeric information and examples of how numbers, graphical displays, and verbal explanations can be improved. Most importantly, the focus should be on presenting the information that a “reasonable person” would wish to know to make a well-reasoned decision. The inclusion of key information is a requirement in informed consent documents for research supported or conducted by the U.S. federal government (U. S. Department of Health Human Services, 2018), but there is little available guidance to unpack what a “reasonable person” would wish to know. Notably, few informed consent documents contain any graphics or visualizations; providing consent through electronic media will allow for graphics, audio, video and interactive formats in addition to text (U.S. Food and Drug Administration, 2015). While video-enhanced electronic informed consents are time-intensive, expensive to prepare, and difficult to modify after development, they hold promise for prospective and enrolled participants, will increase accessibility for people with disabilities and with limited language proficiency, and are likely to enhance understanding and engagement.
Discussion
We have illuminated multiple opportunities across the clinical research life cycle to communicate numeric clinical research information and factors to consider when communicating quantitative information and engaging in related conversations. To further support the integration of health numeracy strategies in clinical research, it can be helpful to adopt a strategy for developing numeric information and testing how well it is understood. Below we outline recommendations to consider (see also Table 3).
• Communicators should first identify the content and the information that should optimally be presented and explained. Recognizing that health numeracy and plain language are complementary, communicating quantitative information will likely benefit from graphics, and graphics or visuals benefit from written and verbal explanations. It is generally helpful to use plain language to explain numeric terms and concepts in order to maximize patient, participant, and caregiver understanding. Starting with a summary of key concepts, simplified written explanations, and uncomplicated visuals that inform the content will maximize its impact. For example, a recruitment flyer might show the frequency of study visits and whether reimbursement or compensation will be available to support participation if the person is eligible, while an informed consent form emphasize the likelihood and severity of risks and the potential benefits of the research as well as available alternatives, in addition to study procedures.
• Communicators should determine the intent of the content. Clarifying the purpose of the information, and what is expected of the recipient of the information, will guide the choice of visualizations. Is the recipient asked to compare two options simply for their understanding or because they need to choose between them? Is the recipient expected to do something after reviewing the content, such as aliquot a vial of medicine into different doses? If a participant is instructed to fast after midnight, adding an icon on the study calendar that indicates “no food” will highlight that breakfast should be skipped until after the study visit.
• Knowledge of the community, populations, and the audience is foundational to successful communication, Greater patient and community engagement will influence not only how information is imparted, but also what information is important to the audience; communicators can solicit potential participants, community members, and other subject matter experts for that information. These representatives can also guide whether selected visualizations buttress understanding. Unexpected observations or suggestions may be proffered: image placement and styling guides, for instance, differ for communities whose language is read right to left (Shadeed, 2022).
• Communicators should understand the context and circumstances under which patients and participants will be receiving the numeric information. Proficiency and understanding of health numeracy are sensitive to the context in which the numeracy skills must be applied. Cognitive burden (e.g., stress) at the time of information receipt will impact receptivity and comprehension; supportive visual information should be prepared accordingly.
• Having considered the content, audience, intent, and context, communicators can then identify different model presentation options that could be used to convey the intended messages. For example, if the principal focus is risk information, then an icon array might be most appropriate. What are the categories and what colors would be best? What denominator should be used? Draft graphics should be compared to select the one that, when tested with the intended audience (see below), best conveys the intended message.
• Visuals should be reviewed for implicit biases. If 65% of participants in a low back pain study experienced a decrease in pain, is it clear that 35% did not? Were characteristics of participants who did not respond identified? Considering how numeric information may be misunderstood or be unintentionally (and potentially inappropriately) influential to the audience is an important responsibility.
• The information should be presented in an accessible format for the population, including people with disabilities or people whose preferred language is other than English. Whether the information will be presented on paper, through an electronic format or on a website will impact how all individuals will interact with the content. Consideration of factors such as size, font choice, color, contrast, alternative (alt) text to describe web images, screen readers, and auditory pronunciation guides may help augment the user experience.
• Finally, communicators should routinely conduct usability testing of the proposed final product with individuals who are representative of the intended audience (Krug, 2010). User feedback will demonstrate whether the numeric information is likely to be understood as intended. Usability testing is the preferred method to determine whether the numeric representation is achieving its purpose.
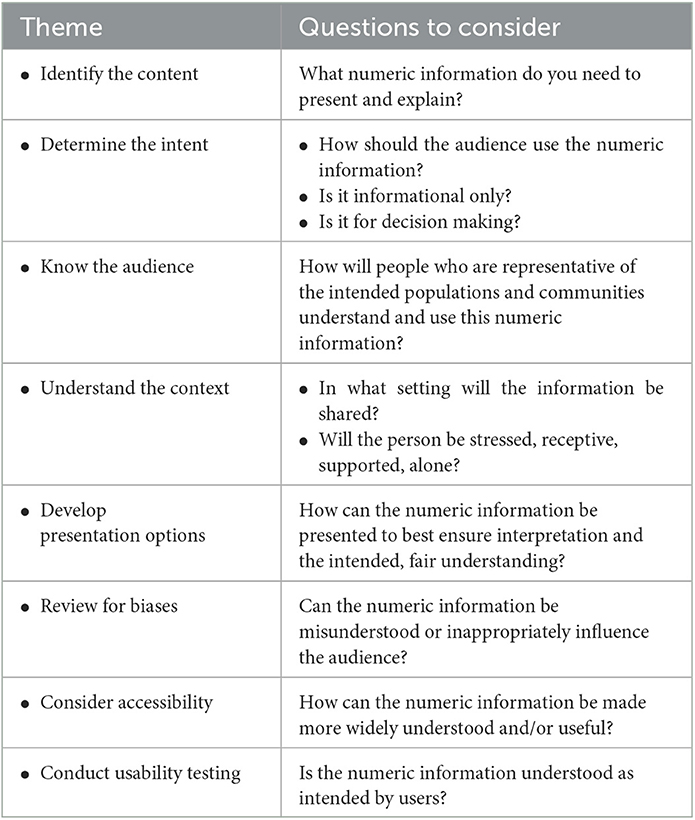
Table 3. Considerations when developing meaningful numeric information.
Further, beyond conducting usability testing of specific materials and communications, the inclusion of the patient and participant perspective from early in the clinical development process is one way to increase the likelihood that content, including numeric information, is presented in ways that support and maximize understanding. Industry and academic researchers benefit from the involvement by patients and patient advocates early and throughout the clinical research life cycle (Patient Focused Medicines Development, 2018). Such engagement allows for areas of improvement to be identified (Health Resources Services Administration, 2015), especially related to social determinants of health, culture, native language, and other factors such as migrant status that might affect the understanding of numeric information and thus inform the development of more suitable materials. It is through the integration of diverse patient and participant perspectives that understandable, empowering clinical research materials can be disseminated. This is especially important when conducting research with patients and participants who identify as members of historically marginalized and minoritized communities.
Conclusion
Health numeracy impacts individual patient- and participant-related understanding, decision-making, and participation throughout the clinical research life cycle. A person's decision to enroll and remain in clinical research should be a deliberate and reasoned decision based, in part, on the measured presentation and interpretation of clear, relevant information. We must endeavor to design and develop content, including numeric information, to be understandable and actionable to the audiences we engage.
Author contributions
BEB and SBK conceptualized the content of this article, and wrote, edited, and finalized the manuscript. Both authors contributed to the article and approved the submitted version.
Conflict of interest
The authors declare that the research was conducted in the absence of any commercial or financial relationships that could be construed as a potential conflict of interest.
Publisher's note
All claims expressed in this article are solely those of the authors and do not necessarily represent those of their affiliated organizations, or those of the publisher, the editors and the reviewers. Any product that may be evaluated in this article, or claim that may be made by its manufacturer, is not guaranteed or endorsed by the publisher.
References
Agency for Healthcare Research Quality (2014). The SHARE Approach – Essential Steps of Shared Decisionmaking: Expanded Reference Guide with Sample Conversation Starters. Available online at: https://www.ahrq.gov/health-literacy/professional-training/shared-decision/tool/resource-2.html (accessed April 26, 2023).
Ancker, J. S., and Kaufman, D. (2007). Rethinking health numeracy: a multidisciplinary literature review. J. Am. Med. Inform. Assoc. 14, 713–721. doi: 10.1197/jamia.M2464
Appelbaum, P. S., Roth, L. H., Lidz, C. W., Benson, P., and Winslade, W. (1987). False hopes and best data: consent to research and the therapeutic misconception. Hastings Cent. Rep. 17, 20–24. doi: 10.2307/3562038
Attarwala, H. (2010). TGN1412: from discovery to disaster. J. Young Pharm. 2, 332–336. doi: 10.4103/0975-1483.66810
Baedorf Kassis, S., White, S. A., Myers, L., Trudeau, C., and Bierer, B. E. (2019). Advancing Health Literacy in Clinical Research: Clear Communications for Every Participant. N.A.M. Perspectives. Washington, DC: Commentary, National Academy of Medicine.
Benjamin, D. M., Hey, S. P., MacPherson, A., Hachem, Y., Smith, K. S., Zhang, S. X., Wong, S., Dolter, S., Mandel, D. R., and Kimmelman, J. (2022). Principal investigators over-optimistically forecast scientific and operational outcomes for clinical trials. PLoS ONE 17, e0262862. doi: 10.1371/journal.pone.0262862
Berger, V. W., Bour, L. J., Carter, K., Chipman, J. J., Everett, C. C., Heussen, N., et al. (2021). A roadmap to using randomization in clinical trials. BMC Med. Res. Methodol. 21, 168. doi: 10.1186/s12874-021-01303-z
Bhise, V., Rajan, S. S., Sittig, D. F., Morgan, R. O., Chaudhary, P., and Singh, H. (2018). Defining and measuring diagnostic uncertainty in medicine: a systematic review. J. Gen. Intern. Med. 33, 103–115. doi: 10.1007/s11606-017-4164-1
Brase, G., Cosmides, L., and Tooby, J. (1998). Individuation, counting, and statistical inference: the role of frequency and whole-object representations in judgment under uncertainty. J. Exp. Psychol. 127, 3–21. doi: 10.1037/0096-3445.127.1.3
C.I.O.M.S. (2016). International Ethical Guidelines for Health-related Research Involving Humans, 4th Edn. Geneva: Council for International Organizations of Medical Sciences.
Chen, Y., Harris, S., Rogers, Y., Ahmad, T., and Asselbergs, F. W. (2022). Nudging within learning health systems: next generation decision support to improve cardiovascular care. Euro. Heart J. 43, 1296–1306. doi: 10.1093/eurheartj/ehac030
Costa, E., Giardini, A., Savin, M., Menditto, E., Lehane, E., Laosa, O., Pecorelli, S., Monaco, A., and Marengoni, A. (2015). Interventional tools to improve medication adherence: review of literature. Patient Prefer. Adher. 9, 1303–1314. doi: 10.2147/PPA.S87551
Coyle, M., and Gillies, K. (2020). A systematic review of risk communication in clinical trials: How does it influence decisions to participate and what are the best methods to improve understanding in a trial context? PLoS ONE 15, e0242239. doi: 10.1371/journal.pone.0242239
Eliasson, L., Clifford, S., Mulick, A., Jackson, C., and Vrijens, B. (2020). How the EMERGE guideline on medication adherence can improve the quality of clinical trials. Br. J. Clin. Pharmacol. 86, 687–697. doi: 10.1111/bcp.14240
Emanuel, E. J., Wendler, D., and Grady, C. (2000). What makes clinical research ethical? JAMA 283, 2701–2711. doi: 10.1001/jama.283.20.2701
European Medicines Agency (2017). Revised Guideline on First-in-Human Trials. Available online at: https://www.ema.europa.eu/en/news/revised-guideline-first-human-clinical-trials (accessed November 6, 2022).
Fehr-Duda, H., Epper, T., Bruhin, A., and Schubert, R. (2011). Risk and rationality: the effects of mood and decision rules on probability weighting. J. Econ. Behav. Organ. 78, 14–24. doi: 10.1016/j.jebo.2010.12.004
Fenerty, S. D., West, C., Davis, S. A., Kaplan, S. G., and Feldman, S. R. (2012). The effect of reminder systems on patients' adherence to treatment. Patient Prefer. Adher. 6, 127–135. doi: 10.2147/PPA.S26314
Gigerenzer, G., Gaissmaier, W., Kurz-Milcke, E., Schwartz, L. M., and Woloshin, S. (2007). Helping doctors and patients make sense of health statistics. Psychol. Sci. 8, 53–96. doi: 10.1111/j.1539-6053.2008.00033.x
Gluud, L. L. (2006). Bias in clinical intervention research. Am. J. Epidemiol. 163, 493–501. doi: 10.1093/aje/kwj069
Golbeck, A. L., Ahlers-Schmidt, C. R., Paschal, A. M., and Dismuke, S. E. (2005). A definition and operational framework for health numeracy. Am. J. Prev. Med. 29, 375–376. doi: 10.1016/j.amepre.2005.06.012
Health Resources Services Administration (2015). Health Literacy and Patient Engagement. Available online at: https://www.hrsa.gov/sites/default/files/hrsa/advisory-committees/primarycare-dentist/reports/report-2015.pdf (accessed April 26, 2023).
Kim, K., and Lee, Y. M. (2018). Understanding uncertainty in medicine: concepts and implications in medical education. Korean. J. Med. Educ. 30, 181–188. doi: 10.3946/kjme.2018.92
Kripalani, S., Heerman, W. J., Patel, N. J., Jackson, N., Goggins, K., Rothman, R. L., et al. (2019). Association of health literacy and numeracy with interest in research participation. J. Gen. Intern. Med. 34, 544–551. doi: 10.1007/s11606-018-4766-2
Krug, S. (2010). Rocket Surgery Made easy: The Do-It-Yourself Guide to Finding and Fixing Usability Problems. Thousand Oaks, CA: New Riders Publishing.
Lamprell, K., Tran, Y., Arnolda, G., and Braithwaite, J. (2021). Nudging clinicians: a systematic scoping review of the literature. J. Eval. Clin. Pract. 27, 175–192. doi: 10.1111/jep.13401
Lipkus, I. M. (2007). Numeric, verbal, and visual formats of conveying health risks: suggested best practices and future recommendations. Med. Decis. Making 27, 696–713. doi: 10.1177/0272989X07307271
Lipkus, I. M., and Hollands, J. G. (1999). The visual communication of risk. J. Natl. Cancer Inst. Monogr. 25, 149–163. doi: 10.1093/oxfordjournals.jncimonographs.a024191
Mendenhall, W., Beaver, R. J., and Beaver, B. M. (2012). Introduction to Probability and Statistics, 13th Edn. Belmont, CA: Brooks/Cole Cengage Learning. Available online at: https://3lihandam69.files.wordpress.com/2015/10/william_mendenhall_robert_j-_beaver_barbara_m-_bookfi-org.pdf
Miller, F. G., and Brody, H. (2003). A critique of clinical equipoise: therapeutic misconception in the ethics of clinical trials. Hast. Cent. Rep. 33, 19–28. doi: 10.2307/3528434
Mullen, R. J., Duhig, J., Russell, A., Scarazzini, L., Lievano, F., and Wolf, M. S. (2018). Best-practices for the design and development of prescription medication information: a systematic review. Patient Educ. Couns. 101, 1351–1367. doi: 10.1016/j.pec.2018.03.012
Naik, G., Ahmed, H., and Edwards, A. G. (2012). Communicating risk to patients and the public. Br. J. Gen. Pract. 62, 213–216. doi: 10.3399/bjgp12X636236
Nielsen-Bohlman L. Panzer A. M. Kindig D. A. and Committee on Health Literacy (2004). Health Literacy: A Prescription to End Confusion. Washington, DC: Institute of Medicine. The National Academies Press.
Nusbaum, L., Douglas, B., Damus, K., Paasche-Orlow, M., and Estrella-Luna, N. (2017). Communicating risks and benefits in informed consent for research: a qualitative study. Glob. Qual. Nurs. Res. 4, 2333393617732017. doi: 10.1177/2333393617732017
O.E.C.D. (2019). “Numeracy proficiency among adults: Percentage of adults scoring at each proficiency level in numeracy,” in Skills Matter: Additional Results from the Survey of Adult Skills. Available online at: https://www.oecd.org/skills/piaac/publications/countryspecificmaterial/PIAAC_Country_Note_USA.pdf (accessed November 6, 2022).
Patient Focused Medicines Development (2018). Research on Patient Engagement (PE): A Literature and Framework Analysis. Available online at: http://patientfocusedmedicine.org/docs/research-on-patient-engagement-whitepaper.pdf (accessed May 2, 2023).
Payne, S. J. (1993). Understanding calendar use. Hum. Comput. Interact. 2, 83–100. doi: 10.1207/s15327051hci0802_1
Petrova, D. G., Van der Pligt, J., and Garcia-Retamero, R. (2014). Feeling the numbers: on the interplay between risk, affect, and numeracy. J. Behav. Decis. Mak. 27, 191–19. doi: 10.1002/bdm.1803
Post, D. L., and Goode, W. E. (2020). Palette designer: a color-code design tool. Displays 61, 101929. doi: 10.1016/j.displa.2019.101929
Reyna, V. F., and Brainerd, C. (2008). Numeracy, ratio bias, and denominator neglect in judgments of risk and probability. Learn. Individ. Differ.18, 89–107. doi: 10.1016/j.lindif.2007.03.011
Reyna, V. F., Nelson, W. L., Han, P. K., and Dieckmann, N. F. (2009). How numeracy influences risk comprehension and medical decision making. Psychol. Bull. 135, 943–973. doi: 10.1037/a0017327
Schapira, M. M., Fletcher, K. E., Gilligan, M. A., King, T. K., Laud, P. W., Matthews, B. A., et al. (2008). A framework for health numeracy: how patients use quantitative skills in health care. J. Health Commun. 13, 501–517. doi: 10.1080/10810730802202169
Shadeed, A. (2022). RTL Styling 101: An Extensive Guide on How to Style for RTL in CSS. Available online at: https://rtlstyling.com/posts/rtl-styling (accessed November 8, 2022).
Shen, J., Swift, B., Mamelok, R., Pine, S., Sinclair, J., and Attar, M. (2019). Design and conduct considerations for first-in-human trials. Clin. Trans. Sci. 12, 6–19. doi: 10.1111/cts.12582
Sunstein, C. R., and Thaler, R. H. (2008). Nudge: Improving Decisions About Health, Wealth, and Happiness. New Haven, CT: Yale University Press.
Suntharalingam, G., Perry, M. R., Ward, S., Brett, S. J., Castello-Cortes, A., Brunner, M. D., and Panoskaltsis, N. (2006). Cytokine storm in a phase 1 trial of the anti-CD28 monoclonal antibody TGN1412. N. Engl. J. Med. 355, 1018–1028. doi: 10.1056/NEJMoa063842
Suresh, K. (2011). An overview of randomization techniques: an unbiased assessment of outcome in clinical research. J. Hum. Reprod. Sci. 4, 8–11. doi: 10.4103/0974-1208.82352
Tableau (2022). What Is Data Visualization? Definition, Examples, And Learning Resources. Available online at: https://www.tableau.com/learn/articles/data-visualization (accessed November 6, 2022).
The National Commission for the Protection of Human Subjects of Biomedical Behavioral Research (1979). Belmont Report. Available online at: http://www.hhs.gov/ohrp/humansubjects/guidance/belmont.html#xrespect (accessed November 6, 2022).
Tomboc, K. (2021). Data Visualization: The 10 Essential Types of Graphs and When You Want to Use Them. Available online at: https://piktochart.com/blog/types-of-graphs (accessed November 6, 2022).
Tungare, M., Perez-Quinones, M., and Sams, A. (2008). An exploratory study of calendar use. arXiv:0809.3447 [cs.HC] doi: 10.48550/arXiv.0809.3447
U.S. Food Drug Administration (1999). CFR – Code of Federal Regulations Title 21 Part 50 – Protection of Human Subjects Subpart B - Informed Consent of Human Subjects. Available online at: https://www.accessdata.fda.gov/scripts/cdrh/cfdocs/cfcfr/cfrsearch.cfm?fr=50.20 (accessed November 6, 2022).
U.S. Food Drug Administration (2015). Use of Electronic Informed Consent in Clinical Investigations Questions and Answers Guidance for Industry Draft Guidance. Available online at: http://www.fda.gov/downloads/Drugs/GuidanceComplianceRegulatoryInformation/Guidances/UCM436811.pdf (accessed November 6, 2022).
U.S. Food Drug Administration (2022). Instructions for Use — Patient Labeling for Human Prescription Drug and Biological Products — Content and Format Guidance for Industry. Available online at: https://www.fda.gov/media/128446/download (accessed November 6, 2022).
U. S. Department of Health Human Services (2018). Code of Federal Regulations, Protection of Human Subjects. Available online at: https://www.hhs.gov/ohrp/regulations-and-policy/regulations/45-cfr-46/revised-common-rule-regulatory-text/index.html (accessed November 6, 2022).
U. S. Department of Health Human Services (2019). Health Literacy in Healthy People 2030. Available online at: https://health.gov/healthypeople/priority-areas/health-literacy-healthy-people-2030 (accessed November 6, 2022).
VanEpps, E. M., Volpp, K. G., and Halpern, S. D. (2016). A nudge toward participation: improving clinical trial enrollment with behavioral economics. Sci. Trans. Med. 8, eaaf0946. doi: 10.1126/scitranslmed.aaf0946
Visualizing Health (2022). A Scientifically Vetted Style Guide for Communicating Health Data. Available online at: https://www.vizhealth.org. (accessed November 7, 2022).
Weber, J. S., and Pollack, M. E. (2008). “Evaluating user preferences for adaptive reminding,” in CHI'08 Extended Abstracts on Human Factors in Computing Systems. p. 2949–2954.
Wolf, M. S., Curtis, L. M., Waite, K., Bailey, S. C., Hedlund, L. A., Davis, T. C., et al. (2011). Helping patients simplify and safely use complex prescription regimens. Arch. Intern. Med. 171, 300–305. doi: 10.1001/archinternmed.2011.39
World Medical Association (2013). W.M.A. Declaration of Helsinki – Ethics Principles for Medical Research Involving Human Subjects. Available online at: https://www.wma.net/policies-post/wma-declaration-of-helsinki-ethical-principles-for-medical-research-involving-human-subjects/ (accessed November 6, 2022).
Zikmund-Fisher, B. J., Mayman, G., and Fagerlin, A. (2014). “Patient numeracy: what do patients need to recognize, think, or do with health numbers?,” in Numerical Reasoning in Judgments and Decision Making About Health, eds B. L. Anderson, and J. Schulkin (Cambridge: Cambridge University Press),80–101.
Keywords: clinical research, health literacy, numeracy, data visualization, risk, communication
Citation: Bierer BE and Baedorf Kassis S (2023) Communicating complex numeric information in clinical research. Front. Commun. 8:1096271. doi: 10.3389/fcomm.2023.1096271
Received: 15 November 2022; Accepted: 26 May 2023;
Published: 19 June 2023.
Edited by:
Joana Magalhães, Science for Change, SpainReviewed by:
Arri Eisen, Emory University, United StatesMichal Arbilly, Emory University, United States
Copyright © 2023 Bierer and Baedorf Kassis. This is an open-access article distributed under the terms of the Creative Commons Attribution License (CC BY). The use, distribution or reproduction in other forums is permitted, provided the original author(s) and the copyright owner(s) are credited and that the original publication in this journal is cited, in accordance with accepted academic practice. No use, distribution or reproduction is permitted which does not comply with these terms.
*Correspondence: Barbara E. Bierer, YmJpZXJlckBid2guaGFydmFyZC5lZHU=