 Nicole Holliday
- Department of Linguistics and Cognitive Science, Pomona College, Claremont, CA, United States
As speech technology is increasingly integrated into modern American society, voice assistants are a more significant part of our everyday lives. According to Apple, Siri fulfills 25 billion requests each month. As part of a software update in April 2021, users in the U.S. were presented with a choice of 4 Siris. While in beta testing, users on Twitter began to comment that they felt that some of the voices had racial identities, noting in particular that Voice 2 and Voice 3 “sounded black.” This study tests whether listeners indeed hear the different Siri voices as sounding like speakers from different groups, as well as examines voice quality features that may trigger these judgments. In order to test evaluations of the four voices, 485 American English listeners heard each Siri voice reading the Rainbow Passage, via online survey conducted on Qualtrics. Following each clip, listeners responded to questions about the speaker's demographic characteristics and personal traits. An LMER model of normalized ratings assessed the interaction of voice and race judgment revealed that indeed, Voice 2 and Voice 3 were significantly more likely to be rated as belonging to a Black speaker than Voices 1 and 4 (p < 0.001). Per-trait logistic regression models and chi-square tests examining ratings revealed Voice 3, the male voice rated as Black, was judged less competent (X2 = 108.99, x < 0.001), less professional (X2 = 90.97, p < 0.001), and funniest (X2 = 123.39, x < 0.001). Following analysis of listener judgments of voices, I conducted post-hoc analysis comparing voice quality (VQ) features to examine which may trigger the listener judgments of race. Using PraatSauce, I employed scripts to extract VQ measures previously hypothesized to pattern differently in African American English vs. Mainstream American English. VQ measures that significantly affected listener ratings of the voices are mean F0 and H1–A3c, which correlate with perceptions of pitch and breathiness. These results reveal listeners attribute human-like demographic and personal characteristics to synthesized voices. A more comprehensive understanding of social judgments of digitized voices may help us to understand how listeners evaluate human voices, with implications for speech perception and discrimination as well as recognition and synthesis.
1. Introduction
As the line between real life and online interactions becomes increasingly blurred, researchers seek to understand how linguistic production and perception may operate in digital spaces. In particular, understanding how humans interact with computational systems such as voice assistants, will likely become increasingly important for improving the function and fairness of the technologies as well as describing how language change may proceed in a digital world. Additionally, recent work has also begun to examine sociolinguistic questions related to bias and algorithmic inequality. According to Apple, Siri voice assistant fulfills more than 25 billion requests each month worldwide (Eckel, 2021). Siri debuted with a single U.S. English voice in 2010, but by April of 2021, U.S. users were presented with a choice of four different American English Siri voices1. While these four voices were undergoing beta testing, users on Twitter began to comment that two of the voices had racial identities, noting in particular that one of the voices “sounded black” (Waddell, 2021). The linguistic research on the perception of racialized voices, and especially voiced that are classified as “sounding Black” has been fairly robust since the 1950s, but such perceptions of synthesized voices as having racial identities have not yet been studied in sociolinguistics. The current study therefore aims to address the following questions:
• Do listeners hear the different Siri voices as sounding like speakers with different demographic characteristics, including region of origin, age, and race?
• What personality traits do listeners associate with the different Siri voices?
• What voice quality features may be associated with different listener judgments of voice assistants like Siri?
The paper is structured as follows. First, it begins with a discussion of how previous studies have examined listener judgments of race when presented with human voices. It then moves on to discuss work on the perception of synthesized voices in general. Subsequently, the methods and results of the perception study on how listeners evaluate the four Siri voices are discussed. The paper then presents a post-hoc analysis of voice quality features that correlate with these listener judgments, and finally concludes with a discussion of the results and their impacts for our understanding of racialized perception and interaction with voice assistants.
1.1. Perception of racialized voices
The question of how listeners engage in racial and ethnic identification of human voices has been explored in sociolinguistic research in the U.S. for over 60 years. In a comprehensive review article, Thomas and Reaser (2004) provide an overview of studies on ethnic identification up to that point, but research in this area has continued to grow over the past two decades. Despite intense interest, sociolinguists still have a number of remaining questions about the mechanisms by which listeners make racial and ethnic judgments, especially about disembodied voices. In general, the research has shown that American English listeners are extremely adept and accurate at racial identification tasks, even when presented with stimuli that have been filtered, or that consist of very little phonetic information, such as a single vowel. Thomas and Reaser (2004) discuss the results of 30 studies conducted between the early 1950s to the early 2000s that examined whether American English speakers can reliably differentiate Black and white speakers. In general, the studies they discuss find rates of accurate racial identification over 75%, and in some cases, over 90%. studies These studies employ a wide variety of speaker populations and methodologies and focus on different aspects of the linguistic signal that may be involved in speaker judgments. This is particularly of interest due to the fact that many of the studies have found accurate judgments on the basis of stimuli as limited as one vowel, indicating that the evaluations are about the properties of the voice itself as opposed to enregistered morphosyntactic features of ethnolinguistic varieties. As a result, the current discussion will focus primarily on those studies that aimed to understand the prosodic features that listeners rely on in forming such judgments. However, it is important to note that the relationship between segmental phonological features and prosodic features in perception is not well-understood, and has not been examined at all in studies of ethnic identification [though see Clopper and Pisoni (2004) and for discussion of the relationship in MAE]. In one of the earliest studies, Koutstaal and Jackson (1971) found that listeners were over 80% accurate in their racial identifications, though they were more accurate with white speakers than Black speakers. Importantly, this result demonstrates that listener confusion in such studies is not necessarily bidirectional, which is a consistent finding across many of the studies discussed by Thomas and Reaser (2004). Koutstaal and Jackson (1971) is particularly of interest because the study specifically observes intonation and timing differences between groups, though the author does not actually claim that these differences trigger the differences in listener judgments.
Purnell et al. (1999) found that naive listeners were over 70% accurate in differentiating African American English (AAE), Chicano English and Standard American English (SAE) guises on the basis of one word (in this case, “hello”). This study is unusual compared to others in the vein of ethnic identification, because it utilizes one speaker employing three different dialect guises. While there are certainly downsides to such a methodology, it has the advantage of being particularly useful for researchers interested in the phonetic properties that listeners may rely in making such judgements. The fact that the speaker was held constant across guises means that differences in voice quality features related to recording environment and the speaker's physical characteristics are significantly reduced, which was a persistent challenge for earlier studies. As a result, Purnell et al. (1999) are isolate a number of voice quality features that they believe may be involved in triggering listener judgments of ethnicity. Ultimately, the authors concluded that harmonics to noise ratio, select formant measurements, F0 peak and vowel duration play a significant role in influencing listener judgments. Of particular interest for the current study is the fact that the authors observe that lower HNR differentiates the AAE guise from the SAE guise, indicating a possible role of phonation type in influencing guise identification.
In addition to providing a summary of earlier work, Thomas and Reaser (2004) also conduct an experiment testing test ethnic identification among North Carolina speakers and listeners in original, monotonized, and low pass filtered stimuli. They find high levels of accuracy for the original and monotonous treatment among listeners, and close to chance results for the low-pass filtered condition. As a result, they conclude that manipulation of intonational contours does not significantly reduce listener accuracy, but that eliminating high portions of the acoustic signal containing segmental information does. These results provide evidence that perhaps listeners are especially attuned to segmental information and less attuned to intonational features, however this study does not specifically examine the role of voice quality or phonation. Overall, these studies show that both voice quality and segmental information likely play a role in listener judgments of race, but the specific features that may be involved are not yet well-understood. This is likely due at least in part to the methodological and technical difficulty of isolating variables from one another, as well as controlling natural variation in the speech signal due to speaker or recording quality properties. As a result, the role of suprasegmental features in ethnic identification is still not well-understood. The post-hoc analysis in the current study aims to expand our understanding of the contributions of these features, employing a novel method that controls for both recording quality and speaker variation that utilizes synthesized voices.
1.2. Perception of synthesized voices
Recent studies in the realm of linguistics and human-computer interaction have aimed to describe how humans respond to synthesized voices with different types of pseudo-demographic characteristics. This research complements more traditional linguistic work on topics such as speaker identification and ethnic identification by testing not only new types of voices, but also introducing a greater level of control over the properties of the voices used in such experiments. In general, these studies have found that listeners due attribute demographic and personality-type characteristics to both synthesized and natural voices. Additionally, listeners in studies of synthesized voices also reproduced the types of social biases that researchers have observed in studies of natural voices, especially with respect to gender. For example, several studies have found that humans are more likely to be abusive to digital assistants with female names and voices than those with male names and voices (Penny, 2016; Fossa and Sucameli, 2022). Similarly, Jackson et al. (2020) found that listeners judge “female-sounding” assistants more harshly than “male-sounding” robots when they do not comply with user directions, indicating gendered expectations about robot compliance (Jackson et al., 2020). While less work has been conducted on how listeners respond to voices that are evaluated differently based on perception of race, the results from these studies focused on gender provide evidence that listeners utilize social information to respond to voices, even when they are aware that the voices are non-human (Tamagawa et al., 2011; Baird et al., 2017).
Though the evidence is robust that humans readily attach social information to voices in both real-life and experimental situations, the specific linguistic criteria that are involved in such judgments is still not well-understood. Examining how listeners make such judgments on synthesized or partially synthesized voices provides a promising new area for social perception of voices. To begin with, speech synthesis technology has now advanced to the point that listeners can be deceived about whether they are hearing a natural or synthesized voice, allowing us to control for the effects of naturalness (Kühne et al., 2020). More importantly however, synthesized voices allow researchers to tightly control micro-level variation in the realms of intonation and voice quality, which is nearly impossible for naturalistic speech produced in the real-world, due to noise and the extreme level of both vocal control and metalinguistic awareness that would be required to elicit precise productions from humans. Synthesized speech therefore allows us to test and create stimuli that are more tightly controlled than the types previously employed in judgment tasks with natural human voices. In this way, we can isolate specific variables in order to arrive at a better understanding of which of them are most important for triggering social judgments on the part of listeners.
The current study focuses on Apple's proprietary voice assistant, Siri. Siri has undergone numerous updates and changes since it debuted in 2010, generally trending in the direction of more user options for Siri's voice. When Siri was first introduced, the only available American English voice was female, with an American English male voice later added in 2013, in part as a result of user complaints about gender stereotyping (Bosker, 2013). From 2013 to 2021, Apple's two options for Siri in the U.S. were explicitly labeled “American English female” and “American English male.” With the April 2021 upgrade, these voices were renamed, with the former “American English male” voice now labeled as “Voice 1,” and the former “American English female” voice now labeled as Voice 4. Voices 2 and 3 also debuted at this time, and while Apple never explicitly provided them with gendered labels, the introduction of the new “gender-neutral” Siri voice option, “Quinn,” in 2022, reinforced user claims that the previous 4 voices were explicitly gendered. As a result, the current study does not focus on gender, because unlike for other demographic characteristics, Apple explicitly stated the gender of the American English Siri voices prior to April 2021. During beta testing of the new 4-voice Siri paradigm introduced in 2021, users and the media began to express strong social impressions of the voices, especially the new options, Voice 2 and Voice 3. In a 2021 article in Consumer Reports, Waddell reports that some Twitter users explicitly labeled the new Voice 2 and Voice 3 as “sounding Black.” The perception study reported in the next section aims specifically to test claims about the demographic and personal characteristics that users attribute to each of the 4 Siri voices in order to better understand listener perceptions of digital voices. The study then builds on the results of that perception study to explore which voice quality features may be involved in triggering such judgments, which will help researchers and the public gain a better understanding of the properties of the voice involved in ethnic identification.
2. Methods and analysis: Listener perception of Siri voices
2.1. Methods
In order to address the question of what types of social and personality judgments listeners make about the 4 Siri voices, I designed a survey-based experiment, presented via Qualtrics. The study was conducted over 1 week in April 2021, while Apple's new Siri voices were still in the beta-testing stage in order to reduce the likelihood that listeners would recognize the voices. 485 listeners were recruited via the platform Prolific, which is designed to allow researchers to obtain high-quality research participants with specific demographic characteristics (www.prolific.co). All 485 participants were speakers of American English residing in the U.S. at the time of the survey. Prolific provides detailed demographic information about participants, which also allows researchers to examine potential effects of participant race, gender, region, etc. The listener group was composed of 50% participants who identified as female, 48% as male, and 2% as Non-binary or Other. For Race, 70% of listeners identified as white, 8% as Asian, 7% as Black, 6% as Multiracial, 5% as Latino/a/x, and the remaining 4% as Other. 27% of listeners were from the Northeast, 23% from the Midwest, 21% from the Southeast, 20% from the Southwest, and 9% from the Northwest.
Participants were told that they would be participating in a survey about how people react to different voices, and following the completion of a consent form, they heard each of the 4 Siri voices reading the Rainbow Passage (Fairbanks, 1960), in randomized order. Listeners were initially asked if they heard the clip well, and then were permitted to play the clip as many times as they wanted. Following the presentation of each voice, listeners were asked to respond to questions about the voice's race, region, and age (as categorical) and its personal characteristics (as 7-point Likert scales), following the methods employed by Holliday and Tano (2021). Participants were compensated at a rate of $7.50 per hour upon completion of the study, using Prolific's built-in payment methods.
After the study data was collected, analysis was conducted using a series of logistic and linear mixed effects regression models of normalized ratings for each property in order to assess the interaction of voice and demographic property/personality trait. The final models contained normalized demographic ratings by voice with main effects and interactions of the listener traits and random intercept per listener. I also then conducted a likelihood ratio test for omnibus testing of the demographic properties. With respect to the demographic characteristics of the voices, models for age, region and race all showed that listeners evaluated the voices differently from one another. However, listener demographic characteristics (including age, race, and region) had no significant effects for any of the models, so the results presented here will demonstrate overall judgments. Results for each demographic characteristic will be presented in turn, followed by the results for the ratings of personality traits.
2.2. Results of perception experiment testing demographic judgments by voice
2.2.1. Region
Overall, listeners are predisposed to rate the voices as more likely to be from the Northeast or Midwest than the Southeast, Southwest, or Northwest U.S. This may be in part a result of the fact that since the Siri voices all read the same passage, there is no morphosyntactic variation available for the listeners in their evaluations. As a result, they must rely primarily on prosodic and segmental phonological information in their evaluations. Varieties of English spoken in the Southwest and Northwest and somewhat less enregistered than those of other regions, and the Midwest is frequently ideologically painted as more “neutral” or general,” so in the absence of salient morphosyntactic variation, participants may be more likely to default to the less marked varieties (Carmichael, 2016). Figure 1 shows the results for listener judgments for each voice's region, with error bars representing the standard error.
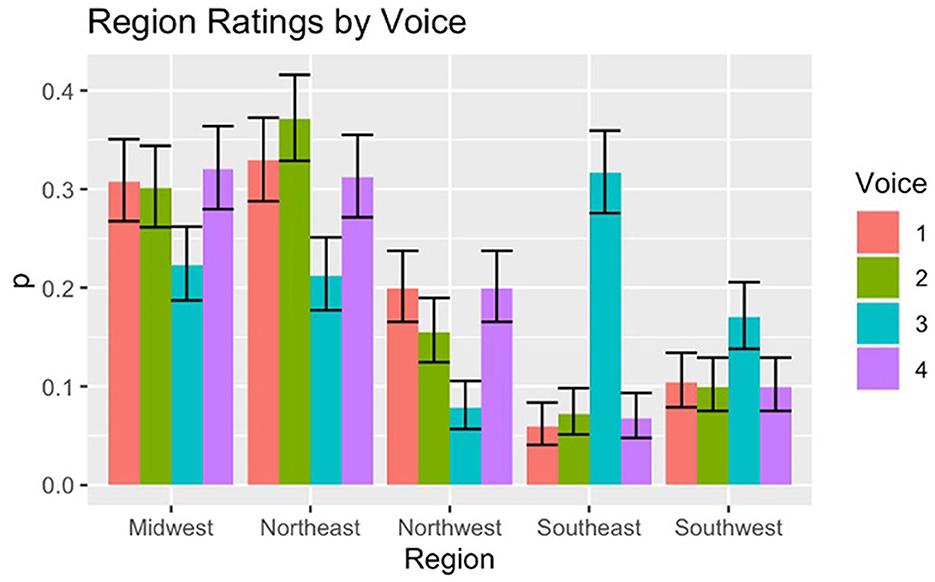
Figure 1. Ratings for region by voice.
There are some significant and informative differences between region judgements for the four Siri voices. 37% of listeners rated Voice 2 as from the Northeast, while none of the other voices had ratings that were significantly different between Midwest and Northeast. Listeners displayed a higher rate of confusion for Voice 3 than any of the others, with judgements fairly split between Northeast (22%) and Midwest (23%), with slightly fewer participants selecting Southwest (17%). Of particular interest for Voice 3 however, is the fact that it was significantly more likely to be labeled as “Southeast” (32%) than any of the other voices (< 8%). This result will be discussed in greater detail below in connection with the age and race ratings for Voice 3.
2.2.2. Age
Listener judgments for age are skewed toward the younger options presented in the survey, a result that has also been observed in other studies of synthesized voices (Baird et al., 2017). Overall, fewer than 5% of participants labeled any of the voices as over age 45. For the three age groups 18–25, 26–35, and 36–45, we do observe some differences between the 4 Siri voices. While all of the voices are most likely to be rated as age 26–35, Voices 1 and 2 are significantly less likely to be rated as 18–25 than as 26–35 or 36–45. Voice 4 is equally likely to be rated as 18–25 and 36–45, but 56% of listeners rated it as age 26–35. As with the results for region, Voice 3 is somewhat of an outlier. While Voice 3 is most likely to be rated as 26–35 (50%), it is also disproportionately likely to be rated as 18–25 (37%) when compared to the other 3 voices, as can be seen in Figure 2.
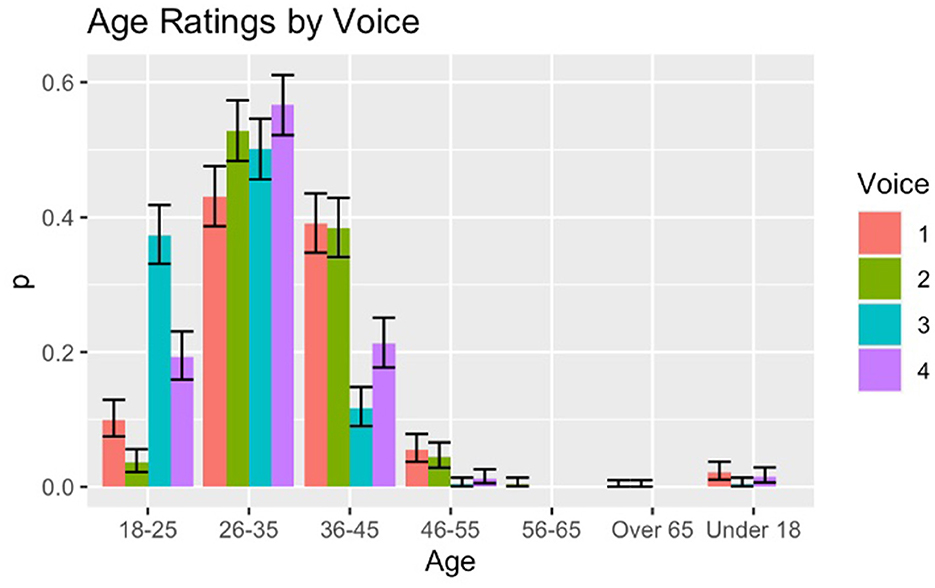
Figure 2. Ratings for age by voice.
The fact that the ages attributed to each voice differs somewhat is also informative. In particular, a picture is beginning to emerge such that Voice 3 patterns differently from the other 3 voices. Also, of note here is that fact that Voice 2 is the least likely to be rated as age 18–25, indicating that this voice heard as somewhat more mature. However, Voice 2 does pattern with voices 1 and 4 in terms of being likely to be rated as either 26–35 or 36–45, giving them roughly the same mean ratings for age.
2.2.3. Race
The original motivation for the survey was the claim by some users that Voices 2 and 3 “sounded Black,” so racial judgments are of particular interest for the current study (Waddell, 2021). The categorical options presented to listeners for race judgements were Asian, Black, Hispanic/Latino, Multiracial, and White. Of interest is the fact that listeners are overall biased toward selecting Black or White, mostly ignoring the other categories. This is perhaps unsurprising given results of previous studies showing a persistent bias among Americans for imagining race as binary (Alcoff, 2003; Kushins, 2014). Figure 3 shows the results for race ratings of each voice. Note that the category of “multiracial” is excluded from this plot; of the study's 485 listeners, only 8 ever selected the multiracial category for any of the voices.
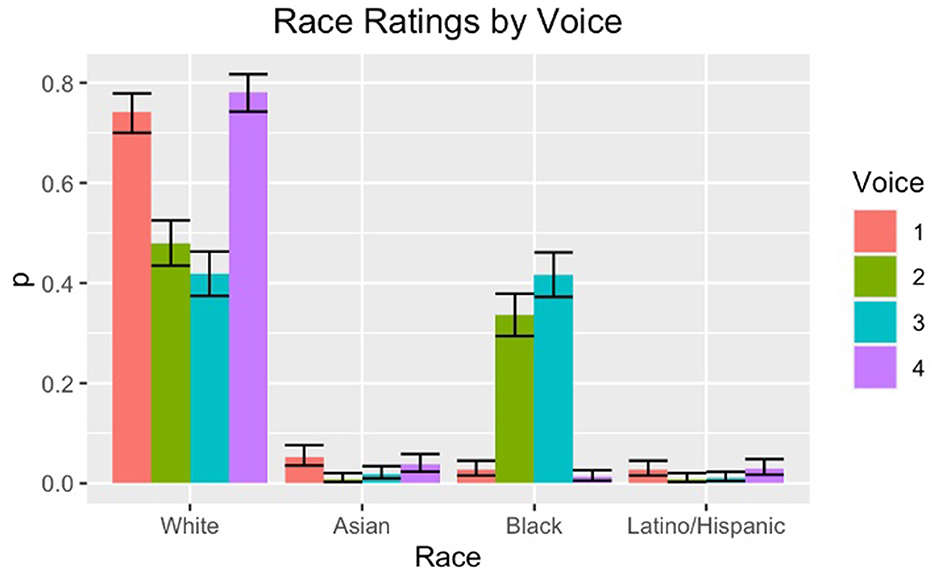
Figure 3. Ratings for race by voice.
When compared to the results for the ratings of other demographic traits, listeners are less divided on their ratings of race than they were for region or age. None of the listeners utilized the categories of Asian or Latino/Hispanic for any of the voices at a rate higher than 8%, likely due to the aforementioned bias toward racial binary categorization. With respect to the likelihood of the voices being rated as Black, only 3% of raters said that Voice 1 sounded Black, and only 1% of raters said that Voice 4 sounded Black. 73% of raters said that Voice 1 sounded white, and 78% of raters said that Voice 4 sounded white. Recall that Voice 1 was previously named “American English Male” and Voice 4 was previously named “American English Female,” while Voices 2 and 3 were newly introduced.
With respect to the voices being rated as Black. Voices 2 and 3 pattern quite differently than the other two voices. 37% of listeners rated Voice 2 as Black, while 42% rated Voice 3 as Black. While each of these numbers is still slightly lower than the probability of Voice 2 and Voice 3 being rated as White, the fact that the ratings for race pattern so differently for these Voices than they do for Voices 1 and 4 is informative. Overall, we observe a pattern such that these newly introduced voices are much more likely to be rated as Black than the older Siri voices.
2.2.4. Summary of demographic characteristics for the voices
Overall, listeners are predisposed to rate the four Siri voices is from the Midwest or Northeast, aged 18–45, and white. However, the differences in the probabilities of ratings for region, age, and race between the 4 Voices does reveal that listeners as a group react to and evaluate the voices in different ways. Table 1 shows the overall results for the demographic ratings of each voice as well as Apple's gender categorization for them. Where there was no clear majority between choices for any given category, both categories are displayed alongside the percentage of listeners who chose each option.
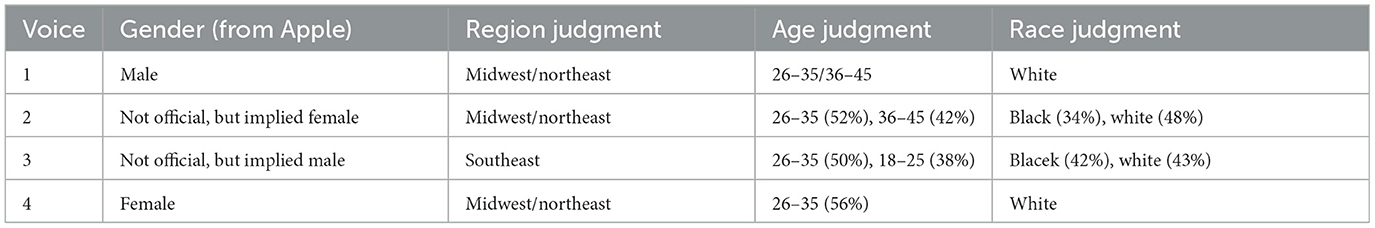
Table 1. Most frequent listeners ratings by gender/region/age/race for each Siri voice.
Voice 3 is significantly more likely to be rated as from the Southeast than any of the others, likely overlapping with the fact that it is also the voice most likely to be rated as Black. Sociolinguists have documented significant feature overlap between many Southern White varieties and African American English, as result of the fact that AAE originated in the South (Wolfram, 2007). Additionally, African American English is often inaccurately stereotyped as youth slang in the public imagination, which is also likely a factor contributing to Voice 3's judgments as younger than the others (Green, 2002). Overall, listeners have a markedly different reaction to Voice 3's demographic properties than any of the other voices. When compared with Voices 1 and 4, listeners also demonstrate significantly more ambiguity in their judgments of Voice 2. Voice 2 is significantly more likely to be rated as “Black,” but also as from the Northeast. Overall, these results demonstrate that listeners judge the demographic properties of Voices 2 and 3 differently than Voices 1 and 4, in particular, being much more likely to rate them as Black.
2.3. Results of perception experiment testing personality traits by voice
2.3.1. Personal characteristics by voice
In order to arrive at a more holistic picture of how listeners may evaluate the different Siri voices, the survey also asked them to rate each voice for four personal characteristics, on a 7-point Likert scale. The characteristics of interest were friendliness, professionalism, funniness and competence following the methods of Holliday and Tano (2021). Analysis of this data was conducted via per-trait regression models and chi square tests. In general, there are few differences between how the voices are rated for each trait, with most participants rating all of the voices fairly highly on all 4 characteristics. Figure 4 shows the results for per-trait ratings for each voice.
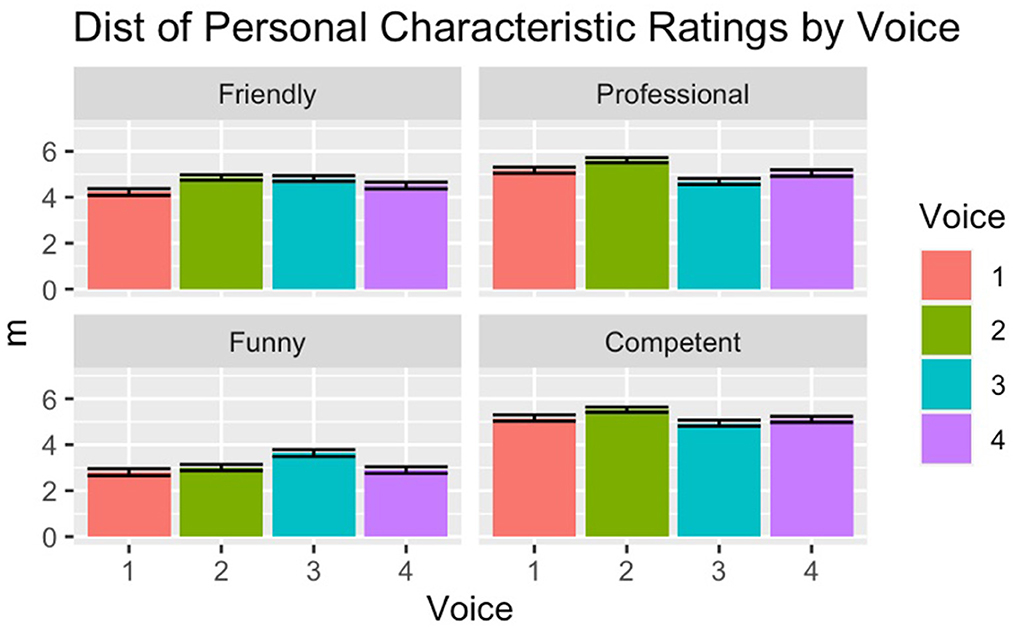
Figure 4. Ratings for personal characteristics by voice.
The primary difference in ratings, according to the per-trait logistic regression models and chi-square tests, is that Voice 3, the male voice rated as black and younger, was rated less competent (X2 = 108.99, x < 0.001), less professional (X2 = 90.97, p < 0.001), and funnier (X2 = 123.39, x < 0.001). Interestingly, this is a pattern similar to what we observe when listeners are asked to rate human voices; they display a persistent negative bias against Black voices for traits related to competence, but usually a positive bias for traits related to sociability (Kushins, 2014; King et al., 2022).
One additional finding of interest emerges, with respect to Voice 1 and listener ratings of friendliness. The other 3 voices were rated similarly for this trait, but Voice 1 was rated significantly lower (X2 = 101.97, x < 0.001). Voice 1 was the voice previously known as “American English Male,” and was also rated by the participants in this study as likely to be white (73%). Section X discusses one hypothesis for this lower rating of friendliness related to voice quality, but another possible hypothesis for these ratings is also listener expectations of “male” digital assistants differ from those of “female” assistants (Jackson et al., 2020). Finally, it is also notable that when these models account for listener, age, race, gender and region, no significant differences emerge, indicating that black listeners were different than white listeners in terms of having more bias toward these personal characteristics.
As a result of these analysis of listener demographic ratings and personality trait ratings for the 4 Siri voices, we can be confident that listeners do robustly engage in racialized judgments of digital voice assistants. Additionally, we observe that listener racial judgments do interact with perceptions of the personality of the voice, further demonstrating that listeners personify these voices and attach human-like stereotypes to them. However, we still do not know which specific linguistic features are involved in triggering such listener judgments. The next section presents the results of a post-hoc analysis of the relationship between listeners judgments and voice quality features of the 4 Siri voices.
3. Voice quality analysis
3.1. Methods: Voice quality
Having established that listeners do in fact make systematically different demographic judgments about the four Siri voices, the next section aims to explore which voice quality (VQ) features may be involved in triggering such listener judgments. While it is important to note that listeners likely integrate both segmental and prosodic features in their judgments, the current study's analysis will be limited to VQ features, given that synthesized voices in a reading task may be more limited in their ability to display segmental variation especially as the consonantal level. VQ properties are also especially of interest in the current study due to the fact that they may be involved in judgments of voices that are totally independent of segmental phonological or morphosyntactic features, which may be more likely to operate at the level of conscious and/or have enregistered social stereotypes (Labov, 1971). Indeed, as Garellek (2022, p. 2), observes “The reason why the voice often takes center stage in phonetic research is because it is everywhere and matters for everything in the phonetic signal.” For this reason, we can observe that features related to properties of the voice provide important information for how listeners evaluate speakers. However, to date, little work has examined how voice quality features may differ for synthesized voices, or how listeners may react to VQ properties of synthesized voices. Generally, voice quality features are underdescribed in part due to the fact that they frequently behave in a colinear fashion and are not fully theorized with respect to sociolinguistic variation. The current paper therefore represents a first pass at examining how VQ features may affect perceptions and judgments of such voices.
As discussed in Section 1.1, previous research on ethnic identification and production differences between Black and white speakers has posited general differences in voice quality between the groups, but to date, little is still known about the specific VQ parameters that may be involved. In general, such studies have posited that there may be differences related to F0 and the perception of pitch, as well as variable use of different phonation types (creaky, breathy, and modal) (Purnell et al., 1999; Thomas, 2015). In order to examine a maximally broad set of VQ parameters, I employed the PraatSauce suite of scripts, which is designed to extract a variety of spectral measures from acoustic data (Kirby, 2018). Praatsauce extracts 34 features that are related to VQ, a useful technique for the current study given that we want to conduct an exploratory analysis. The Praatsauce scripts take measurements by dividing each vowel in the passage and dividing it into five parts with equal duration. Measurements are then made at five points by averaging value (for each measure) of that section. Since all 4 voices in the current read the same passage and in the same room during the same 15-min interval, the sample is already internally controlled for vowel identity and coarticulatory effects, as well as external recording noise. The full list of VQ features extracted from the speech signal by the PraatSauce scripts are listed in Supplementary Appendix A, but in general, the features of interest are the harmonic amplitude components from the low-, mid-, and high-frequency regions of the signal (H1, H2, A1, A2, A3, H2k, and H5k), cepstral peak prominence, and harmonic and amplitude differences, following the methods of phonetic studies such as DiCanio (2009) and Garellek (2019).
3.2. Analysis and LASSO regression results
A major difficulty of studying voice quality parameters is that the sheer number of variables that may be involved in theoretically infinite, so this type of analysis requires statistical method that can handle both variable selection and regularization when variables behave in a colinear fashion. One way to resolve this challenge is via the use of a Least Absolute Shrinkage and Selection Operator (LASSO) regression. For the current study, I conducted this using the GLMnet package in R (Friedman et al., 2010). LASSO regression provides a model that improves prediction accuracy, and decreases variance by shrinking or regularizing the coefficients, effectively relying on penalties in order to prevent overfitting. The benefit is that it allows us to fit a model containing all possible predictors and use lasso to perform variable selection that simultaneously chooses a set of variables and regularizes their coefficient estimates.
LASSO works by selecting a tuning parameter (lambda) which is chosen by cross-validation. When lambda is zero, the estimates are the same as the ordinary least squares (OLS) and as lambda increases, shrinkage occurs, and variables set at zero that do not contribute to the fit of the model can be excluded. LASSO does both shrinkage and variable selection so if we have a large number of features, we can better find the model with the best fit. Figure 5 shows the LASSO tuning plot of the model for race rating by VQ parameters.
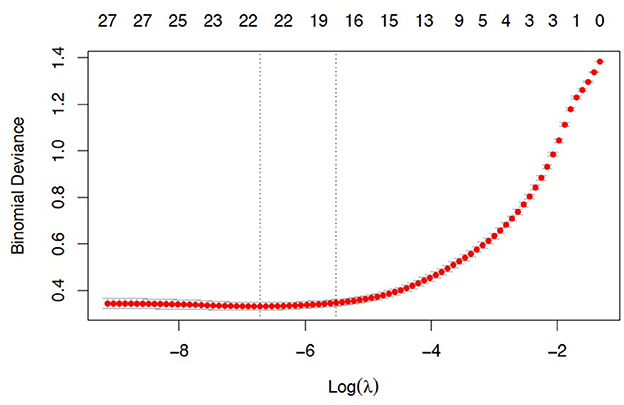
Figure 5. LASSO regression model for voice quality features by race rating.
The x axis is log of lambda, which corresponds to the minimum MSE and one standard error from that, and those are shown by the vertical lines. In this output, the best fit is between those with lines, and we see that with increasing lambda there are fewer variables in the model, because the penalty for inclusion starts to become weighted more heavily. From this plot, we can observe that the model with the best fit likely contains between 19 and 23 variables. However, we can also observe that 2–3 variables account for nearly half of the model fit. Figure 6 displays the cross-validation plot showing the contribution of the variables of interest.
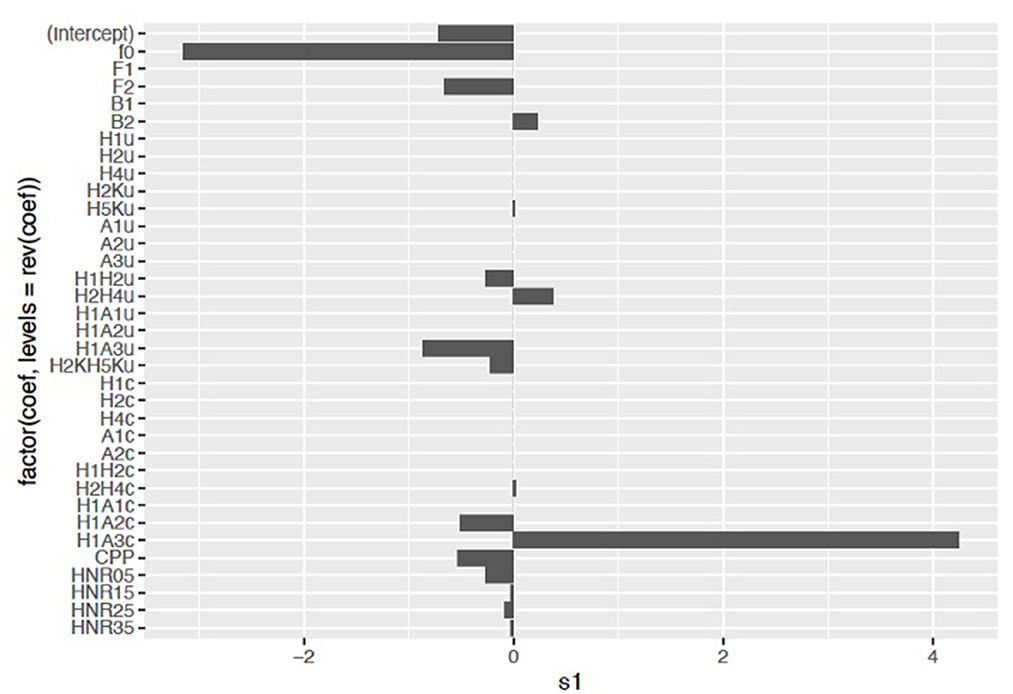
Figure 6. Factor plot for LASSO regression model of voice quality features by race rating.
Overall, the results of the LASSO regression show differences between the race ratings for the voices and the selected VQ features. Lower F0 and higher H1–A3c2 correlate with the voices rated as black, especially Voice 3, but also Voice 2. F0 here is fundamental frequency, which is the main correlate of what humans perceive as pitch. H1–A3 is the difference between the amplitude of the first harmonic (H1) and the harmonic nearest F3. This correlates with the abruptness of the glottal closure. Generally, a larger positive value is perceived as more breathy, and a lower value is more creaky. Results for F0 and H1–A3 will be discussed in turn.
3.2.1. F0
As the LASSO output selected F0 and H1–A3c as the primary variables involved in differentiating the voices rated as Black vs. those rated as white, it is important to better understand the differences in mean F0 between the voices in order to interpret these results. PraatSauce measures F0 at 5 time points per vowel per phrase, so these measurements provided the F0 input for the model. Figure 7 shows the mean F0 for each of the four Siris.
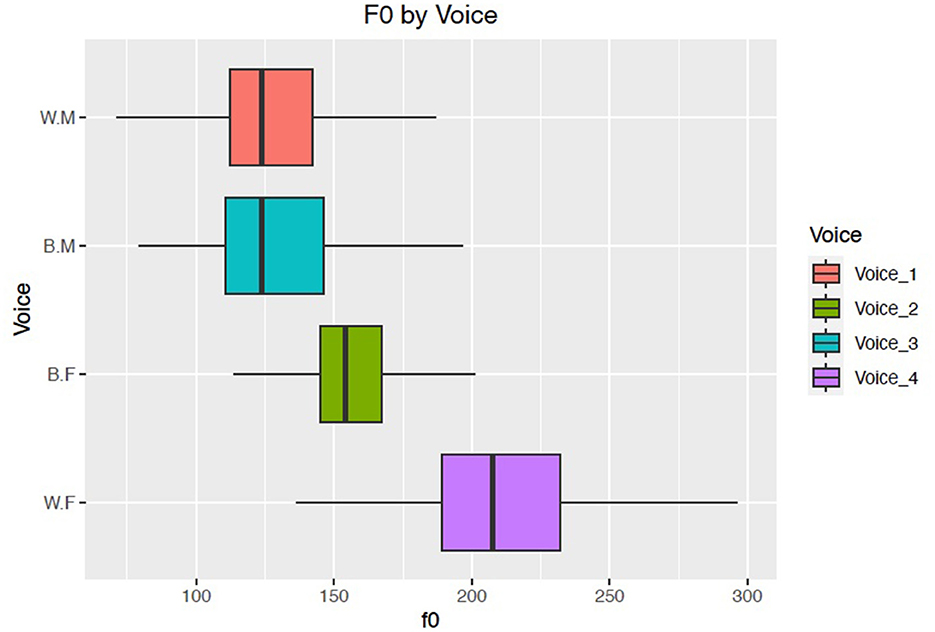
Figure 7. Mean F0 values by voice/race rating.
From Figure 7, we can see that the outlier voice in terms of F0 is Voice 4, which has a mean F0 of 210Hz. Voice 4 is the voice that debuted in 2010 and was formerly referred to as “American English Female,” and this F0 value is close to what previous studies have reported for white American women (Bradlow et al., 1996; Pépiot, 2014), and thus may not be especially surprising. However, the difference between Voice 4's F0 mean and the other “female” voice, Voice 2, is striking. Voice 2 has an F0 mean of 155 Hz, and its mean values overlap with those of Voice 3, the “male voice” who was most likely to be rated as Black. The F0 mean values for Voice 1 and Voice 3, the two “male” voices, are not significantly different from one another. These results provide compelling evidence that listeners may be attuning specifically to the interaction between low F0 and gender for voices that they perceive as “female,” but not for those that they perceive as “male.” Recent work by Holt and Rangarathnam (2018) and Li et al. (2022), finds that in some samples of Black American female voices, speakers do generally employ a lower F0 mean value than white female voices. If these differences do exist in production and are perceptually salient for listeners, then they may also influence listener judgments of race, in part contributing to judgments of Voice 2 as more likely to be Black than Voice 4.
3.2.2. H1–A3c
The other VQ parameter selected by the LASSO regression as correlated with the voices more likely judged as Black was H1–A3c, which is related to perceptions of breathiness. According to DiCanio (2009), H1–A3 is a “mid-range measure of spectral tilt which involves a calculation of the amplitude of the different formants” (168), in this case the amplitude of the first harmonic minus the amplitude of the harmonic nearest the third formant (corrected for the formant). Crosslinguistically, H1–A3 has been shown to distinguish breathy from modal phonation (Esposito, 2010, for Chong) as well as creaky from modal phonation. Articulatorily, a high H1–A3 captures lax vocal folds, but increased H1–A3 can also be caused by more active thyroarytenoids in vocal fold vibration (Maddieson and Ladefoged, 1985). If indeed there are average differences in this measure between Black and white speakers, then the fact that the synthesized voices show different values for this parameter may an attempt to capture some differences in vocal fold position that Siri's designers have observed between groups. Generally, we should expect a higher H1–A3 for female voices due to articulatory motivations: for female speakers, the thyroid notch in cartilage is more rounded and does not lower during puberty, resulting in a less complete vocal fold closure when arytenoids are adducted. From a sociolinguistic perspective, lax vocal fold quality has been associated with agreeableness and warmth (Kreiman et al., 2008). Additionally, Babel et al. (2010) found that higher H1–A3 has been found to be rated as more attractive in American English, providing some evidence that listeners do have impressions about social information related to this variable. Figure 8 shows the mean H1–A3 values for the four voices.
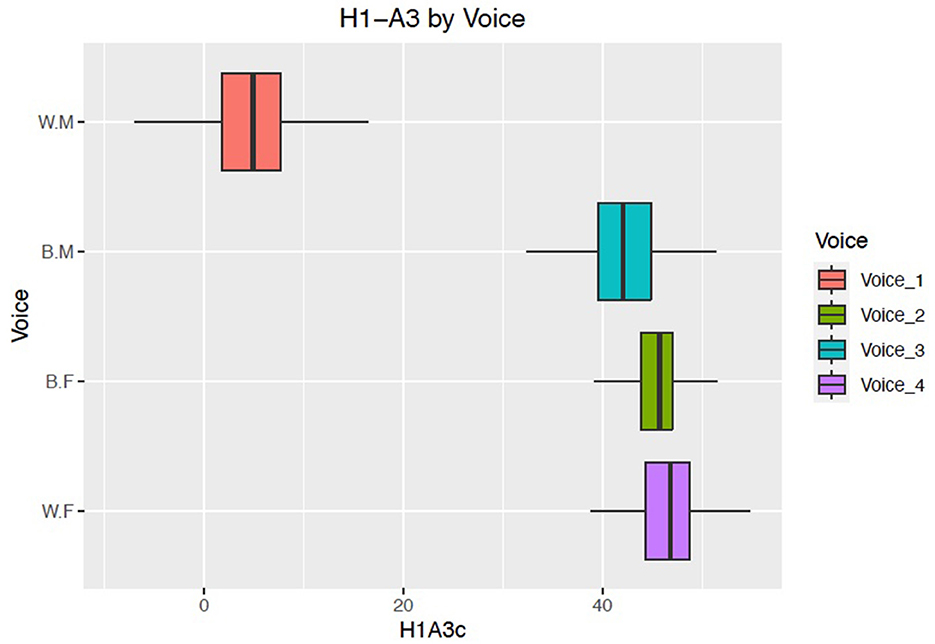
Figure 8. Mean H1–A3 values by voice/race rating.
Interestingly, Voices 2, 3, and 4 overlap with respect to measurements on this parameter, but Voice 1 has a significantly lower H1–A3c measurement. Taken together with the personality trait results in Section 2.3.1 showing that Voice 1 was also rated lower on friendliness, we may hypothesize that less perception of breathiness for this voice is related to the judgment as less friendly. Additionally, since H1–A3 correlates with breathiness, it is possible that listeners simply expect less breathiness from a voice that they perceive as belonging to an allegedly typical male speaker (Ishi et al., 2010). Indeed, Gobl and Chasaide (2003) specifically mention that male voices are less likely to exhibit breathiness, and that less breathy voices are perceived as less friendly.
4. Summary discussion
The results of the perception study about four different Siri voices demonstrate that listeners do robustly engage in regional, age, and racialized judgments of digital voice assistants. In particular, American English listeners from a variety of racial and regional backgrounds pattern similarly in their perceptions of these voices, but the voices are evaluated differently from one another in important ways. With respect to region, listeners generally judged all four voices as likely to be from the Midwest or Northeast, but showed much more variation in their ratings of the two newer voices, Voice 2 and Voice 3. Voice 2 was rated as most likely to be from the Northeast, and Voice 3 was most likely to be rated as from the Southeast. The ratings for age showed that Voice 3 was also the most likely to be rated younger than the other three voices, which were generally judged as belonging to a speaker aged 26–45. Finally, listeners overwhelmingly rated the original Siri voices, formerly called “American English Male” and “American English Female” as white, and showed much more variation in their racial ratings of the two newer voices that debuted in 2021. In particular, listeners were unlikely to rate any of the voices as Hispanic/Latino, Asian, or Multiracial, but much more likely to rate Voice 2, and especially Voice 3, as Black. Taken together, the results for the newer Voices 2 and 3 show that they are significantly more likely to be perceived as coming from people of color than the two older voices.
Racial judgments also interact with perceptions of the personality of such assistants, further demonstrating that listeners holistically personify these voices. While the four voices were generally rated similarly on friendliness, competence, professionalism, and funniness, the outlying judgments are revealing. Voice 1, the former “American English Male” who was rated as white, was also overall rated less friendly than the other three voices, possibly in part due to his use of lower values for the VQ parameter H1–A3, a correlate of breathiness that has been previously discussed as associated with friendliness. However, the results for the personality traits of Voice 3 are particularly of interest, especially when combined with the ratings for his demographic features. Overall, Voice 3 was rated as youngest, most likely to be from the Southeast, most likely to be Black, and less professional and competent, but funnier. When combined, these ratings give us a richer idea of who the listeners may imagine Voice 3 to be: a young, Black man from the Southeast who is funny but not especially competent or professional. This persona, the underachieving, regionally disenfranchised young Black man, is a well-worn trope in U.S. media depictions of individuals who speak African American English (AAE) (Cutler, 2007; Lopez, 2012). It is also a strong stereotype about the kind of person who is imagined to “sound Black” (Baugh, 2005). While Voice 2 was also more likely to be rated as sounding Black, the fact that it is a voice implied to be female somewhat mitigates this judgment, as several studies have found that listeners perform worse in ethnic identification tasks with female speakers (Thomas and Reaser, 2004).
Overall, these results demonstrate that human listeners attach the same types of regional, age, racial, and personality judgements to voice assistants that they do to human voices in previous studies. While this result may be seen as positive in terms of advances in naturalness of digital voice assistants as well as representation of a diverse set of voices in our everyday technologies, it is worrying that even synthesized voices that are perceived as coming from speakers of marginalized backgrounds can be evaluated with the same negative social stereotypes. Future studies should further explore how voice assistants created by different mechanisms and for different user types contribute to the linguistic ideologies of their user base. On a positive note, however, some Black users have reported positive feelings about hearing voices like theirs in digital assistants, demonstrating that tech firms' efforts toward both realistic and inclusive synthesized voices have been somewhat effective (Waddell, 2021). Going forward, researchers and tech firms should carefully investigate user responses to such voices and make efforts to ensure that they are fairly and accurately representing the voices they aim to synthesize.
Tech firms may also make greater efforts to understand and share acoustic information about synthetic voices; both to better understand how listeners perceive such voices but also to assist researchers in better understanding which properties of the voice may be associated with listener judgments of demographic properties and personality traits. A post-hoc analysis of the four Siri voices' use of 34 voice quality (VQ) parameters using PraatSauce (Kirby, 2018) shows that racial judgments in particular are linked with features related to the perception of both pitch and breathiness. The current study identified lower F0 and higher H1–A3 as correlated with judgments of a voice as Black, but many questions remain about the relationship between voice quality parameters and listener perceptions of race. Based on previous research such as Purnell et al. (1999), I expected that features related to perception of breathiness may play a role, but the results did not show significant contributions of parameters such as CPP and HNR. This may indicate that when making racial judgments, listeners attune more to VQ parameters that interact with formant measurements or other segmental phonetic features, but much more work is needed to better understand how listeners attune to these different parameters.
With respect to pitch, there are strong social stereotypes related to Black male voices and lower pitch, though these are not necessarily borne out in production studies that examine pitch as a racialized variable (Li et al., 2022). Indeed, in the current study, Voice 2, the implied female voice most likely to be rated as Black had a lower mean F0 than Voice 4, the female voice labeled as white, but the F0 mean values for the two male voices overlapped. This supports the results of Li et al. (2022) who found that the Black American English female speakers they examined did use lower F0 mean values than the white American English female speakers in their study. Whether or not future studies support the claim that Black American women employ lower F0 mean than white American women, the existence of such a stereotype might still affect listener judgments of race. Future work should examine racialized differences in both production and perception of voices of people and digital assistants of all genders.
The use of synthesized voices in studies on the perception of demographic and personal traits, as well as voice quality properties, represents a new avenue for sociophonetic research on variation in voice quality. Indeed, there is a dearth of sociolinguistic studies on voice quality in general, likely due to the fact that voice quality features demonstrate so much naturalistic instability that it may be hard to distinguish which elements represent group-level variation and which are artifacts of a particular speaker's idiolect or anatomical features. Synthesized voices, however, allow researchers a great deal of control over recording quality and may eliminate variation due to physical properties of the voice altogether, providing researchers with the ability to create a static voice with specific features in order to test the contributions of different voice quality parameters in greater isolation.
A more comprehensive understanding of judgments of digitized voices may help us better examine how listeners make judgments of human voices with implications for a variety of fields including human perception, linguistic discrimination and speech recognition and synthesis. Understanding the specific features that listeners attune to in making racial judgment could be used in future efforts to reduce linguistic bias in avenues such as education and criminal justice. They may also be useful for forensic linguistic purposes such as speaker identification, especially for speakers who have been previously disenfranchised by such technologies. Finally, understanding how voices are evaluated may also assist not only with the creation of future, more authentic and representative digital assistants, but also in the development of more realistic synthetic voices used by humans with vocal disorders.
Data availability statement
The raw data supporting the conclusions of this article will be made available by the authors, without undue reservation.
Ethics statement
The studies involving human participants were reviewed and approved by Pomona College IRB. The patients/participants provided their written informed consent to participate in this study.
Author contributions
The author confirms being the sole contributor of this work and has approved it for publication.
Funding
This research was funded by internal grants to NH at the University of Pennsylvania and Pomona College.
Acknowledgments
The author would like to thank Kaveh Waddell of Consumer Reports for inspiration, Neal Fultz for statistical advice, and Christian DiCanio for advice on measuring and interpreting voice quality parameters.
Conflict of interest
The author declares that the research was conducted in the absence of any commercial or financial relationships that could be construed as a potential conflict of interest.
Publisher's note
All claims expressed in this article are solely those of the authors and do not necessarily represent those of their affiliated organizations, or those of the publisher, the editors and the reviewers. Any product that may be evaluated in this article, or claim that may be made by its manufacturer, is not guaranteed or endorsed by the publisher.
Supplementary material
The Supplementary Material for this article can be found online at: https://www.frontiersin.org/articles/10.3389/fcomm.2023.1116955/full#supplementary-material
Footnotes
1. ^As of this writing in November 2022, there are now 5 Siri voices. The fifth voice debuted in Spring 2022, and was specifically marketed as sounding “non-binary”.
2. ^H1–A3c here is the measurement corrected for the third formant.
References
Alcoff, L. M. (2003). Latino/as, Asian Americans, and the black–white binary. J. Ethics 7, 5–27. doi: 10.1023/A:1022870628484
Babel, M., King, J., McGuire, G., Miller, T., and Babel, M. (2010). Acoustic determiners of vocal attractiveness go beyond apparent talker size. Lab. Rep. Linguist. Res. Center Univ. Calif. Santa Cruz 2010, 1–23.
Baird, A., Jørgensen, S. H., Parada-Cabaleiro, E., Hantke, S., Cummins, N., and Schuller, B. (2017). “Perception of paralinguistic traits in synthesized voices,” in Proceedings of the 12th International Audio Mostly Conference on Augmented and Participatory Sound and Music Experiences, 1–5. doi: 10.1145/3123514.3123528
Baugh, J. (2005). “Linguistic profiling,” in Black Linguistics (London: Routledge), 167–180. doi: 10.4324/9780203986615-17
Bosker, B. (2013). Will a Man's Voice Make Siri Better? New York, NY: HuffPost. Available online at: https://www.huffpost.com/entry/siri-voice-man-woman_n_3423245 (accessed June 12, 2013).
Bradlow, A. R., Torretta, G. M., and Pisoni, D. B. (1996). Intelligibility of normal speech I: Global and fine-grained acoustic-phonetic talker characteristics. Speech Commun. 20, 255–272.
Carmichael, K. (2016). Place-linked expectations and listener awareness of regional accents. Awareness Control Socioling. Res. 12, 123–151. doi: 10.1017/CBO9781139680448.009
Clopper, C. G., and Pisoni, D. B. (2004). Some acoustic cues for the perceptual categorization of American English regional dialects. J. Phonet. 32, 111–140. doi: 10.1016/S0095-4470(03)00009-3
Cutler, C. (2007). Hip-hop language in sociolinguistics and beyond. Lang. Ling. Compass 1, 519–538. doi: 10.1111/j.1749-818X.2007.00021.x
DiCanio, C. T. (2009). The phonetics of register in Takhian Thong Chong. J. Int. Phonet. Assoc. 39, 162–188. doi: 10.1017/S0025100309003879
Eckel, E. (2021). Apple's Siri: A Cheat Sheet. San Francisco: TechRepublic. Available online at: https://www.techrepublic.com/article/apples-siri-the-smart-persons-guide/ (accessed November 3, 2022).
Esposito, C. M. (2010). The effects of linguistic experience on the perception of phonation. J. Phonet. 38, 306–316. doi: 10.1016/j.wocn.2010.02.002
Fossa, F., and Sucameli, I. (2022). Gender bias and conversational agents: an ethical perspective on social robotics. Sci. Eng. Ethics 28, 1–23. doi: 10.1007/s11948-022-00376-3
Friedman, J., Hastie, T., and Tibshirani, R. (2010). Regularization paths for generalized linear models via coordinate descent. J. Stat. Softw. 33, 1–22. doi: 10.18637/jss.v033.i01
Garellek, M. (2019). “The phonetics of voice 1,” in The Routledge Handbook of Phonetics (London: Routledge), 75–106. doi: 10.4324/9780429056253-5
Garellek, M. (2022). Theoretical achievements of phonetics in the 21st century: phonetics of voice quality. J. Phonet. 94, 101155. doi: 10.1016/j.wocn.2022.101155
Gobl, C., and Chasaide, A. N. (2003). The role of voice quality in communicating emotion, mood and attitude. Speech Commun. 40, 189–212. doi: 10.1016/S0167-6393(02)00082-1
Green, L. (2002). A descriptive study of African American English: research in linguistics and education. Int. J. Qual. Stud. Educ. 15, 673–690. doi: 10.1080/0951839022000014376
Holliday, N., and Tano, M. (2021). “It's a Whole Vibe”: testing evaluations of grammatical and ungrammatical AAE on Twitter. Ling. Vanguard 7, 4389. doi: 10.1515/lingvan-2020-0095
Holt, Y. F., and Rangarathnam, B. (2018). F0 declination and reset in read speech of African American and White American women. Speech Commun. 97, 43–50. doi: 10.1016/j.specom.2018.01.001
Ishi, C., Ishiguro, H., and Hagita, N. (2010). Analysis of the roles and the dynamics of breathy and whispery voice qualities in dialogue speech. EURASIP J. Audio Speech Music Process. 2010, 1–12. doi: 10.1155/2010/528193
Jackson, R. B., Williams, T., and Smith, N. (2020). “Exploring the role of gender in perceptions of robotic noncompliance,” in Proceedings of the 2020 ACM/IEEE International Conference on Human-Robot Interaction, 559–567. doi: 10.1145/3319502.3374831
King, S., Vaughn, C., and Dunbar, A. (2022). Dialect on trial: raciolinguistic ideologies in perceptions of AAVE and MAE codeswitching. University of Pennsylvania Working Papers in Linguisti.
Koutstaal, C. W., and Jackson, F. L. (1971). Race identification on the basis of biased speech samples. Ohio J. Speech Hear. 6, 48–51.
Kreiman, J., Vanlancker-Sidtis, D., and Gerratt, B. R. (2008). “14 perception of voice quality,” in The Handbook of Speech Perception, 338. doi: 10.1002/9780470757024.ch14
Kühne, K., Fischer, M. H., and Zhou, Y. (2020). The human takes it all: humanlike synthesized voices are perceived as less eerie and more likable—evidence from a subjective ratings study. Front. Neurorobot. 14, 105. doi: 10.3389/fnbot.2020.593732
Kushins, E. R. (2014). Sounding like your race in the employment process: an experiment on speaker voice, race identification, and stereotyping. Race Soc. Probl. 6, 237–248. doi: 10.1007/s12552-014-9123-4
Li, A., Purse, R., and Holliday, N. (2022). Variation in global and intonational pitch settings among black and white speakers of Southern American Englisha. J. Acoust. Soc. Am. 152, 2617. doi: 10.1121/10.0014906
Lopez, Q. L. T. (2012). White bodies, black voices: The linguistic construction of racialized authenticity in US film (Doctoral dissertation).
Maddieson, I., and Ladefoged, P. (1985). “Tense” and “lax” in four minority languages of China. J. Phonet. 13, 433–454.
Penny, L. (2016). Why are so many robots given female names? Because we don't want to worry about their feelings. New Statesman 145, 38–39.
Pépiot, E. (2014). May. Male and female speech: a study of mean f0, f0 range, phonation type and speech rate in Parisian French and American English speakers. Speech Prosody 7, 305–309. doi: 10.21437/SpeechProsody.2014-49
Purnell, T., Idsardi, W., and Baugh, J. (1999). Perceptual and phonetic experiments on American English dialect identification. J. Lang. Soc. Psychol. 18, 10–30.
Tamagawa, R., Watson, C. I., Kuo, I. H., MacDonald, B. A., and Broadbent, E. (2011). The effects of synthesized voice accents on user perceptions of robots. Int. J. Soc. Robot. 3, 253–262. doi: 10.1007/s12369-011-0100-4
Thomas, E. (2015). “Prosodic features of African American English,” in The Oxford Handbook of African American Language, ed S. Lanehart (Oxford: Oxford University Press), 420–438.
Thomas, E. R., and Reaser, J. (2004). Delimiting perceptual cues used for the ethnic labeling of African American and European American voices. J. Sociolinguist. 8, 54–87. doi: 10.1111/j.1467-9841.2004.00251.x
Waddell, K. (2021). Hey Siri, Is That You? Apple's New Voices Resonate With Some Black iPhone Users. New York, NY: Consumer Reports. Available online at: https://www.consumerreports.org/digital-assistants/apples-new-sirivoices-resonate-with-some-black-iphone-users/ (accessed March 23, 2022).
Keywords: voice assistants, voice quality, ethnic identification, language and race, speech perception
Citation: Holliday N (2023) Siri, you've changed! Acoustic properties and racialized judgments of voice assistants. Front. Commun. 8:1116955. doi: 10.3389/fcomm.2023.1116955
Received: 06 December 2022; Accepted: 20 March 2023;
Published: 26 April 2023.
Edited by:
Sandra Madureira, PUCSP, BrazilReviewed by:
Oliver Niebuhr, University of Southern Denmark, DenmarkIngo Siegert, Otto von Guericke University Magdeburg, Germany
Copyright © 2023 Holliday. This is an open-access article distributed under the terms of the Creative Commons Attribution License (CC BY). The use, distribution or reproduction in other forums is permitted, provided the original author(s) and the copyright owner(s) are credited and that the original publication in this journal is cited, in accordance with accepted academic practice. No use, distribution or reproduction is permitted which does not comply with these terms.
*Correspondence: Nicole Holliday, bmljb2xlLmhvbGxpZGF5QHBvbW9uYS5lZHU=