 Leandra Thiele
 Florian Schmidt-Borcherding
 John A. Bateman
- 1Linguistics and Literary Studies, Faculty 10, University of Bremen, Bremen, Germany
- 2Pedagogy and Educational Sciences, Faculty 12, University of Bremen, Bremen, Germany
In this paper, we consider the issue of how the fine-grained multimodal design of educational explanation videos, such as those widely available on YouTube and other platforms, may be made accessible to empirical studies of reception and effectiveness. This is necessary because previous research has often led to conflicting conclusions concerning the roles of particular design elements. We argue that this may largely be due to insufficient characterizations of multimodal design itself. To achieve tighter control of this potential source of variation, we present a multimodal descriptive annotation framework drawing on multimodal (cohesive) film discourse analysis. This framework is seen as a critical first step toward being able to highlight just those differences in design that have functional consequences. For such consequences to accrue, however, viewers need to attend differently to corresponding design differences. The goal of the current paper, therefore, is to use eye-tracking techniques to explore the extent to which discourse structures revealed by our analytic framework relate to recipients' attention allocation. We hypothesize that any potentially emerging anomalies in regards to discourse organization, such as instances of unsuccessful cohesion signaling, may have correlations in the behavioral data. We report our current state of development for performing this kind of multimodal cohesion analysis and some of the unresolved challenges raised when considering how such analyses may be related to performance data.
1 Introduction
Explanation videos are now extremely popular in both informal and formal educational settings. They draw on different disciplines and areas of knowledge and appear in many different forms, such as short videos, “Reels,” and so on, each potentially exhibiting substantial differences in design. Explanation videos are also available on-demand on many online platforms (e.g., YouTube), which played an important role in furthering their use and acceptance during the COVID-19 pandemic worldwide (cf., e.g., Yaacob and Saad, 2020; Breslyn and Green, 2022; Trabelsi et al., 2022; Lu, 2023). However, even before this latest explosion in use, there was already a long established research tradition addressing the question of what makes an explanation video effective (or not). A host of principles and guidelines have been proposed (e.g., Mayer, 2021b), but empirical results often paint a far more mixed picture see the discussion below and further references in, for example: (Bateman and Schmidt-Borcherding, 2018; Bateman et al., 2021). We see here substantial methodological issues that need clarification before attempting to gauge effectiveness. Unless we are able to characterize differences in design in a manner that reveals precisely not only which design differences may have functional consequences but also the conditions under which such consequences are most likely to follow, it is unlikely that consistent empirical results will be obtained. In short: it is important to be able to distinguish between mere physical differences in design that may have little effect on viewers' engagement and the differences that play an active role in interpretation-building, for better or worse.
In this paper we propose a methodology that enables us to focus specifically on this challenge of isolating differences in design that have measurable behavioral consequences. We consider this as an essential step prior to being able to conduct more reliable and discriminating effectiveness studies. In order to ascertain whether particular differences in design correlate with reception differences, we employ results of an eye-tracking study to examine the extent to which correlations can be found between the gaze data and our proposal for a fine-grained account of the discourse structure of explanation videos. This may then help to develop further hypotheses concerning discourse structures and those structures' contribution to the achievement of communicative goals, particularly the goals of effectively informing and explaining. Our focus here, however, will be solely on our discourse analysis framework and the support it offers for mapping cohesive structures with eye-tracking data, leaving the final question of the role that such structures may play for effectiveness for subsequent studies.
We see this intermediate step as essential because of what is probably the primary challenge raised by attempting to deal systematically with data of this kind: that is, the highly multimodal nature of explanation videos. Such videos avail themselves of the full range of expressive forms now supported by the medium and so readily combine diverse kinds of broadly “written” representations, such as written language, graphs, tables, and mathematical formulae, more pictorial, schematic, or diagrammatic representations, as well as “second-order” visual resources for navigation and other purposes, such as circles, underlining, arrows, boxes, overall layout and other segmentation techniques. This has made any characterization of “design” in a manner sufficiently precise to be supportive of empirical investigation a major bottleneck for further inquiry.
In this paper we focus on an approach capable of addressing this issue in a general manner by drawing on contemporary linguistically-inspired theories of multimodality. The term “multimodality” refers to the phenomenon of combining multiple semiotic modes, i.e. different ways of representing meaning, in the service of coherent communication. This would seem ideally suited to the complex multiple expressive forms found in explanation videos. However, traditional conceptions of semiotic modes relying on broad labels such as “written text,” “image,” “sound,” etc. have often conflated formal and functional properties making them difficult to apply in research. For example, the functions served by “words” in diagrams, graphs, pictures, or captions can be, and often are, quite different, which makes ascertaining their contribution to design (or lack of it) challenging. Similarly, the functions played by visual materials, such as diagrams, mathematical equations, or graphs can only be found in combination with the other deployed resources they co-occur with.
To resolve these difficulties, we adopt the position and methods for multimodality research specifically argued in Bateman et al. (2017). This account offers a more formalized account of multimodal communication that assumes a tight connection between expressive forms and the discourse functions of those forms regardless of presentation modality just as is required to handle the multimodal complexity of explanation videos. In addition, the descriptive framework we set out is intended to be strongly supportive of corpus-based work on explanation videos, by means of which we can more effectively triangulate between descriptions, empirical reception studies, and diverse medial realizations.
The paper builds on an earlier exploratory study by Bateman et al. (2021), in which the feasibility and utility of a rich multimodal annotation scheme for capturing the interplay of different semiotic modes in explanation videos was demonstrated. We now develop this scheme further and report on a pilot empirical investigation seeking correlations between the multimodal annotation scheme and recipient data collected for contrasting videos using eye-tracking methods. By these means we support our claim that the broader task of relating fine-grained design choices to video effectiveness may usefully be broken down into several components: here we focus specifically on a first stage of relating design to performance data which may subsequently, as suggested above, be brought more readily into contact with learning effects.
We structure the paper as follows. We begin in Section 2 with a brief review of the state of the art among those approaches that attempt to gain more analytic hold on factors responsible for educational videos being effective or not. The diversity of results found in these studies supports our basic claim that we need to tease apart the factors contributing to design more finely. To assist the development of such studies in the future, we report in Section 3 on the multimodal annotation scheme that we are developing for explanation videos and the specific functional aspects of discourse that are currently covered. Although our annotation scheme is defined to apply to explanation videos in general, for the purposes of the present paper we need also to be sufficiently detailed as to show micro-scale interactions with behavioral data. Consequently, in Section 4, we draw on results of an eye-tracking study carried out for some explanation videos that were specifically constructed to exhibit controlled variation, focusing on the gaze data gathered with respect to one particularly complex slide. This allows us in Section 5 to begin to address our central question—that is, the extent to which theoretically motivated multimodal annotations, and in particular the discourse structures revealed, can be shown to correlate (or not) with behavioral data. This results in several challenges and directions for extending the multimodal annotation in future work that we summarize in Section 6. Finally, in Section 7, we summarize what has been achieved and the goals established for the next steps to be taken in such studies.
2 Brief literature review and state of the art
Research on the instructional effectiveness of educational videos dates back far beyond contemporary platforms such as YouTube, beginning in the 1970s (cf. Bétrancourt and Benetos, 2018). Since then considerable attention has been paid to potential relations between the effectiveness of videos and their design. Within the domain of instructional design the most prominent and most recent theoretical research contexts for educational videos are given by cognitive and perceptual multimedia learning frameworks, e.g., Cognitive Load Theory (CLT: Paas and Sweller, 2021), Cognitive Theory of Multimedia Learning (CTML: Mayer, 2021a), and Integrative Text and Picture Comprehension (ITPC: Schnotz, 2021).
Many recommendations for instructional design or principles of multimedia learning that are derived from these theoretical frameworks (for a comprehensive overview, see Fiorella and Mayer, 2021) can be considered to hold for educational videos as well (Fiorella, 2021). Some of these principles are almost naturally fulfilled due to technical characteristics of videos. For example, the multimedia (Mayer, 2021b) and multiple representations (Ainsworth, 2021) principles pronounce that using verbal and visual modes fosters learning compared to relying on a single (re)presentation mode. The modality principle (Castro-Alonso and Sweller, 2021) states that once verbal and visual modes are used in combination, verbal information should be spoken rather than written. Obviously, most educational videos consist of (non-verbal) visualization accompanied by (spoken) text. Other design principles, however, need to be actively addressed when creating an educational video. For example, the simultaneous use of multiple visual representations forces a split of visual attention that should either be avoided as much as possible (Ayres and Sweller, 2021), or be supported by additional signals that guide a learner's (visual) attention (van Gog, 2021). Still other principles may lead to ambiguous or even contradictory interpretations of an actual video design. For example, in educational videos the instructor can be visible in the video as a “talking head” or only audible as a “voice over” (e.g., Wang and Antonenko, 2017). However, on the one hand, visible instructors are a source of split attention, whereas, on the other hand, they may serve as a social cue (Fiorella and Mayer, 2021). Indeed, a recent review of the effects of instructor presence in instructional videos found mixed results (Henderson and Schroeder, 2021).
Theoretical explanations for most of these principles, as offered by the above mentioned theories of multimedia learning, often assume the mental integration of multiple different external representation types, mainly verbal and pictorial representations, the perception of these representations via different sensory modalities, mainly the eye and the ear, and different verbal and visuo-spatial mental representations of information (e.g., Mayer, 2014; Schnotz, 2014). While psychological and psycholinguistic research has achieved some consensus on models of verbal or “propositional” representation (Kintsch and van Dijk, 1978; Kintsch, 1988), models of visual information are separated across different kinds of visualizations such as graphs (e.g., Kosslyn, 1993), pictures (e.g., Levin et al., 1987), diagrams (e.g., Larkin and Simon, 1987; Tversky et al., 2000), or animations (e.g., Tversky et al., 2002; Ainsworth, 2008). This may be one reason why models of text-picture-integration stay incomplete or underspecified in their understanding of the mental integration process itself. As Bucher and Niemann (2012, 292) note, it is important to clearly separate distinct visual representations in both form and function. Largely “pre-theoretical” distinctions such as that commonly made between “words” and “image” do not provide sufficient discrimination since both written language and images are visual and both are commonly integrated in a range of distinct semiotic contexts. Moreover, the presentation of information in such materials continuously makes references between (spoken) language and visualization as well (e.g., in “verbal signaling”).
Also relevant here is largely independent work carried out on academic presentations because these often overlap significantly with the kinds of presentations found in many explanation videos. Whereas, strictly speaking, explanation videos form a broader class, whenever those videos employ presentations of the form found in academic presentations using software such as PowerPoint, there are useful empirical results obtained in that domain to build upon (Schnettler and Knoblauch, 2007; Wiebe et al., 2007; Bucher et al., 2010; Bucher and Niemann, 2012), as well as proposals for the multimodal description of such presentations (e.g., Rowley-Jolivet, 2004). All such approaches point to the need to provide finer-grained accounts so that variations in reception and effect may be investigated more closely.
There are, moreover, interesting differences and similarities to consider between work on live presentations, using tools such as PowerPoint, and the medial variants found in explanation videos. Whereas researchers increasingly study the role of gestural signaling of relevant information during a presentation (Bucher and Niemann, 2012), explanation videos commonly employ visual signaling that is designed into the material of the visual presentation by means of graphical highlighting with arrows, areas of color, and so on, often animated. These can be expected to play a particularly important role whenever presenters are not visually present. Here, there remains much to consider, relating, for example, diagrams and gestures more closely, as proposed by Tversky et al. (2013) and Kang et al. (2015), as well as empirical and descriptive work on infographics (Habel and Acartürk, 2006; Martin and Unsworth, 2023).
For the present paper particularly relevant are then findings in cognitive studies that propose the signaling or cueing principle, which suggests a higher learning outcome from multimedia learning resources when those incorporate certain signals to guide viewers “to the relevant elements of the material or [to] highlight the organization of the essential material” (van Gog 2021; see also Richter et al., 2016, Schneider et al., 2018, Alpizar et al., 2020, and Mayer 2021b). Ozcelik et al. (2009) put forth two concrete hypotheses related to this, namely the guiding attention hypothesis, which suggests relevant information receive more attention when given signaling as well, and the unnecessary visual search hypothesis, which refers to the ease of locating related information between visual and verbal modes. What these then have in common is a lack of crucial information concerning precisely what these signals are that guide viewer attention and how they have to be meaningfully woven into any material's organization. In this regard, these principles need further refinement on an empirical basis as now attempted in several lines of research (Richter et al., 2016; Mayer et al., 2020).
Finally, it is interesting to note that there has been surprisingly little work to date attempting to relate aspects of cohesion, the specific functional discourse phenomenon we employ below, and eye-tracking data, even with purely verbal texts. From the multimodal perspective relevant here, for example, Acartürk et al. (2014) report on a study of the effects of different styles of cross-references to figures in a constructed “text”-“figure” composite layout. Although systematic differences in gaze behavior (particularly durations for attending to the text and to the visual figure) were found, the layouts of the stimuli used were highly unnatural and did not reflect the multimodal complexity of the kinds of data considered here. The lack of natural stimuli for such experiments is a common difficulty that our provision of fine-grained annotations for design is also intended to alleviate.
In the subsequent sections we propose a contribution to the goals of theoretical and practical refinement by utilizing the far more fine-grained characterization of the possibilities for signaling and guiding viewer attention offered by multimodal analysis. This will allow us to investigate to what extent signaling as realized at the design level in video data is consistent with empirically measured viewing behavior. By these means we aim for an additional empirically-supported “filter” capable of focusing analytic attention on just those features of design that may be critical for subsequent uptake; whether or not that uptake has consequences for the effectiveness of an explanation must then be subject to investigation in its own right.
3 An annotation framework for explanation videos
In this section, we introduce our general multimodal-descriptive annotation framework for explanation videos. The purpose of this framework is to support fine-grained investigation of the discourse structures of educational videos, which we hypothesize play a central role in guiding those videos' reception. More specifically, we show how a multimodal discourse analysis may capture aspects of “textual” organizations corresponding to the signaling principles introduced above; by these means signaling principles in multimodal discourse receive a concrete realization that we can then subject to empirical analysis.
We first introduce the overall organization of the annotation scheme and its practical realization within the annotation software ELAN, developed at the Max-Planck Institute in Nijmegen (Wittenburg et al., 2006; ELAN, 2023). This scheme draws on and extends the account first motivated and introduced in Bateman et al. (2021). We then explain its use for one specific area of multimodal discourse organization, that of multimodal cohesion. This is the area that we will use below when exploring potential correlations with eye-tracking behavior. We will draw examples of the annotation scheme in use from the eye-tracking analysis that we perform below, although the scheme itself is intended quite generally for characterizing communication of this kind.
3.1 Annotation of complex audiovisual data
In order to move toward multimodal analysis that is sufficiently fine-grained to support empirical study, Bateman and Schmidt-Borcherding (2018) argue that the precise discourse placement of mobilized expressive resources in any kind of medium participating in discourse may be critical. The discourse structures involved therefore need to be captured so that organizational “weak spots” may be identified. In the current case, we will seek to operationalize such potential weak spots in terms of multimodal cohesion. As remarked in the introduction, multimodal discourse structures may be expressed using a rich diversity of representational forms, including various kinds of written and iconic representations as well as “second-order” visual resources for navigation and showing text organization. These all need to find a place in the developed analysis and annotation scheme.
Following annotation techniques long established in linguistic corpus work and since extended for multimodal corpora as well (cf. Bateman, 2013; Knight and Adolphs, 2020), the rich diversity of information required is captured in the annotation scheme by means of defining multiple layers of distinct kinds of information. Many studies of multimodal phenomena adopt broadly similar “layered” schemes of data annotation of this kind. In our case, however, we draw additionally on the more specific guidelines for multimodal corpus work set out in Bateman (2022), whereby distinct kinds of information are made to correspond broadly to individual semiotic modes, including all aspects of the formal definition of semiotic modes argued by Bateman et al. (2017). It is the systematic application of this definition that begins to establish a “meta-language” for comparing and contrasting explanation videos in general.
Currently, the modes included in the annotation framework and considered in our analyses are the following:
• verbal speech
• written language
• diagrams
• graphs
• mathematical formulae
• tables and corresponding tabular elements (i.e., columns and cells and labels)
• arrows and lines (sometimes within diagrams, sometimes not) that function representationally with respect to the information being presented
• highlights (including, e.g., arrows/lines/circles, speech bubbles, etc.) that function textually to orchestrate engagement with the information being presented.
Substantial interaction can be found between all of these forms of expression. However, for present purposes, we will focus discussion primarily on aspects that have been found particularly challenging up to now, such as the interplay of the visual elements. This is by no means to be taken as suggesting any prioritization of the relevance of distinct modes over others.
Methodologically, the fact that we are working with a temporally-based medium allows the levels of description to be linked back to the original data by timestamps. This makes it appropriate to model these layers as “tiers” in ELAN. Thus, each tier of information segments an analyzed video temporally with respect to some specified facets of the video's multimodal organization. Explanation videos often deploy further media as part of their information presentation that may then provide additional spatiotemporal structuring of their own which must also be captured. One common medium used in this way is Microsoft's PowerPoint or similar tools; these media are “slide”-centered, which we then treat similarly to scenes in more film-like videos. In all cases, it is the perceptible visual material that is considered for analysis not the production—that is, if a slide develops by introducing animated elements that might be implemented in separate slides but which appear continuous, then these are treated as a single temporally unfolding unit. Establishing properly motivated analytic units of this kind is an essential step for reliable analysis (cf. Bateman et al., 2017, 2021).
Most of the individual forms of expression to be included are captured as “base” layers of annotations. These offer a foundation for defining several further kinds of multimodal annotation that are essential for capturing inter-relations and signaling techniques operating between elements expressed in different semiotic modes. Relational information of this kind is often not supported by current annotation tools, ELAN included. To handle this in a general fashion, we have developed annotation guidelines for including relational properties that build on existing annotation tool capabilities. These guidelines then also stand as a method supporting the use of ELAN for multimodal data whenever richly internally structured multimodal ensembles are involved.
For present purposes, relational information is mainly needed for two types of tiers. First, arrows, lines, circles, and speech bubbles generally relate to other elements in the videos—arrows and circles for example, commonly serve to highlight other elements, whereas lines connect elements. This information needs to be captured in addition to the bare presentation durations given by the segments of the base-level tiers and, moreover, can well require their own duration information—for example, an arrow intended to draw attention to some other element may appear and disappear independently of the durations of the elements being referred to.
Analytic units with their own durations are most commonly represented in ELAN and similar time-based annotation tools as layers or tiers in their own right. Consequently, in our framework, relational units also all receive their own tiers within the ELAN annotation. Information about the temporal extent of an element's visibility (or audio duration for verbal speech) is then given by defining time interval segments within these tiers as usual, marking the respective starting and ending times of their occurrence. For ease of reference, these tiers are labeled following a specific naming scheme identifying the structural position of any component within the presentation as a whole. Thus, for example, an ELAN tier label data-point:6_d:1_s:4 picks out the sixth visual “data point” that is part of the first diagram (d:1) of slide 4 (s:4).
The relational information itself, i.e., the relations between these elements and the units they relate, is then captured using structured labels stored directly as annotation values of the relevant interval segments of the base tiers. These structured labels identify both those further elements that the marked elements relate and the type of linkage, currently either highlight, connect, or label. Figure 1 shows as an example three tiers whose elements either highlight or connect with other elements. Those other elements are identified throughout by their respective tier names as just described. Thus: the first line of the figure captures the information that a particular circle within the first diagram on slide 4 (circle:5_d:1_s:4) functions to highlight a particular data point in that diagram (data-point:6_d:1_s:4), which will also have its own independent tier elsewhere in the annotation. Connection relations are given similarly by mentioning both elements being related.
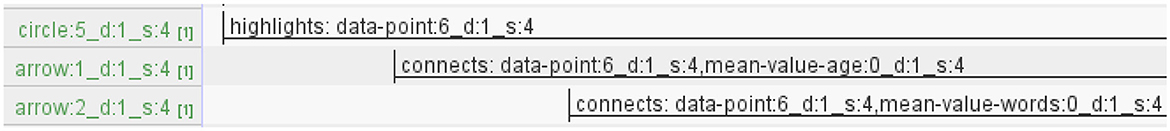
Figure 1. ELAN in-tier inter-relation annotations showing the use of structured annotation “labels” rather than terms selected from controlled vocabularies or free text.
Information also needs to be given concerning the form of these relational elements, e.g., the colors of circles, lines, etc. Although it would be possible formally to add such information to the structured labels just introduced, this would lead to potentially very complex interval annotations that ELAN provides no support for and which would likely become increasingly error-prone. Thus, rather than over complicate the information maintained in the interval labels, we instead employ ELAN's “Comments” functionality for recording visual properties directly. Examples are shown in Figure 2. Here we see that annotations in the comment section are also linked to specific time stamps allowing properties to be anchored to time intervals as well—this would be needed when, for example, the color or shape of an arrow or some other unit changes during its use. This type of information is annotated for all semiotic modes whenever relevant. Thus a further example would be when the color or forms of textual elements change; this then also includes, as we shall see below with respect to form-based cohesive signaling, form properties for numbers in math formulae or written language.
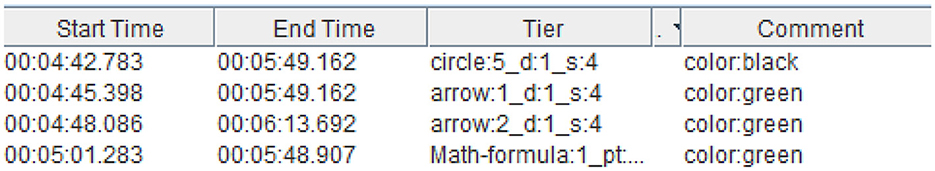
Figure 2. Additional visual annotation information recorded in ELAN comment sections.
The annotation scheme described so far then provides most of what is needed for engaging with the rich multimodality of temporally-based complex media such as explanation videos. Data sets annotated in this way would offer a strong foundation for investigation of the use that is being made of the resources captured by the application of several methods, such as, for example, corpus-based studies and, as pursued here, behavioral measurements and experimentation.
3.2 Multimodal cohesion in explanation videos
For addressing the particular use of multimodal resources for signaling and guiding interpreters, we now turn to the notion of multimodal cohesion, as this is generally taken as one of the primary techniques by which texts, of any kind, provide additional interpretation cues for their recipients. Cohesion as adopted and refined here was originally defined by Halliday and Hasan (1976) solely with respect to verbal language. Cohesion is said to be active whenever elements of a text require interpretations of other elements of the same text in order to receive their own interpretation: most prototypical examples of this would be pronouns, where the interpretation depends on identifying their intended referents. Relatively early in work on multimodality this notion of cohesion was extended to apply to “texts” consisting of more than verbal language. Royce (1998), for example, set out a system of several distinct kinds of “cohesive” relations operating across written texts and accompanying images and diagrams. The function of such connections was to suggest explanations for how texts could guide recipients to bring together different sources of information, each potentially expressed with different semiotic modes. Several extensions of this basic idea have been proposed since; Liu and O'Halloran (2009) provide a detailed overview as well as some significant further proposals of their own that we will also draw on below.
Many accounts offered of multimodal cohesion to date have followed Royce's lead in focusing on “text-image” relations. As we have seen above, however, this would not be appropriate for explanation videos as a far broader diversity of semiotic modes are usually at work. The underlying theory for the analytic steps we implement here are consequently based more on the audiovisually extended framework of multimodal cohesion analysis developed by Tseng (2013). This method calls for the construction of cohesive chains for audiovisual data regardless of the semiotic modes employed. Elements are linked in cohesive chains when they stand in particular discourse relations, such as co-referentiality as mentioned for pronouns above. Cohesion analyses are then shown using cohesive chain diagrams which depict the re-occurrence relations active in a text. This allows, in the multimodal case, the combined use of semiotic modes to be shown in a structured way so that the various contributions of multimodal resources can be tracked exhaustively across a text's development.
Several quite specific extensions to the notion of cohesion inherited from its application for verbal texts need to be made for the multimodal context, even for the treatment of verbal language. One of these concerns the fact that in any multimodal artifact, there may be several units realizing verbal language co-present, both spatially and temporally. This means that some of the basic distinctions for cohesive analysis need to be refined. Co-referential cohesion in traditional verbal language, for example, is typically distinguished according to the “direction” of the relating cohesive link. More specifically, the relationships of situational identity constructed by co-referentiality across a text can occur in two ways: either the relationship is prospective, termed cataphora, or retrospective, termed anaphora. Anaphors thus “look back” to their referents, while cataphors “look forward.” In single linearly organized “monomodal” texts these two directions naturally exhaust the possibilities as two referring expressions may always be ordered with respect to one another. However this does not hold for multimodal communication since multiple “contributions” may co-exist, co-occurring at the same time (matching on temporality) across different or multiple instances of the same modes. We add this third kind of referential cohesion to our account and term it “co-phoric.” We propose that multimodal referential cohesion may contribute to recognition of many of the signaling principles mentioned above and so may play a role in guiding a viewer's attention, which should in turn leave behavioral traces, such as differences in gaze behavior as we investigate below.
A further source of potential cohesive ties when considered multimodally relates to the forms of the deployed expressive elements rather than their referents. When, for example, various elements co-present in a video are related by selecting particular colors, then this may serve as a signaling device calling for recipients to bring together the identified elements in some way, but not requiring that those elements be seen as co-referential. This form of connection is relatively under-researched in the context of accounts of cohesion, although clearly of importance for design. Both “intersemiotic parallel structures” and “intersemiotic parallelism” in Liu and O'Halloran (2009) account might be extended to include this.
We now include these forms of cohesion explicitly in our annotation scheme as they may clearly play an important role for discourse coherence. The way in which form information, such as shape and color, is captured in the annotation was already described above (cf. Figure 2). This technique is then also used to cover referential cohesion as follows. First, co-referentiality information is annotated directly in a distinct type of ELAN tier labeled as “cohesive links.” Intervals defined within these tiers then “pick up” elements from specified base tiers that are related to other modes through co-referentiality. Thus, for verbal speech, for example, co-referential items in other semiotic modes are linked to the respective verbal elements by entries in a corresponding “verbal-speech.cohesive-links” tier. The cohesive links tier thus identifies annotations of linguistic verbal tokens that are co-referenced in the discourse across modes. The corresponding information concerning the tiers to be linked to these tokens, i.e., the referents, is again given in the ELAN's comment section as shown in Figure 3. These annotations have the specific structure “coref: [linked tier name].” Thus, the first line of the figure captures the fact that there is a verbal element (whose contents is captured in the corresponding interval segment defined in the verbal-speech tier) which is co-referential with another element in the video, the data point labeled data-point:6_d:1_s:4.
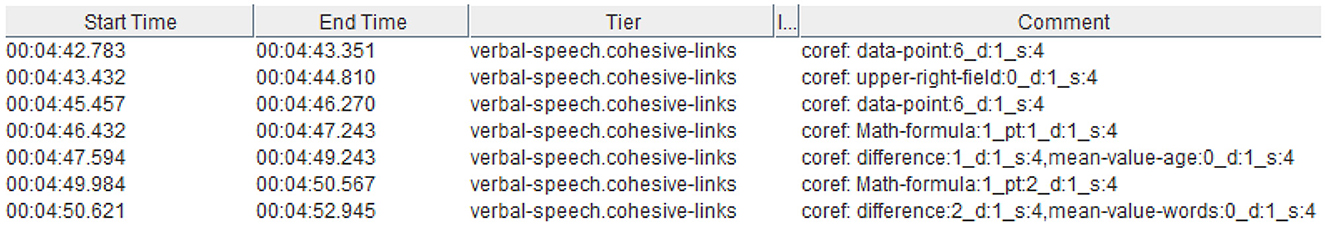
Figure 3. ELAN cohesive link annotation.
Since in the multimodal case co-reference can occur across any semiotic modes capable of referring, and not just the verbal, we generalize this method to allow co-referential information for any tiers describing any semiotic modes by similarly adding corresponding cohesive link tiers. These then operate in the same way as for the verbal cohesive links tier, simply picking out non-verbal elements as required. Thus, although the verbal speech track in our medium of investigation generally provides a good orientation for engaging with all of the other material presented, this is not necessarily the case. Nevertheless, for our present object of analysis, it is often appropriate to select the verbal mode as the main axis of discursive organization and development as we shall see.
Finally, as Liu and O'Halloran (2009) emphasize, cohesion analyses of all kinds can be seen from two perspectives: a static, product-oriented perspective (the “synoptic” view) and a dynamic, text-development perspective (the “logogenetic” view). The cohesion analyses that we will mostly present in this paper are synoptic in the sense that they do not reflect the temporal development of the audiovisual “texts.” This raises significant questions when engaging with the reception of these texts since this clearly occurs over time. How these may be related in empirical work will then be an important topic we take up below.
3.3 Multimodal cohesion diagrams
When constructing and inspecting cohesion analyses, it is traditional to use visualization diagrams where identified cohesive chains—i.e., elements in the analyzed texts that are connected cohesively—are shown running vertically down the page with cohesive links between the elements of single chains depicted by vertical arrows. Thus, for example, repeated mentions of a particular data point, first with a full referring expression such as ‘the data point' and subsequently by various forms of pronominalization, would all be placed in a single cohesive chain running vertically down the page. Whereas in Tseng (2013) these cohesive chains might already combine expressions in various semiotic modes, for example including a graphical data point as well, for current purposes we begin by separating the cohesive chains across semiotic modes. This is intended to allow us to focus more specifically on the work that recipients have to do in finding relationships across the various forms of expression used and is also motivated by the sheer diversity of modes that we need to separate analytically. Thus, in our case, a verbal reference to a particular graphically depicted data point would involve two cohesive chains: one for the verbal language and one for the visual. These two chains are then linked by, in this case, a co-referentiality relation. In our visualizations, such relationships are depicted by arrows running horizontally across the page connecting the tiers concerned.
Most earlier visualizations of multimodal cohesion analyses have been constructed manually, which quickly becomes difficult when the multimodal complexity of an analyzed text increases. Now, since we have a formally specified annotation scheme for capturing multimodal cohesion, we generate such chain diagrams automatically using a specifically written R script running directly on the ELAN exported data. We will make extensive use of cohesion diagrams below when comparing audiovisual discourse structures with our eye-tracking data, and so it will be useful here to show a worked example in detail. For this, we take a single slide used in the explanation videos that served as stimuli in the eye-tracking experiment we draw upon; this is also the slide that we focus on below. In addition, this visual presentation is accompanied by a verbal track describing how the graphic is to be interpreted and this verbal information is naturally also a necessary component of the cohesion analysis.
Figure 4 shows the slide in question. The videos themselves were made in German for a German-speaking audience, and so all the written text labels visible in the slides and the accompanying spoken language are in German as well. The overall topic of the presentation used in the video is “Covariance and Correlation,” discussing how values measuring these statistics are calculated with respect to data. The screenshot in the figure correspondingly depicts the final state of a slide where this calculation is explained by the lecturer working through a concrete example in which the ages of a set of 15 children are placed in relation to their respective active vocabularies. The data used for the calculation of co-variance being discussed in the example is depicted visually by means of data points positioned on a graph. The “age” of the respective children is shown running along the horizontal “x”-axis and their respective vocabulary sizes (“words”) run vertically on the “y”-axis. The task of the narrator/presenter in the video at this point is to lead the students through some selected data points (each point depicting a particular child) so as to make clear the respective relationships between the information concerning individual children and the average age and vocabulary size for the group as a whole. The instructor's verbal description is shown transcribed with standard Jefferson notation (e.g., Jefferson, 2004) along with a simple English gloss on the left of Figure 5. The precise calculation to be learned by the students is given in the mathematical formulae picked out by the four call-outs in the slide resembling “speech balloons” from comics. This is itself an interesting case of the influence of the design of the “semiotic software” used, in this case PowerPoint, as such speech balloons are included in the graphic resources readily on offer (cf. Zhao et al., 2014; Djonov and van Leeuwen, 2022), but may well then be employed for purposes other than denoting speech.
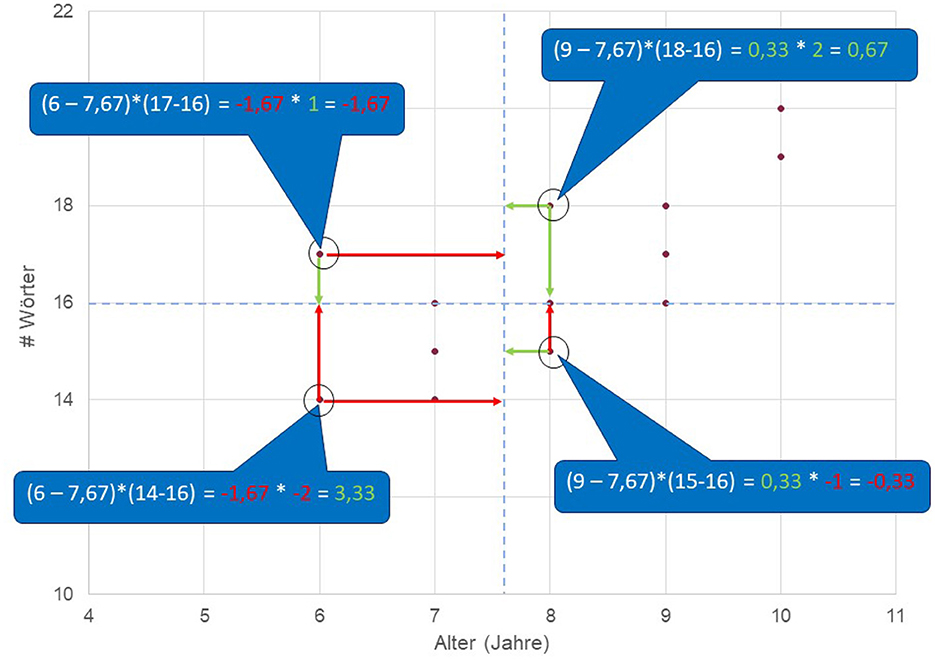
Figure 4. Example slide selected from the video used in the preliminary study discussed below.
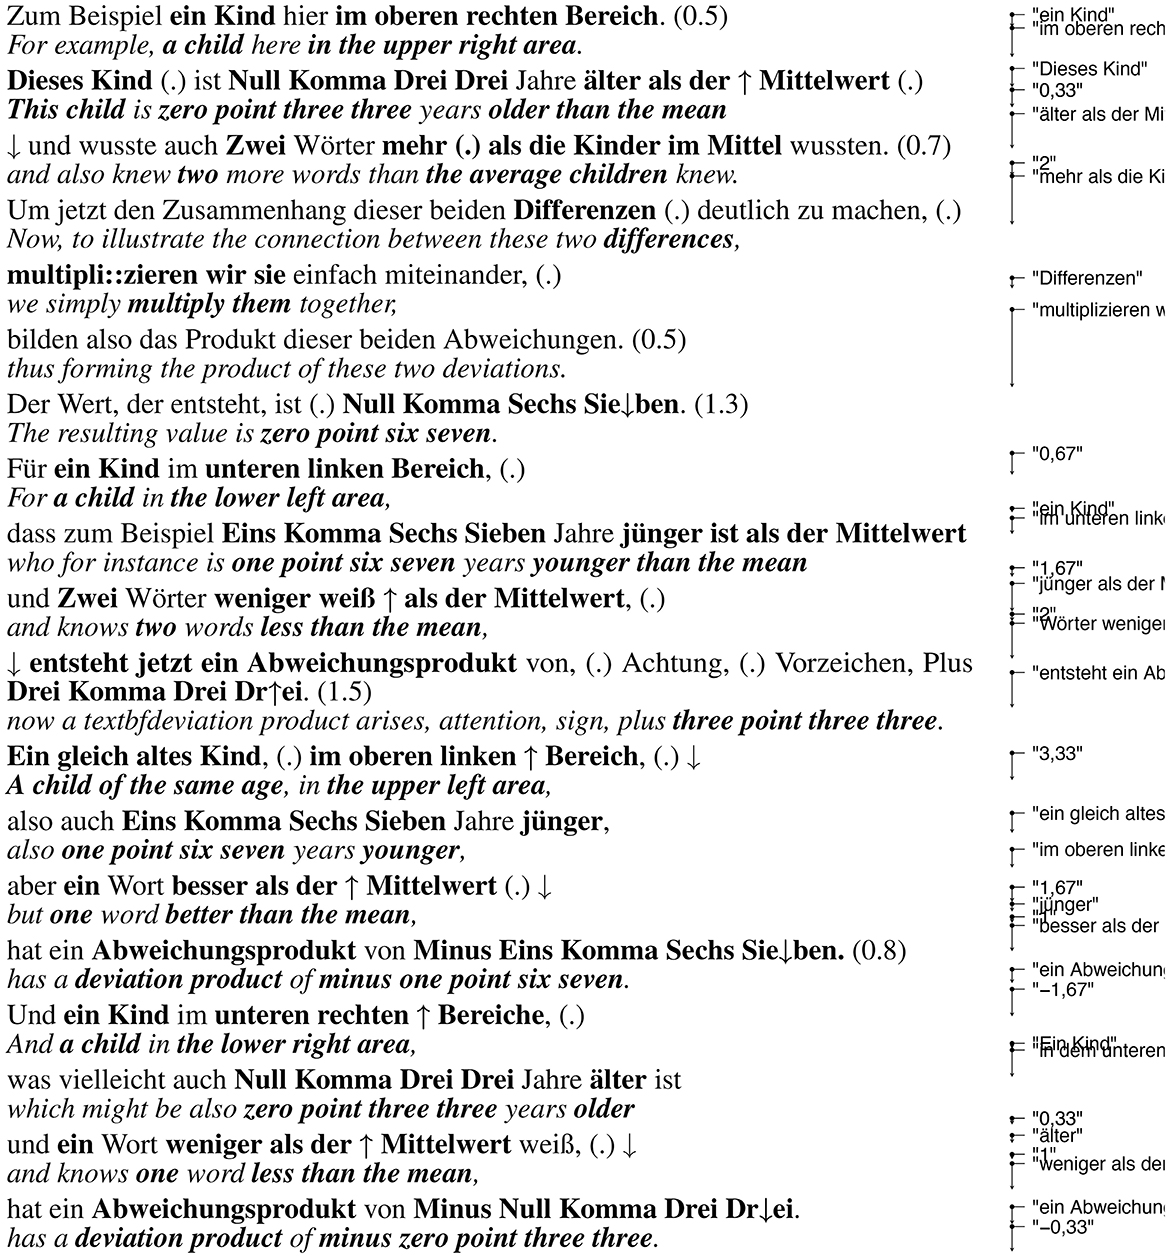
Figure 5. Left: Verbal transcript of the presentation accompanying discussion of the example slide in Jefferson notation, augmented additionally to show the phrases picked up in the cohesion analysis in bold. Right: the corresponding cohesive chain for the spoken language (with labels truncated right to save space and vertical extents corresponding to their actual temporal positioning: see below).
The slide is naturally quite complex in its own right, consisting of the data points, the overall graph within which the data points are placed, visual representations of differences between x and y values and group averages, visual highlights of individual points, and call-outs showing the mathematical formulae required to perform the calculations necessary for four selected data points. There are many questions concerning how to present such information effectively, both visually and in combination with the verbal description. The static depiction of the entire slide as it appears in Figure 4 corresponds to only one (and clearly not the best) of many possible presentational styles that would be possible in the dynamic medium of an actual explanation video. For example, the presentation might be aided by a more gradual build-up of the information on display. This is precisely the dimension of variation that we return to specifically in the studies reported below.
For the purposes of establishing a synoptic, complete cohesion analysis, however, we simply need to characterize all of the units present in the visual field, the spoken language, the relationships among these, and the temporal extents over which these contributions unfold. Thus, even a synoptic representation automatically includes time because the materiality of the medium (specifically its canvas: Bateman et al., 2017) is inherently dynamic, making temporal extents a necessary component of its description. This means that time is included in the analysis, but as an unchanging and unchangeable fourth dimension (i.e., a “block universe” view of time). This can then serve as a stable basis for subsequent analyses where the dynamic nature of textual unfolding may be explicitly considered more from the perspective of recipients rather than from the ‘product' as a whole.
The multimodal annotation of this slide is then also correspondingly complex but remains nevertheless fully conformant with the framework introduced above. Indeed, the fact that we can now deal with this degree of presentational complexity already places us in a far better position for systematically exploring any differences in effect and design. The cohesive chain diagram generated directly from the annotated data for the segment of the video discussing the example slide is shown in Figure 6. It should be noted that this visualization “simply” gives a graphical rendering of the many cohesive links in the actual analysis, and so contains considerable information; this is generally the case for any complete cohesive analysis presented visually, even with monomodal verbal texts. The diagram is presented in full here to give a more realistic indication of the quantity of information being produced during analysis, although when working with particular areas from the overall data, it is generally more useful to extract smaller, more focused fragments of the overall data being discussed. This is the approach we take below when comparing the cohesion analysis with the eye-tracking data.
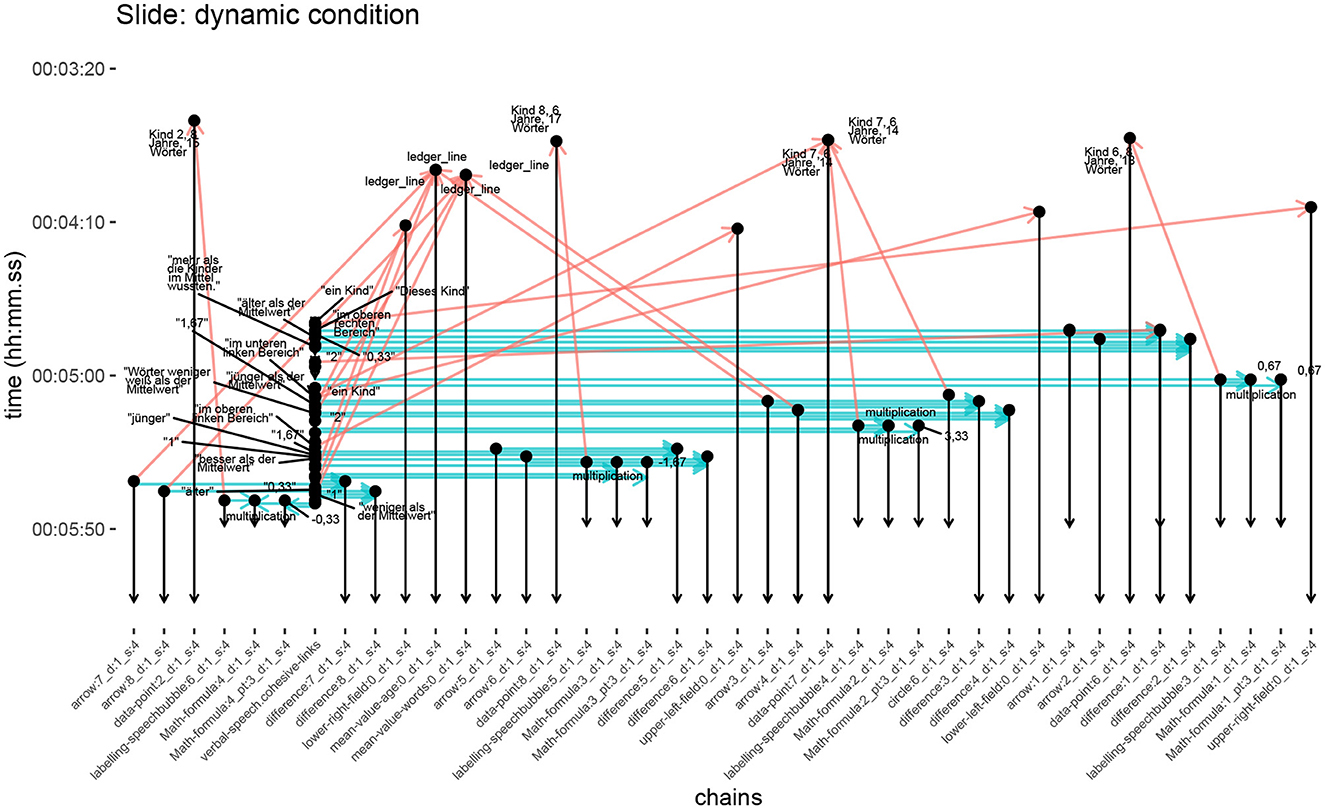
Figure 6. Complete cohesive chain diagram for the segment of video shown visually in Figure 4. Vertical lines denote cohesive chains; horizontal and diagonal lines cohesive links. Chains are annotated with labels that are either from the original data (if written or spoken language), and so are in German, or from our technical annotation framework. An extended version of the highly condensed spoken language chain can be found alongside the transcript in Figure 5.
The conventions used in all of these diagrams remains the same, however. The vertically running arrows identify the various elements present in the visual field and the verbal speech, all with their respective temporal extents. Thus lines which are shorter in height extend for shorter periods of the video. In the present case, many end at the same time, shown by the aligned lower arrow-heads at the bottom of the diagram, because at that point in the video the slide changes and the visual elements denoted are then no longer present. The very densely interconnected seventh tier from the left is the verbal speech tier, reflecting the fact that individual referring phrases will generally have a much shorter temporal extent than the visual elements being referred to and so it is challenging to present these together in a single static graphic. The fully extended chain can be seen on the right of Figure 5, where the individual phrases that can only be seen in part in the full cohesion diagram are also identified1. In contrast, the individual multimodal references are spread our horizontally by virtue of their being contributed by different chains. The density of the verbal references shows well how, in this case, the speech chain serves as an organizational backbone for the presentation as a whole.
The horizontal or slanted arrows in the diagram show the phoricity relations that hold across the different chains according to the co-reference information maintained in the annotations. These phoric relations are also distinguished as explained above according to whether they are cataphoric, anaphoric, or co-phoric on the basis of the temporal information present in the annotated data; in the current example, there are no cataphoric relations to be seen. Anaphoric relations (shown in red) consequently are those horizontal arrows running upwards on the page, showing the co-reference to be a “referring back” to an element that was already present. Co-phoric references (shown in blue) on the other hand are then the horizontal arrows, which means those co-references hold between two elements that appear synchronously at the same time in the video. As an example, the fourth tier from the left commencing just before 00:05:50 shows a component of a labeling speech bubble (labeling-speechbubble:6_d:1_s:4) referring back to the third tier from the left, depicting a data point (data-point:2_d:1_s:4). The co-reference is then indicated by an arrow slanting upwards because the time of reference follows the time of visual presentation of the referent. The same holds for all other links shown operating between chains, including the spoken verbal information.
Applying the visualizations offers a succinct overview of the fine-grained annotation data, although, as noted above, it is often more revealing to focus in on particular combinations of elements as we do in our discussion of the relation between the discourse structure and the eye-tracking data below. It should also be noted that the cohesion diagrams discussed in this paper already only show the co-referentiality information so as to avoid overloading the diagrams presented still further. It is equally possible to pick out any of the cohesive relations present in the annotation, such as connection information or color cohesion, and so on. These details are omitted for current purposes and are, in any case, better shown interactively.
4 Experimental study
In this section we present the eye-tracking data that will be relevant below for our consideration of their interactions with the cohesion analyses. As indicated above, this data was gathered in a previous experimental study, conducted in German, exploring the effects of certain controlled variations in presentation styles. In particular, the study explored relations between the visual presence or absence of a lecturer in videos together with potential interactions with whether the slides used in the videos included animated elements or not. The overall aim of this study was to examine how the experimental conditions might influence viewer attention and, subsequently, learning effects. For the purposes of the present paper, however, we focus specifically on the eye-tracking results gathered concerning the contrast between the static and dynamic slide presentation conditions for the single selected slide introduced above (Figure 4); for further information about the sample study as a whole (see Schmidt-Borcherding et al., in preparation).
Bringing the previous study results together with our current objectives of relating cohesive structures with eye tracking data, our basic hypothesis is that instances of insufficient cohesion signaling should have detectable effects on the gaze behavior. A prime example of such insufficiency is when the formal co-reference relations attempt to span too great a temporal distance and so fail to effectively bring together the mode ‘doing' the co-reference work and the mode being co-referenced. Hence, it is our assumption that differences between the sets of eye-tracking data gained from the two experimental conditions might be correlated with corresponding differences in the discourse organization. We address this hypothesis directly in Section 5 below.
4.1 Materials and methods
The (sub-)sample relevant for the purpose of this paper consisted of 22 students of education sciences (mean age = 24.71 years; 17 female) who participated in the study as part of a course requirement. Students were asked to learn about covariance and correlation with a ten-minute educational video consisting of 15 presentation slides shown on a 15” laptop screen. Several versions of the video were prepared, created previously by Florian Schmidt-Borcherding for the purpose of earlier experiments focusing on coherence. The results concerning two of the prepared video versions are relevant here; these varied coherence in two ways. In version A, called the “high coherence” condition, individual elements of the presentation slides in the video (sequential text elements, diagrams, circles, arrows, color coding etc.) occur dynamically and synchronously with the verbal speech. In version B, called the “low coherence” condition, the compositional elements of an entire slide being presented appear under static visual development conditions, i.e. elements do not occur successively but concurrently “all at once,” and are consequently not synchronous with speech. The contents of the slides and the verbal explanation were the same in both conditions (cf. Figure 5). The slides filled the whole screen while verbal instructional explanations were audible, but without the speaker being shown.
Participants were randomly assigned to the two experimental conditions, with 11 participants in each condition. The eye movements of each participant when engaging with the videos in the two conditions were recorded by having the participants wear eye-tracking glasses while learning with the video. For this, we used a head-mounted eye tracking system (Tobii Pro Glasses 2) with a sampling rate of 50 Hz2. The eye tracking glasses recorded (a) the gazes of both eyes (i.e., binocular) and (b) the visual stimuli in front of the students eyes. Students were tested in single sessions in a windowless room.
4.2 Data preparation
Calibration of the eye tracking system to the participants' eyes failed in three cases. Hence, the further preparation and analysis of the eye tracking data discussed here is based on 19 valid data sets, ten in the high and nine in the low coherence conditions, respectively.
For the exploration reported here of relating both eye-tracking data and discourse analysis, we selected a particular sequence within the videos for detailed study, preparing the eye-tracking data accordingly. This segment concerns the presentation and explanation of the slide already shown in Figure 4 above. The interval of this video sequence extends from 04:42 min to 05:44 min in the videos as a whole, resulting in a duration of 62 seconds. When conducting eye-tracking experiments of this kind, it is generally beneficial to define particular spatial areas (areas of interest: AOIs) in the visual materials being used as stimuli so that gaze behavior can be contrasted specifically for those areas under differing viewing conditions. Consequently, we defined eight non-overlapping AOIs for our complex slide, positioned with respect to the slide as indicated in Figure 7. For ease of reference, these AOIs were numbered so as to follow the approximate ordering of the spoken discussion of those areas, although nothing hinges on this in the analysis. These AOIs themselves are then kept constant across the two experimental conditions of dynamic and static presentation so that any systematic differences found in gaze behavior can be attributed to variation in the conditions.
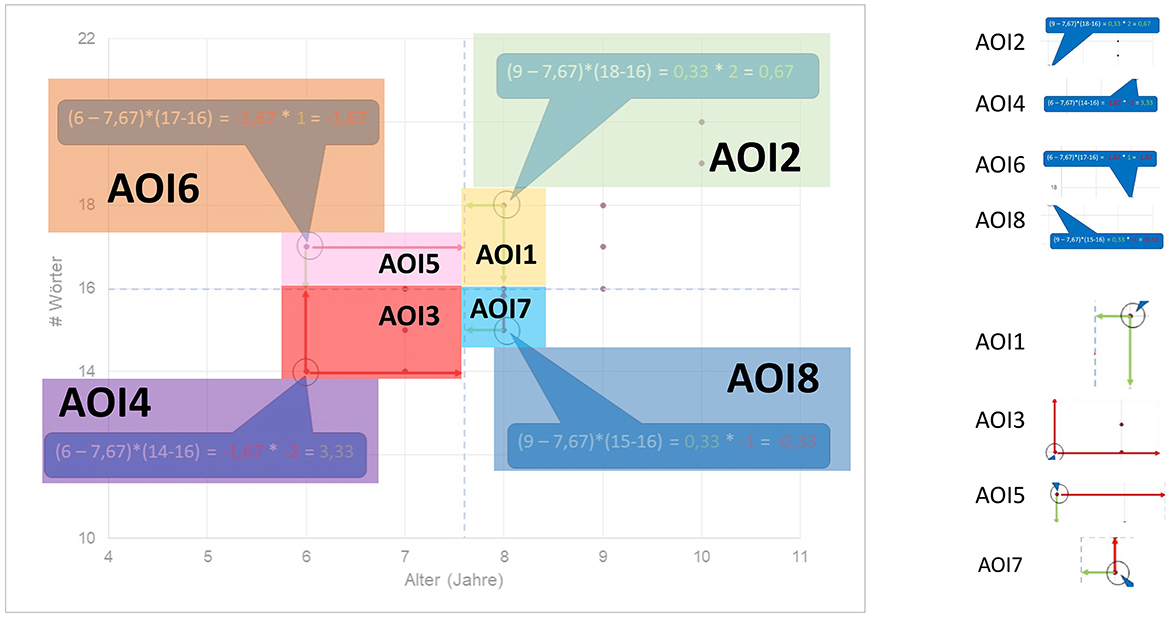
Figure 7. AOIs for the example under discussion superimposed over the original slide.
The sequence was also temporally divided into eight respective Times of Interest (TOI) to focus comparisons further. These TOIs are defined in broad correspondence to the AOIs: that is, a new TOI is defined as starting as soon as the first reference in the verbal speech is made to an element present in the corresponding AOI. Since the signaling function in the high coherence condition was applied by synchronizing dynamic elements with verbal speech, the TOIs also correspond with the onset of these elements.
As explained above, the segment at issue here is concerned specifically with presenting and explaining a graph depicting the divergences of four previously determined individual data points from an overall set of 15 data points, representing children with varying ages and variable active vocabularies. The graph itself with its two axes of “age' and “vocabulary' had already been established earlier in the video's discourse. The visual information focusing on the explanation of the divergences between data points and mean values was then added in one of two ways according to the two experimental conditions. In the dynamic version of the video the extra information was added successively and synchronously with the verbal speech; while in the static condition, the extra information was already present in the new slide. In the dynamic case, both the previously introduced parts of the graph and any newly appearing elements remained visible until the discussion of the divergences of each of the four data points had been concluded. As was seen in Figure 4, the divergences discussed are shown in the graph in terms of their relations to the mean values of the data set as determined through multiplication formulae presented in “speech balloons.” The data points and divergences then form the contents of the odd numbered AOIs shown in Figure 7; the mathematical formulae constitute the even numbered AOIs.
For the time intervals corresponding to this sequence, the raw eye tracking data were aggregated into fixations using the default value thresholds for fixation duration and recognition implemented in the Tobii Pro Lab Eye Tracking software. A fixation is defined as a time interval during which the eye gaze is maintained at a single location. Typically, those fixations alternate with so-called saccades, which are quick movements of the eye to the next fixation location3. During a saccade the eye is functionally blind. Hence, according to the eye-mind-hypothesis (cf. Just and Carpenter, 1980), the location of fixations can be interpreted as indicating the locus of visual attention, the duration of fixations can be interpreted as an indication of the amount of visual attention devoted to the locus of attention, and the sequence of fixations can be interpreted as the shift from one locus of visual attention to the next.
In a second step, we further aggregated fixations into the spatial and temporal dimensions of attention to the sequence. For each participant, we summed fixation durations on each AOI for each TOI, giving 8 (AOIs) × 8 (TOIs) = 64 variables representing the amount of visual attention devoted to a specific part of the slide during a specific time interval. The combination of AOIs and TOIs can be visualized in a matrix as shown in Table 1.
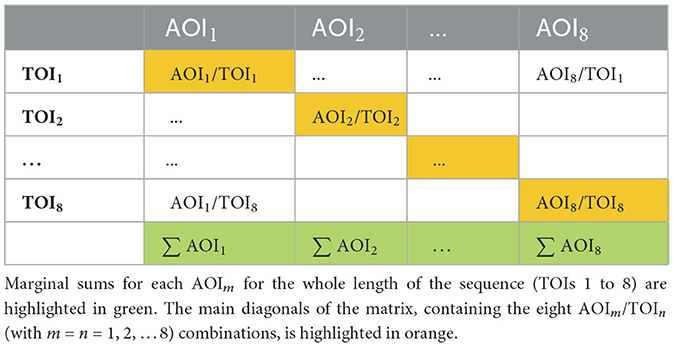
Table 1. Schematic matrix of the 64 AOIm/TOIn (m, n = 1, 2, ..., 8) variables aggregating single fixations across the analyzed video sequence.
The present analysis aims to focus on the distribution of visual attention during the specific sequence. Absolute values of fixation durations may then be misleading for such analysis because of two possible measurement errors. First, even though the video has a fixed length, participants may vary individually in the absolute time they devoted to watching it. Second, even in the most reliable eye tracking measures there is still some data loss–that is, fixation durations do not necessarily sum precisely to the length of the measurement sequence. To deal with these potential sources of variation, we calculated a relative attention distribution value for each of the 64 variables. This relative attention distribution was calculated by dividing the fixation duration of each specific AOI/TOI-combination (i.e., {AOIm/TOIn}m, n = 1, 2, …, 8) by the sum of all AOI/TOI-combinations for each participant.
4.3 Results
To statistically describe differences in viewing behavior between the two experimental conditions, we performed two Analyses of Variance (ANOVA). Both ANOVAs were conducted as a 2 × 8-factorial design with the between-subjects factor of coherence being high vs. low, and a within-subjects factor AOI referring to the AOIs 1 to 8, respectively.
In the first ANOVA, the dependent measure was the relative amount of visual attention devoted to each AOI over the whole length of the sequence. That is, for each AOI we summed up the relative fixation times from TOI 1 to TOI 8 for each participant. The descriptive statistics are shown in the left-hand group of columns in Table 2. The results revealed a significant main effect for AOI [F_(7,11) = 3.493, p = .032, = 0.69], indicating that visual attention irrespective of the the coherence condition is not evenly distributed across the AOIs of the sequence. This statistical result is illustrated in Figure 8A by the zigzagging line. The main effect for the between-subjects factor of coherence could not be calculated with the relative sum of AOIs over the whole sequence as the means in both conditions sum to 1. There is simply no descriptive difference between both conditions in the relative fixation times that could be further statistically qualified. Nevertheless, an effect of coherence is qualified by a significant interaction between AOIs and coherence [F_(7,11) = 4.643, p = .012, = 0.75]. As can be seen in Figure 8B, visual attention appears more evenly distributed across the eight AOIs in the high compared to the low coherence condition. Post-hoc t-tests with the between-subjects factor coherence (high vs. low) for AOIs 1 to 8 respectively, revealed the differences in AOIs 4, 5, and 6 to be significant at a 0.05 level. After Bonferroni-correction (p = .05/8 = .006), only the relative amount of visual attention paid to AOI 5 remained statistically different between both conditions, however.
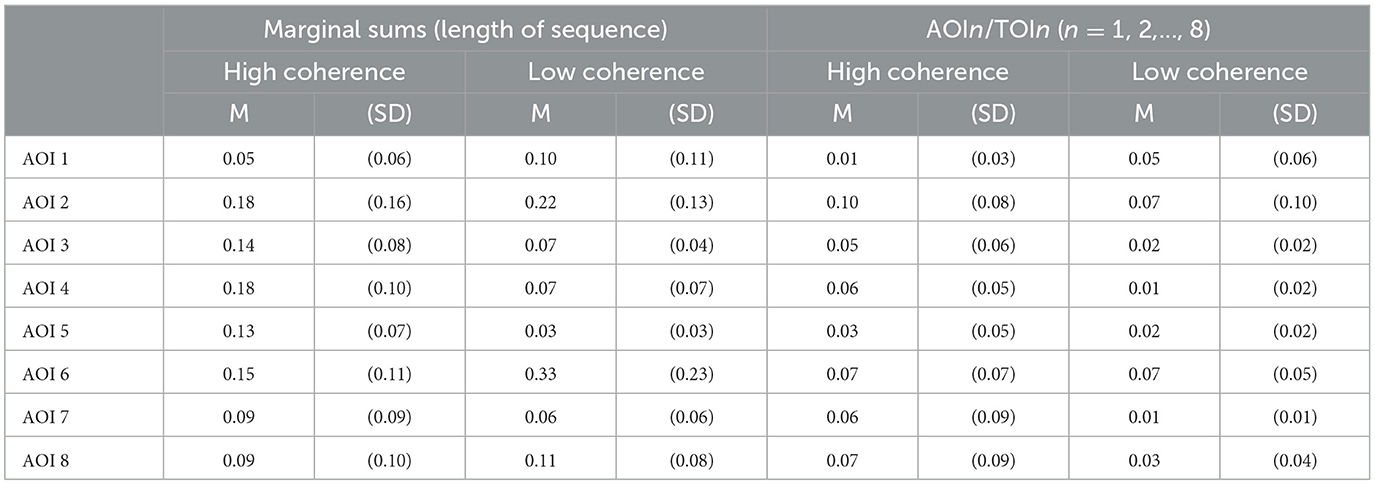
Table 2. Means (M) and standard deviations (SD) of relative fixation durations for high and low coherence conditions on AOIs: (A) as marginal sums for the whole length of the video sequence (left columns), and (B) for AOIn/TOIn (n = 1, 2, ..., 8) pairs.
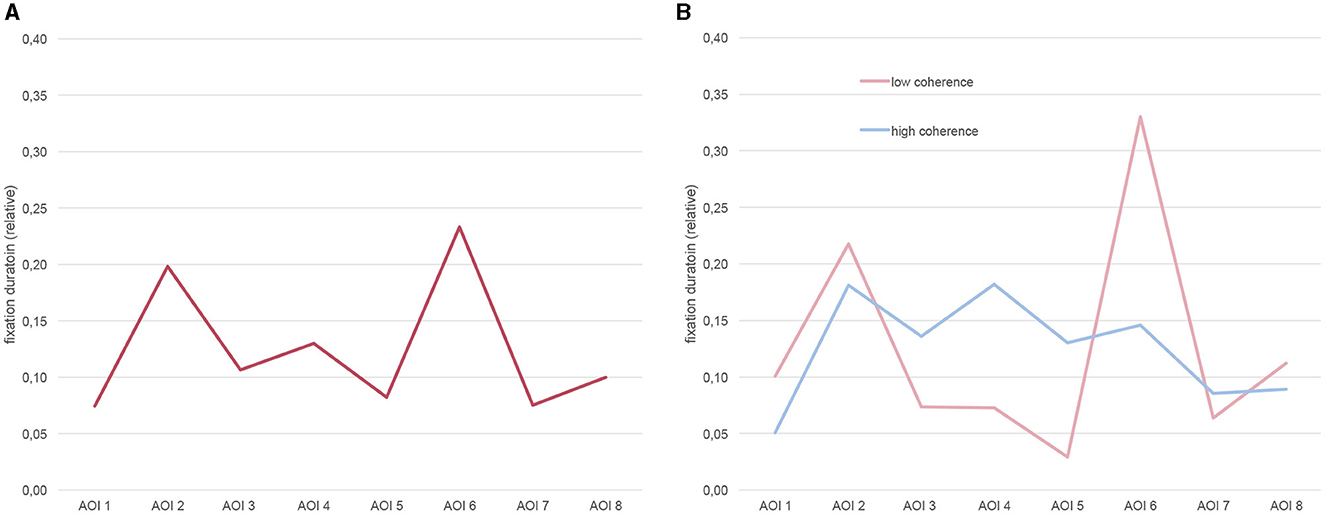
Figure 8. Distribution of visual attention (expressed in relative fixation durations) over AOIs for the whole length of the sequence (i.e., summed up over TOIs), (A) averaged across all participants (left panel), and (B) differentiated between high and low coherence conditions (right panel).
In order to get a clearer picture of how attention distribution might be altered by coherence between the spoken language and the visual information we conducted a second ANOVA with just the eight AOI/TOI-pairs lying on the diagonal of the AOI/TOI-matrix (i.e., {AOIn/TOIn}n = 1 − 8, cf. Table 1). The rationale for this analysis is the assumption that these pairs should better reflect the “cohesion path” of the video as grouped around both the spatial areas and the temporal intervals relevant for each AOI/TOI pair. The descriptive statistics for this are shown in the rightmost columns of Table 2. Results again revealed a significant main effect for AOI [F_(7,11) = 3.292, p = .038, = 0.68], indicating that visual attention irrespective of the videos' coherence is not evenly distributed across the AOIs of the coherence path. This statistical result is illustrated in Figure 9A, again by the zigzagging line. The ANOVA also revealed a main effect for coherence [F_(1,17) = 9.773, p = .006, = 0.37] indicating that the amount of visual attention paid on the coherence path of a video varies with the coherence of the video. Indeed, while in the high coherence condition more than 45 percent of the measured visual attention was paid on the coherence path on average (SD = 15.53), this attention sums up to only 27 percent in the low coherence condition on average (SD = 8.74). This effect is illustrated in the right-hand panel of Figure 9. With the exception of AOI1/TOI1, the line for the high coherence condition is above the line for the low coherence condition. The interaction between AOIs and coherence failed statistical significance however, albeit only just [F_(7,11) = 2.903, p = .056].
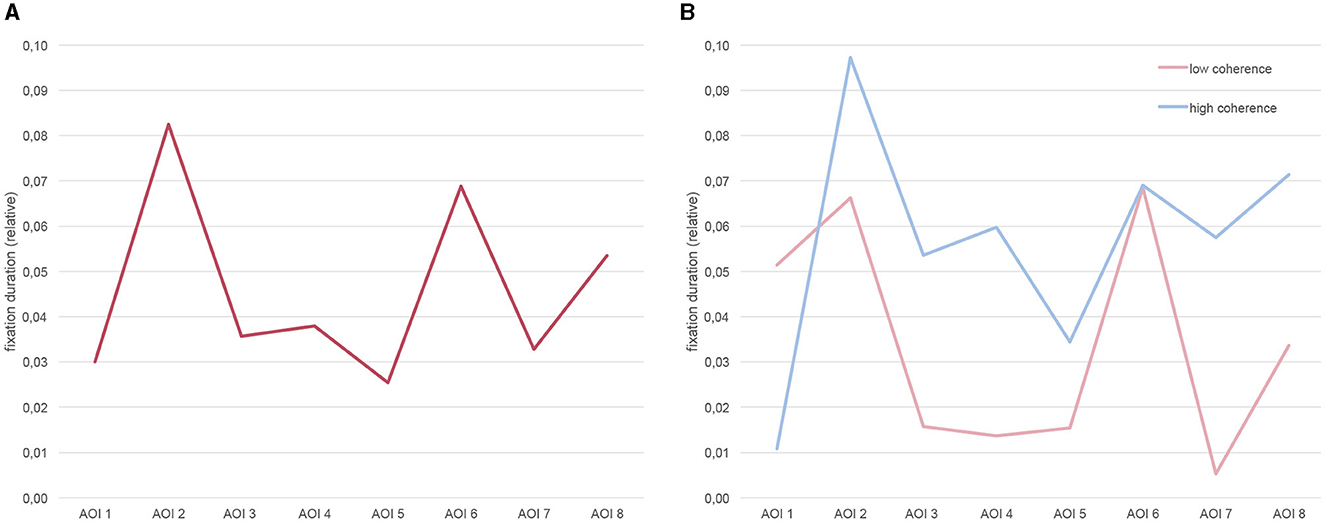
Figure 9. Distribution of visual attention (expressed in relative fixation durations) over AOIs for their specific TOIs (A) averaged across all participants (left panel), and (B) differentiated between high and low coherence conditions (right panel).
4.4 Discussion
Taken together, the experimental study revealed that participants gaze behavior was affected by the two presentation conditions. Concerning the overall distribution of visual attention across the most relevant parts (AOIs) of the slides, signaling the relevance of these parts dynamically and synchronously with the verbal speech (i.e., the high coherence condition) led to a more even distribution of attention compared to a static slide presentation lacking these signals (i.e., the low coherence condition). Although the -value of this shift (i.e., the interaction) indicates this effect to be (very) large, we could hardly identify single AOIs to explain it, probably due to the effect working in both directions. Descriptively, four AOIs gain more attention (3, 4, 5, and 7) and four AOIs gain less attention (1, 2, 6, and 8) in the high compared to the low coherence condition. More remarkable from a descriptive perspective is that the divergence between the two conditions appears to be high in the middle AOIs (3–6) while the gaze behavior on AOIs 1, 2, 7, and 8 appears comparable. Intuitively, a growing divergence is reasonable since the time lag of appearance for the AOIs between high and low coherence conditions also grows from AOI 1 to AOI 8. However, the validity of this interpretation is called into question by the similarly low attention devoted to AOIs 7 and 8 in both conditions.
Shifting the focus from overall attention distribution to a path-like measure revealed an even more differentiated picture of the participants' gaze behavior. First, participants in the high compared to the low coherence condition spent much more time on an AOI when it was first referred to (i.e., the AOI/TOI-pairs in the diagonal of the AOI/TOI-matrix, cf. Table 1). This shift indicates how much additional visual attention is pulled to these AOIs by signaling features. That is, the signaling causes the gaze behavior to more strongly follow the coherence path of the video, and, thus, presumably homogenizes the gaze behavior to be more similar between participants in the high coherence condition. While the conclusion “signaling draws attention” appears trivial at first glance, attention to an educational video is assumed to serve the purpose of learning its content. That is, in order to understand the capability of signals to draw attention, we need to bring together actual attention allocation (i.e., the empirical gaze behavior) with the presumed functions of particular signals for the cohesive structure of a video. This is then what remains to be addressed by the formal multimodal description of the material that we now present.
5 Correlating the eye-tracking study and the cohesion study
So far in this paper we have provided two building blocks for approaching explanation videos empirically. First, we introduced a detailed annotation scheme for any explanation videos exhibiting multimodal complexity. Second, we showed differences in observed gaze behavior for video presentations contrasting with respect to their synchronization of visual information and accompanying spoken language. In this section we attempt to triangulate aspects of the discourse structure revealed by our annotation against the variation observed by the eye-tracking data.
This will serve several functions. First, it is necessary in general to provide empirical support for the kinds of distinctions shown in the discourse analysis; differences in discourse organization should correlate with differences in measurable behavioral factors among recipients. If this were not the case, then we have no basis beyond purely theoretical argument that the discourse analysis is actually capturing significant aspects of the objects analyzed. Second, and more specifically, if we can match formal properties of the discourse analysis with attention allocation, then we will be one step further toward being able to provide a systematic way of predicting to what extent particular video designs may help guide attention. By these means we may begin to isolate characterizations of signaling properties that are anchored both in fine-grained details of form and in predictions for reception effects. It must be noted, however, that the extent, if at all, that correlations can be found between a detailed cohesion analysis of multimodal text organization and the reception of texts so analyzed remains an open research question at the present time. Indeed, as we shall see, this is a complex undertaking that requires significant further work.
5.1 Cohesion analyses of the selected contrasting examples
As explained above, in order to organize the eye-tracking data for comparison across experimental conditions, it was useful to identify specific spatio-temporal segments for close attention. A similar range of considerations now needs to be applied to the cohesion analysis since the cohesion analysis of a segment of video provides only a snapshot of the relations holding between elements within that segment. That snapshot is “static” in the sense that all the cohesive relations constructed during the segment are recorded and made accessible for analysis.
To relate such “synoptic” analyses to the unfolding of a viewer's understanding of a video, therefore, we need in addition to incorporate the theoretical construct of logogenesis (Halliday and Matthiessen, 2013, 63), which sees texts articulating structures and relationships over time as they develop. For linear monomodal written text, this development is essentially one dimensional, although the structures and relationships constructed are generally more complex. In the multimodal audiovisual case, the situation is more complex still as the material can also include multiple simultaneous strands of development. These strands are what are captured in the overall cohesive analysis as illustrated above in Figure 6.
We can capture the dynamic unfolding of multimodal texts by augmenting the synoptic cohesion diagrams in two ways. First, we employ a notion of a textual “now” that moves successively downwards through the diagram as the text unfolds. Cohesive relationships that have not yet been made with respect to this “now” cannot have an influence on discourse construction and so are considered inaccessible for purposes of characterizing the point-by-point cohesive organization of the text. And second, we focus on just those portions of the cohesive analysis that are “present” with respect to the temporal “now.” This is particularly important for considering the consequences of the overall difference between the static and dynamic experimental conditions. Since the static condition does not allow any development of the contents of slides during the presentation, this corresponds to a restriction to the possibilities of the material of the medium: in short, the canvas (see above) is restricted so that it is not dynamic. As we shall see in a moment, this change in canvas means that the synoptic description of the cohesive relations applying may also change in quite specific ways.
The inclusion of these dynamic aspects allows us to draw a natural connection with the methods employed in the eye-tracking study. We first focus on portions of the overall cohesive analysis by selecting just those cohesive chains representing elements present visually within the defined AOIs. An AOI then corresponds to a subset of the cohesive chains in the cohesion diagram overall. We also define respective “now” intervals to correspond to the defined TOIs of the eye-tracking study. Combining these two aspects allows the temporal and the visuospatial restrictions to provide regions within the cohesion analysis that, on the one hand, may be used for calculating spatiotemporally restricted cohesion statistics of various kinds and, on the other hand, may be compared with the corresponding AOI/TOI figures provided by the eye-tracking data. We hypothesize that such cohesion statistics will differ according to whether the visual information is aligned with the spoken language or not.
The change in experimental condition also has consequences for the cohesive chain diagrams concerning the temporal intervals involved. Whereas in the static condition, some element would be present for the entire time that that visual is “on screen”—typically for the entire duration of a single slide, in the dynamic condition the same element may appear and disappear even within the duration of a single slide. This means that the corresponding cohesive chains have different temporal extents across the two conditions, resulting in connecting arrows of different lengths in the diagrams.
As a concrete example of this, we can contrast the diagrams constructed for a selected area of interest in both the static and dynamic video conditions. Figure 10 shows corresponding cohesion diagrams for AOI7 in the two conditions. As noted above, the basic multimodal “make-up” of odd and even numbered AOIs respectively is consistent within each group in that the odd numbered AOIs refer to the data points and the even numbered AOIs refer to the mathematical call-outs. In this sense, AOI7 serves as an exemplar for all odd-numbered AOIs. However, AOI7 is also a region that exhibited a considerable difference between the static and dynamic conditions in the eye-tracking data (cf. Figure 9) and so is an interesting case to consider. Diagrams for all the AOIs from the study in both conditions are given in the Supplementary material.
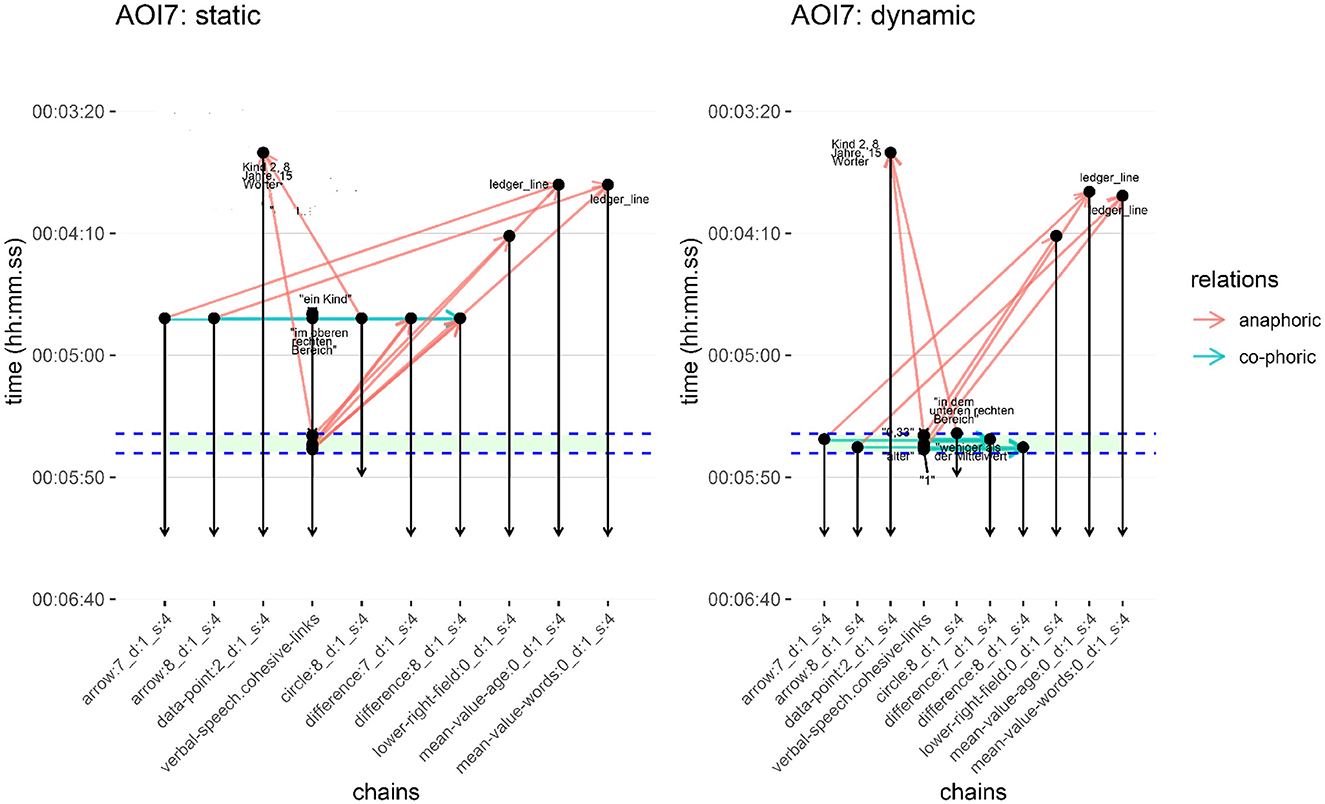
Figure 10. Cohesive chains AOI7 for both static and dynamic conditions. The green band running across both figures indicates the defined time of interest (TOI7) from the eye-tracking study. Anaphoric and co-phoric links are marked as before.
Contrasting the two diagrams for AOI7 reveals two prominent points of difference. First, among the visual elements forming cohesive chains, there are temporal disparities across the static and dynamic conditions concerning both the occurrence of those visual elements and, consequently, their establishment of references. And second, the distribution between anaphoric and co-phoric relations appears quite different. Under the static condition, the cohesive references are primarily of an anaphoric nature (giving 11 such relations in total), while co-phoric references are notably sparse (2 in total), occurring around the 4:50 minute mark; conversely, in the dynamic condition this distribution reverses giving a more balanced distribution between co-phoric (6) and anaphoric references (7). Thus, in the static condition, visual cohesive chain elements appear “earlier” and so establish references to other elements in different cohesive chains earlier as well. In the dynamic condition, the same visual elements occur and build references “later”—in this case almost exclusively within the time of interest defined for the AOI as indicated in the figure. The verbal elements offer an exception to this general contrast, however, since they engage in phoric relations at the same time in both conditions. Their temporal information therefore remains the same, although the specific types of phoric relations holding are determined by the relative temporal positions of the elements being related and so vary.
This pattern of difference can be observed across all the AOIs, as can be seen visually in the graphs in the Supplementary material. But we can also capture this quantitatively by considering the overall counts of the different phoricity types between the static and dynamic conditions and across the defined AOIs. These are tabulated in Table 3. We see here that the number of anaphoric and co-phoric references under the static condition differ greatly compared to those in the dynamic version in general. This can be explained due to the fact that in the static case, visual elements do not occur successively but all at the same time and so appear earlier in the discourse compared to the dynamic condition where, again, elements occur synchronously to verbal speech. The temporal development of the verbal speech itself in both versions remains the same. Taking these points into consideration, consequently, there are more anaphoric references present in the video under static conditions and far fewer co-phoric ones, whereas under dynamic condition this distribution is more leveled.
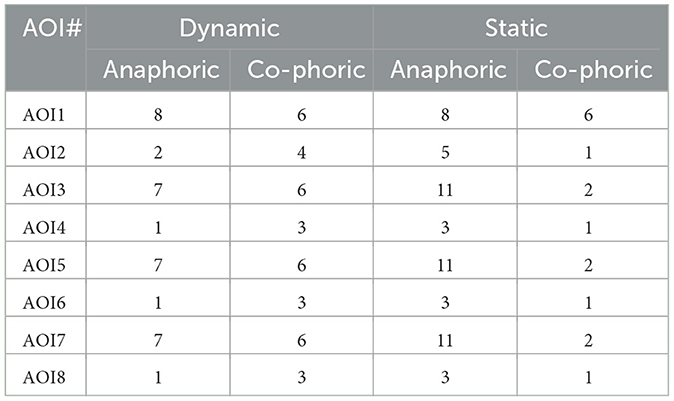
Table 3. Counts of anaphoric and co-phoric references per AOI and per condition (dynamic vs. static).
Another way of bringing out the differences in cohesion analysis across the two experimental conditions is to compare the proportions of the distinct types of phoricity relations. For this, we scale the absolute count of phoricity relations, anaphoric or co-phoric in the present case, by the number of cohesive chains in the focused area of interest overall. The reason for this is to avoid over-scoring particular regions simply because they have more elements being related. This is a loose correlate of scaling done for the eye-tracking data concerning the absolute sizes of the areas of interest. Whereas a larger area might be expected to receive more fixations simply by chance, here we might expect there to be more cohesive relations simply because of more elements being present. Graphs of the scaled results, separating out anaphoric and co-phoric relations across both the experimental conditions and the AOIs are shown in Figure 11. Here the difference in behavior is very clear. In the static condition the proportion of co-phoric references dramatically decreases after AOI1; since the visual elements are, by and large, already present, most relations are necessarily anaphoric, although there is systematic variation between the odd and even AOIs, again reflecting their distinct compositions as set out above. In the dynamic case, there is a far more even use of co-phoric and anaphoric cohesive links. Considering just the phoric relation totals as shown on the right of the figure, the difference in use across conditions is highly significant (χ2 = 12.042, df = 1, p = .0005).
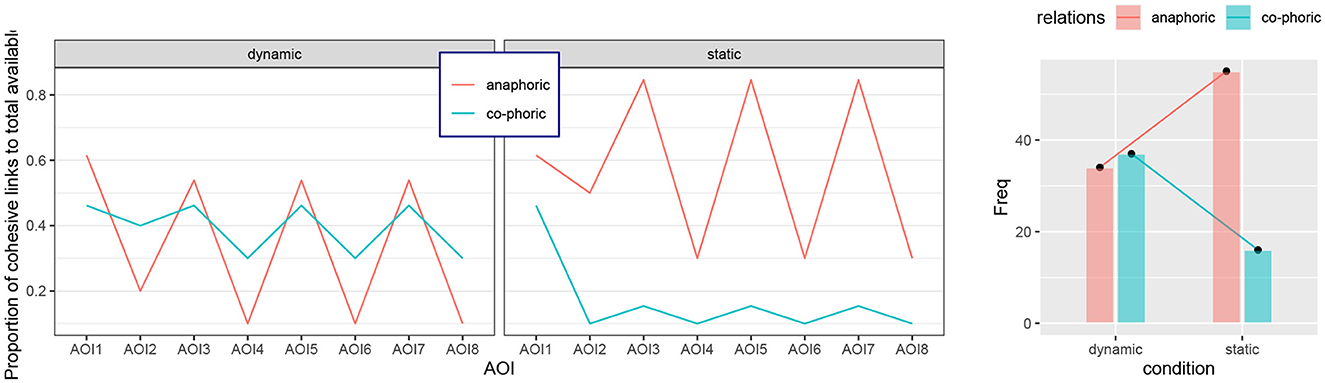
Figure 11. Respective proportions of anaphoric and co-phoric relations across the distinct AOIs and conditions. Left: across AOIs; right: difference in count totals across conditions.
The graphs also suggest that there are marked differences between the odd and even AOIs. This is suggestively similar to the differences in fixation times observed in the eye-tracking data above. As noted there, the even and odd AOIs are rather different in their multimodal composition (cf. Figure 7). This appears to be reflected in their cohesive properties as well, although the situation quantitatively is less clearcut. Grouping the odd and even AOIs and comparing those groups' total phoricity counts within conditions and across anaphoric and co-phoric references shows a mixed picture. In the dynamic case, differences in the counts for anaphoric and co-phoric relations fall just short of significance at the 95% level (Fisher's exact test, p = .0596). For the static case, no significant difference in raw counts is found at all (Fisher's exact test, p = 1). Similarly, looking instead at the proportions of anaphoric and co-phoric relations with respect to the total number of available elements across the even and odd AOIs in the two conditions shows an identical pattern: the proportion of anaphoric references increases from dynamic to static, and the proportion of co-phoric references decreases from dynamic to static. Thus, although the counts and the proportions are different for the odd and even AOIs, the pattern of change remains the same and so we will not consider these differences in AOIs further below. More data exhibiting these and other differences in multimodal composition might well show differences, but from the data at hand we can make few predictions.
5.2 The relation to the eye-tracking results
The analysis so far demonstrates that there are substantial differences between the two conditions in terms of their respective cohesion analyses. The contribution of the various AOIs appears of less significance. It remains to be seen, however, whether any of these differences stand in any specific relation to the differences found in the eye-tracking study.
In order to explore this question, the cohesive relation data was augmented further with time-dependent information to reflect more accurately the unfolding nature of the “text” and its logogenesis. The starting and ending points of each cohesive relation present in an AOI analysis were classified with respect to their temporal position relative to the specified time of interest of that AOI. The temporal relations adopted were based on the standard relations from Allen (1983) interval calculus: i.e., intervals may overlap (extending before, after, or both), be entirely contained one within the other, or be disjoint. Following this step, each cohesive relation was annotated additionally according to its phoricity status, the respective time intervals of the elements between which the cohesive relation holds, and the temporal ordering relation of these two intervals with respect to the relevant TOI.
There are then several possibilities for evaluating the data further. To begin, we can again examine the cohesion data “internally” to see if there are other relationships among the calculated features to be brought out. For current purposes this was done by creating generalized linear models to see if selected dependent variables can be “predicted” from other variables in the data. An informal description of this process for multimodal data is given by Bateman and Hiippala (2021); technical details of the technique are, for example, given by Baayen (2008). Following this method, we first examined whether any combinations of the just described annotations added for each cohesive link would function as effective predictors of the experimental condition. That is, we see to what extent the annotation properties group differently according to whether they are drawn from the static or the dynamic condition. On the basis of the visualizations of the cohesive relations for the AOIs given above and in the Supplementary material, one would expect this simply because the configurations look very different.
The regression model produced in this case indeed shows that there is indeed a significant contribution to the prediction of the condition as being either “static” or “dynamic” made by the starting interval of the cohesive relation when it is positioned either inside (p = .04) or overlapping after (p = .0002) the respective time of interest (see the Supplementary material for the full model). There is also a significant contribution for the interval to which the cohesive relation is referring when that interval is overlapping after as well (p = .04). A small contribution (p = .07) is also made by AOI1, which stands out from the other AOIs as already indicated in several of the graphs and counts above. These results are consequently more or less direct corroborations of the visual impressions from the contrasting graphs.
More relevant for our purposes of triangulation is then the relationship between the cohesion configurations and the eye-tracking data. For this, we take the relative gaze duration figures for the two conditions and the various AOIs as given in the right-hand columns of Table 2 above. We then seek to see if these values can be “predicted” by some combination of the annotated cohesive features. To the extent that it is possible to predict durations on this basis, we would have shown that the cohesion analysis offers a proxy for at least some of the behavioral properties that can be measured in reception studies. To establish this prediction, we construct generalized linear models as before, exploring several possibilities.
For our first model we took the same annotated cohesion data as above but used the relative duration times as the values to be predicted rather than the experimental conditions. Since the distinct AOIs had not not been found to show any particular individual influences before, we now took them as a random effect to produce a mixed effect model. Random effects in a generalized linear model are used to capture variables whose values are not expected to contribute systematically to a prediction, instead contributing “noise” potentially reducing the efficacy of the model as a whole (Baayen et al., 2008). The results were then identical to the previous internally generated model: here again the TOI-dependent relations of “overlapping after” and “inside” showed themselves to make statistically significant contributions to a prediction of relative duration. This is consequently interesting as a first triangulation step, suggesting that there are indeed systematic correlations to explore.
To test this further, we next considered a variant of the previous model that instead grouped all of the results for the distinct AOIs together rather than keeping them separate. A model of this kind might plausibly reflect our experimental situation more accurately since we hypothesize that it will be overall cohesive properties of an AOI that play a deciding role and not individual cohesion relations. The data here was therefore aggregated by conditions and AOIs so that counts for each of the phoricity relations were available; these were similar to the counts given in Table 3 but excluded any references to, or from, relations fully outside of the time of interest. The results here need to be treated with some caution, however, as we then only had 16 individual data points (i.e., 2 conditions across 8 AOIs). Moreover, the relative temporal information appeared to mask, or outweigh, the phoricity information as only the former appeared (again) to have a statistically significant effect. Consequently, to focus on these relations more particularly, we constructed a final mixed effects model that only related phoricity relations with the relative gaze durations for the conditions and AOIs, treating AOIs as random effects as before. The results of this model are summarized in Table 4 (the full table is given in the Supplementary material).
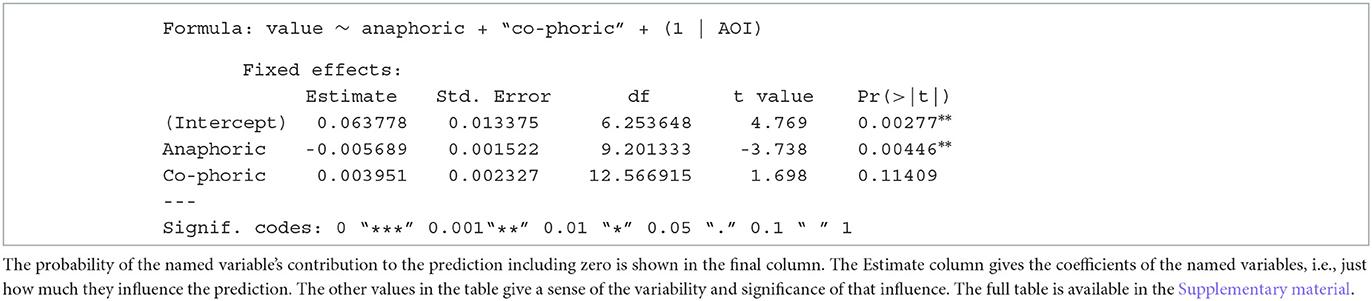
Table 4. Mixed effects model for predicting gaze duration on the basis of phoricity.
Here we can see that there is, indeed, an apparently (highly) statistically significant contribution from anaphoric references (p = .004), although their effect on the corresponding relative gaze duration remains small. Nevertheless, we can take this as at least preliminary supporting evidence that a description of the development of the video in terms of multimodal cohesion may leave measurable effects on properties such as gaze duration. It is interesting in the current case that the experimental condition did not make a significant contribution when added to the model. This may fit well with the “mixed” nature of the experimental stimuli. For example, as we have discussed above, it is not the case that all AOIs behave differently in the two conditions: the material presented concerning AOI1 appears at the very beginning of the video segment analyzed and is consequently uniform across both conditions. This might restrict the ability of the model to distinguish cohesion configurations on the basis of the condition, but the effect of anaphoricity on relative gaze duration remains. Here we need to move to more corpus-oriented evaluations applying the same techniques as set out here but on a larger scale.
Considering the results overall, however, we can now attempt to make some preliminary hypotheses concerning how the cohesive analysis and the eye-tracking data may be brought into closer alignment. As discussed in the discussion of the eye-tracking results, the “high coherence,” or dynamic, condition appears to raise the allocation of attention to the AOIs concerned considerably; this was evident in the difference shown between attention on the “diagonal” components of Table 1 in the two conditions. When examining the cohesion analysis of the two conditions as summarized in Figure 11, there also appears to be a considerable difference between the conditions and, in particular, with respect to the way in which the anaphoric and co-phoric contributions relate.
In short, in the dynamic condition, there is a considerable overlap among the number of anaphoric and co-phoric contributions active across the AOIs. In contrast, in the static condition, these respective contributions quickly separate, leaving the large majority of cohesive links to be filled in anaphorically. This suggests the hypothesis that maintaining co-phoric relations may well increase the likelihood of attention being maintained and could even serve as a beneficial scaffolding device encouraging information integration. This is quite plausible and corresponds well to the general notions of signaling and cueing described above; here it is additionally significant, however, that we have begun to show how such results may be generated by empirical triangulation. Moreover, in terms of potential refinements for eye-tracking studies, this could well be explored further by paying particular attention to, for example, integrative saccades within AOIs across the contrasting conditions as suggested for quite different media by Holsanova et al. (2008).
6 Discussion and explorations
There are clearly still considerable issues of both theoretical and practical import to consider in the relationship between multimodal cohesion patterns and their potential input to the comprehension process. Something of the nature of this gap can be shown by explicitly contrasting the overall metrics obtained from cohesion analysis for the AOIs in the two conditions with the relative gaze duration graphs in Figure 9 above. As would be expected, the relative gaze duration figures show much more variation than that derived purely from the cohesion analysis. These can be compared directly by examining a combined measure of the contribution of cohesion shown in Figure 12. The values in this figure are derived from the respective anaphoric and co-phoric proportions in a manner that attributes higher “scores” when the differences between anaphoric and co-phoric proportions are small, and lower “scores” when the phoricity relations are further apart. The circled points show the AOIs where this metric is equal across conditions. While some of these correspond approximately with the relative gaze durations, there are many cases which do not. We see, for example, that AOI6 scores equally across conditions, whereas AOI7 scores maximally differently. Although this aligns well with Figure 9, the equal scores of AOI1, AOI4 and AOI8 clearly do not align and so the model needs further refinement.
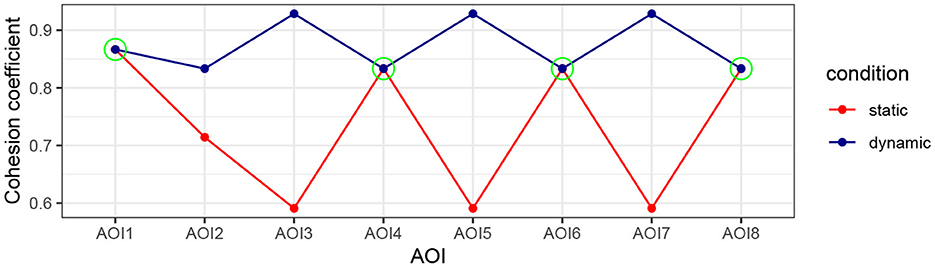
Figure 12. Aggregated cohesion metric for the two conditions across AOIs.
Many issues concerning how we might progressively bring the results closer together relate to aspects of logogenesis, i.e., the way in which we can formally characterize how a multimodal text is developing. There are a number of places where this may be expected to have significant consequences for attention allocation, and so dealing with each of these may improve the match between behavioral measures such as eye-tracking on the one hand, and the formal discourse analysis on the other. This in fact offers a research agenda with particular concrete steps for future investigation.
An illustration of the crucial role of logogenesis and explicit consideration of the “unfolding” of the text is offered by Figure 13. This cohesion diagram shows the cohesive links between chains for the static case of our area of interest AOI3. Here we can clearly see the potentially problematic phenomenon discussed above where visual material is introduced but only referred to verbally much later in the video's development. Thus, on the left-hand side of the cohesion diagram we see the chain constructed by the verbal language containing a densely packed sequence of references to various visual aspects of the slide being presented as also seen in several of our diagrams above. These connections appear as anaphoric (red) links back to the respective chains of those referents. However, we also see two co-phoric relations (blue) among the visual elements occurring between 4:40 and 4:50 min. These ties are established by two arrows shown on the presentation slide (cf. Figure 4) that function as visual depictions of distances between values in the graph.
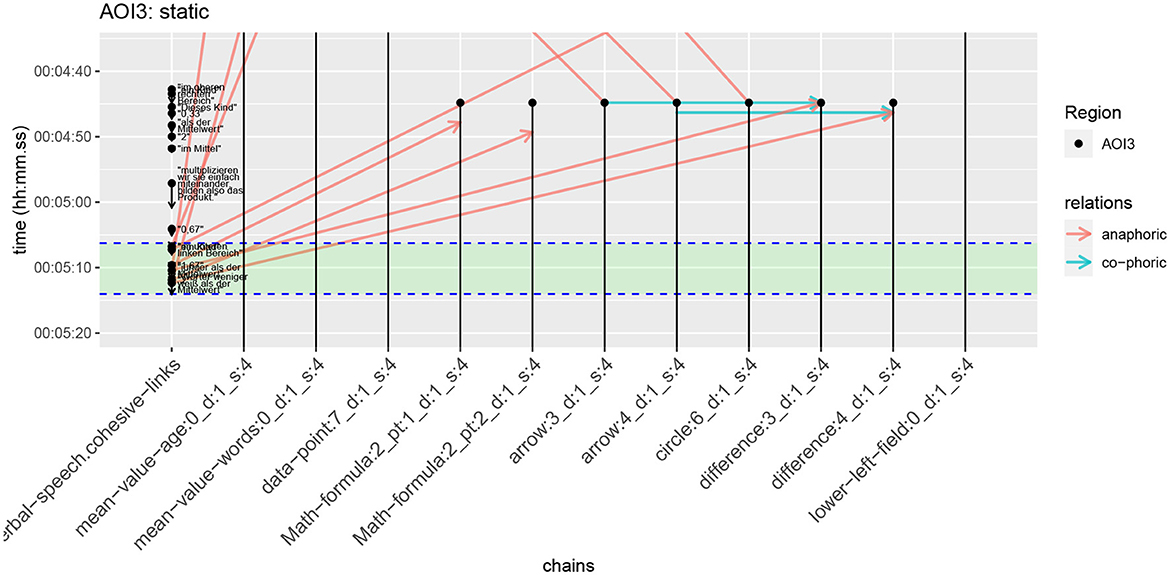
Figure 13. Cohesive chains present in the static version of AOI3. The defined time of interest is marked by the green band; cohesive references are the horizontal or diagonal lines connecting vertical cohesive chains as above.
In our present scheme, establishing the status of ties as either anaphoric or co-phoric relies upon the strict temporal relations holding between the temporal intervals of the elements involved. This is evident in the diagram since the verbal references clearly follow the appearance of the referenced visual elements as shown by the earlier beginning of the corresponding vertical chains, and so are classified as anaphoric, whereas the co-phoric ties appear because co-referential visual elements appeared at the same time. While this is formally correct, such information may be dealt with differently by viewers because links may only become relevant when corresponding verbal references are made: up until that point, the information is visually present but, quite possibly, unattended to. This means that certain relations may be formally anaphoric and co-phoric as described, but may in reception function co-phorically when triggered within the time of interest indicated because this is when the corresponding verbal references occur.
Consequently, on the one hand, there may be conditions under which a visual element that is already present (and hence formally anaphoric) may function analogously to a co-phoric relationship when referenced verbally. Nevertheless, on the other hand, the fact that a visual element appears just when it is referenced is also likely to exhibit a distinct and additional signaling effect of its own. That is: material that has been in the visual field for some time (as holds in the present case) and cases where the information freshly appears (which occurs in cases discussed above where the relevant cohesive chains begin within the time of interest) may need to be treated differently. Characterizing the consequences of these differences in the formal discourse analysis is then a clear challenge for the future and is consequently now placed prominently on our research agenda.
We begun in the previous section to treat such cases by additionally incorporating temporal relations calculated with respect to the specified TOI. This means that the vertical chains involved in the co-phoric relationships shown in the figure are annotated temporally as standing in a “contains” relationship because of the overlap seen between their temporal extents and the TOI. But we were not able to derive further significant results concerning the effects of such temporal relationships. This may be due to the extreme nature of the experimental contrasts adopted. The static condition often shows, as visible in the figure, no co-phoricity, whereas the dynamic condition is already highly synchronous. In designs where this degree of synchronicity is not achieved, it may well be the case that we would begin to see more effects of potentially conflicting temporal information.
We will need to engage with the effects of such configurations more deeply. We might usefully consider, for example, the varying conditions under which the formally distant co-phoric relations visible in Figure 13 may be “brought into” the green zone of temporal interest by verbal (and other) signaling. If, for example, there were many potential referents in the visual field and the verbal signal was insufficiently precise to discriminate effectively, then one would expect that the difference between an element already being visually present and appearing temporally synchronized would have greater consequences. Such differences have also been studied in the area of multimodal referring expressions (e.g., van der Sluis and Krahmer, 2007), which could well provide useful additional input. This is also where we would place further signaling strategies such as spoken prominence, deictic gestures, and similar.
It is also likely that it is not only the bare presence of an anaphoric relationship that plays a role, since such relationships may stretch over very different temporal intervals, corresponding to more straightforward “distance” in linear monomodal written text. When the differences in such temporal intervals become large, as is often the case in static presentation slides, corresponding references may fail to serve as effective guides of attention. In contrast, anaphoric references with small temporal differences between participating elements may then merge functionally with the effects of co-phoric references. Given this hypothesis that more “distant” anaphoric references then might not effectively guide attention, whereas “close” anaphoric as well as co-phoric ones might, our results could be further refined by employing restrictions responsive to these temporal differences. As there are, as discussed above, greater temporal differences between two elements engaging in a phoric relation under the static condition, this would motivate the hypothesis that for most of the anaphoric references in the static case, cohesion has not been so successfully signaled and thus attention was not being guided well.
Just how “forcibly” potential cohesive relations may be brought into the relevant temporal interval may then depend on a range of “signaling” or cueing factors that can now be studied more systematically for their effects. Moreover, as mentioned in Section 3.2 above, we have focused for current purposes specifically on multimodal cohesive relationships based on co-referentiality, but there are several further kinds of relationships that it would be natural to add, such as verbal stress and intonation on certain cue words, or cohesion based on form (e.g., color), and linking cohesion, such as causal and other types of connectives. All of these would be hypothesized to have effects suggesting that certain textual elements stand in specific relations to one another and so extend the texture of our discourse representation. These should all in the future be brought together for a more complete account of discourse signaling within a single integrated framework, for which the scheme defined here offers a robust foundation.
7 Conclusions and future work
In this paper, we have extended a previously introduced systematic, fine-grained annotation framework (Bateman et al., 2021) designed for the purpose of generating cohesion structures in explanation videos and explored whether differences in cohesive organization could be related to gaze data. For this, we drew on results from an earlier eye-tracking study which measured gaze behavior among a set of subjects for specific areas of interest of an explanation video. Comparing those eye-tracking results with the cohesive discourse structures of those AOIs supported the notion that fixation duration on areas that were referenced in the discourse in a synchronous manner showed differences characterizable in terms of phoricity relations. However, this hypothesis necessitates considerable further quantitative evaluation as well as extensions concerning the circumstances and variables to be drawn from the discourse analysis. Several directions for such extensions were outlined in the discussion in Section 6.
Our preliminary findings, upon which future work can build, suggest that co-references between two textual elements that are established more or less synchronously to the emergence of those elements will be more in line with established signaling principles. This means that textual elements referencing each other should appear within a relatively similar timeframe in the discourse of the video (i.e., be co-phoric references) and be discoursally coherent as well. This offers potential support most directly for Mayer's principle of temporal contiguity (Mayer, 2009), but goes considerably further in tying our findings to specific identifiable elements in the overall multimodal presentation, rather than to notions of “text” and “image” as units. This makes it possible to pursue more fine-grained extensions of signaling accounts by examining more closely differences brought about by both the form of elements standing in cohesive relations and their precise temporal relationships, as set out in Section 6. This should allow us in subsequent research to scrutinize just those discourse structures that offer the most effective signaling possibilities at arbitrarily fine scales as might be needed for individual presentations..
Although we have outlined discourse structures that can serve as a scaffold for placing previous proposals for signaling principles in order to probe them further empirically, the present study has only focused on two possible and very distinct presentation styles for explanation videos. Empirical data involving a wider range of “mixtures” between the extreme cases of synchrony and non-synchrony of spoken language and visuals need now also to be considered systematically. This may then assist in reducing the “gap” observed between the current predictions that we can make on the basis of a thin slice of cohesion analysis and the variations found in the eye-tracking data by adding the kinds of effects and refinements to the model discussed in Section 6. Taken together, these points serve to define a set of clear research goals offering potentially beneficial results both for the practical task of characterizing explanation video design in a manner supportive of predictions concerning attention and effect and for the theoretical goal of improving the nature of multimodal discourse analyses.
In the future, therefore, through triangulating pedagogic, linguistic and multimodal theories for methodological purposes, we aim to establish more robust foundational frameworks capable of serving as a meta-language for annotations of empirically observable audiovisual linguistic phenomena relevant for theoretical learning principles as well. When applied to larger corpora, such a meta-language may then be standardized for broader quantitative research designs. Given the increasing prevalence of audiovisual learning materials, which present an intricate and challenging terrain for empirical research concerning their facilitation of positive learning outcomes, this undertaking is certain to become ever more important.
Data availability statement
The original contributions presented in the study are included in the article/Supplementary material, further inquiries can be directed to the corresponding author.
Ethics statement
Ethical review and approval was not required for the study on human participants in accordance with the local legislation and institutional requirements. All subjects gave informed consent to participate in the study. The study was conducted in accordance with the code of ethics of the German Educational Research Association (DGfE) as well as APA ethical standards. All data were collected and analyzed anonymously.
Author contributions
LT: Formal analysis, Methodology, Writing – original draft, Writing – review & editing, Conceptualization. FS-B: Data curation, Methodology, Visualization, Writing – original draft, Writing – review & editing, Conceptualization. JB: Data curation, Methodology, Visualization, Writing – original draft, Writing – review & editing, Conceptualization.
Funding
The author(s) declare that no financial support was received for the research, authorship, and/or publication of this article.
Conflict of interest
The authors declare that the research was conducted in the absence of any commercial or financial relationships that could be construed as a potential conflict of interest.
The authors declared that they included an editorial board member of Frontiers at the time of submission. This had no impact on the peer review process and the final decision.
Publisher's note
All claims expressed in this article are solely those of the authors and do not necessarily represent those of their affiliated organizations, or those of the publisher, the editors and the reviewers. Any product that may be evaluated in this article, or claim that may be made by its manufacturer, is not guaranteed or endorsed by the publisher.
Supplementary material
The Supplementary Material for this article can be found online at: https://www.frontiersin.org/articles/10.3389/fcomm.2024.1356495/full#supplementary-material
Footnotes
1. ^We should note here that this “chain” differs from traditional verbal cohesive chains in that it groups all the spoken contributions together, thus instantiating cohesion by mode. This can also be expanded to track particular referents more finely, but we omit this for the purposes of the current discussion.
2. ^The choice of eye-tracker was made on the basis of the equipment available to us at the time the experiments were performed; in general, screen-based devices would have been more appropriate for the present study due to the increased tracking accuracy possible. We do not consider this to have had any deleterious effects for the results reported here, however, since finer resolution was not necessary.
3. ^More technically, the Tobii processing software considers fixations to be sequences of eye tracking data points where the velocity of eye movement lies below a given threshold, by default 30°/s; i.e., where there is not a saccade.
References
Acartürk, C., Taboada, M., and Habel, C. (2014). Cohesion in multimodal documents: effects of cross-referencing. Inf. Des. J. 20, 98–110. doi: 10.1075/idj.20.2.02aca
Ainsworth, S. (2008). “The educational value of multiple representations when learning complex scientific concepts,” in Visualization: Theory and Practice in Science Education, eds. J. K. Gilbert, M. Reiner, M. Nakhleh (Cham: Springer), 191–208. doi: 10.1007/978-1-4020-5267-5_9
Ainsworth, S. (2021). “The multiple representations principle in multimedia learning,” in The Cambridge Handbook of Multimedia Learning (Cambridge, UK: Cambridge University Press), 158–170. doi: 10.1017/9781108894333.016
Allen, J. F. (1983). Maintaining knowledge about temporal intervals. Commun. ACM 26, 832–843. doi: 10.1145/182.358434
Alpizar, D., Adesope, O. O., and Wong, R. M. (2020). A meta-analysis of signaling principle in multimedia learning environments. Educ. Technol. Res. Dev. 68, 2095–2119. doi: 10.1007/s11423-020-09748-7
Ayres, P., and Sweller, J. (2021). “The split-attention principle in multimedia learning,” in The Cambridge handbook of multimedia learning, ed. R. E. Mayer (Cambridge, UK: Cambridge University Press), 199–211. doi: 10.1017/9781108894333.020
Baayen, R. H. (2008). Analyzing Linguistic Data. A practical Introduction to Statistics Using R. Cambridge: Cambridge University Press. doi: 10.1017/CBO9780511801686
Baayen, R. H., Davidson, D. J., and Bates, D. M. (2008). Mixed-effect modeling with cross random effects for subjects and items. J. Memory Lang. 59, 390–412. doi: 10.1016/j.jml.2007.12.005
Bateman, J. A. (2013). “Multimodal corpus-based approaches,” in The Encyclopedia of Applied Linguistics, ed. C. A. Chapelle (Hobeken, NJ, USA: Blackwell Publishing Ltd.), 3983–3991. doi: 10.1002/9781405198431.wbeal0812
Bateman, J. A. (2022). Growing theory for practice: empirical multimodality beyond the case study. Multimodal Commun. 11, 63–74. doi: 10.1515/mc-2021-0006
Bateman, J. A., and Hiippala, T. (2021). “From data to patterns: on the role of models in empirical multimodality research,” in Empirical Multimodality Research: Methods, Evaluations, Implications, eds. J. Pflaeging, J. Wildfeuer, and J. A. Bateman (Berlin: de Gruyter), 65–90. doi: 10.1515/9783110725001-003
Bateman, J. A., and Schmidt-Borcherding, F. (2018). The communicative effectiveness of education videos: towards an empirically-motivated multimodal account. Multimodal Technol. Inter. 2:59. doi: 10.3390/mti2030059
Bateman, J. A., Thiele, L., and Hande, A. (2021). Explanation videos unravelled: breaking the waves. J. Pragmatics 175, 112–128. doi: 10.1016/j.pragma.2020.12.009
Bateman, J. A., Wildfeuer, J., and Hiippala, T. (2017). Multimodality-Foundations, Research and Analysis. A Problem-Oriented Introduction. Berlin: de Gruyter Mouton. doi: 10.1515/9783110479898
Bétrancourt, M., and Benetos, K. (2018). Why and when does instructional video facilitate learning? A commentary to the special issue “developments and trends in learning with instructional video.” Comput. Hum. Behav. 89, 471–475. doi: 10.1016/j.chb.2018.08.035
Breslyn, W., and Green, A. (2022). Learning science with youtube videos and the impacts of Covid-19. Discipl. Interdisc. Sci. Educ. Res. 4:13. doi: 10.1186/s43031-022-00051-4
Bucher, H.-J., Krieg, M., and Niemann, P. (2010). “Die wissenschaftliche Präsentation als multimediale Kommunikationsform,” in Neue Medien-neue Formate. Ausdifferenzierung und Konvergenz in der Medienkommunikation, number 10 in Interaktiva. Schriftenreihe des Zentrums für Medien und Interaktivität (ZMI), Gießen, eds. H.-J. Bucher, T. Gloning, and K. Lehnen (Frankfurt and New York: Campus Verlag), 381–412.
Bucher, H.-J., and Niemann, P. (2012). Visualizing science: the reception of PowerPoint presentations. Visual Commun. 11, 283–306. doi: 10.1177/1470357212446409
Castro-Alonso, J. C., and Sweller, J. (2021). “The modality principle in multimedia learning,” in The Cambridge handbook of multimedia learning, ed. R. E. Mayer (Cambridge, UK: Cambridge University Press), 261–267. doi: 10.1017/9781108894333.026
Djonov, E., and van Leeuwen, T. (2022). “Semiotic software through the lens of systemic functional theory,” in Applicable Linguistics and Social Semiotics: Developing Theory from Practice, eds. D. Caldwell, J. S. Knox, and J. R. Martin (London/New York: Bloomsbury Academic), 421–435. doi: 10.5040/9781350109322.ch-23
ELAN (2023). ELAN-Linguistic Annotator. Technical report, Max Planck Institute for Psycholinguistics. The Language Archive, Nijmegen, The Netherlands. Computer software Available online at: https://archive.mpi.nl/tla/elan (accessed April 1, 2024).
Fiorella, L. (2021). “Multimedia learning with instructional video,” in The Cambridge handbook of multimedia learning, ed. R. E. Mayer (Cambridge, UK: Cambridge University Press), 487–497. doi: 10.1017/9781108894333.050
Fiorella, L., and Mayer, R. E. (2021). “Principles based on social cues in multimedia learning,” in The Cambridge handbook of multimedia learning, ed. R. E. Mayer (Cambridge, UK: Cambridge University Press), 277–285. doi: 10.1017/9781108894333.029
Habel, C., and Acartürk, C. (2006). “On reciprocal improvement in multimodal generation: co-reference by text and information graphics,” in Proceedings of the Workshop on Multimodal Output Generation MOG 2007 (Centre for Telematics and Information Technology (CTIT), University of Twente), 69–80.
Halliday, M. A. K., and Matthiessen, C. M. I. M. (2013). Halliday's Introduction to Functional Grammar. London and New York: Routledge. doi: 10.4324/9780203431269
Henderson, M. L., and Schroeder, N. L. (2021). A systematic review of instructor presence in instructional videos: effects on learning and affect. Comput. Educ. Open 2:100059. doi: 10.1016/j.caeo.2021.100059
Holsanova, J., Holmberg, N., and Holmqvist, K. (2008). Reading information graphics: the role of spatial contiguity and dual attentional guidance. Appl. Cogn. Psychol. 23, 1215–1226. doi: 10.1002/acp.1525
Jefferson, G. (2004). “Glossary of transcript symbols with an introduction,” in Conversation Analysis. Studies from the first generation (Benjamins, Amsterdam), 13–31. doi: 10.1075/pbns.125.02jef
Just, M. A., and Carpenter, P. A. (1980). A theory of reading: from eye fixations to comprehension. Psychol. Rev. 87, 329–354. doi: 10.1037/0033-295X.87.4.329
Kang, S., Tversky, B., and Black, J. B. (2015). Coordinating gesture, word, and diagram: explanations for experts and novices. Spatial Cogn. Comput. 15, 1–26. doi: 10.1080/13875868.2014.958837
Kintsch, W. (1988). The role of knowledge in discourse comprehension: a construction-integration model. Psychol. Rev. 95, 163–182. doi: 10.1037/0033-295X.95.2.163
Kintsch, W., and van Dijk, T. A. (1978). Towards a model of text comprehension. Psychol. Rev. 85, 363–394. doi: 10.1037/0033-295X.85.5.363
Knight, D., and Adolphs, S. (2020). “Multimodal corpora,” in A Practical Handbook of Corpus Linguistics, eds. M. Paquot, and S. T. Gries (Cham: Springer Nature Switzerland), 353–371. doi: 10.1007/978-3-030-46216-1_16
Larkin, J. H., and Simon, H. A. (1987). Why a diagram is (sometimes) worth ten thousand words. Cogn. Sci. 11, 65–99. doi: 10.1111/j.1551-6708.1987.tb00863.x
Levin, J. R., Anglin, G. J., and Carney, R. N. (1987). “On empirically validating function of pictures in prose,” in The psychology of illustration, eds. D. M. Willows, and H. A. Hougthon (New York, NY: Springer), 51–85. doi: 10.1007/978-1-4612-4674-9_2
Liu, Y., and O'Halloran, K. L. (2009). Intersemiotic Texture: analyzing cohesive devices between language and images. Soc. Semiot. 19, 367–388. doi: 10.1080/10350330903361059
Lu, J. C.-C. (2023). Using youtube as an effective educational tool to improve engineering mathematics teaching during the COVID-19 pandemic. Eng. Proc. 38:24. doi: 10.3390/engproc2023038024
Martin, J. R., and Unsworth, L. (2023). Reading Images for Knowledge Building: Analyzing Infographics in School Science. London and New York: Routledge. doi: 10.4324/9781003164586
Mayer, R. E. (2009). Multimedia Learning, chapter Temporal Contiguity Principle. Cambridge: Cambridge University Press, 153–170. doi: 10.1017/CBO9780511811678.011
Mayer, R. E. (2014). “Cognitive theory of multimedia learning,” in The Cambridge Handbook of Multimedia Learning, Cambridge Handbooks in Psychology, ed. R. E. Mayer (Cambridge, MA: Cambridge University Press), 45–71. doi: 10.1017/CBO9781139547369.005
Mayer, R. E. (2021a). “Cognitive theory of multimedia learning,” in The Cambridge handbook of multimedia learning, ed. R. E. Mayer (Cambridge, UK: Cambridge University Press), 57–72. doi: 10.1017/9781108894333.008
Mayer, R. E. (2021b). “The multimedia principle,” in The Cambridge handbook of multimedia learning, ed. R. E. Mayer (Cambridge, UK: Cambridge University Press), 145–157. doi: 10.1017/9781108894333.015
Mayer, R. E., Fiorella, L., and Stull, A. (2020). Five ways to increase the effectiveness of instructional video. Educ. Technol. Res. Dev. 68, 837–852. doi: 10.1007/s11423-020-09749-6
Ozcelik, E., Karakus, T., Kursun, E., and Cagiltay, K. (2009). An eyetracking study of how color coding affects multimedia learning. Comput. Educ. 53, 445–453. doi: 10.1016/j.compedu.2009.03.002
Paas, F., and Sweller, J. (2021). “Implications of cognitive load theory for multimedia learning,” in The Cambridge Handbook of Multimedia Learning, ed. R. E. Mayer (Cambridge, UK: Cambridge University Press), 73–81. doi: 10.1017/9781108894333.009
Richter, J., Scheiter, K., and Eitel, A. (2016). Signaling text-picture relations in multimedia learning: a comprehensive meta-analysis. Educ. Res. Rev. 17, 19–36. doi: 10.1016/j.edurev.2015.12.003
Rowley-Jolivet, E. (2004). Different visions, different visuals: a social semiotic analysis of field-specific visual composition in scientific conference presentations. Visual Commun. 3, 145–175. doi: 10.1177/147035704043038
Royce, T. D. (1998). Synergy on the page: exploring intersemiotic complementarity in page-based multimodal text. Japan Association for Systemic Functional Linguistics (JASFL) Occasional Papers, 25–49.
Schmidt-Borcherding, F., Bateman, J. A., and Thiele, L. (in preparation). Facing text graphics in instructional video: The role of instructor presence coherence signals.
Schneider, S., Beege, M., Nebel, S., and Rey, G. D. (2018). A meta-analysis of how signaling affects learning with media. Educ. Res. Rev. 23, 1–24. doi: 10.1016/j.edurev.2017.11.001
Schnettler, B., and Knoblauch, H. (2007). PowerPoint-Präsentationen. Neue Formen der gesellschaftlichen Kommunikations von Wissen. Konstanz: UVK.
Schnotz, W. (2014). “An integrated model of text and picture comprehension,” in The Cambridge Handbook of Multimedia Learning, ed. R. E. Mayer (Cambridge: Cambridge University Press), 72–103. doi: 10.1017/CBO9781139547369.006
Schnotz, W. (2021). “Integrated model of text and picture comprehension,” in The Cambridge Handbook of Multimedia Learning, ed. R. E. Mayer (Cambridge, UK: Cambridge University Press), 82–99. doi: 10.1017/9781108894333.010
Trabelsi, O., Souissi, M. A., Scharenberg, S., Mrayeh, M., and Gharbi, A. (2022). YouTube as a complementary learning tool in times of COVID-19: SELF-reports from sports science students. Trends Neurosci. Educ. 29:100186. doi: 10.1016/j.tine.2022.100186
Tseng, C. (2013). Cohesion in Film: Tracking Film Elements. Basingstoke: Palgrave Macmillan. doi: 10.1057/9781137290342
Tversky, B., Jamalian, A., Giardino, V., Kang, S., and Kessell, A. (2013). “Comparing gestures and diagrams,” in 10th International Gesture Workshop, Tilburg (Tilburg center for Cognition and Communication (TiCC)).
Tversky, B., Morrison, J. B., and Betrancourt, M. (2002). Animation: can it facilitate? Int. J. Hum. Comput. Stud. 57, 247–262. doi: 10.1006/ijhc.2002.1017
Tversky, B., Zacks, J. M., Lee, P., and Heiser, J. (2000). “Lines, blobs, crosses, and arrows: diagrammatic communication with schematic figures,” in Theory and Application of Diagrams, eds. M. Anderson, P. Cheng, and V. Haarslev (Berlin: Springer), 221–230. doi: 10.1007/3-540-44590-0_21
van der Sluis, I., and Krahmer, E. (2007). Generating multimodal references. Disc. Proc. 44, 145–174. doi: 10.1080/01638530701600755
van Gog, T. (2021). “The signaling (or cueing) principle in multimedia learning,” in The Cambridge Handbook of Multimedia Learning, ed. R. E. Mayer (Cambridge, UK: Cambridge University Press), 221–230. doi: 10.1017/9781108894333.022
Wang, J., and Antonenko, P. D. (2017). Instructor presence in instructional video: effects on visual attention, recall, and perceived learning. Comput. Hum. Behav. 71, 79–89. doi: 10.1016/j.chb.2017.01.049
Wiebe, E., Slykhuis, D., and Annetta, L. (2007). Evaluating the effectiveness of scientific visualization in two powerpoint delivery strategies on science learning for preservice science teachers. Int. J. Sci. Mathem. Educ. 5, 329–348. doi: 10.1007/s10763-006-9041-z
Wittenburg, P., Brugman, H., Russel, A., Klassmann, A., and Sloetjes, H. (2006). “ELAN: a professional framework for multimodality research,” in Proceedings of LREC 2006, Fifth International Conference on Language Resources and Evaluation 1556–1559.
Yaacob, Z., and Saad, N. H. M. (2020). Acceptance of youtube as a learning platform during the covid-19 pandemic: the moderating effect of subscription status. TEM J. 9, 1732–1739. doi: 10.18421/TEM94-54
Keywords: cohesion, multimodal cohesion, discourse analysis, eye-tracking, education videos, explanation videos, multimodality
Citation: Thiele L, Schmidt-Borcherding F and Bateman JA (2024) All eyes on the signal? - Mapping cohesive discourse structures with eye-tracking data of explanation videos. Front. Commun. 9:1356495. doi: 10.3389/fcomm.2024.1356495
Received: 15 December 2023; Accepted: 18 March 2024;
Published: 11 April 2024.
Edited by:
Janina Wildfeuer, University of Groningen, NetherlandsReviewed by:
Elisabeth Zima, University of Freiburg, GermanyJana Holsanova, Lund University, Sweden
Copyright © 2024 Thiele, Schmidt-Borcherding and Bateman. This is an open-access article distributed under the terms of the Creative Commons Attribution License (CC BY). The use, distribution or reproduction in other forums is permitted, provided the original author(s) and the copyright owner(s) are credited and that the original publication in this journal is cited, in accordance with accepted academic practice. No use, distribution or reproduction is permitted which does not comply with these terms.
*Correspondence: Leandra Thiele, bGVfdGhAdW5pLWJyZW1lbi5kZQ==