 Piotr Baniukiewicz†
 E. Josiah Lutton
 Till Bretschneider
- Department of Computer Science, Zeeman Institute, University of Warwick, Coventry, United Kingdom
Generative adversarial networks (GANs) have recently been successfully used to create realistic synthetic microscopy cell images in 2D and predict intermediate cell stages. In the current paper we highlight that GANs can not only be used for creating synthetic cell images optimized for different fluorescent molecular labels, but that by using GANs for augmentation of training data involving scaling or other transformations the inherent length scale of biological structures is retained. In addition, GANs make it possible to create synthetic cells with specific shape features, which can be used, for example, to validate different methods for feature extraction. Here, we apply GANs to create 2D distributions of fluorescent markers for F-actin in the cell cortex of Dictyostelium cells (ABD), a membrane receptor (cAR1), and a cortex-membrane linker protein (TalA). The recent more widespread use of 3D lightsheet microscopy, where obtaining sufficient training data is considerably more difficult than in 2D, creates significant demand for novel approaches to data augmentation. We show that it is possible to directly generate synthetic 3D cell images using GANs, but limitations are excessive training times, dependence on high-quality segmentations of 3D images, and that the number of z-slices cannot be freely adjusted without retraining the network. We demonstrate that in the case of molecular labels that are highly correlated with cell shape, like F-actin in our example, 2D GANs can be used efficiently to create pseudo-3D synthetic cell data from individually generated 2D slices. Because high quality segmented 2D cell data are more readily available, this is an attractive alternative to using less efficient 3D networks.
Introduction
The rapid development of imaging technologies in life sciences is causing a surge in high resolution 2D and 3D microscopic images of cells, mostly employing fluorescent molecular labels. What follows is a demand for easily accessible and significant collections of biological image data that can be used for either testing existing solutions for feature extraction and cell classification, or developing new ones. Two prominent examples of applications that require large datasets are (1) assessing the quality of 2D/3D segmentation algorithms and (2) training of artificial deep neural networks. The first case requires manual or guided segmentation to generate ground truth data, which is costly and laborious, and in 3D often prohibitive. Here, generative models can help enriching small validated datasets. The second case naturally also benefits from augmented collections of diverse training data. However, as we demonstrate here, traditional image transformations used in data augmentation can produce biologically improper images.
In the current paper we propose a simple and efficient method for synthesizing large collections of realistic cell images from corresponding binary masks by means of generative adversarial networks (GANs, Goodfellow et al., 2014). Generative models are not new in cell biological imaging or even more generally in optical microscopy, but recent developments in deep learning have raised the quality of these models to a new level. We utilize the concept of image-to-image translation by conditional GANs proposed by Isola et al. (2017). A similar application of GANs for generating natural cell images was proposed recently by Goldsborough et al. (2017) who built generative models of human cells from the BBBC021 dataset and explored its ability to synthesize realistic 2D distributions of cellular components visualized by fluorescence microscopy (DNA, F-Actin and β-Tubulin). Osokin et al. (2017) conducted a quantitative analysis of biological images synthesized by GANs which perform well in producing biologically realistic, previously unseen datasets. A slightly different application of 2D generative models was proposed by Johnson et al. (2017). They developed an adversarial autoencoder that resembles a non-parametric model of cells, used for predicting the outcome of unobserved experiments, and reducing the probabilistic dimensionality of complex experimental data. Other cell generative models prior to GANs employed various techniques, such as physical simulations of the process of image formation (Svoboda et al., 2009) and were used to generate 3D cell images. Other 3D cell generators using explicit shape and texture features learned from experimental data have been developed by Shariff et al. (2010) and, recently, model-based 3D cell generators employing Perlin textures have been devised (Svoboda and Ulman, 2017; Peterlík et al., 2018; Sorokin et al., 2018; Wiesner et al., 2019a).
GANs are capable of learning a mapping between input and output images from training data and then utilize this knowledge to synthesize new, previously unseen images that come from the distribution of training data. GANs employ two networks, one that is trained to discriminate between real and fake images, and a generative network that aims to produce images that fool the discriminatory network. Using the implementation by Isola et al. (2017) the generator is based on a “U-Net” architecture (Ronneberger et al., 2015), and the discriminator uses a convolutional “PatchGAN” classifier (Li and Wand, 2016). Our results are obtained using L1+cGAN losses as described in Isola et al. (2017). We utilize this concept for creating a mapping between segmented cells and their equivalent microscopic images, with the aim to recreate realistic cell images from either 2D or 3D binary masks based on arbitrary cell shapes. Both the generator and discriminator take the binary masks as additional conditions to make a decision, which is why this type of GAN is called a conditional GAN.
We investigated three separate conditional GAN networks (net_ABD, net_cAR1 and net_TalA) based on the architecture proposed in Isola et al. (2017) that were trained with cell images of Dictyostelium cells labeled by three different fluorescent markers: (a) a marker for the F-actin cytoskeleton (ABD-GFP) which is important in driving cellular shape changes, (b) a membrane receptor for the chemoattractant cAMP (cAR1-GFP) which in Dictyostelium controls directed cell motility and development, and (c) a protein that links the cell membrane and the F-actin cell cortex (TalA-GFP or TalA-mNeon), also important for cell motility and cellular shape changes. The training images of Dictyostelium cells are very similar to that of other amoeboid cells, for example cells of our immune system. For the three networks input cell images consisted of individual frames of a timeseries recording. Because each frame was processed by the network independently, information about correlation in time was not available to the network.
We show that each GAN network is able to correctly relate the distribution of each individual florescent protein to the specific shape of cells and to successfully synthesize realistic images for arbitrary input shapes. Importantly, when augmenting training data, GANs prevent errors normally introduced by standard geometric transformations, such as blurring introduced by scaling. Because scaling or shearing will be applied to binary masks before texturizing, the intrinsic length scale of specific cell features like membrane thickness is not changed.
We extended the 2D architecture to 3D (net_3D), generating synthetic 3D light sheet microscopy datasets of the F-actin marker Lifeact-GFP from volumetric binary masks. net_3D produces realistic label distributions across neighboring z-slices of 3D microscopic images, but in practice suffers from a number of technical limitations. Above all these are computational complexity and the difficulty to obtain sufficiently large sets of high-quality training data. To overcome these limitations, we are proposing an approach where 2D networks are used for synthesizing pseudo-3D datasets by reconstructing each z-slice separately. Comparison with real data shows that important features are still preserved very well, reducing computational cost and training effort significantly.
Materials and Methods
The software used (pix2pix implementation from https://github.com/affinelayer/pix2pix-tensorflow) and the repository (https://pilip.lnx.warwick.ac.uk/Frontiers_2019) with training data and our modified 3D multichannel version of pix2pix are described in more detail in Supplementary Information.
Training datasets for each 2D network (net_ABD, net_cAR1 and net_TalA) consisted of experimental timeseries of cell images acquired at different developmental stages and under different experimental conditions. The only common denominator was the molecular label (Table 1). The motivation behind pooling data from different conditions was to achieve a good spread in input data, needed, for example, when attempting to develop robust methods for cell segmentation. Other applications might demand selecting more specific subsets of experimental data.
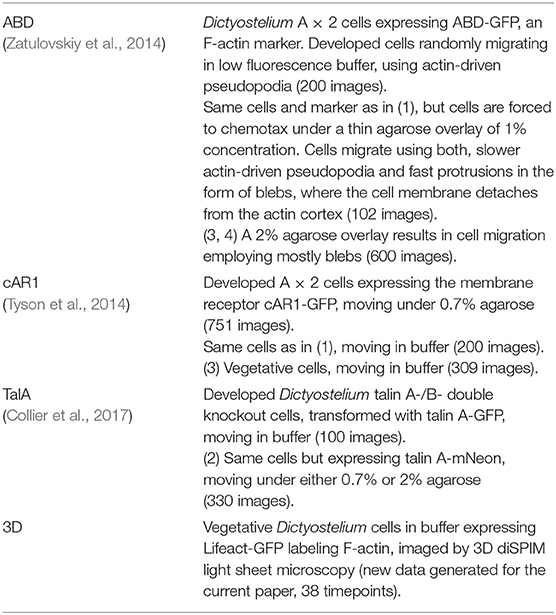
Table 1. Summary of datasets used for training net_ABD, net_cAR1, net_TalA, and net_3D.
The cell lines used were as follows. The axenic strain A × 2 of Dictyostelium discoideum (DBS0235521 at http://dictybase.org) was transformed with markers for F-actin (GFP–ABD120) or the membrane bound cyclic AMP receptor (cAR1-GFP). TalinA/B- double knockout cells were a kind gift of M. Tsuijioka to the Kay laboratory (strain HM1554). This strain was rescued by expressing TalinA-GFP or TalinA-mNeon.
All 2D images were recorded on standard confocal microscope setups at 2 frames per second (fps) with a 63 × oil immersion objective (NA1.4, 488 nm laserline, typically using zoom factors of 1 or 2, resulting in a pixel size of 0.264 and 0.132 μm in the original images; typical exposure time 200 ms). Where required, images were rescaled from 512 × 512 to 256 × 256 pixels using bilinear scaling or cropped to a size of 256 × 256. Subsequently, cells were segmented using QuimP2018 (Baniukiewicz et al., 2018) with either of two, or a combination of an active contour algorithm and a customized random walk algorithm. Quality was validated visually for each dataset, and manual corrections made where necessary.
Finally, the 2D training datasets yielded 902, 1,260, and 430 input-output pairs of binary masks and corresponding fluorescent images for net_ABD, net_cAR1, and net_TalA, respectively (Figure 1), but the effective number of training samples was enlarged three-fold by data augmentation (through mirroring, rotation, and translation). We excluded image scaling from transforms used for data augmentation, due to reasons explained later in the Results section.
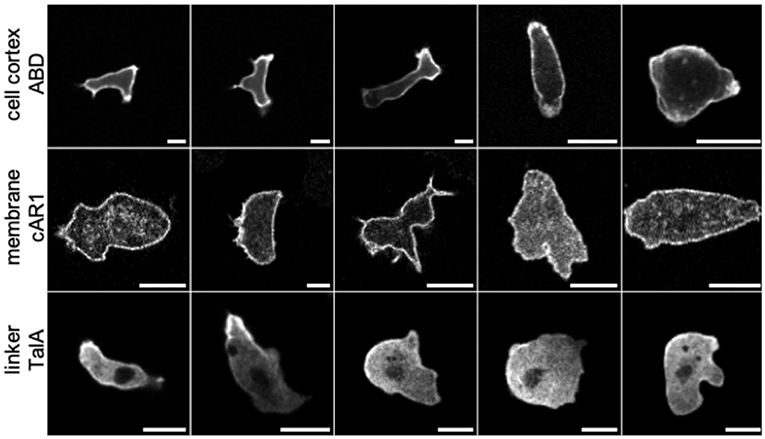
Figure 1. Confocal laser scanning microscopy images of Dictyostelium cells labeled with different fluorescent markers exhibiting characteristic patterns (scale bars: 10 μm). Row 1: ABD, a label for F-actin filaments in the cell cortex. Row 2: cAR1, receptors in the cell membrane binding the chemoattractant cAMP. Row 3: TalA, a cortex-membrane linker protein. Representative images were taken from a library of cell images acquired under a range of experimental conditions, in order to capture a large variety of cell shapes and textures. The image library was used for training three different GANs: net_ABD, net_cAR1, and net_TalA. In each row, cells are ordered from left to right according to their developmental stage and experimental conditions (movement in buffer vs. under agar). Notably, with increasing agarose concentration (toward the right) cells exhibit less distinct protrusions and appear larger and rounder because they are flattened. Experimental details for individual images from left to right (v, vegetative cell; d, developed cells ~6 h after starvation; r, random movement; c, chemotaxis toward cAMP; b, in buffer; 0.7%/1%/2%, agarose concentration of an agar overlay; N, mNeon instead of GFP as fluorescent label): ABD, drb-drb-dc1%-dc2%-dc2%; cAR1, vrb-vrb-drb-dc0.7%-dc0.7%; TalA, drb-dc0.7%N-dc2%N-dc2%N-dc2%N.
The training dataset for net_3D was built from 38 3D image stacks (Table 1) recorded on a 40× diSPIM light sheet microscope (3i) using a single sheet (width 4 μm) with a spacing of 0.2 μm, with each imaging plane acquired at 10 ms (NA0.8, water dipping objective, 150 slices, pixel size 0.165 μm, slice thickness 0.2 μm). The amount of training data was then increased to 250 volumes by augmentation as used in the 2D case. Finally, the whole dataset was segmented with the aid of the 3D Trainable Weka Segmentation plugin in ImageJ (Arganda-Carreras et al., 2017). A small subset (three timepoints) selected from recorded (but not augmented) datasets was also segmented manually by an expert in order to validate the performance of the Weka plugin. Although the level of recall is high (0.98, 0.98, and 1.0), the level of precision is comparatively low (0.72, 0.67, and 0.73), yielding low Jaccard scores (0.71, 0.66, and 0.73). The low level of precision results in fine cellular processes (filopodia) appearing somewhat more stubby. For a proof of concept, however, we regarded this as acceptable, noting that manual segmentation of the entire training data set was beyond the scope of this paper. High-quality manually curated 3D image stacks (n = 11) were however used as input masks to test the output of net_3D and pseudo-3D synthetic data generated by net_ABD.
We utilized the network architecture described in Isola et al. (2017) assuming one channel (binary mask) as input and output layers (fluorescent channel) for 2D networks. The 3D extension (net_3D) incorporates 66 channels for input and output, matching the number of z-slices of experimental data needed to capture a cell. Each 2D model took ~15 h to train on a single GPU of an NVIDIA Tesla K80 card, whereas the 3D network needed ~32 h to converge.
One practical pitfall with net_3D is that artifacts in the form of void regions occur when not using the separable convolution option. This option is now the default in pix2pix, however. Some of the generated images show a faint checkerboard pattern, which is a known problem of GANs (Odena et al., 2016).
Results
Synthetic Data Based on Arbitrary Input Masks Capture the Characteristic Distributions of Different Molecular Labels
Figure 2 shows five artificial shapes decorated by the three GAN models trained with the ABD, cAR1 and TalA datasets, in an attempt to reproduce the characteristic features of the individual labels seen in Figure 1. The ABD label is generally enriched in the actin cortex, but most strongly associated with protrusions, i.e., areas of high curvature. cAR1 decorates the cell membrane, with a somewhat more granular appearance. TalA forms smooth shallow gradients, with a higher concentration at the cell rear, and the cell nucleus excluded. Overall, the reconstructed images in Figure 2 capture the original features very well for ABD and TalA. Although the membrane labeling is roughly captured for the cAR1 label, the highly artificial star shape in column 4 shows filamentous structures that most likely match filopodia in Figure 1 (see cAR1, column 4), but erroneously point inwards and not outwards. The wrong localization of these filamentous structures is likely due to problems with the original segmentation of filopodia, struggling with the noisier cAR1 data. Output images were not post-processed apart from contrast adjustment for the sake of better readability.
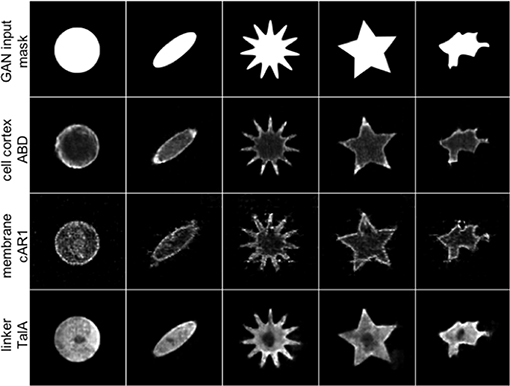
Figure 2. For arbitrary binary input masks (row 1) three different GANs are able to reproduce the characteristic protein distributions of real molecular labels from Figure 1. For a circular input mask (column 1) the synthetic ABD label (row 2, generated by net_ABD) shows a typical cortical localization, and association with the tips of extended structures, reminiscent of cellular protrusions (columns 2–5). cAR1 (row 3, net_cAR1) is distinctly found at the edge, mimicking the cell membrane in real cells, and like in the training data exhibits significant levels of noise. In column 4, artifacts in form of filamentous structures can be seen inside the star object (see main text for discussion). TalA (row 4, net_TalA) reproduces the shallow gradients seen in real cells, with a dark region spared out, which in real cells is the cell nucleus.
Real Cell Masks as Input to GANs Provide Visually Realistic, Synthetic Images of Cells Expressing Different Fluorescent Markers
In the next experiment we fed each of the network with real cell masks. The testing set for each network consisted of masks belonging to the training sets of the remaining two networks so that there was no correlation between training and testing datasets, as they were taken in different experiments and for different labels. Representative results are shown in Figure 3. They demonstrate the ability of GANs to produce realistic cell images with complex shapes, as confirmed after visual inspection by an expert biologist who is familiar with the specific molecular labels. A quantitative evaluation of the image quality follows below. On these genuine cell shapes the cAR1 label shows no obvious artifacts.
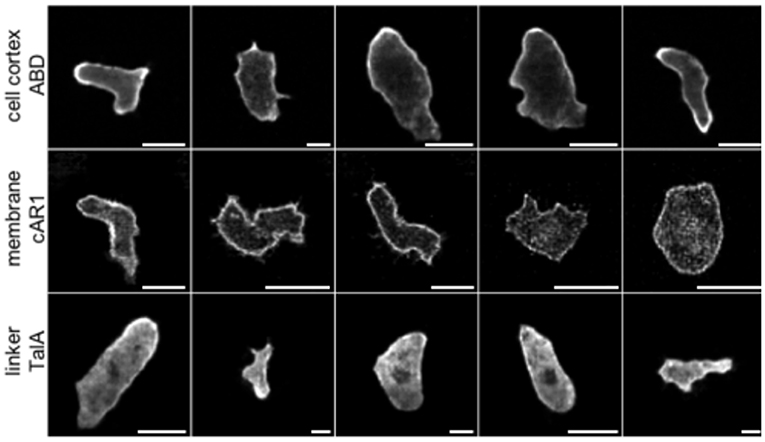
Figure 3. Examples of synthetic label distributions using masks of real cell shapes as input to net_ABD (1st row), net_cAR1 (2nd row), and net_TalA (3rd row). F1-scores of 0.98, 0.97, and 1.0 obtained by an expert classifier (see Table 3) underline that these synthetic images are highly realistic in their appearance.
Upon Scaling, GANs Preserve the Inherent Length-Scale of Biological Structures
A so far little recognized feature of GANs is their ability to create more realistic augmented training data of biological cells. Typical techniques used in machine learning are affine and perspective transformations, copying, padding, contrast changes, etc. For many practical applications, however, especially with regards to cell biology, problems arise because affine transformations like image shearing or scaling will not only change an object's overall size and shape, but also that of all embedded features. In fluorescence microscopy this could result, for example, in altering the thickness of the cell membrane, which biologically however is the same for cells of any size. Augmentation by GANs can overcome these issues, because image transformations are applied to the binary mask only. Masks are then textured by the network, preserving most of the learnt features and their characteristic length scales. This advantage is demonstrated in Figure 4. Cell images up-scaled using bilinear interpolation are blurred and contain less detail. Moreover, the thickness of the membrane grows proportionally with the scaling factor. Cells scaled with GANs preserve the same membrane thickness and level of detail, including noise, which can be demonstrated using the S3 metrics proposed by Vu et al. (2012). This metric measures the local perceived sharpness in an image utilizing both spectral and spatial properties of the image. To obtain the S3 metrics as a function of scale we resized the whole dataset of cell images up to a factor of 3× by means of two popular interpolation algorithms; bilinear, and bicubic. Next, we rescaled binary masks from the same dataset with the nearest neighbor method and processed them by our GAN networks to obtain synthetic images, which were then evaluated using the S3 metrics. Averaged results for the three methods are plotted in Supplementary Figure S1. It can be seen that images scaled by GANs preserve their sharpness when compared to bilinear and bicubic methods, which cause strong degeneration of image quality.
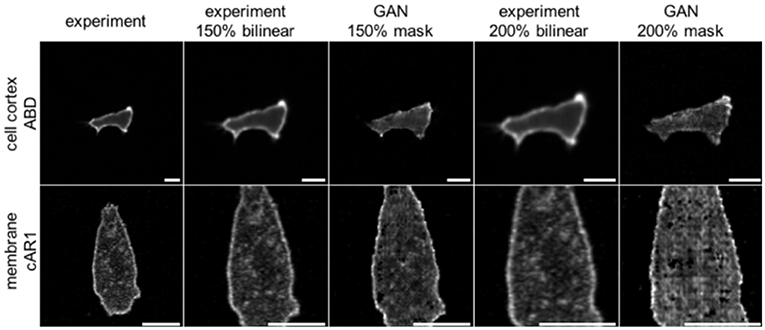
Figure 4. Comparison of two augmentation methods for scaling images of Dictyostelium cells expressing ABD (row 1) or cAR1 (row2) fluorescent proteins (scalebars: 10 μm). Column 1: Original images; Column 2: 150% upscaling with bilinear interpolation; Column 3: 150% upscaling of the binary input mask used as input to net_ABD GAN (row 1) or net_cAR (row 2). For upscaling binary masks the nearest neighbor method has been used; Column 4: 200% of original; Column 5: providing 200% scaled input masks to GANs. The GAN based method does not modify membrane thickness and preserves more details.
Generating 3D Cell Images From Binary Volumes
In the next experiment, we investigated the possibility of generating full 3D cell images from binary volumes, using images of a marker for F-actin (LifeAct-GFP) obtained by a diSPIM lightsheet microscope as training data. Artificial test input data for the network were generated by applying 10 random Gaussian deformations to nodes of a triangulated sphere of a size comparable to that of our 3D cell data. Resulting meshes were voxelized and saved as binary stacks of 66 slices each, which matches the depth of experimental data used for training net_3D. An exemplary volume and its reconstruction are depicted in Figure 5 with individual cross-sections shown in Supplementary Figure S2. The generated volumes reproduce the main features of an F-actin cell cortex, where F-actin is enriched in ridges and invaginations of the cell surface, similar to ABD-GFP in the 2D case (see Figure 1). However, the 3D network is much more difficult to train due to the high number (66) of channels at the input layer, which is identical to the number of slices needed to capture a cell in the 3D image stacks. The total training time for this case was ~32 h on an NVIDIA K80 GPU, as compared to ~15 h for the two-dimensional net_ABD (Figure 6). The net_3D architecture imposes restrictions on the physical dimensions of regenerated volumes, particularly with regards to the number of z-slices which cannot be freely adjusted without retraining the network. Because the number of z-slices will vary from experiment to experiment in order to keep the imaging volume as small as possible and training times down, this is a severe limitation.
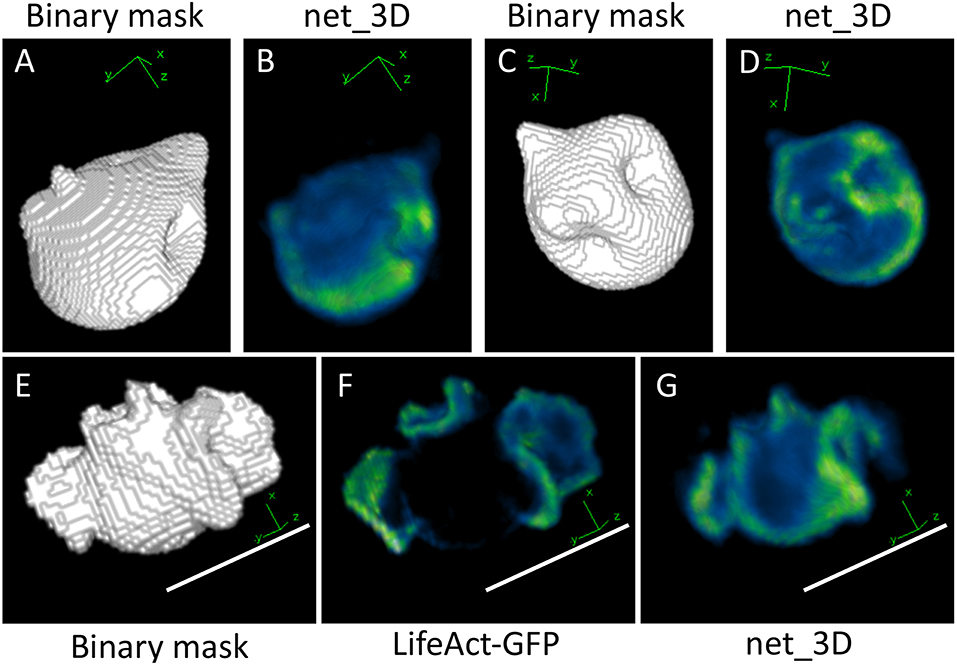
Figure 5. Output from applying net_3D to synthetic shapes (A–D) and a manually segmented cell shape (E–G). Increased F-Actin intensity can be observed at some invaginations in the synthetic shape-based output, reminiscent of macropinocytic cups in the training data of Dictyostelium cells, which are membrane deformations involved in the uptake of fluid from the extracellular medium (B,D). The output of net_3D applied to the real cell shape (G) shows some similarities with the original image (F), in particular ridges on the cell surface are highlighted in green. The synthetic cell in (G) and shapes in (B,D) are reduced in size, which is likely due to low precision in the segmentation of training data (see Materials and Methods). Scale bars represent 10 μm. Blue represents low intensities, green high intensities.
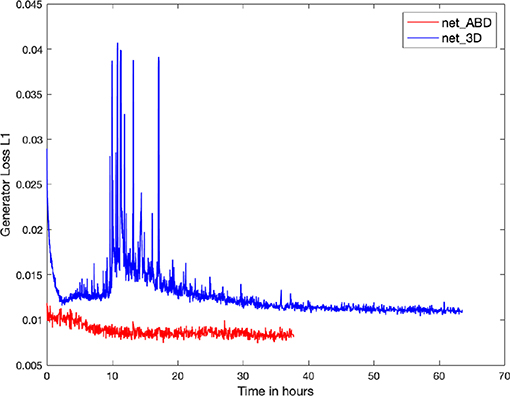
Figure 6. Plot of the Generator Loss L1 for the training of net_ABD (red) and net_3D (blue). A decrease in the generator Loss L1, defined as the mean of the absolute differences between targets and outputs, is a minimum requirement for reproducing realistic cell images. Training times to achieve good quality outputs are ~15 h for the two-dimensional net_ABD and 32 h for net_3D which is trained on 3D volume data. Note the prominent transient spikes during training of net_3D, which indicate that training using the 3D input data (66 channels input) is significantly more challenging when compared to 2D (1 channel input).
The biggest limitation in creating synthetic 3D cell data using genuine 3D input data is, however, the difficulty of obtaining manually validated training data. The approach taken above only serves as a proof of concept. In order to be able to have sufficient training data (N = 38) we used the trainable Weka segmentation for producing 3D masks, followed by visual inspection to check for errors. Although the quality of 3D Weka segmentation at first sight looks reasonably good it does not constitute validated ground truth and precision was found to be low (see Materials and Methods). In the next section, we present an approach to generate 3D synthetic data using a much larger number of training data based on high quality 2D segmentations. The latter are much easier to acquire and validate than 3D data. It also has the advantage of reduced training times and does not require retraining for stacks of different dimensions.
Generating 3D Cell Images Using 2D Networks
To overcome the limitation of lacking sufficient 3D training data, we applied the 2D networks to 3D binary volumes, processing each slice separately and independently. Reconstructed volumes still demonstrated convincing label-specific texturing and consistency in intensity distributions across slices. Exemplary synthetic ABD textures for three different cell volumes are depicted in Figure 7, showing good levels of correspondence with features of another F-actin marker (LifeAct-GFP) in the corresponding volumes of real cells. Full stacks are included in Supplementary Figures S3–S6. Generation of high-quality 3D datasets from networks trained with 2D timeseries cell images has significant advantages: 2D timeseries are usually fairly easy to segment by automated tools as cells are well-separated from background and much easier to validate by visual inspection. The easy access to large amounts of training data simplifies the training process and makes networks more robust (see Figure 6). Overall, our pseudo-3D approach significantly reduces the effort to generate artificial 3D datasets of high quality.
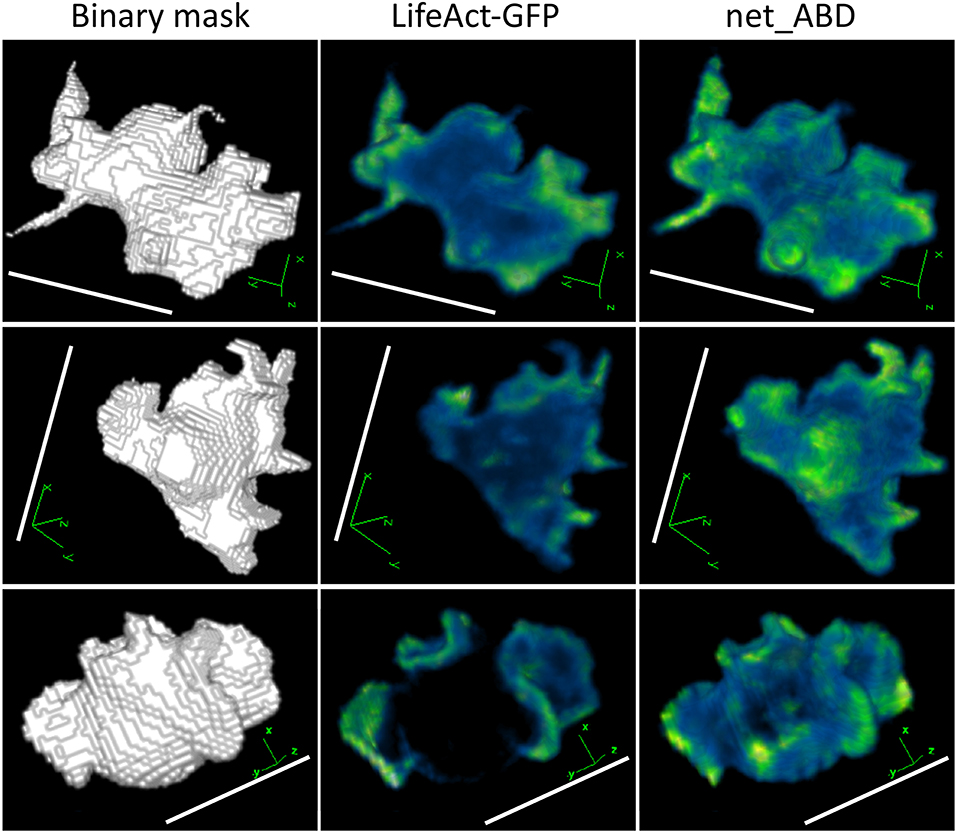
Figure 7. 3D rendering of binary masks (left column), real LifeAct-GFP images (middle column), and images generated by applying net_ABD to blurred masks (right column). Increased fluorescence in protruding structures can be seen in both real and network-generated images. This similarity reflects the fact that both LifeAct-GFP and ABD are markers for F-actin, and therefore produce a similar fluorescence pattern. Scale bars represent 10 μm, LifeAct-GFP, and net_ABD images are pseudocolored with blue representing low intensities and green representing high intensities.
The training data used in this approach are identical to the original data shown in Figure 1 and were obtained by confocal laser scanning microscopy at 2 fps providing strong local contrast using a higher numerical aperture objective. In addition, most of the cells have been flattened using an agar overlay, which specifically increases the contrast at the cell edge. Because Dictyostelium cells are highly dynamic and too light-sensitive for spinning disk confocal microscopy, 3D experimental data were acquired using fast, i.e., ~1 cell volume per second, 3D sectioning on a diSPIM light sheet microscope. Because of the faster imaging at lower light levels the steepness of the intensity profile across the cell edge is much reduced (Figures 8A,D,E). Using net_ABD in the pseudo-3D approach reproduces the strong local contrast at the cell edge of the original 2D images (Figure 8B). To accommodate for the reduced contrast of the 3D experimental data, a 3D blur (σx, y, z = 2) was applied to the mask, which was fed into net_ABD so that the width of the actin cortex (Figure 8C) matches that of the experimental data in Figure 8A. Similarly to what we noted before, when highlighting the benefits of GANs in retaining structures when scaling, post-processing the reconstruction to achieve a more realistic (blurred) intensity profile across the cell edge would inevitably also change the resolution of internal cellular structures, which is not wanted. Blurring the mask before passing it through GANs gives perceptually much improved results.
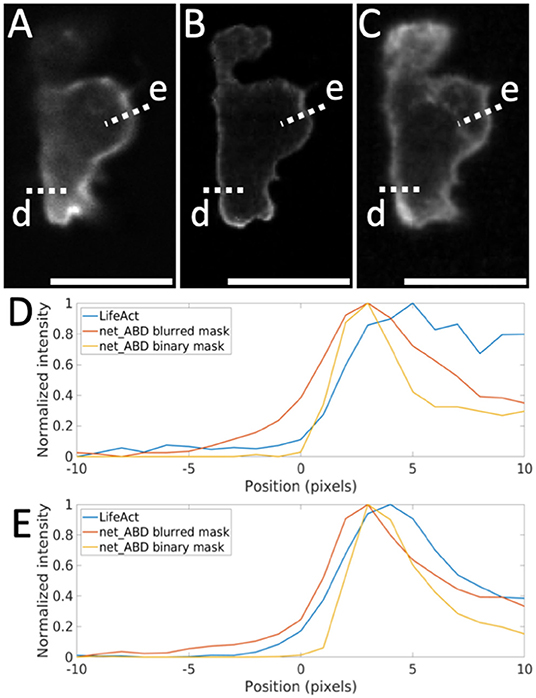
Figure 8. Comparison of LifeAct fluorescence patterns with the output of net_ABD applied to the binary and blurred 3D mask. (A) slice through the original LifeAct volume, (B) slice through synthetic image generated by net_ABD applied to the binary mask, (C) slice through image generated by net_ABD applied to the blurred mask, (D,E) normalized intensity profiles of each along line scans across the cell boundary (lines d,e). The use of a blurred mask yields an output that more strongly resembles the real image than when using a binary mask, owing to differences in the imaging modalities of high contrast training (confocal) and lower contrast target data (lightsheet). The intensity profiles (D,E) show that the gradient across the cell boundary from the real image (blue) is better matched when using a blurred mask (red) than when using a binary mask (yellow). Scale bars represent 10 μm.
Model Evaluation
Quantitative evaluation of the quality of GAN models is not a trivial task. Among those available, we chose a classification-based approach to evaluate the performance of net_ABD, net_cAR1, and net_TalA, similar to the assessment that would be performed by an expert. To this end, we have trained an image classifier on the three experimental classes, ABD, cAR1, and TalA. Subsequently we tested whether the GAN produces images with sufficiently distinct features so that they can be classified according to the three experimental classes with high confidence.
We prepared the image classifier based on the standard convolutional neural network (CNN) architecture shown in Table 2. Due to relatively small (as for CNN standards) number of samples, we used a relatively simple architecture consisting of four convolutional layers and two fully connected layers at the output. Input cell images were classified into three classes ABD, cAR1, and TalA, corresponding to the three fluorescent markers used in our experiments.
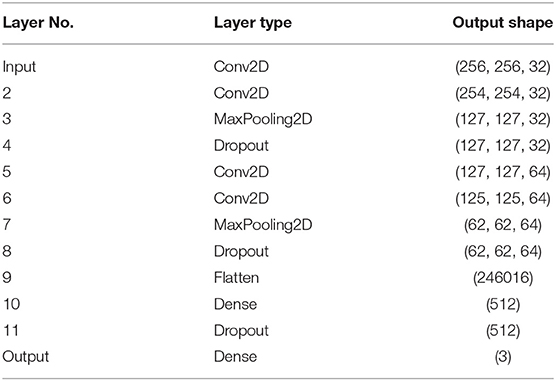
Table 2. The architecture of the classifier used for assessing the quality of GAN reconstructions.
Subsequently, the classifier was trained with 2,592 real 2D microscopic cell images labeled by those markers. These datasets were augmented by shear, rotation and translation operators. We did not use scaling due to reasons mentioned before in the Results section. The training set was then randomly divided into training (85%) and validation (15%) subsets. We used a categorical cross-entropy loss function and Adam optimiser. The training process finished after 150 epochs, when the validation error dropped below 5e-6 and the training error was close to 0. The resulting classifier perfectly identified all images in the validation dataset (374 images).
Finally, we used our classifier to predict the fluorescent marker type for synthetic cell images produced by the three networks net_ABD, net_cAR1, and net_TalA (see Figure 3) from binary masks that were not seen by the network during training (as described in the previous section). The classification results are summarized in Table 3 and the accompanying confusion matrix is depicted in Table 4. According to both tables our GAN generated cell images where the majority of samples within each class were predicted correctly. The highest misclassification rate (~5%) is observed between cAR1 and ABD markers, while the other errors are negligible. It is essential that the binary masks used as input of GANs for synthesizing artificial images did not originate from cells used for training the classifier (within each class). Therefore, each network net_ABD, net_cAR1, and net_TalA was able to extract (during training stage) and then reproduce (during image generation stage) features characteristic for each label and properly correlate them with cell shape. High confidence of synthetic images was also confirmed during visual inspection by biologists familiar with the specific molecular labels. The higher rate of confusion between ABD and cAR1 can be explained because both markers label the cell edge, with ABD often only having a distinctively wider distribution in highly concave of the cells where its binding partner, F-actin, is enriched. For individual time points, where no local enrichment of F-actin is discernible, ABD and cAR1 will show a very similar distribution and are also easily confused by human experts.
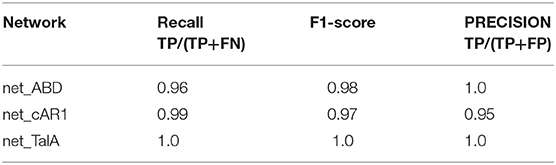
Table 3. Classification results of GAN-generated synthetic cell images [TP, true positive; FP, false positive; FN, false negative; F1-score = 2*(precision*recall)/(precision + recall)].
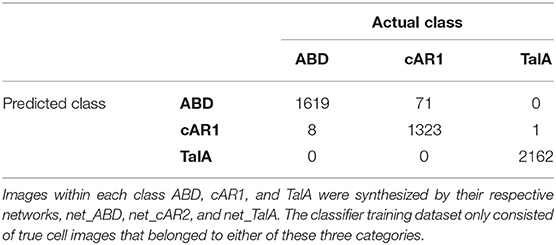
Table 4. Confusion matrix of the synthetic cell image classification by the expert classifier.
In order to evaluate the capability of reproducing realistic 3D actin fluorescence patterns using pseudo-3D method, we have computed Pearson's correlation coefficients (PCC) for real vs. synthetic data for net_3D (PCC = −0.0871, full 3D, Figures 5E–G, one image stack) and net_ABD (pseudo 3D, see Figure 7, 11 image stacks in total, blurred mask average PCC = 0.2762, raw mask average PCC = 0.2774). The negative correlation obtained for the full 3D network occurs because masks used for training suffer from the comparatively poor accuracy of the WEKA segmentation. In effect the generated cells will be smaller than the input masks. High intensities in the cortex of real cells therefore are matched with very low intensities just outside the volume of synthetic cells. The weak but positive correlation for net_ABD reflects that actin localizes to highly curved structures, but still shows a high degree of variability, and is therefore not precisely matched between synthetic and real fluorescence patterns.
In order to compare the textures generated by net_ABD applied to 3D masks with those of real data we used 3D Haralick's textural descriptors as utilized previously by Sorokin et al. (2018). This method involves comparing the intensity of each pixel to that of its (26) neighbors and generating textural measures by averaging comparison measures over the whole image. We restricted this analysis to the segmented mask, and computed values for contrast, correlation, homogeneity, maximum correlation coefficient, and entropy, as used previously (Sorokin et al., 2018). Box plots for these values calculated for real images and images generated by applying net_ABD to blurred and raw masks are shown in Supplementary Figure S7. These plots show that, with the exception of entropy, all images from the blurred mask method have values within the range of real data. The median values from the blurred mask method are higher than those for real data in contrast and entropy, but lower in the other features. This is likely due to low amplitude intensity fluctuations present in the synthetic images caused by the previously mentioned checkerboard pattern. Correlation measures for the raw mask method are outside the range of values in real data, which is possibly due to the sharp boundaries of the output images and supports our choice of using blurred input masks. The overall spread of values is lower in synthetic images than in real images, with the exception of maximum correlation coefficient. This suggests that net_ABD is producing consistent textures for all images, and may require the addition of some noise to replicate the full range of textures present in the real data, similar to previously devised GAN-based methods (Osokin et al., 2017). However, preliminary testing of this method showed only minor improvements in the variation of textures. Previous work by Sorokin et al. (2018) employed Perlin noise to generate realistic textures, which produced a range of textural descriptor values that closely resembled that of real cell images. This suggests that applying Perlin noise instead of Gaussian noise, as used previously (Osokin et al., 2017) could improve the range of textures.
Discussion
Creating label-specific microscopy training data is in high demand, particularly as manual segmentation of 3D timeseries data is by far too costly. In this paper, we investigated two architectures of generative adversarial networks applied for synthesizing 2D/3D images of single cells from their segmented counterparts. Each network was trained with fluorescence microscopy images labeled by different molecular markers. We showed these networks can successfully generate realistic 3D image stacks of cells and preserve features characteristic for each molecular label. Because the field is moving so fast, it needs to be pointed out that unlike in 3D GANs, using, for example, convolutional deep belief networks (Wu et al., 2015), we are dealing with fully texturized 3D image stacks and not only 3D binary shapes. Also, although the use of GANs in biomedical imaging is rapidly advancing, for example, for synthesizing artificial brain magnetic resonance images (Han et al., 2018; Kazuhiro et al., 2018) or thyroid tissue imaged by optical coherence tomography (Zhang et al., 2018), 3D applications like GANs for segmentation of liver CT scans (Yang et al., 2017) are still rare.
Creating synthetic 3D test data, above all, demands accurately segmented and validated ground truth data for training. For a proof of concept, we resorted to cells that were segmented in 3D using a supervised method (Weka) resulting in good recall but low precision. One reason for the low precision is that cells were segmented using the F-actin label which is heterogeneously distributed throughout the cell. To improve on the quality of training data it is possible, in principle, to combine labels of interest (here F-actin, cAR1, or TalA) with an additional homogeneous volume marker, or membrane markers that allows more accurate and easier verifiable segmentation. Thus, it is also possible to create a library of 3D cell shapes that can serve as test data. Traditional methods like spherical harmonic transform, and deep autoencoders can then be used to expand the real cell shape space through generative modeling of synthetic shapes, and even to model the evolution of cell shapes over time (Du et al., 2013; Ruan and Murphy, 2019).
We note that although net_3D, the convolutional network for generating “genuine” synthetic 3D cell data, has been trained with 3D volume data, individual z-slices are represented as separate input channels. As a result, convolutions are only performed in the x and y direction, and not across z. Consequently, cellular structures oriented along the z-direction can be expected to be of lower quality than those lying in the (x,y)-plane. Because of the already significant cost of training net_3D, we did not test more advanced architectures that support convolutions and pooling in all three directions (Çiçek et al., 2016), thus increasing the number of parameters and demanding more memory. Adapting the current pix2pix code would require time and is beyond the scope of the current paper. Wiesner et al. (2019b) recently used a full 3D convolutional GAN to translate cell volumes to cell masks, but with smaller inputs (64 × 64 × 64) and no texturing of the output. Although efficient methods for 3D segmentation using 3D convolutional networks have been devised recently (Kamnitsas et al., 2017) these employ a patch-based approach (for example patches of 17 × 17 × 17) which is much less memory demanding. Because we need to create patterns over the length of a cell, a patch-based approach is not feasible.
Similarly, using a technically less elegant but practically efficient method that still produces good quality output, our work shows that three-dimensional cell volumes can be also successfully synthesized by networks trained with images obtained from two dimensional time-lapse movies. In effect, this significantly reduces the network complexity, training time and the effort needed for preparing fully three-dimensional training dataset. We used 3D blurring of input masks in a very ad hoc manner to match the confocal training data, with a high local contrast at the cell edge due to cells flattened under an agar overlay, to the lightsheet output data. Note that this cannot be easily generalized to accommodate other modalities.
Our pseudo-3D method for generating cell textures from blurred binary masks does not appear to perform as well as previous work by Sorokin et al. (2018) when using Haralick's texture descriptors as a means of comparison with real images. It should be noted that the texture comparisons made here do not directly correspond to those made by Sorokin et al. (2018), since they only consider regions interior to the cells, whereas we have computed texture descriptors for the whole cells, including the cell cortex, which has a much higher variability in fluorescence distributions. One advantage of our method over model-based approaches (Sorokin et al., 2018) is that it is more general and faster to construct, given that no underlying model of molecular transport and reactions is required. Furthermore, potential improvements could be made to the range of textures achieved by our method by applying noise to the blurred input masks.
Among many possible applications of such networks is image augmentation, which we think has received too little attention so far. Here, GANs have clear advantages over standard geometric methods, because specific length scales of biological structures become invariant to transformations. Using data augmentation to generate collections of artificial cell images with known shape will be a valuable tool, for example, to evaluate the quality of different segmentation methods.
Data Availability Statement
Training data and our modified 3D multichannel version of pix2pix can be found at: https://pilip.lnx.warwick.ac.uk/Frontiers_2019.
Author Contributions
PB and TB conceived and designed the research project. PB performed all computational experiments. EL provided high-quality segmentations of 3D data and performed analyses of the quality of 3D results. SC performed diSPIM experiments with Dictyostelium cells. PB, TB, and EL wrote the paper.
Funding
We thank BBSRC for funding this work (grants BB/M01150X and BB/R004579/1 to TB, and BB/M01228X/1 to the Warwick Advanced Bioimaging RTP), and Evgeny Zatulovskiy and Rob Kay (MRC LMB, Cambridge) for sharing experimental data.
Conflict of Interest
The authors declare that the research was conducted in the absence of any commercial or financial relationships that could be construed as a potential conflict of interest.
Supplementary Material
The Supplementary Material for this article can be found online at: https://www.frontiersin.org/articles/10.3389/fcomp.2019.00010/full#supplementary-material
References
Arganda-Carreras, I., Kaynig, V., Rueden, C., Eliceiri, K. W., Schindelin, J., Cardona, A., et al. (2017). Trainable weka segmentation: a machine learning tool for microscopy pixel classification. Bioinformatics 33, 2424–2426. doi: 10.1093/bioinformatics/btx180
Baniukiewicz, P., Collier, S., and Bretschneider, T. (2018). QuimP: analyzing transmembrane signalling in highly deformable cells. Bioinformatics 34, 2695–2697. doi: 10.1093/bioinformatics/bty169
Çiçek, Ö., Abdulkadir, A., Lienkamp, S. S., Brox, T., and Ronneberger, O (2016). “3D U-Net: learning dense volumetric segmentation from sparse annotation,” in Medical Image Computing and Computer-Assisted Intervention – MICCAI 2016. Lecture Notes in Computer Science, Vol. 9901, eds S. Ourselin, L. Joskowicz, M. Sabuncu, G. Unal, and W. Wells (Cham: Springer). 424–432. doi: 10.1007/978-3-319-46723-8_49
Collier, S., Paschke, P., Kay, R. R., and Bretschneider, T. (2017). Image based modeling of bleb site selection. Sci. Rep. 7:6692. doi: 10.1038/s41598-017-06875-9
Du, C. J., Hawkins, P. T., Stephens, L. R., and Bretschneider, T. (2013). 3D time series analysis of cell shape using Laplacian approaches. BMC Bioinformatics 14:296. doi: 10.1186/1471-2105-14-296
Goldsborough, P., Pawlowski, N., Caicedo, J. C., Singh, S., and Carpenter, A. (2017). CytoGAN: generative modeling of cell images. bioRxiv [Preprint]. doi: 10.1101/227645
Goodfellow, I., Pouget-Abadie, J., Mirza, M., Xu, B., Warde-Farley, D., Ozair, S., et al. (2014). “Generative adversarial nets,” in Advances in Neural Information Processing Systems, eds Z. Ghahramani, M. Welling, C. Cortes, N. D. Lawrence, and K. Q. Weinberger (Montreal, QC: Curran Associates, Inc), 2672–2680.
Han, C., Hayashi, H., Rundo, L., Araki, R., Shimoda, W., Muramatsu, S., et al. (eds.). (2018). “GAN-based synthetic brain MR image generation,” in IEEE 15th International Symposium on Biomedical Imaging (ISBI) (Washington, DC: IEEE), 734–38. doi: 10.1109/ISBI.2018.8363678
Isola, P., Zhu, J. Y., Zhou, T., and Efros, A. A. (2017). “Image-to-image translation with conditional adversarial networks,” in Proceedings of the IEEE Conference on Computer Vision and Pattern Recognition (Honolulu, HI), 1125–1134. doi: 10.1109/CVPR.2017.632
Johnson, G. R., Donovan-Maiye, R. M., and Maleckar, M. M. (2017). Generative modeling with conditional autoencoders: building an integrated cel. arXiv:1705.00092v1 [Preprint]. doi: 10.1101/238378
Kamnitsas, K., Ledig, C., Newcombe, V. F. J., Simpson, J. P., Kane, A. D., Menon, D. K., et al. (2017). Efficient multi-scale 3D CNN with fully connected CRF for accurate brain lesion segmentation. Med. Image Anal. 36, 61–78. doi: 10.1016/j.media.2016.10.004
Kazuhiro, K., Werner, R. A., Toriumi, F., Javadi, M. S., Pomper, M. G., Solnes, L. B., et al. (2018). Generative adversarial networks for the creation of realistic artificial brain magnetic resonance images. Tomography 4, 159–163. doi: 10.18383/j.tom.2018.00042
Li, C., and Wand, M. (2016). “Precomputed real-time texture synthesis with Markovian generative adversarial networks,” in European Conference on Computer Vision, eds C. Li, and M. Wand (Cham: Springer), 702–716. doi: 10.1007/978-3-319-46487-9_43
Odena, A., Dumoulin, V., and Olah, C. (2016). Deconvolution and Checkerboard Artifacts. Available online at: http://distill.pub/2016/deconv-checkerboard (accessed November 15, 2019).
Osokin, A., Chessel, A., Carazo-Salas, R. E., and Vaggi, F. (2017). “GANs for biological image synthesis,” in IEEE International Conference on Computer Vision, eds A. Osokin, A Chessel, R. E. Carazo-Salas, and F. Vaggi (Piscataway, NJ: IEEE), 2252–2261. doi: 10.1109/ICCV.2017.245
Peterlík, I., Svoboda, D., Ulman, V., Sorokin, D. V., and Maška, M. (2018). “Model-based generation of synthetic 3d time-lapse sequences of multiple mutually interacting motile cells with Filopodia,” in Lecture Notes in Computer Science (Including Subseries Lecture Notes in Artificial Intelligence and Lecture Notes in Bioinformatics), eds I. Peterlík, D. Svoboda, V D. V. Ulman, Sorokin, and M. Maška (Cham: Springer), 71–79. doi: 10.1007/978-3-030-00536-8_8
Ronneberger, O., Fischer, P., and Brox, T. (2015) “U-NET: Convolutional networks for biomedical image segmentation,” in Medical Image Computing and Computer-Assisted Intervention – MICCAI 2015. Lecture Notes in Computer Science, Vol. 9351, eds N. Navab, J. Hornegger, W. Wells, A. Frangi (Cham: Springer). doi: 10.1007/978-3-319-24574-4_28
Ruan, X., and Murphy, R. F. (2019). Evaluation of methods for generative modeling of cell and nuclear shape. Bioinformatics 35, 2475–2485. doi: 10.1093/bioinformatics/bty983
Shariff, A., Murphy, R. F., and Rohde, G. K. (2010). A generative model of microtubule distributions, and indirect estimation of its parameters from fluorescence microscopy images. Cytometry A 77, 457–466. doi: 10.1002/cyto.a.20854
Sorokin, D. V., Peterlik, I., Ulman, V., Svoboda, D., Necasova, T., Morgaenko, K., et al. (2018). FiloGen: model-based generator of synthetic 3d time-lapse sequences of single motile cells with growing and branching Filopodia. IEEE Trans. Med. Imaging 37, 2630–2641. doi: 10.1109/TMI.2018.2845884
Svoboda, D., Kozubek, M., and Stejskal, S. (2009). Generation of digital phantoms of cell nuclei and simulation of image formation in 3D image cytometry. Cytometry A. 75, 494–509. doi: 10.1002/cyto.a.20714
Svoboda, D., and Ulman, V. (2017) Mitogen: a framework for generating 3d synthetic time-lapse sequences of cell populations in fluorescence microscopy. IEEE Trans. Med. Imaging 36, 310–321. doi: 10.1109/TMI.2016.2606545
Tyson, R. A., Zatulovskiy, E., Kay, R. R., and Bretschneider, T. (2014). How blebs and pseudopods cooperate during chemotaxis. Proc. Natl. Acad. Sci. U.S.A. 111, 11703–11708. doi: 10.1073/pnas.1322291111
Vu, C. T., Phan, T. D., and Chandler, D. M. (2012). S3: a spectral and spatial measure of local perceived sharpness in natural images. IEEE Trans Image Process. 21, 934–45. doi: 10.1109/TIP.2011.2169974
Wiesner, D., Nečasová, T, and Svoboda, D. (2019b). “On generative modeling of cell shape using 3D GANs,” in Image Analysis and Processing – ICIAP 2019. ICIAP 2019. Lecture Notes in Computer Science, Vol. 11752, eds E. Ricci, S. Rota Bulò, C. Snoek, O. Lanz, S. Messelodi, and N. Sebe (Cham: Springer), 672–682.
Wiesner, D., Svoboda, D., Maška, M., and Kozubek, M. (2019a). CytoPacq: a web-interface for simulating multi-dimensional cell imaging. Bioinformatics 35, 1–3. doi: 10.1093/bioinformatics/btz417
Wu, Z., Song, S., Khosla, A., Yu, F., Zhang, L., Tang, X. (eds),. (2015). “3d shapenets: a deep representation for volumetric shapes,” in IEEE Conference on Computer Vision and Pattern Recognition (Piscataway, NJ: IEEE), 1912–1920.
Yang, D., Xu, D., Zhou, S. K., Georgescu, B., Chen, M., Grbic, S., et al. (2017). “Automatic liver segmentation using an adversarial image-to-image network,” in Medical Image Computing and Computer Assisted Intervention – MICCAI 2017. Lecture Notes in Computer Science, Vol. 10435, eds M. Descoteaux, L. Maier-Hein, A. Franz, P. Jannin, D. Collins, and S. Duchesne (Cham: Springer). 507–515. doi: 10.1007/978-3-319-66179-7_58
Zatulovskiy, E., Tyson, R., Bretschneider, T., and Kay, R. R. (2014). Bleb-driven chemotaxis of Dictyostelium cells. J. Cell Biol. 204, 1027–1044. doi: 10.1083/jcb.201306147
Keywords: GAN, generative models, cell image synthesis, data augmentation, live cell fluorescence microscopy
Citation: Baniukiewicz P, Lutton EJ, Collier S and Bretschneider T (2019) Generative Adversarial Networks for Augmenting Training Data of Microscopic Cell Images. Front. Comput. Sci. 1:10. doi: 10.3389/fcomp.2019.00010
Received: 31 July 2019; Accepted: 07 November 2019;
Published: 26 November 2019.
Edited by:
Ignacio Arganda-Carreras, University of the Basque Country, SpainReviewed by:
Sébastien Tosi, Institute for Research in Biomedicine, SpainJuan Julián Merelo, University of Granada, Spain
Carlos Castilla Ruiz, University of Navarra, Spain
Copyright © 2019 Baniukiewicz, Lutton, Collier and Bretschneider. This is an open-access article distributed under the terms of the Creative Commons Attribution License (CC BY). The use, distribution or reproduction in other forums is permitted, provided the original author(s) and the copyright owner(s) are credited and that the original publication in this journal is cited, in accordance with accepted academic practice. No use, distribution or reproduction is permitted which does not comply with these terms.
*Correspondence: Till Bretschneider, dGlsbC5icmV0c2NobmVpZGVyQHdhcndpY2suYWMudWs=
†These authors share first authorship