- 1School of Engineering, RMIT University, Melbourne, VIC, Australia
- 2Human Factors, Aerospace Division, Defence Science Technology Group, Melbourne, VIC, Australia
This paper examines the effects of reduced speech bandwidth and the μ-low companding procedure used in transmission systems on the accuracy of speech emotion recognition (SER). A step by step description of a real-time speech emotion recognition implementation using a pre-trained image classification network AlexNet is given. The results showed that the baseline approach achieved an average accuracy of 82% when trained on the Berlin Emotional Speech (EMO-DB) data with seven categorical emotions. Reduction of the sampling frequency from the baseline 16–8 kHz (i.e., bandwidth reduction from 8 to 4 kHz, respectively) led to a decrease of SER accuracy by about 3.3%. The companding procedure on its own reduced the average accuracy by 3.8%, and the combined effect of companding and band reduction decreased the accuracy by about 7% compared to the baseline results. The SER was implemented in real-time with emotional labels generated every 1.033–1.026 s. Real-time implementation timelines are presented.
Introduction
Speech Emotion Recognition (SER) is the task of recognizing the emotional aspects of speech irrespective of the semantic contents. While humans can efficiently perform this task as a natural part of speech communication, the ability to conduct it automatically using programmable devices is still an ongoing subject of research.
Studies of automatic emotion recognition systems aim to create efficient, real-time methods of detecting the emotions of mobile phone users, call center operators and customers, car drivers, pilots, and many other human-machine communication users. Adding emotions to machines has been recognized as a critical factor in making machines appear and act in a human-like manner (André et al., 2004).
Robots capable of understanding emotions could provide appropriate emotional responses and exhibit emotional personalities. In some circumstances, humans could be replaced by computer-generated characters having the ability to conduct very natural and convincing conversations by appealing to human emotions. Machines need to understand emotions conveyed by speech. Only with this capability, an entirely meaningful dialogue based on mutual human-machine trust and understanding can be achieved.
Traditionally, machine learning (ML) involves the calculation of feature parameters from the raw data (e.g., speech, images, video, ECG, EEG). The features are used to train a model that learns to produce the desired output labels. A common issue faced by this approach is the choice of features. In general, it is not known which features can lead to the most efficient clustering of data into different categories (or classes). Some insights can be gained by testing a large number of different features, combining different features into a common feature vector, or applying various feature selection techniques. The quality of the resulting hand-crafted features can have a significant effect on classification performance.
An elegant solution bypassing the problem of an optimal feature selection has been given by the advent of deep neural networks (DNN) classifiers. The idea is to use an end-to-end network that takes raw data as an input and generates a class label as an output. There is no need to compute hand-crafted features, nor to determine which parameters are optimal from the classification perspective. It is all done by the network itself. Namely, the network parameters (i.e., weights and bias values assigned to the network nodes) are optimized during the training procedure to act as features efficiently dividing the data into the desired categories. This otherwise very convenient solution comes at the price of much larger requirements for labeled data-samples compared to conventional classification methods.
In many cases, and this includes SER, only minimal data is available for training purposes. As shown in this study, the limited training data problem, to a large extent, can be overcome by an approach known as transfer learning. It uses an existing network pre-trained on extensive data to solve a general classification problem. This network is then further trained (fine-tuned) using a small number of available data to solve a more specific task.
Given that at present, the most powerful pre-trained neural networks were trained for image classification, to apply these networks to the problem of SER, the speech signal needs to be transformed into an image format (Stolar et al., 2017). This study describes steps involved in the speech-to-image transition; it explains the training and testing procedures, and conditions that need to be met to achieve a real-time emotion recognition from a continuously streaming speech. Given that many of the programmable speech communication platforms use speech companding and speech bandwidth reduced to a narrow range of 4 kHz, effects of speech companding and bandwidth reduction on the real-time SER are investigated.
Related Works
Conventional SER
Early SER studies searched for links between emotions and speech acoustics. Various low-level acoustic speech parameters, or groups of parameters, were systematically analyzed to determine correlation with the speaker's emotions. The analysis applied standard classifiers such as the Support Vector Machine (SVM), Gaussian Mixture Model (GMM), and shallow Neural Networks (NNs). Comprehensive reviews of SER methods are given in Schröder (2001), Krothapalli and Koolagudi (2013), and Cowie et al. (2001). An extensive benchmark comparison can be found in Schuller et al. (2009b).
Majority of low-level prosodic and spectral acoustic parameters such as fundamental frequency, formant frequencies, jitter, shimmer, spectral energy of speech, and speech rate were found correlated with emotional intensity and emotional processes (Scherer, 1986, 2003; Bachorovski and Owren, 1995; Tao and Kang, 2005). Good SER results were given by more complex parameters such as the Mel-frequency cepstral coefficients (MFCCs), spectral roll-off, Teager Energy Operator (TEO) features (Ververidis and Kotropoulos, 2006; He et al., 2008; Sun et al., 2009), spectrograms (Pribil and Pribilova, 2010), and glottal waveform features (Schuller et al., 2009b; He et al., 2010; Ooi et al., 2012).
The low-level features were later enriched by the addition of higher-level derivatives and statistical functionals of the low-level parameters. The Munich Versatile and Fast Open-Source Audio Feature Extractor (openSMILE) offers a computational platform allowing the calculation of many low- and high-level acoustic descriptors of speech (Eyben et al., 2018).
Identification of the “best” or the most characteristic acoustic features that characterize different emotions has been one of the most important but also the most elusive challenges of SER Despite extensive research progress was slow showing some inconsistencies between studies. For these reasons, the research focus moved toward methods that eliminate or reduce the need to have prior knowledge of “best features” and replace it with automatic feature generation procedures offered by neural networks.
SER Using Convolutional Neural Networks
The turning point in SER was the application of deep learning (DL) techniques (Hinton et al., 2006). Supervised DL neural network models have been shown to outperform classical approaches in a wide range of classification problems, among which the classification of images has been particularly successful (LeCun et al., 2015).
Given the success of DNN architectures design to classify 2-dimensional arrays, classification of speech emotions followed the trend, and several studies investigated the possibility of using spectral magnitude arrays known as speech spectrograms to classify emotions. Spectrograms provide 2-dimensional image-like time-frequency representations of 1-dimensional speech waveforms. Although the calculation of spectrograms does not fully adhere to the concept of the end-to-end network, as it allows for an additional pre-processing step (speech-to-spectrogram) before the DNN model, the processing is minimal and most importantly, it preserves the signal's entirety.
Several studies investigated the application of convolutional neural networks (CNNs) to classify either entire speech spectrogram arrays or specific bands of spectrograms to recognize speech emotions (Han et al., 2014; Huang et al., 2014; Mao et al., 2014; Fayek et al., 2015, 2017; Lim et al., 2016; Badshah et al., 2017; Stolar et al., 2018). In Fayek et al. (2015), SER from short frames of speech spectrograms using a DNN was investigated. An average accuracy of 60.53% (six emotions eNTERFACE database) and 59.7% (seven emotions—SAVEE database) was achieved. A similar but improved approach led to 64.78% of average accuracy (IEMOCAP data with five classes) (Fayek et al., 2017). Various concatenated structures combining CNNs and Recurrent Neural Networks (RNNs) were trained on the EMO-DB data using speech spectrograms (Lim et al., 2016). For the best structure, an average precision of 88.01% and a recall of 86.86% were obtained for seven emotions. In Han et al. (2014), CNN was applied to learn affect-salient features, which were then applied to the Bidirectional Recurrent Neural Network to classify four emotions from the IEMOCAP data. It was shown that this approach leads to 64.08% weighted accuracy and 56.41% unweighted accuracy. Although these methodologies are compelling, there is still room for improvement. One of the reasons causing a relatively low accuracy is that speech databases commonly used in the SER studies are too small to ensure adequate training of deep network structures. Besides, in many of the existing databases, emotional classes, and gender representation are imbalanced.
Publicly available resources for DL techniques include large pre-trained neural networks trained on over one billion of images from the ImageNet dataset (Russakovsky et al., 2015) representing at least 1,000 of different classes. The great advantage of using pre-trained networks is that many complex multi-class image classification tasks can be accomplished very efficiently by initializing the network training procedures with a pre-trained network's parameters (Bui et al., 2017). This way, the training process can be reduced to a short-time fine-tuning using a relatively small training data set. Alternatively, pre-trained network parameters can be applied as features to train conventional classifiers that require lower numbers of training data. These two approaches are known as transfer learning.
Pre-trained networks have been particularly successful in the categorization of images. A large selection of very efficient, freely available image classification networks has been created. Recent studies have shown that the speech classification task can be re-formulated as an image classification problem and solved using a pre-trained image classification network (Stolar et al., 2017; Lech et al., 2018). The speech to image transformation was achieved by calculating amplitude spectrograms of speech and transforming them into RGB images. This approach is commonly used to visualize spectrograms; however, in these cases, the aim was to create a set of images to perform the fine-tuning of a pre-trained deep convolutional neural network.
Real-Time SER
Real-time processing of speech needs a continually streaming input signal, rapid processing, and steady output of data within a constrained time, which differs by milliseconds from the time when the analyzed data samples were generated.
For a given SER method, the feasibility of real-time implementation is subject to the length of time needed to calculate the feature parameters. While the system training procedure can be time-consuming, it is a one-off task usually performed off-line to generate a set of class models. These models can be stored and applied at any time to perform the classification procedure for incoming sequences of speech samples. The classification process involves the calculation of feature parameters and model-based inference of emotional class labels. Since the inference is usually very fast (in the order of milliseconds), therefore if the feature calculation can be performed in a similarly short time, the classification process can be achieved in real-time.
Recent advancements in DL technologies for speech and image processing have provided particularly attractive solutions to SER, since both, feature extraction and the inference procedures can be performed in real-time. Fine-tuned CNNs have been shown to ensure both high SER accuracy and short inference time suitable for a real-time implementation (Stolar et al., 2017). This contrasts not only with classical ML approaches, but also with CNN methods that require the time-consuming calculation of spectrogram statistics (Lim et al., 2016), or salient discriminative feature analysis (Mao et al., 2014).
Implementation Factors Affecting SER
Past studies of SER have been restricted to laboratory conditions providing noise-free, uncompressed, and full-bandwidth audio recordings. It is not yet clear to what extent SER can handle speech recorded or streamed in different natural-environment terms. Several practical implementation factors that can have a significant effect on the accuracy of SER have been reported in recent studies. As indicated in Albahri and Lech (2016), Albahri et al. (2016), and Albahri (2016), speech compression, filtering, band reduction, and the addition of noise reduce the accuracy of SER. It was shown that the SER performance depends on the type of emotional expressions used to generate the SER training database (Stolar et al., 2017). A higher SER performance was achieved in the case of the EMO-DB database with emotions acted by professional actors, compared to the eNTERFACE database with emotions induced by reading an emotionally rich text. Only small differences between gender-dependent and gender-independent SER tested on the EMO-DB data were reported in Stolar et al. (2017).
Methods
Overview
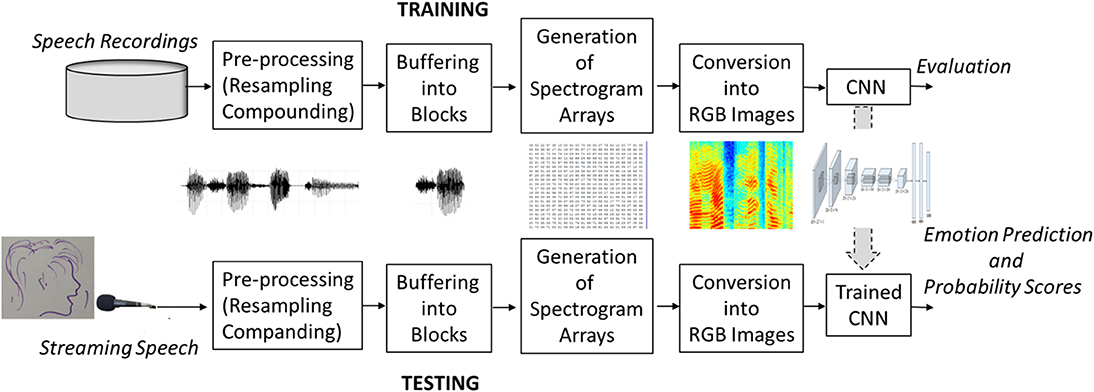
Given that the available computational resources were limited, and only a small database of emotionally labeled speech samples was available, the aim was to determine a computationally efficient approach that could work with a small training data set. These limitations are quite common and can be dealt with by the application of pre-trained networks and transfer learning. Since the majority of existing pre-trained networks have been created for image classification, to apply these networks to speech, the SER problem had to be re-defined an image classification task. To achieve this, labeled speech samples were buffered into short-time blocks (Figure 1). For each block, a spectral amplitude spectrogram array was calculated, converted into an RGB image format, and passed as an input to the pre-trained CNN. After a relatively short training (fine-tuning), the trained CNN was ready to infer emotional labels (i.e., recognize emotions) from an unlabeled (streaming) speech using the same process of speech-to-image conversion. In the presented here experiments, the SER performance was tested using two different sampling frequencies (16 and 8 kHz) and the μ-low companding procedure. The SER system was implemented using Matlab 2019a programming software and an HP Z440 Workstation with an Intel Xeon CPU, 2.1 GHz, 128 GB RAM.
Pre-processing
Sampling Frequency
In traditional narrow-band data transmission systems, the bandwidth of speech signal was limited to reduce the transmission bit rates. In telephony, for example, the frequency range of speech used to be limited to the range from 300 Hz to 3.4 kHz. It was enough to ensure a basic level of speech intelligibility but at the cost of high voice quality. It was likely that such severe bandwidth reduction resulted in a substantial reduction in the emotional information conveyed by speakers.
To test this possibility, the SER system was trained with two different sampling frequencies, the original 16 kHz corresponding to the broad speech bandwidth of 8 kHz, and the reduced sampling frequency of 8 kHz corresponding to the narrow-bandwidth of 4 kHz.
The procedure used to reduce the sampling frequency from 16 to 8 kHz consisted of two steps (Weinstein, 1979). Firstly, an 8th order lowpass Chebyshev Type I infinite impulse response filer was applied to remove frequencies beyond the Nyquist frequency of 8 kHz to prevent aliasing. Secondly, the speech was downsampled by a factor of 2 by removing every second sample.
Speech Companding
Applications of SER on various types of speech platforms present questions about potential effects of bandwidth limitations, speech compression, and speech companding techniques used by speech communication systems on the accuracy of SER. Studies of SER with compressed or band-limited speech using techniques such as included AMR, AMR-WB, AMR-WB+, and mp3 can be found in Albahri (2016); Albahri and Lech (2016); Albahri et al. (2016).
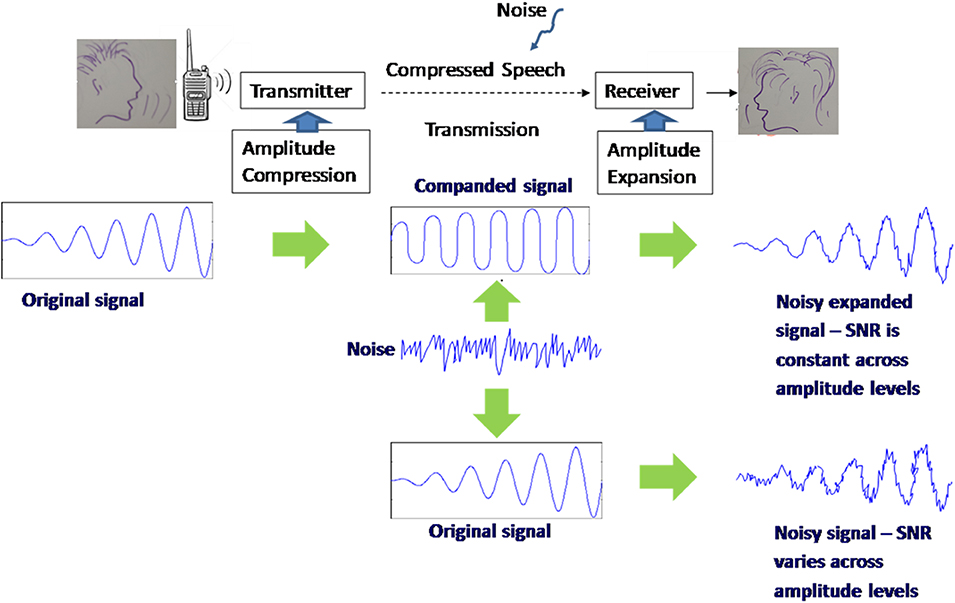
This study investigated the effects of the speech companding method known as the μ-law algorithm on SER. Variants of the μ-law companding are used in Pulse Code Modulation (PCM) transmission systems across the USA, Japan, and Europe. At the transmitter-end, the algorithm applies a logarithmic amplitude compression that gives higher compression to high-amplitude speech components and lower compression to low-amplitude components. The compressed speech is then transmitted through the communication channel, and during the transmission process, it acquires noise. The receiver-end expands the speech signal back to its original amplitude levels while maintaining the same signal-to-noise ratio (SNR) for both high and low amplitude components. A transmission conducted without the companding system would result in high SNR values for high amplitude signal components and low values for low-amplitude components (Cisco, 2006). The process of compression followed by the expansion is known as the companding procedure (Figure 2).
Given the original speech samples x, the compressed speech samples F(x) were calculated as Cisco (2006),
Whereas, the reconstructed speech samples were calculated as Cisco (2006),
The compression parameter value μ was set to 255 [standard in the USA and Japan Cisco, 2006].
Buffering Speech Waveforms into Blocks
The streaming or recorded speech was buffered into 1-s blocks to conduct block-by-block processing (Figure 1). A short, 10-ms stride was applied between subsequent blocks. The amplitude levels were normalized to the range −1 to 1. No pre-emphasis filter was used. Since the speech recordings were labeled sentence-by-sentence, it was assumed that the emotional label for a given 1-s block of speech was the same as the label of the speech sentence to which the block (or most samples within the block) belonged. The 1-s block-duration was determined empirically as an optimal time allowing to observe fast transitional changes between emotional states of speakers (Cabanac, 2002; Daniel, 2011). It was also shown to maximize SER accuracy. A detailed analysis of the block duration for SER can be found in Fayek et al. (2015, 2017). By having a very short 10-ms stride between subsequent blocks, a relatively large number of images were generated (see Table 2), which in turn improved the training process and the network accuracy.
Generation of Spectrogram Arrays
Spectral Magnitude Calculation
The procedure used to generate spectrogram arrays is illustrated in Figure 3. A short-time Fourier transform was performed for each 1-s blocks of speech waveforms using 16 ms frames made by applying a time-shifting Hamming window function. The time-shift between subsequent frames was 4 ms giving 75% overlap between frames. The real and imaginary outputs from the short-time Fourier transform were converted to spectral magnitude values and concatenated across all subsequent frames that belonged to a given block to form a time-frequency spectral magnitude array of size 257 × 259. Where, 257 was the number of frequency values (rows), and 259 was the number of time values (columns) in the image arrays. The computations were performed using the Matlab Voicebox spgrambw procedure with the frequency step Δf given as Voicebox (2018),
Where, fmax was equal to 0 Hz and fmin was equal to fs/2. Where, fs denotes the sampling frequency. The time step t was given as Voicebox (2018),
Where, for a given window length w in seconds, the corresponding Hamming window bandwidth BW defined as the bandwidth that gives 6 dB reduction of the maximum gain was given as Voicebox (2018),
Thus, for a 16-ms window, the bandwidth was approximately equal to 113 Hz.
The 118 Hz bandwidth of the Hamming window was chosen experimentally using a visual assessment of spectrogram images. It can be observed in Figure 4, that there is a trade-off between time- and frequency-resolution; an improvement of time-resolution leads to a deterioration of the frequency-resolution and vice versa. The chosen parameters provided a compromise between objective time- and frequency-domain parameters that gave a good subjective resolution of speech spectral components.

Figure 4. Examples showing how the time-frequency resolution trade-off affects spectrogram features visualization when changing bandwidth (BW) and time length (w) of the Hamming window: (a) BW = 25 Hz, w = 72 ms, Δt = 6 ms; (b) BW = 118 Hz, w = 16 ms, Δt = 4 ms; (c) BW = 1,000 Hz, w = 1.8 ms, Δt = 5 ms.
Frequency Scaling
While the time scale of the magnitude spectrograms was always linear spanning the time range of 0 to 1 s, four alternative frequency scales of spectrograms: linear, melodic (Mel) (Stevens and Volkman, 1940), equivalent rectangular bandwidth (ERB) (Moore and Glasberg, 1983), and logarithmic (log) (Traunmüller and Eriksson, 1995) were applied along the frequency axis (spanning from 0 Hz to fs/2 Hz). Different frequency scales were tested for comparison. Given the linear scale frequency values f [Hz], the corresponding logarithmic scale values flog were calculated as
The mel scale values fmel were estimated as O'Shaghnessy (1987),
Whereas, the ERB scale frequencies fERB were calculated as Glasberg and Moore (1990),
Figure 5 shows the effect of frequency scaling on the visual appearance of speech spectral components depicted by spectrogram images. Examples of spectrograms for the same sentence pronounced with anger, sadness, and neutral emotion are plotted on four different frequency scales: linear, Mel, ERB, and log. It can be seen, that this order of scales corresponds to the process of gradually “zooming into” the lower frequency range features (about 0–2 kHz), and at the same time, “zooming out” of the higher frequency range features (about 2–8 kHz) features. Therefore, the application of different frequency scales effectively provided the network either more or less-detailed information about the lower or upper range of the frequency spectrum.
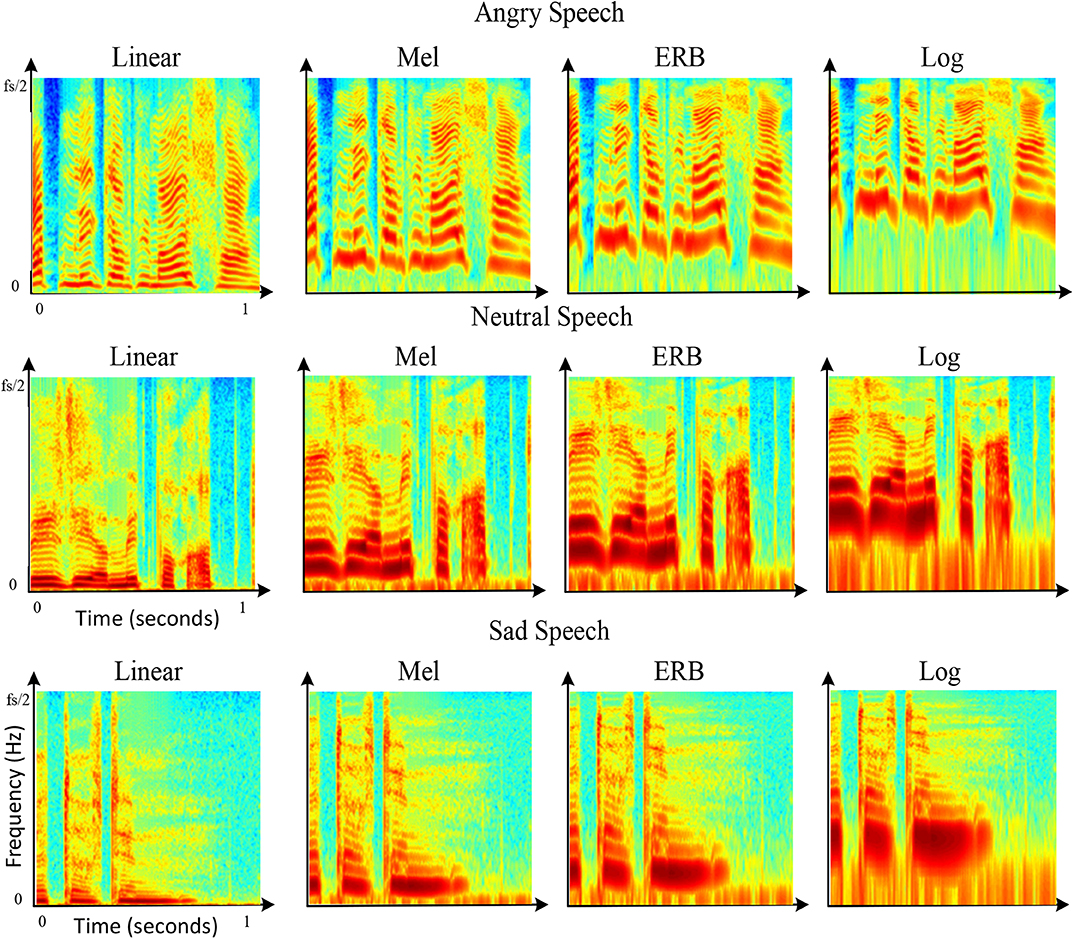
Figure 5. Examples showing the effect of different frequency scales on RGB images of spectrograms. The examples show spectrograms for the same utterance pronounced by the same person with sadness, anger, and neutral speech. The time length of 1 s is displayed in all examples disregarding the actual length of the sentence. The spectrograms are depicted on four different frequency scales linear, mel, ERB, and log. For all sub-pictures, the frequency range is 0 – fs/2 [Hz], and the time range is 0–1 s.
Conversion into RGB Images
Dynamic Range Normalization
The dynamic range of the original spectral magnitude arrays was normalized from Min [dB] to Max [dB] based on the average maximum and minimum values estimated over the entire training dataset. For the original uncompressed speech, the dynamic range of the database was −156 dB to −27 dB, and for the compounded speech, the range was −123 dB to −20 dB. These ranges were chosen to maximize the visibility of contours outlining time-frequency evolution of fundamental frequency (F0) speech formants, and harmonic components of F0. The amplitude-range normalization step was critical in achieving good visualization of spectral components. Figure 5 shows how different values of Min [dB] and Max [dB] can affect the visualization outcomes. As shown in Figure 6a, the dynamic range used to generate images of spectrograms gives very good visibility of spectral components of speech. When choosing other values of the dynamic range like for example, in Figure 6b, only low-amplitude components are visible, or in Figure 6c, only the highest-amplitude speech components are observable.

Figure 6. Examples showing the effect of different normalization of the dynamic range of spectral magnitudes on the visualization of spectrogram details; (a) Min = −156 dB, Max = −27 dB—good visibility of spectral components of speech, (b) Min = −126 dB, Max = −100 dB—an arbitrary range showing poor visibility, (c) Min = −50 dB, Max = −27 dB—another arbitrary range showing poor visibility. For all sub-pictures, the frequency range is 0–8 kHz, and the time range is 0–1 s.
Usually, the SER applies the magnitude arrays into the training process without transforming them into the image format (Huang et al., 2014; Fayek et al., 2017). There were two important advantages of using the R, G, and B components instead of the spectral amplitude arrays. Firstly the three arrays provided a different kind of information to each of the three input channels of CNN. The R-components had a higher intensity of the red color for high spectral amplitude levels of speech and thus emphasizing details of the high-amplitude speech components. The B-components had a higher intensity of the blue color for lower amplitudes; therefore, emphasizing details of the low-amplitude spectral components. Similarly, the G-components emphasized details of the mid-range spectral amplitude components. Secondly, speech representation in the form of images allowed us to use an existing pre-trained image classification network and replace the lengthly and data greedy model training process with a relatively short-time and low-data fine-tuning procedure.
Conversion into R, G, and B Arrays
Spectral magnitude arrays of 257 × 259 real-valued numbers were converted into a color RGB image format represented by three color-component arrays (Figure 7). As shown in Lech et al. (2018) the RGB images show slightly higher SER performance compared to the gray-scale images. The transformation into the RGB format was based on the Matlab “jet” colormap (MathWorks, 2018). The 64 colors of the “jet” colormap provided weights allowing to split each pixel value of the original spectral magnitude array into three values corresponding to R, G, and B components. Thus, each of the original 257 × 259 magnitude arrays was converted into three arrays, each of size 257 × 259 pixels. Informal visual tests based on other colormaps offered by Matlab (MathWorks, 2018); such as “parula,” “hsv,” “hot,” “cool,” “spring,” “summer,” “autumn,” “winter,” and “gray” revealed that the “jet” colormap provided the best visual representation of speech spectrograms.
Classification Network
AlexNet
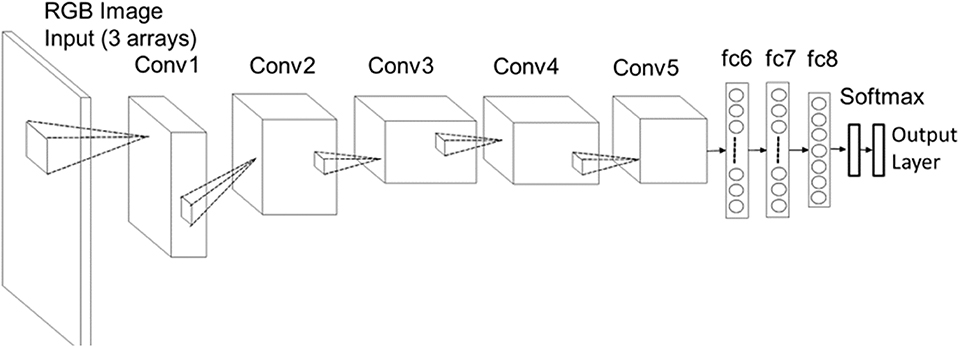
Given a very limited size of labeled emotional speech data, as well as relatively small computational resources, a transfer learning approach was adapted to fine-tune an existing pre-trained image classification network known as AlexNet. AlexNet is a convolutional neural network (CNN) introduced by Krizhevsky et al. (2012). It has been pre-trained on over 1.2 million images from the Stanford University ImageNet dataset to differentiate between 1,000 object categories. It consists of a 3-channel input layer allowing to input three 2-dimensional arrays, each of size 256 × 256 pixels. The input layer is followed by five convolutional layers (Conv1-Conv5), each with max-pooling and normalization layers (Figure 8). The 2-dimensional output features from the last convolutional layer Conv5 are converted into 1-dimensional vectors and fed into the three fully connected layers (fc6-fc8). While the convolutional layers extract characteristic features from the input data, the fully connected layers learn the data classification model parameters. The exponential SoftMax function maps the fc8 output values into a normalized vector of real values that fall into the range [0,1] and add up to 1. These values are given at the output layer and represent the probabilities of each class. The final classification label is given by the class that achieved the highest probability score.
Adapting AlexNet to SER
Since the required input size for Alexnet was 256 × 256 pixels, the original image arrays of 257 × 259 pixels were re-sized by a very small amount using the Matlab imresize command. The re-sizing did not cause any significant distortion. Each color component of the RGB spectrogram image was passed as an input to a separate channel of AlexNet. The original last fully connected layer fc8, the Softmax layer, and the output layer were modified to have seven outputs needed to learn differentiation between seven emotional classes.
Fine-Tuning of AlexNet
After adaptation to classify seven emotions, the AlexNet was trained (fine-tuned) on the labeled emotional speech data. Since the network was already-pre-trained, the process of fine-tuning was much faster and achievable with much smaller training data compared to what would be required when training the same network structure from scratch. However, it is possible that if the needed resources were available, training from scratch could lead to better results. Although in recent years, AlexNet has been rivaled by significantly more complex network structures (Szegedy et al., 2015), it is still of great value, as it provides a good compromise between data requirements, time, network simplicity and performance. Tests on more complex networks, such as ResNet, VGG, and GoogleLeNet (using the same training data), have shown that for a given outcome, the training time needed by larger networks was significantly longer than for AlexNet without a significant increase in performance (Sandoval-Rodriguez et al., 2019). More complex network structures likely need much larger training datasets to achieve significantly better results.
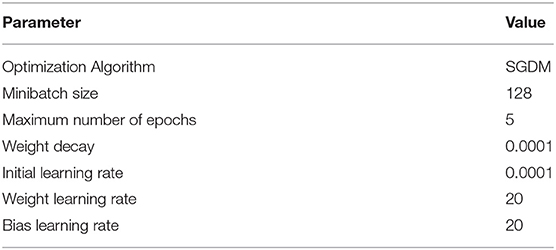
In transfer learning, the process of fine-tuning aims to create the highest learning impact on the final, fully-connected (data-dependent) layers of the network while leaving the earlier (data-independent) layers almost intact. To achieve faster learning in the new modified layers and slower in the old transferred layers, the initial learning rate was set to a small value, and the “weight learning rate” and the “bias learning rate” values were increased only for the fully connected layers. The fine-tuning was performed using Matlab (version 2019a). The network was optimized using stochastic gradient descent with momentum (SGDM) and L2 regularization factor applied to minimize the cross-entropy loss function. Table 1 provides the values of the network tuning parameters.
Experiments
Speech Database
The SER method was implemented using the Berlin Emotional Speech Database (EMO-DB) (Burkhardt et al., 2005). The original sampling frequency of the EMO-DB data was 16 kHz, corresponding to 8 kHz speech bandwidth. The database contained speech samples representing 7 categorical emotions (anger, happiness, sadness, fear, disgust, boredom, and neutral speech) spoken by 10 professional actors (5 female and 5 male) in fluent German. Each speaker acted 7 emotions for 10 different utterances (5 short and 5 long) with emotionally neutral linguistic contents. In some recordings, the speakers provided more than one version of the same utterance. After validation based on listening tests conducted by 10 assessors, only speech samples that scored subjective recognition rates>80% were included in the database. In total, the database contained 43,371 speech samples, each of the time duration 2–3 s. Table 2 summarizes the EMO-DB contents in terms of the number of recorded speech samples (utterances), the total duration of emotional speech for each emotion, and the number of generated spectrogram (RGB) images for each emotion.
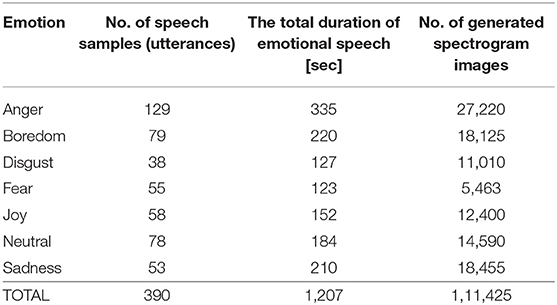
Table 2. Speech data characteristics—the number of utterances, total duration, and the number of spectrogram images generated for each emotion of the EMO-DB database.
Despite more recent developments of emotional speech datasets, the EMO-DB database remains one of the best and most widely used standards for testing and evaluating SER systems. Moreover, many significant developments in the field have been tested on this dataset. The strength of the EMO-DB is that it offers a good representation of gender and emotional classes, while the main disadvantage is that the emotions are acted in a strong way, which in some cases may be considered unnatural.
Experimental Schedule
All experiments adapted a 5-fold cross-validation technique was with 80% of the data distribution for the training (fine-tuning) of AlexNet, and 20% for the testing. The testing data samples were never used during the network training procedure. The experiments were speaker-independent and gender-independent. The following SER tasks experiments performed:
• Experiment 1—The aim was to provide a baseline SER: In this experiment, baseline SER results were generated using the original sampling frequency of 16 kHz corresponding to the speech bandwidth of 8 kHz.
• Experiment 2—The aim was to observe the effect of the reduced bandwidth on SER: In this experiment, SER was given using a lower sampling frequency of 8 kHz, which corresponded to the reduced bandwidth of 4 kHz.
• Experiment 3—The aim was to observe the effect of the companding on SER: In this experiment, the speech signal was companded before performing the SER task. This experiment was conducted using the sampling frequency of 16 kHz (i.e., 8 kHz bandwidth).
• Experiment 4—The aim was to observe the combined effect of the reduced bandwidth and the companding on SER: In this experiment, the speech signal was companded before performing the SER task, and the sampling frequency was equal to 8 kHz (i.e., 4 kHz bandwidth).
• Experiment 5—The aim was to determine the efficiency of the real-time implementation of SER.
Each classification experiment was repeated by investigating four alternative frequency scales (linear, ERB, MEL, and log).
Performance Measures
To maintain consistency with previous studies, the classification results were reported using measures given in Schuller et al. (2009a). It included the accuracy Aci, precision pci, recall rci, and the F-score Fci calculated for each class ci (i = 1, …, N) using (9)–(12), respectively.
Where, N denotes the number of emotional classes, tpi and tni are the numbers of true-positive and true-negative classification outcomes, respectively. Similarly, fpi and fni denote the numbers of false-positive and false-negative classification outcomes, respectively.
The precision, recall, and F-score parameters were averaged over all classes (N = 7) and for all test repetitions (5-folds). To reflect the fact that the emotional classes were unbalanced, the weighted average (WAQ) precision, recall, F-score and accuracy were estimated as,
Where, Qci denotes either precision, recall, F-score, or accuracy for the ith class (i = 1, 2, …, N) given as (9)–(12), respectively. The values of |ci| denote class sizes.
Results
Experiment 1—Baseline SER
The results presented in Table 3 show the baseline precision, recall, F-score, and accuracy calculated as weighted average values across all seven emotions, as given in (13). The results indicate that the frequency scaling has a significant effect on SER outcomes. The log, Mel, and ERB scale outperformed the linear scale across all metrics. The best overall performance was given by the Mel scale; however, the logarithmic (log) scale followed very closely. This outcome could be attributed to the fact that both logarithmic and Mel scales show a significantly larger number of low-frequency details of the speech spectrum. In particular, the trajectories of the fundamental frequency (F0) and the first three formants of the vocal tract are shown with much higher resolution than on the linear scale (see Figure 5). A demo of the real-time implementation illustrating the baseline Experiment 1 can be found on Videos 1.
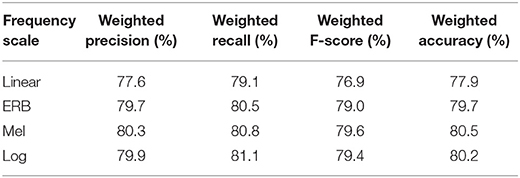
Table 3. Results of Experiment 1—Baseline SER, the sampling frequency of 16 kHz (bandwidth = 8 kHz), 7 emotions (anger, happiness, sadness, fear, disgust, boredom, and neutral speech), EMO-DB database.
Experiment 2—Effect of the Reduced Bandwidth
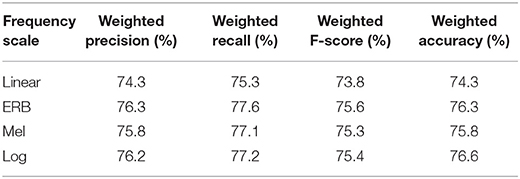
In comparison with the baseline (Table 3), the effect of down-sampling from 16 to 8 kHz (i.e., bandwidth reduction from 8 to 4 kHz) shown in Table 4 is evident in the reduction of the classification scores by 2.6–3.7% across all measures depending on the frequency scale. The smallest reduction of the average accuracy was given by the log scale (2.6%), and the Mel scale was affected the most (3.7%). Although the reduction was not very large, it indicated that high-frequency details (4–8 kHz) of the speech spectrum contain cues that can improve the SER scores. By reducing the speech bandwidth from 8 to 4 kHz, high-frequency details of the unvoiced consonants, as well as the higher harmonics of voiced consonants and vowels, can be removed. Consistent with the baseline, the logarithmic, and the Mel frequency scales provided the best results. It was most likely due to the fact that the downsampling preserved the low-frequency details (0–4 kHz) of speech.
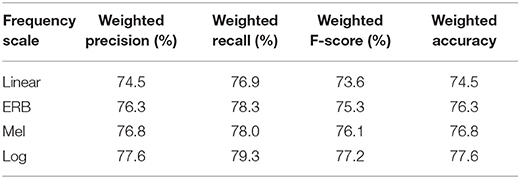
Table 4. Results of Experiment 2—Effect of the reduced bandwidth, the sampling frequency of 8 kHz (bandwidth = 4 kHz), 7 emotions (anger, happiness, sadness, fear, disgust, boredom, and neutral speech), EMO-DB database.
Experiment 3—Effect of the Companding
The effect of companding on the SER results is shown in Table 5. In comparison with the baseline results of Table 3, the speech companding procedure reduced the classification scores across all measures. For the classification accuracy, the reduction is by 3.4–4.7% depending on the frequency scale. For the log, the ERB, and the linear scales, the reduction was very similar (3.4–.6%). However, the Mel scale showed a slightly higher reduction (by 4.7%). Quantitatively, the effect of the companding procedure on SER results was very similar to the effect of the bandwidth reduction.
Experiment 4—Combined Effect of the Reduced Bandwidth and the Companding
The combined effect of the reduced bandwidth and the companding illustrated in Table 6 shows a further reduction of SER results across all measures compared to the baseline. However, the deterioration does not have an additive character, so the combined factors lead to a smaller reduction than that achieved by adding the reduction scores given by each factor independently. The highest reduction of the average accuracy was again observed for the Mel scale (6.8%) whereas, the log, the linear, and the ERB scales showed smaller deterioration (4.8–5.1%).
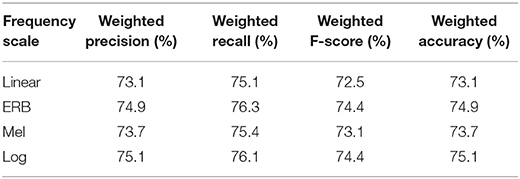
Table 6. Results of Experiment 4—Combined effect of the reduced bandwidth and the μ-low companding, fs= 8 kHz.
Experiment 5—Efficiency of the Real-Time Implementation of SER
The real-time application of the SER was achieved through block-by-block processing. A classification label indicating one of the seven emotional class categories was generated for each block. A demo of the real-time implementation illustrating the baseline experiment (Experiment 1) can be viewed on Videos 1. Table 7 shows the average computational time (estimated over three runs) that was needed to process a 1-s block of speech samples in Experiments 1–4. Apart from the total processing time, Table 7 gives the times needed to execute individual processing stages. The implementation used an HP Z440 Workstation with an Intel Xeon CPU and 128 Gb RAM, and the computational time was determined using MATLAB 2019a function timeit.
Depending on the experimental condition, the label for a given 1-s block was generated within 26.7–30.3 ms. The time needed for the inference process was about 18.5 ms, and it was longer than the total time required to generate the features (about 8–11 ms). The longest processing time (~5–8 ms) during the feature generation stage was needed to calculate the magnitude spectrogram arrays, whereas the time required to convert these arrays to RGB images was only 3.6 ms. Reduction of the sampling frequency from 16 to 8 kHz reduced the overall processing time by about 3.4 ms, and most of the reduction was due to a shorter time needed to calculate magnitude spectrogram arrays. The addition of the companding procedure had practically no effect on the average computational time.
Conclusion
In conclusion, both factors, reduction of the speech bandwidth, and the implementation of the speech companding μ-low procedure were shown to have a detrimental effect on the SER outcomes. Figure 9 shows the average accuracy for Experiments 1–4 using thee different frequency scales of spectrograms. By reducing the sampling frequency from 16 to 8 kHz (i.e., reducing the bandwidth from 8 to 4 kHz), a small reduction of the average SER accuracy by was observed (about 3.3%). The companding procedure reduced the result by a similar amount (about 3.8%), and the combined effect of both factors lead to about 7% reduction compared to the baseline results. The ERB frequency scale of spectrograms led to both, relatively high baseline results (79.7% average weighted accuracy) and high robustness against detrimental effects of both reduced bandwidth and application of the μ-low companding procedure. In all experimental cases, the SER was executed in real-time with emotional labels generated every 1.033–1.026 s. Future works will investigate ways of implementing the spectrogram classification approach to SER on mobile phones, call centers, and online communication facilities.
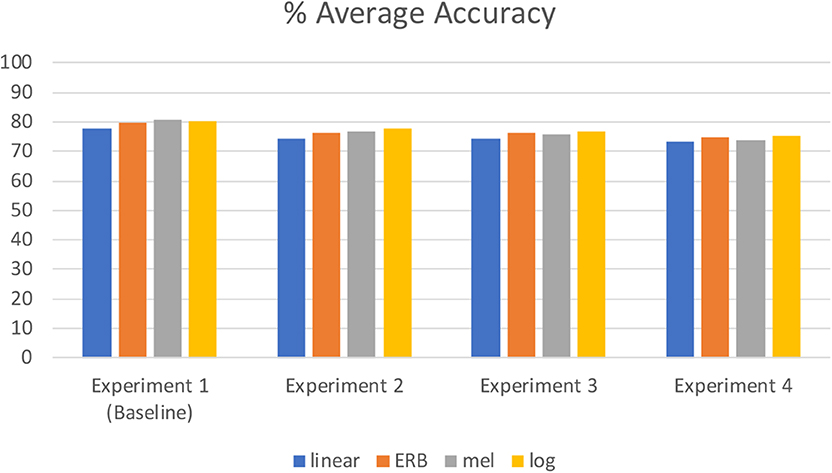
Figure 9. Summary of results—% Average accuracy for Experiments 1–4 using thee different frequency scales of spectrograms (linear, ERB, mel, and logarithmic).
Data Availability Statement
The datasets generated for this study are available on request to the corresponding author.
Author Contributions
ML, MS, CB, and RB contributed conception, designed the study, and analyzed the results. MS wrote the software and executed the experiments. ML and MS wrote the first draft of the manuscript. All authors contributed to manuscript revision, read, and approved the submitted version.
Funding
This research was supported by the Commonwealth of Australia as represented by the Defence Science and Technology Group under Research Agreement MyIP8597.
Conflict of Interest
The authors declare that the research was conducted in the absence of any commercial or financial relationships that could be construed as a potential conflict of interest.
Supplementary Material
The Supplementary Material for this article can be found online at: https://www.frontiersin.org/articles/10.3389/fcomp.2020.00014/full#supplementary-material
References
Albahri, A. (2016). Automatic emotion recognition in noisy, coded, and narrow-band speech (Ph.D. thesis). RMIT University, Melbourne, VIC, Australia.
Albahri, A., and Lech, M. (2016). “Effects of band reduction and coding on speech emotion recognition,” in The 10th IEEE International Conference on Signal Processing and Communication Systems (Gold Coast, QLD: Surfers Paradise), 1–6.
Albahri, A., Lech, M., and Cheng, E. (2016). Effect of speech compression on the automatic recognition of emotions. Int. J. Signal Process. Syst. 4, 55–61. doi: 10.12720/ijsps.4.1.55-61
André, E., Rehm, M., Minker, W., and Bühler, D. (2004). “Endowing spoken language dialogue systems with emotional intelligence,” in Affective Dialogue Systems Tutorial and Research Workshop, ADS 2004, eds E. Andre, L. Dybkjaer, P. Heisterkamp, and W. Minker (Germany: Kloster Irsee), 178–187.
Bachorovski, J. A., and Owren, M. J. (1995). Vocal expression of emotion: acoustic properties of speech are associated with emotional intensity and context. Psychol. Sci. 6, 219–224.
Badshah, A. M., Ahmad, J., Rahim, N., and Baik, S. W. (2017). “Speech emotion recognition from spectrograms with deep convolutional neural network,” in 2017 International Conference on Platform Technology and Service (PlatCon-17) (Busan), 1–5.
Bui, H. M., Lech, M., Cheng, E., Neville, K., and Burnett, I. (2017). Object recognition using deep convolutional features transformed by a recursive network structure. IEEE Access 4, 10059–10066. doi: 10.1109/ACCESS.2016.2639543
Burkhardt, F., Paeschke, A., Rolfes, M., Sendlmeier, W. F., and Weiss, B. (2005). “A database of German emotional speech,” in Interspeech 2005- Eurospeech, 9th European Conference on Speech Communication and Technology (Lisbon).
Cisco (2006). Waveform Coding Techniques. Available online at: https://www.cisco.com/c/en/us/support/docs/voice/h323/8123-waveform-coding.html (accessed on Januray 14, 2018).
Cowie, R., Douglas-Cowie, E., Tsapatsoulis, N., Votsis, G., Kollias, S., Fellenz, W., et al. (2001). Emotion recognition in human-computer interaction. IEEE Signal Process. Mag. 18, 32–80. doi: 10.1109/79.911197
Eyben, F., Weninger, F., Woellmer, M. B., and Schuller, B. (2018). The Munich Versatile and Fast Open-Source Audio Feature Extractor. Available online at: https://audeering.com/technology/opensmile (accessed on February 14, 2018).
Fayek, H., Lech, M., and Cavedon, L. (2015). “Towards real-time speech emotion recognition using deep neural networks,” in ICSPCS (Cairns, QLD), 1–6.
Fayek, H. M., Lech, M., and Cavedon, L. (2017). Evaluating deep learning architectures for speech emotion recognition. Neural Netw. 92, 60–68. doi: 10.1016/j.neunet.2017.02.013
Glasberg, B. R., and Moore, B. C. J. (1990). Derivation of auditory filter shapes from notched-noise data. Hear. Res. 47, 103–138.
Han, K., Yu, D., and Tashev, I. (2014). “Speech emotion recognition using deep neural network and extreme learning machine,” in Interspeech (Singapore), 1–5.
He, L., Lech, M., and Allen, N. B. (2010). “On the importance of glottal flow spectral energy for the recognition of emotions in speech,” in INTERSPEECH 2010, 11th Annual Conference of the International Speech Communication Association (Chiba), 1–5.
He, L., Lech, M., Memon, S., and Allen, N. (2008). “Recognition of stress in speech using wavelet analysis and teager energy operator,” in Interspeech (Brisbane, QLD), 1–5.
Hinton, G. E., Osindero, S., and Teh, Y. W. (2006). A fast learning algorithm for deep belief nets. Neural Comput. 18, 1527–1554. doi: 10.1162/neco.2006.18.7.1527
Huang, Z., Dong, M., Mao, Q., and Zhan, Y. (2014). “Speech emotion recognition using CNN,” in ACM (Orlando, FL), 801–804.
Krizhevsky, A., Sutskever, I., and Hinton, G. E. (2012). Imagenet classification with deep convolutional neural networks. Adv. Neural Inform. Process. Syst. 2012, 1097–1105. doi: 10.1145/3065386
Krothapalli, S. R., and Koolagudi, S. C. (2013). Emotion Recognition Using Speech Features (New York, NY: Springer-Verlag). doi: 10.1007/978-1-4614-5143-3
Lech, M., Stolar, M., Bolia, R., and Skinner, M. (2018). Amplitude-frequency analysis of emotional speech using transfer learning and classification of spectrogram images. Adv. Sci. Technol. Eng. Syst. J. 3, 363–371. doi: 10.25046/aj030437
LeCun, Y., Bengio, Y., and Hinton, G. (2015). Deep learning. Nature 521, 436–444. doi: 10.1038/nature14539
Lim, W., Jang, D., and Lee, T. (2016). “Speech emotion recognition using convolutional and recurrent neural networks,” in Proceedings of the Signal and Information Processing Association Annual Summit and Conference (Jeju), 1–4.
Mao, Q., Dong, M., Huang, Z., and Zhan, Y. (2014). Learning salient features for speech emotion recognition using convolutional neural networks. IEEE Trans. Multimedia 16, 2203–2213. doi: 10.1109/TMM.2014.2360798
MathWorks (2018). Documentation Jet, Jet Colormap Array. Available online at: https://au.mathworks.com/help/matlab/ref/jet.html?requestedDomain=www.mathworks.com (accessed on January 14, 2018).
Moore, B. C. J., and Glasberg, B. R. (1983). Suggested formulae for calculating auditory-filter bandwidths and excitation patterns. J. Acoust. Soc. Am. 74, 750–753.
Ooi, K. E. B., Low, L. S. A., Lech, M., and Allen, N. (2012). “Early prediction of major depression in adolescents using glottal wave characteristics and teager energy parameters,” in ICASSP (Kyoto), 1–5.
O'Shaghnessy, D. (1987). Speech Communication: Human and Machine (Boston, MA: Addison-Wesley Longman Publishing Co., Inc.), 120–520.
Pribil, J., and Pribilova, A. (2010). An experiment with evaluation of emotional speech conversion by spectrograms. Meas. Sci. Rev. 10, 72–77. doi: 10.2478/v10048-010-0017-3
Russakovsky, J. D. O., Su, H., Krause, J., Satheesh, S., Ma, S., Huang, Z., et al. (2015). ImageNet large scale visual recognition challenge. Int. J. Comput. Vis. 115, 211–252. doi: 10.1007/s11263-015-0816-y
Sandoval-Rodriguez, C., Pirogova, E., and Lech, M. (2019). Two-stage deep learning approach to the classification of fine-art paintings. IEEE Access 7, 41770–41781. doi: 10.1109/ACCESS.2019.2907986
Scherer, K. R. (1986). Vocal affect expression: a review and a model for future research. Psychol. Bull. 99, 143–165.
Scherer, K. R. (2003). Vocal communication of emotion: a review of research paradigms. Speech Commun. 40, 227–256. doi: 10.1016/S0167-6393(02)00084-5
Schröder, M. (2001). “Emotional speech synthesis: a review,” in Seventh European Conference on Speech Communication and Technology (Aalborg), 1–4.
Schuller, B., Steidl, S. A, and Batliner, A. (2009a). “The interspeech 2009 emotion challenge,” in Proceedings INTERSPEECH 2009, 10th Annual Conference of the International Speech Communication Association (Brighton, UK), 312–315.
Schuller, B., Vlasenko, B., Eyben, F., Rigoll, G., and Wendemuth, A. (2009b). “Acoustic emotion recognition: a benchmark comparison of performances,” in IEEE Workshop on Automatic Speech Recognition Understanding (Merano: ASRU 2009: IEEE Workshop on Automatic Speech Recognition & Understanding), 552–557.
Stevens, S. S., and Volkman, J. (1940). The relation of pitch to frequency: a revised scale. Am. J. Psychol. 53, 329–353.
Stolar, M., Lech, M., Bolia, R., and Skinner, M. (2018). “Acoustic characteristics of emotional speech using spectrogram image classification,” in Proceedings of the 12th International International Conference on Signal Processing and Communication Systems, ICSPCS'2018 (Cairns: ICSPCS), 1–6.
Stolar, M. N., Lech, M., Bolia, R. B., and Skinner, M. (2017). “Real-time speech emotion recognition using RGB image classification and transfer learning,” in ICSPCS (Surfers Paradise, QLD), 1–6.
Sun, R., Moore, E., and Torres, J. F. (2009). “Investigating glottal parameters for differentiating emotional categories with similar prosodics,” in ICASSP (Taipei), 1–5.
Szegedy, C., Liu, W., Jia, Y., Sermanet, P., Reed, S., Anguelov, D., et al. (2015). “Going deeper with convolutions,” in Proceedings of the IEEE Conference on Computer Vision and Pattern Recognition (Boston, MA: EEE Conference on Computer Vision and Pattern Recognition), 1–9.
Tao, J., and Kang, Y. (2005). Features importance analysis for emotional speech classification. in Affective Computing and Intelligent Interaction, ACII 2005. Lecture Notes in Computer Science, Vol. 3784, eds J. Tao, T. Tan, and R. W. Picard (Berlin; Heidelberg: Springer), doi: 10.1007/11573548_58
Traunmüller, H. A., and Eriksson, A. (1995). The perceptual evaluation of F0-excursions in speech as evidenced in liveliness estimations. J. Acoust. Soc. Am. 97, 1905–1915.
Ververidis, D., and Kotropoulos, C. (2006). Emotional speech recognition: resources, features and methods. Speech Commun. 48, 1162–1181. doi: 10.1016/j.specom.2006.04.003
Voicebox (2018). Description of Spgrambw. Available online at: http://www.ee.ic.ac.uk/hp/staff/dmb/voicebox/doc/voicebox/spgrambw.html (accessed on January 14, 2018).
Keywords: speech emotions, real-time speech classification, transfer learning, bandwidth reduction, companding
Citation: Lech M, Stolar M, Best C and Bolia R (2020) Real-Time Speech Emotion Recognition Using a Pre-trained Image Classification Network: Effects of Bandwidth Reduction and Companding. Front. Comput. Sci. 2:14. doi: 10.3389/fcomp.2020.00014
Received: 10 September 2019; Accepted: 16 April 2020;
Published: 26 May 2020.
Edited by:
Nicholas Cummins, University of Augsburg, GermanyReviewed by:
Jiri Pribil, Slovak Academy of Sciences, SlovakiaAnna Pribilova, Slovak Academy of Sciences (SAS), Slovakia
Copyright © 2020 Lech, Stolar, Best and Bolia. This is an open-access article distributed under the terms of the Creative Commons Attribution License (CC BY). The use, distribution or reproduction in other forums is permitted, provided the original author(s) and the copyright owner(s) are credited and that the original publication in this journal is cited, in accordance with accepted academic practice. No use, distribution or reproduction is permitted which does not comply with these terms.
*Correspondence: Margaret Lech, bWFyZ2FyZXQubGVjaEBybWl0LmVkdS5hdQ==
 Margaret Lech
 Melissa Stolar1
 Robert Bolia