 Trong Hieu Luu
 Thanh Tam Nguyen2
- 1College of Engineering, Can Tho University, Can Tho, Vietnam
- 2Mekong Delta Development Research Institute, Can Tho University, Can Tho, Vietnam
- 3School of Industrial Engineering and Management Department, International University – Vietnam National University, Ho Chi Minh City, Vietnam
This study presents a novel and efficient approach to accurately assess post-sowing rice plant density by leveraging unmanned aerial vehicles (UAVs) equipped with high-resolution RGB cameras. In contrast to labor-intensive and spatially limited traditional methods that rely on manual sampling and extrapolation, our proposed methodology uses UAVs to rapidly and comprehensively survey entire paddy fields at optimized altitudes (4, 6, 8, and 10 m). Aerial imagery was autonomously acquired 17 days post-sowing, following a pre-defined flight path. The robust rice plant density estimation process incorporates two key innovations: first, a dynamic system of 12 adaptive segmentation thresholding blocks that effectively detects rice seed presence across diverse and variable background conditions. Second, a tailored three-layer convolutional neural network (CNN) accurately classifies vegetative situations. To maximize the training efficiency and performance, we implemented both a pretrained model and a deep learning model, conducting a rigorous comparative analysis against the state-of-the-art YOLOv10. Notably, under favorable imaging conditions, our findings indicate that a 6-m flight altitude yields optimal results, achieving a high degree of accuracy with rice plant density estimates that closely align with those obtained through traditional ground-based methods. This investigation unequivocally highlights the significant advantages of UAV-based monitoring as an economically viable, spatially comprehensive, and demonstrably accurate tool for precise rice field management, ultimately contributing to enhanced crop yields, improved food security, and the promotion of sustainable agricultural practices.
1 Introduction
The cultivation of paddy fields holds paramount significance in the realm of agriculture, contributing significantly to global food production and ensuring food security for vast populations. Among the key factors influencing the success of paddy cultivation is the accurate evaluation of rice plant density in these fields. The meticulous assessment of rice plant density not only plays a pivotal role in optimizing crop yield but also aids in resource management, informing decisions related to seed distribution, irrigation, and fertilization.
In traditional agricultural practices, crop researchers and agronomists assess the emergence rate through manual field monitoring and recording, a method known for its time-consuming nature and susceptibility to statistical inaccuracies (Oard et al., 2020). Currently, unmanned aerial vehicles (UAVs) are utilized in the context of agricultural monitoring, such as in the study estimating the above-ground biomass of potatoes (Yang et al., 2024) and potato yield (Liu et al., 2025). Additionally, UAV-based spectral images are used to predict chili yield by utilizing hyperspectral images (Zhang et al., 2025a), as well as by integrating meteorological data and thermal infrared images (Zhang et al., 2025b). In the domain of land utilization and surface topography assessment, UAVs have been deployed to acquire high-resolution imagery for vegetation mapping (Feng et al., 2015; Zhou et al., 2021), as well as integrating UAV-mounted Light Detection and Ranging (LiDAR) technology (Trepekli and Friborg, 2021; Kellner et al., 2019; Sankey et al., 2018), to facilitate comprehensive data acquisition and analysis.
In recent years, a camera with ultra-high resolution has been commonly used in the agricultural monitoring process. Image processing and computer vision are highly versatile and can be applied to a wide range of tasks, including crop monitoring, disease detection, weed control, and yield prediction. The domain of computer vision methods, notably including edge detection and thresholding methods, has been documented in scholarly studies by García-Martínez et al. (2020), Li et al. (2019), and Zhao et al. (2018). It is important to note that these methods are primarily focused on the identification of pixels corresponding to individual seeds, which presents challenges when dealing with scenarios involving high-density planting. The estimation of wheat plant density and the assessment of the quantity of wheat seeds have been addressed in scholarly studies (Liu et al., 2017, 2018; Ma et al., 2020). However, it is noteworthy that the data collection processes in these studies have predominantly relied on manual data-gathering techniques, which may not be suitable for the requirements of large-scale agricultural areas. In the method of image processing, particularly through the application of deep learning techniques, there has been noteworthy academic exploration of the utility of UAV imagery for diverse agricultural monitoring tasks. These tasks encompass the investigation of pine wilt disease (Yu et al., 2021), the assessment of chlorophyll content in peanut leaves (Qi et al., 2021), and the detection of blackgrass weed presence (Su et al., 2022). Furthermore, the enhancement of image classification and monitoring quality can be achieved through the application of deep learning techniques. Notably, the identification and tracking of crop pests and diseases have been extensively explored using the deep learning methods in previous studies (Jung et al., 2023; Zhang et al., 2023; Bezabih et al., 2023).
In addition, it is important to acknowledge that, in the context of maize seedling analysis, including aspects such as maize plant density, emergence rate evaluation (Gao et al., 2023; Xu et al., 2023), and leaf counting (Velumani et al., 2021), the efficacy of deep learning methods may be influenced by specific characteristics of the maize plant. Notably, maize has a relatively larger plant size, and the environmental conditions under which it thrives are comparatively less complex, which may have implications for the performance of these image processing techniques.
In the context of rice cultivation, there exists a body of research that has examined the application of drones for the purposes of seed sowing and growth stage classification (Adeluyi et al., 2022). However, it is noteworthy that these investigations have primarily concentrated on the methodologies associated with seed planting and have primarily evaluated the intermediate and later stages of plant development. An alternative approach can be found in a study by Ma et al. (2019) and Liang et al. (2019), which uses CNN methods to detect weeds in rice seedlings and rice blast diseases. Nonetheless, the applicability of this method to extensive agricultural areas may be challenging. In addition, the previous study proposed by the authors (Guo et al., 2021) introduced an innovative approach utilizing deep learning algorithms to compute sowing density based on rice seed setting rates. Nonetheless, this method necessitates the collection of ripened rice plants at the end of the crop season, making it unsuitable for helping farmers control fertilizers and pesticides. Furthermore, in previous studies (Wu et al., 2019; Tseng et al., 2022), unmanned aerial vehicles (UAVs) were used for the purpose of rice seedling detection and quantification using CNN techniques. While these methodologies have demonstrated efficacy in accurately enumerating rice plants, their scope is limited to transplanted rice configurations characterized by block arrangements. Notably, these approaches primarily target rice plants at a developmental stage marked by the initiation of panicle growth, indicative of robust growth and maturity.
There are two methods of rice cultivation, namely, transplanting and sowing. In transplanting, rice seeds are first germinated in a nursery and then transplanted into the field at ~30–35 days old. Transplanting allows for more controlled planting distances and arrangements, leading to a uniform plant size and growth. Besides, sowing is also a popular cultivation method, where rice seeds are planted directly onto the field surface, with three to five seeds in each hole. Their growth depends on the weather conditions, which affect germination, resulting in each hole having nothing, a single rice plant, or clusters of rice plants. In contrast to the earlier research and as the first attempt, we focus on counting seedlings from the sowing cultivation method. Seedling growth and distribution vary across the field; thus, a new dataset for sowing plants and an optimal altitude for counting should be discussed. Traditionally, determining a plant population involves manually counting the total number of rice plant tillers within a 50 × 50 cm square frame. However, this method included samples from various locations within a plot, making it time-consuming, labor-intensive, and expensive. This study proposed a method to evaluate the rice plant density when rice plants are in the transplanting and tillering stages using a camera mounted on the UAV. The UAV flights are conducted at varying altitudes, enabling the assessment of the most suitable altitude for capturing small plant details. To remove the uncertainties arising from environmental conditions and the inherently random germination process, the study proposes a thresholding method in conjunction with a three-layer CNN. This proposed methodology is compared with YOLOv10 to evaluate its overall performance. We also validated the result manually in the paddy field. Based on the detection results, we can achieve a rapid and cost-effective assessment of rice plant density, allowing for early detection of areas with lower plant density. This approach not only reduces labor costs but also provides visual representations of sparse areas, enabling farmers to make informed decisions regarding the need for recultivation.
2 Materials and methods
2.1 Experimental site and data acquisition
Data acquisition was conducted on 6 June 2023 in Thu Thua, Long An province, Vietnam (Figure 1).
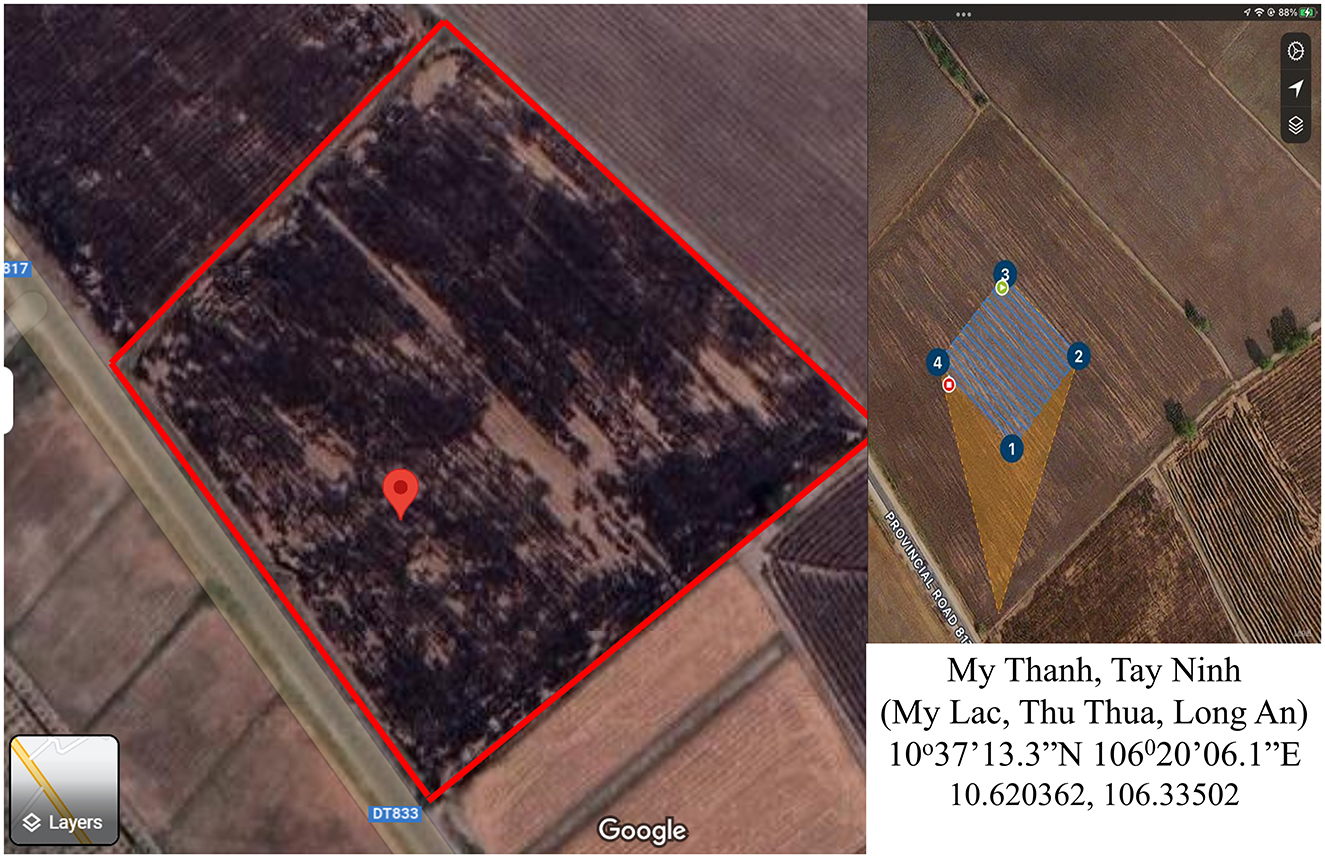
Figure 1. Observation location area.
Subsequently, the seed rate and tiller numbers were meticulously measured 17 days after sowing. To facilitate this evaluation, a Phantom Pro 4 equipped with a DJI-FC6310S camera (providing images with dimensions of 4,864 × 3,648 pixels) was used. The ground sample distance (GSD) of the aerial photo at each height was calculated manually before flight, with the flight specification shown in Table 1.
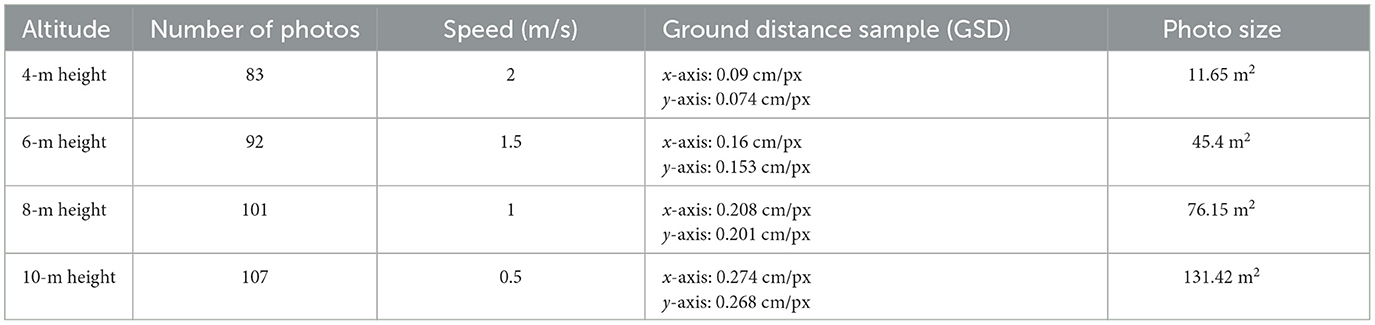
Table 1. Flight plan information.
Images were collected at 8:40 am on the observation day (Figure 2). The wind is quite strong and blowing the inverse direction of the flight path; the light condition is suitable for capturing images. Considering the changes in the environmental background, the data collection area was randomly selected within the field. These conditions included backlighting, water, dark backgrounds, and uncertain objects.
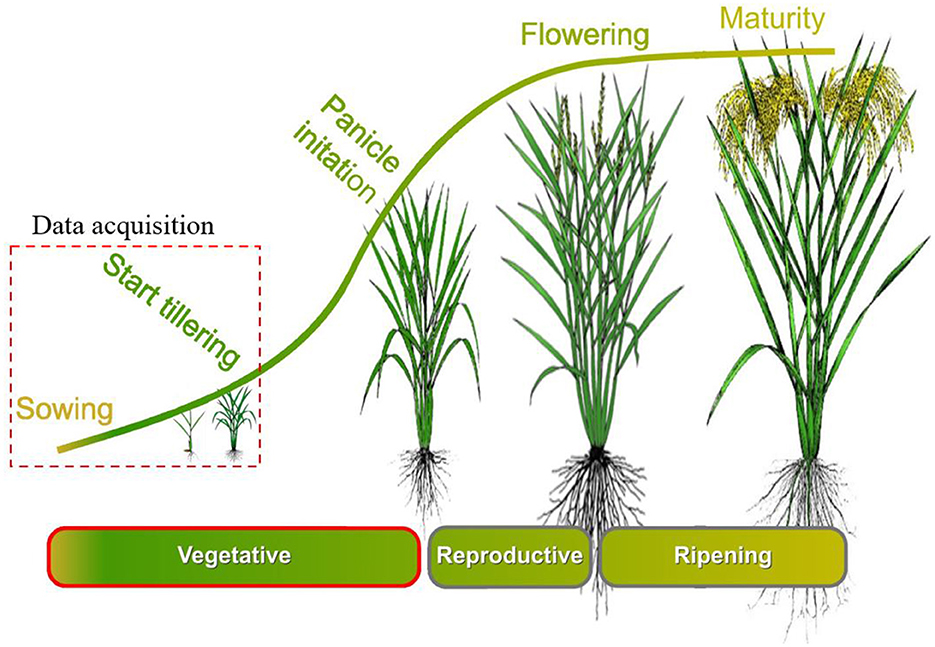
Figure 2. Rice crop cycle and data acquisition time. Figure adapted from “Growth stages of rice” by IRRI Photos, licensed under CC BY-NC-SA 2.0 DEED (URL: https://www.flickr.com/photos/ricephotos/13597007274/in/album-72157643341257395/).
2.2 Rice plant seedling trait
The experimental field was ~2 ha, with a planting density of 40 kg/ha. The sowing configuration used a relatively fertilizer depth at 7 cm and a wider spacing of 13 × 20 cm, with approximately three rice seedlings planted in each hill. By following Yoshida (1981), in one crop cycle, the rice plant must follow three stages (Figure 2), which are the vegetative growth stage, the reproductive stage, and the ripening stage. In vegetative growth stage, rice plants are of a very small size, and they develop leaves and stems. Depending on the rice variety, nutrients, and weather conditions, the time of tillering may change. In this study, a sowing machine was employed to sow rice seeds of the IR4625 variety precisely 1 day after germination.
In addition to the utilization of advanced imaging technology, traditional methods were employed for the assessment of rice plant density 17 days after sowing. Four distinct squares, each measuring 50 × 50 cm2, were strategically placed in the four corners of the paddy fields, spanning the plow path of the tractor, as depicted in Figure 3. Evidently, it is discernible that a range of conditions characterize the state of the rice seeds, encompassing both the presence of tillered rice and instances of non-germination. Consequently, we have categorized the rice plants into three distinct groups: “1 rice plant,” “clusters of rice plants,” and “undefined object.” As illustrated in Figure 4, the observed hill density was recorded at 33 hill/m2. Furthermore, we also assessed the quantification of tiller numbers, wherein three canopies equate to one rice branch. Concurrently, an evaluation of rice germination conditions was conducted, with detailed information provided in Table 2.
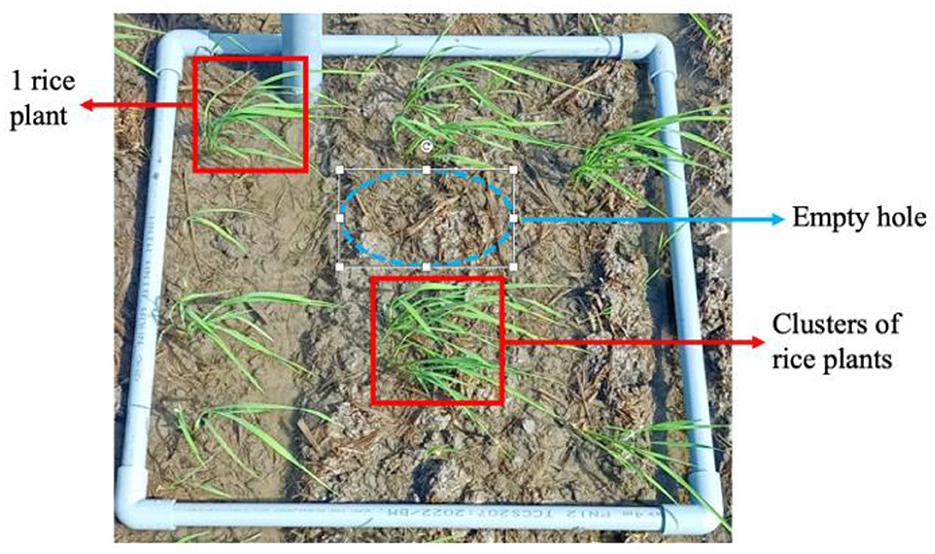
Figure 3. Rice germination status 17 days after sowing.
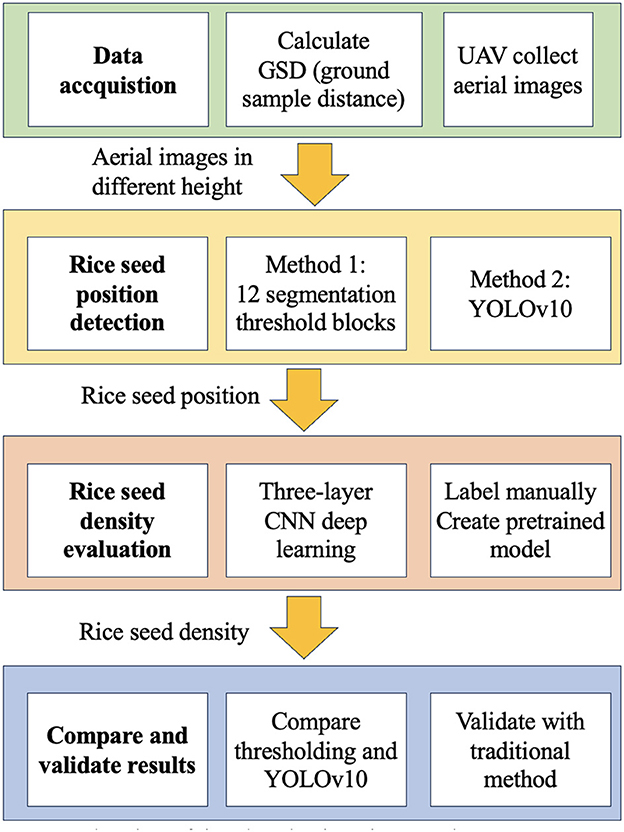
Figure 4. Flowchart of rice seed density using RGB imagery.
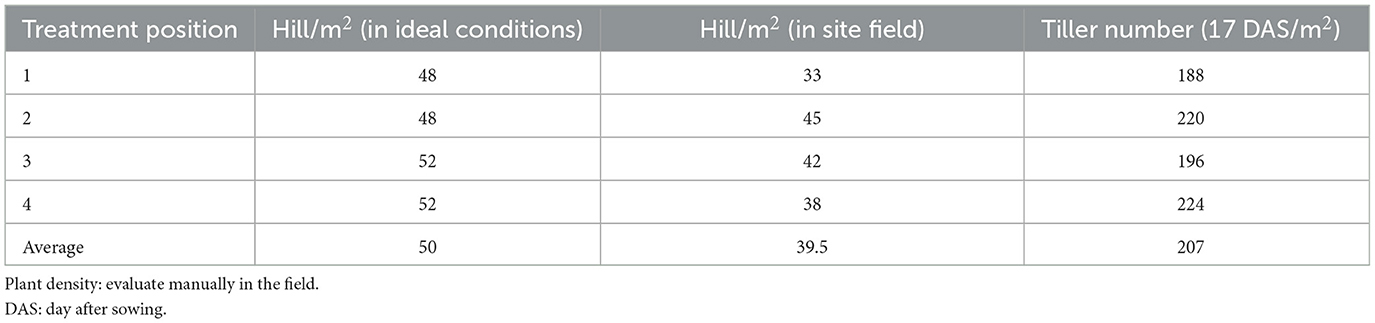
Table 2. Evaluation of agronomics traits at different treatments.
2.3 Overall view of the system
The comprehensive depiction of the system is shown in Figure 4. At the initial stage (Step 1), the localization of rice seed positions is accomplished through the implementation of two distinct techniques: segmentation thresholding and the utilization of YOLOv10. Subsequently, a three-layer CNN architecture is introduced and employed to discern the quantity of rice seeds within each respective cavity. Finally, a comparative evaluation is performed, contrasting the efficacy of the two methodologies against the traditional practices of counting and interpolation, as applied to the context of paddy field analysis.
2.4 Rice seed holes detection using the segmentation threshold method
Aerial imagery is susceptible to a multitude of environmental variables, encompassing scenarios such as backlighting, water reflections, and background uncertainty. In this study, we introduce a comprehensive approach to address various environmental conditions, featuring a structured framework composed of 12 successive segmentation threshold blocks, as illustrated in Figure 5. The initial step involves the transformation of aerial images from the RGB color space to the HSV color space. Subsequently, these 12 segmentation threshold blocks, each defined by 9 distinct maximum and minimum threshold values, are systematically applied. Moreover, a noise reduction procedure is executed three times, with the primary objective of mitigating uncertainty-induced noise. It is noteworthy that following the initial noise reduction operation, subsequent thresholding processes are exclusively reserved for the preservation of rice seed positions, thereby obviating the need for further thresholding iterations.
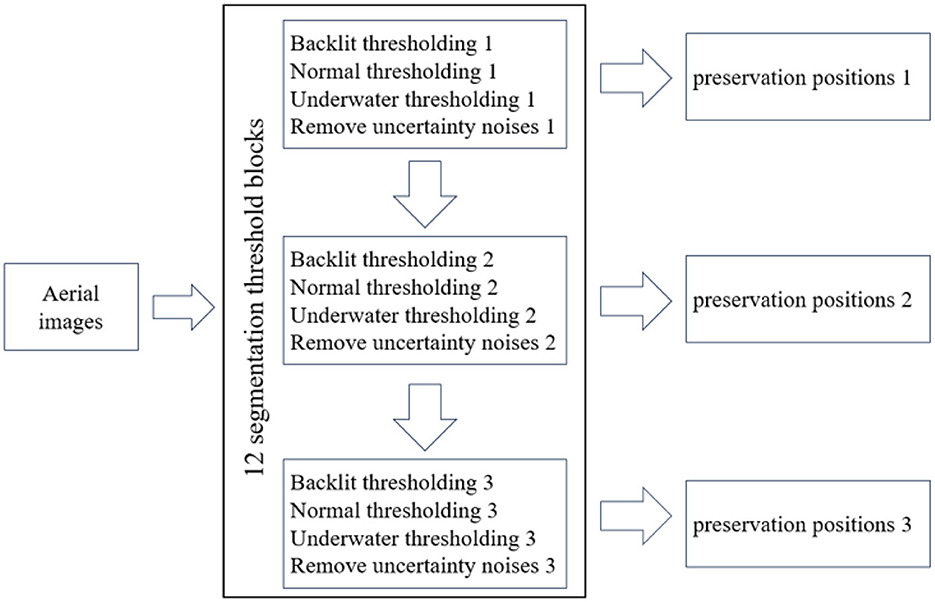
Figure 5. Rice seed detection using the threshold method step by step.
To detect rice hole positions, the RGB channel is first converted into HSV. After that, 12 adaptive threshold parameters are implemented. For the sake of clarity and effective evaluation, these parameters are categorized into three distinct sets, each denoting popular environmental conditions encountered in the field, namely: backlit lighting, underwater lighting, and normal lighting. Within each category, three unique combinations of HSV maximum and minimum values are applied. As a result of these segmentation thresholding operations, the resultant images display a binary representation where the background is rendered in black, while rice seeds and uncertainty-induced artifacts [defined by their respective coordinates x, y, (h) height, and (w) width; Figure 6] are depicted in white. To eliminate unwanted noise, the size of each delineated area is rigorously assessed (Figure 6). Subsequently, the areas failing this size criterion, indicative of noise, are eliminated. The remaining regions, representing potential rice seed locations, are then channeled as input data for subsequent classification techniques. Notably, these retained positions are exempt from any further thresholding processes. The 12 adaptive threshold parameters are specifically defined in terms of minimum and maximum HSV values, as delineated below:
• Under_water_1: minimum (32, 28, 0), maximum (57, 255, 255);
• under_water_2: minimum (30, 245, 0), maximum (76, 186, 186);
• backlit_1: minimum (31, 0, 0), maximum (64, 100, 180);
• remove_noise_1;
• normal_1: minimum (21, 48, 48), maximum (106, 151, 151);
• normal_2: minimum (45, 30, 30), maximum (89, 115, 190);
• backlit_2: minimum (47, 0, 82), maximum (85, 255, 255);
• remove_noise_2;
• backlit_3: minimum (58, 0, 72), maximum (95, 255, 255);
• backlit_4: minimum (47, 0, 82), maximum (85, 255, 255);
• backlit_5: minimum (47, 0, 82), maximum (85, 255, 255);
• remove_noise_3;
• normal_3: minimum (39, 13, 80), maximum (90, 255, 255);
• under_water_3: minimum (0, 0, 104), maximum (110, 157, 255);
• under_water_4: minimum (35, 0, 0), maximum (179, 255, 255).
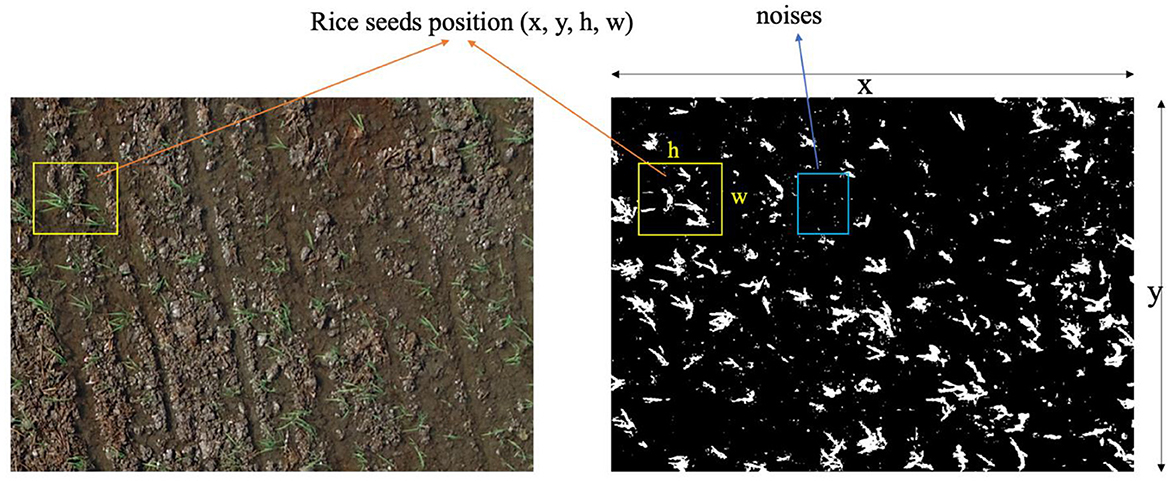
Figure 6. Rice seed detection with noise filtering using the thresholding mask.
2.5 Rice seed detection and classification using YOLOv10
To evaluate the effects of our proposed method, we compare it with the deep learning method YOLOv10. It is developed in 2024 by researchers at Tsinghua University (Wang et al., 2024) using the Ultralytics Python package, with the newest improvement in real-time object detection. The backbone of YOLOv10 is responsible for extracting features and uses an improved version of the cross-stage partial network (CSPNet) to make computations more efficient. The neck connects features from different scales using path aggregation network (PAN) layers, helping the system understand objects better. The head produces multiple predictions per object during training, thereby improving accuracy. Key features of YOLOv10 include non-maximum suppression (NMS), holistic model design (HMD), and enhanced model capabilities (EMC). Unlike traditional models, YOLOv10 avoids duplicate bounding boxes naturally during training, saving time and reducing computational costs.
Holistic model design (HMD) optimizes YOLOv10's components for both efficiency and accuracy. It includes lightweight classification heads, spatial-channel decoupled downsampling, and rank-guided block design. Enhanced model capabilities (EMCs) use large-kernel convolutions and partial self-attention modules to improve performance without adding much computational cost.
Spatial channel decoupled downsampling makes feature maps smaller in spatial size while increasing their channel depth. The usual method of using 3 × 3 convolutions with a stride of two can be expensive. YOLOv10 improves this by separating spatial and channel operations. Point-wise convolutions adjust the number of channels without changing the spatial size, while depth-wise convolutions reduce the spatial size but keep the channels unchanged. This separation lowers the computational cost and retains more information in the process.
The dataset was created manually from 25 images at different altitudes. It includes a total of 30,000 images, with training sets and validation sets divided into a ratio of 8:2. In total, 24,000 images were used for the training model, and 6,000 images were used for the testing and validated models.
2.6 Rice seed classification using a three-layer CNN
Given the variable field conditions in which rice seeds initiate the process of tillering, the development of a classification model to assess germinated rice becomes imperative. A noteworthy consideration is that a single seed hole can potentially harbor anywhere from one to three individual rice seeds, and the subsequent growth patterns may vary accordingly. To account for these multifaceted phenomena, we have introduced a dataset consisting of three distinct labels, namely: “1 rice plant,” “clusters of rice plants,” and “undefined object.” This comprehensive dataset enables a more nuanced and accurate evaluation of germinated rice under a range of real-world scenarios.
We propose a three-layer CNN for the purpose of quantifying the number of rice entities. The CNN architecture comprises three fundamental types of layers: convolutional layers, pooling layers, and fully connected layers, as depicted in Figure 7. This particular network offers several distinct advantages, rendering it well-suited to specific scenarios. Notably, it excels in terms of simplicity and interpretability, effectively reducing computational complexity and facilitating efficient feature extraction. These attributes align with our objectives, as they facilitate swift model training and effective classification. To ensure compatibility with our input data, the dataset is resized to dimensions of 224 × 224 × 3 pixels, while each convolution layer incorporates a 32 × 32 filter, enabling the generation of feature maps with subsequent max pooling applied at a 2 × 2 scale.
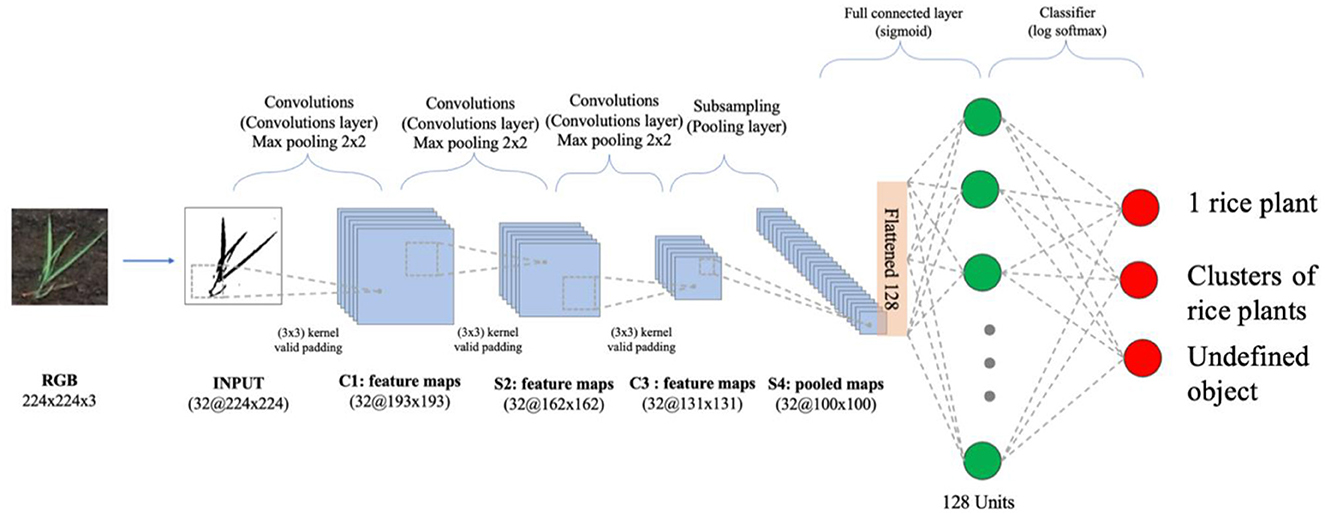
Figure 7. Three-layer CNN architecture.
In the process of dataset creation, a total of 25 images were deliberately selected at random across various height settings. The dataset construction aimed to account for the inherent variability in environmental conditions, particularly the diverse surface roughness scenarios characteristic of rice field settings. As a result, the dataset encompasses a range of challenging conditions, including instances of images exhibiting conditions such as backlit scenes, isolated rice holes, diminutive rice holes, clusters of rice plants, submerged rice plants, the presence of rice dust, and objects that elude straightforward classification, as visually depicted in Figure 8.
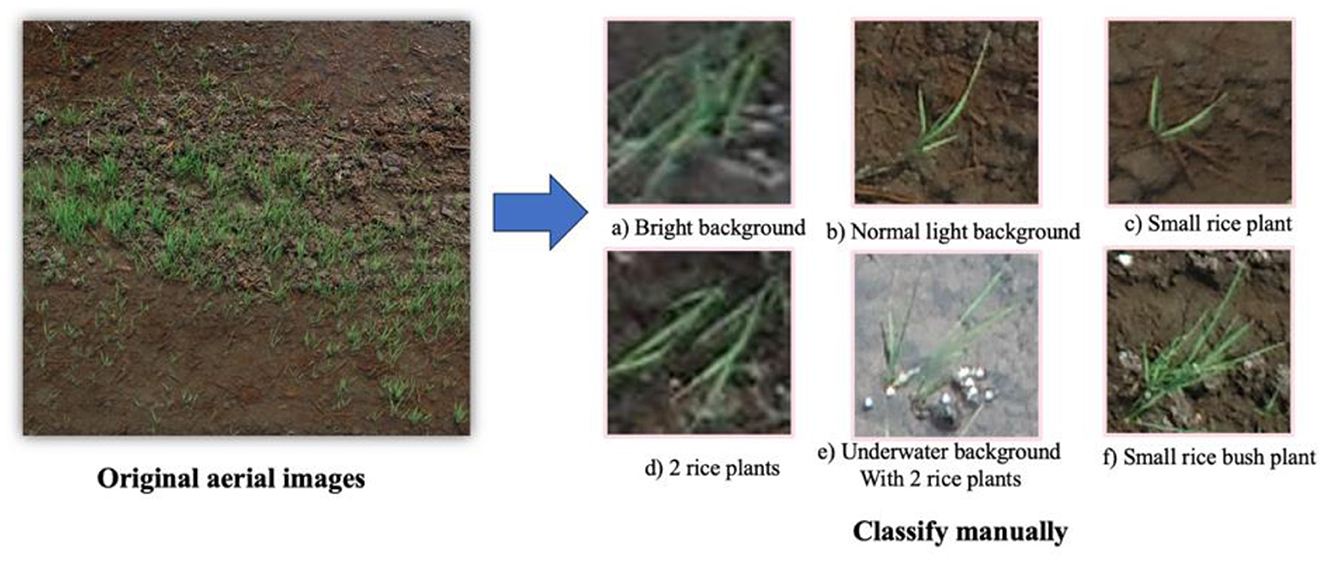
Figure 8. Representative images of rice seedlings captured under various lighting conditions, manually classified into different categories.
For dataset annotation, each image containing rice plants was meticulously labeled manually. Subsequently, these images were standardized to a uniform dimension of 224 × 224 × 3 pixels, and the rice plants within them were categorized into one of three distinct groups, specifically denoted as “1 rice plant,” “clusters of rice plants,” and “undefined object.”
To augment the dataset's diversity and enhance its suitability for comprehensive training, an image enhancement methodology was systematically applied. This method involved blending one original image with another (termed “original image 1” and “original image 2”). Both of these images underwent a series of image transformations, encompassing rotation, blurring, denoising, blending, and further iterations of blurring and rotation, as depicted in Figure 9. These enhancement techniques contributed to a more comprehensive and robust dataset, encompassing a broader spectrum of visual characteristics and complexities for subsequent model training and evaluation.
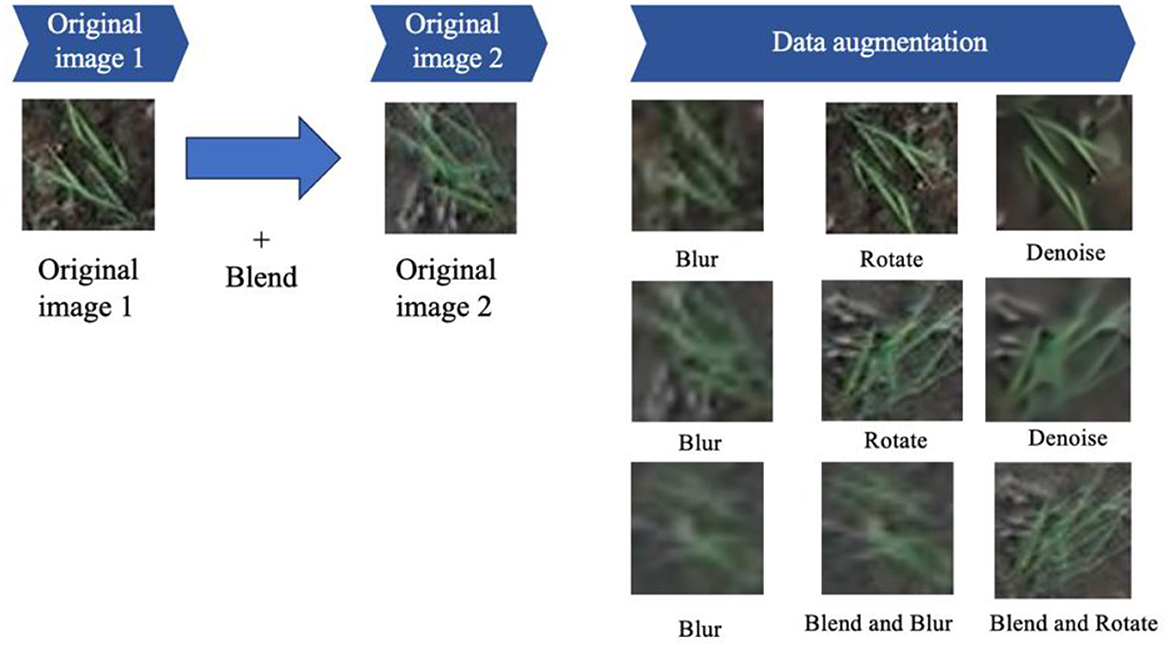
Figure 9. Dataset augmentation.
In the context of the pretrained model, Table 3 provides a comprehensive breakdown of the class distribution within the dataset. Subsequently, the output of the model was subjected to manual testing, employing distinct images selected for the purpose of evaluating the performance across different classes. During this evaluation, it became apparent that the “undefined object” class exhibited suboptimal performance. In pursuit of enhancing accuracy, we augmented the number of images in this class to equal the combined number of images in the other two classes, as outlined in Table 4.
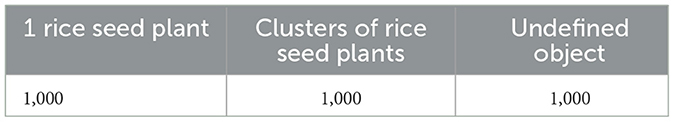
Table 3. Pretrained dataset.

Table 4. Deep learning dataset.
After finishing training, parameter metrics, including accuracy, precision, recall and F1score, as Equations 1–4 were calculated from the confusion matrix to evaluate the model performance as below:
where represents true positive and true negative class, represents false positive and false negative class, and n represents the count.
Python programming language, along with the TensorFlow machine learning platform, was used to structure the proposed method. Figure 10 illustrates the model accuracy and model loss of the proposed method. Using a training duration of 20 epochs for the pretrained model (refer to Figures 10a, b), the results reveal a convergence point of 85.55% for accuracy and 0.3 for loss. However, it is noteworthy to mention that these values do not indicate an optimal performance level for the training dataset. Subsequently, the model loss and model accuracy of the deep learning model are presented in Figure 10c, d. In model loss and model accuracy, the network becomes convergence to ~0 at epoch ~20, reaching an optimal performance level around the 25th epoch. Leveraging pre-trained techniques, the model rapidly converged to an impressive accuracy of 98.8%. This achievement holds significant relevance, not only in terms of model performance but also in the optimization of model training time.
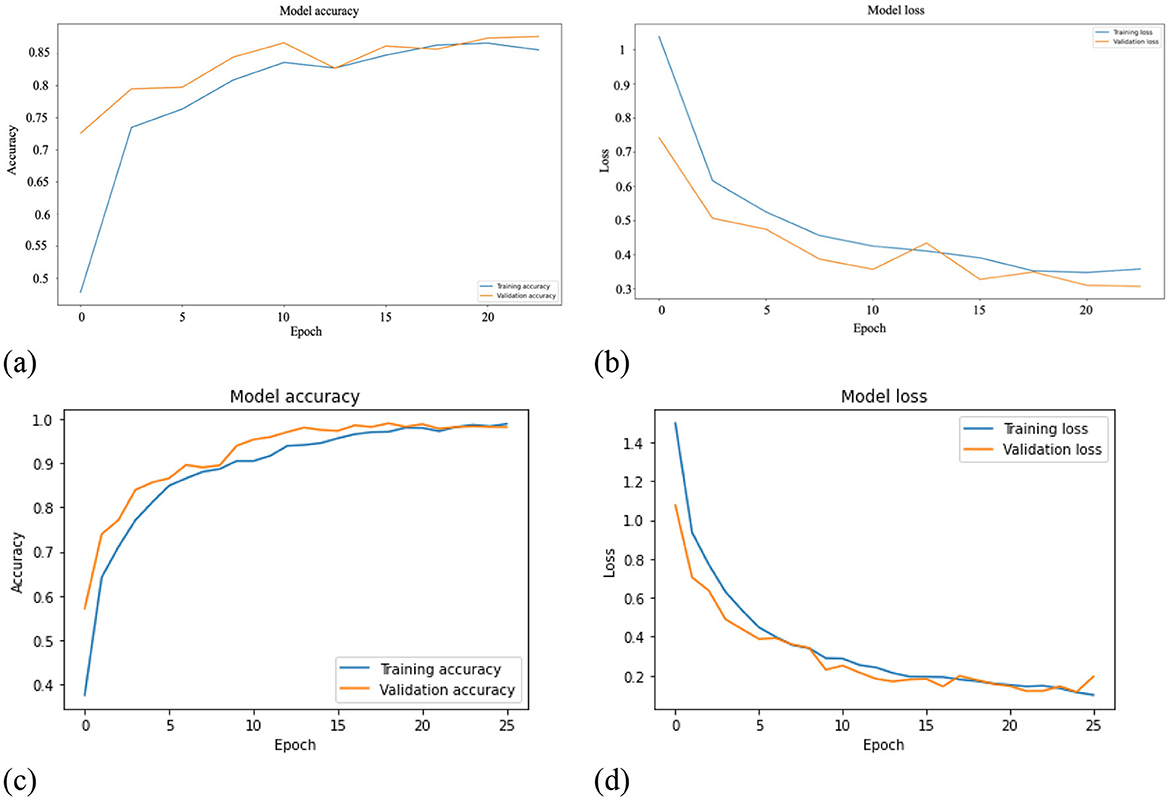
Figure 10. Training and validation error of the three-layer CNN model. (a) mModel accuracy of pretrained-model. (b) Model loss of pretrained-model. (c) Model accuracy of deep learning model. (d) Model loss of deep learning model.
The performance of the model classification of the pretrained model and the deep learning model is assessed using the confusion matrix (Figure 11) and statistical metrics (Table 5). In the case of the pretrained model, the undefined object class is misclassified in 37 out of 130 samples as either “1 rice seed plant” and “clusters of rice seed plant classes.” Additionally, 1 rice seed plant and clusters of rice seed plant classes share mistaken classification with 20 and 22 out of 130 samples, respectively. They also share a similar ratio of the accuracy and precision model, with values around 86.6% and 80.3%, respectively. Turning to the deep learning model, 1 rice seed plant and undefined object classes share the same misclassified samples, with four out of 200, while the remaining class has only wrong three out of 200 samples. In case of statistics, the “clusters of rice seed plant” class has the highest ratio of all parameters, while the “undefined object” class has the highest increase rates in all parameters. Moreover, the average of the deep learning performance parameters has an accuracy of 98.77%, while precision, recall, and F1_score share accuracy at 98.17%. The last three parameters also share a similar increase rate compared to the pretrained model, with a value of ~18.4%.
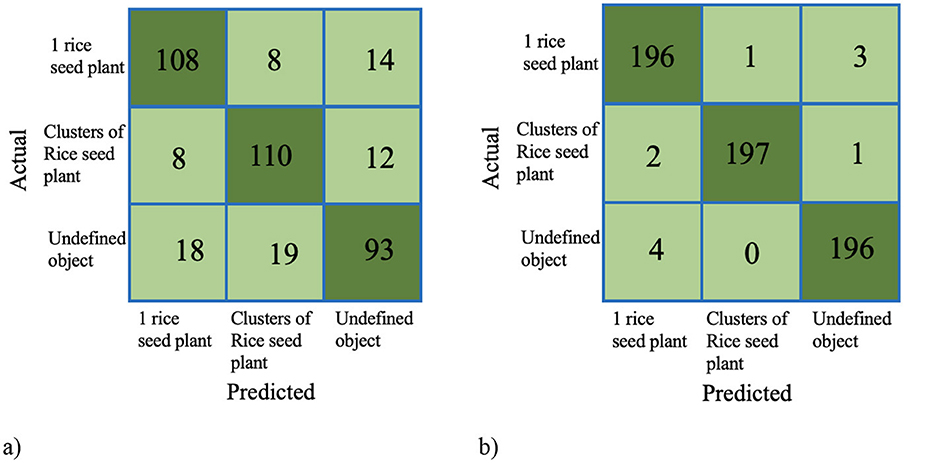
Figure 11. Confusion matrix of the proposed method. (a) Confusion matrix of the pretrained model. (b) Confusion matrix of the deep learning model.
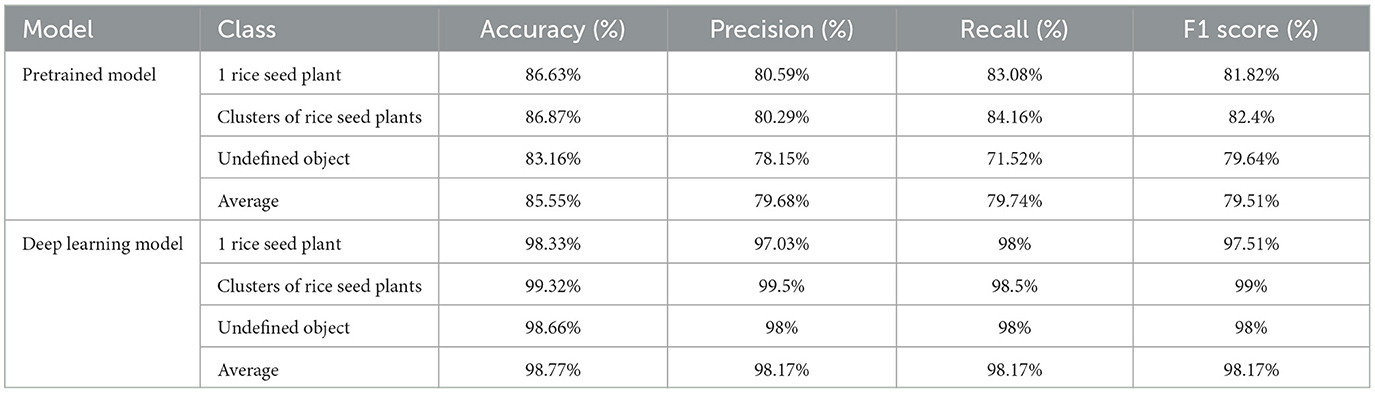
Table 5. Performance metrics of the proposed model evaluated on the test dataset.
3 Results and analysis
3.1 Evaluation of rice seed density using the segmentation threshold method
To assess the efficiency of the proposed methodology, we randomly chose a number of aerial imageries characterized by varying altitudes (4, 6, 8, and 10 m above ground level) and distinct background conditions, including dark soils, underwater, backlit scenarios, as well as typical conditions, as illustrated in Figure 12. The red dot presents the central location of rice plants, while the green and yellow boxes are indicative of individual rice seeds and clusters of rice seeds, respectively. The findings show that, even though the plants' size changes at various heights, the suggested method can estimate the number of seedlings on each aerial image well. However, certain parts of the images present challenges in accurately identifying the exact locations of the rice seeds. This challenge arises particularly when dust or unknown object cover rice plants, or when the rice seeds are very small and traditional techniques might misidentify them as part of the background. Additionally, advanced learning systems might classify these positions as undefined objects, particularly at heights higher than 8 m.
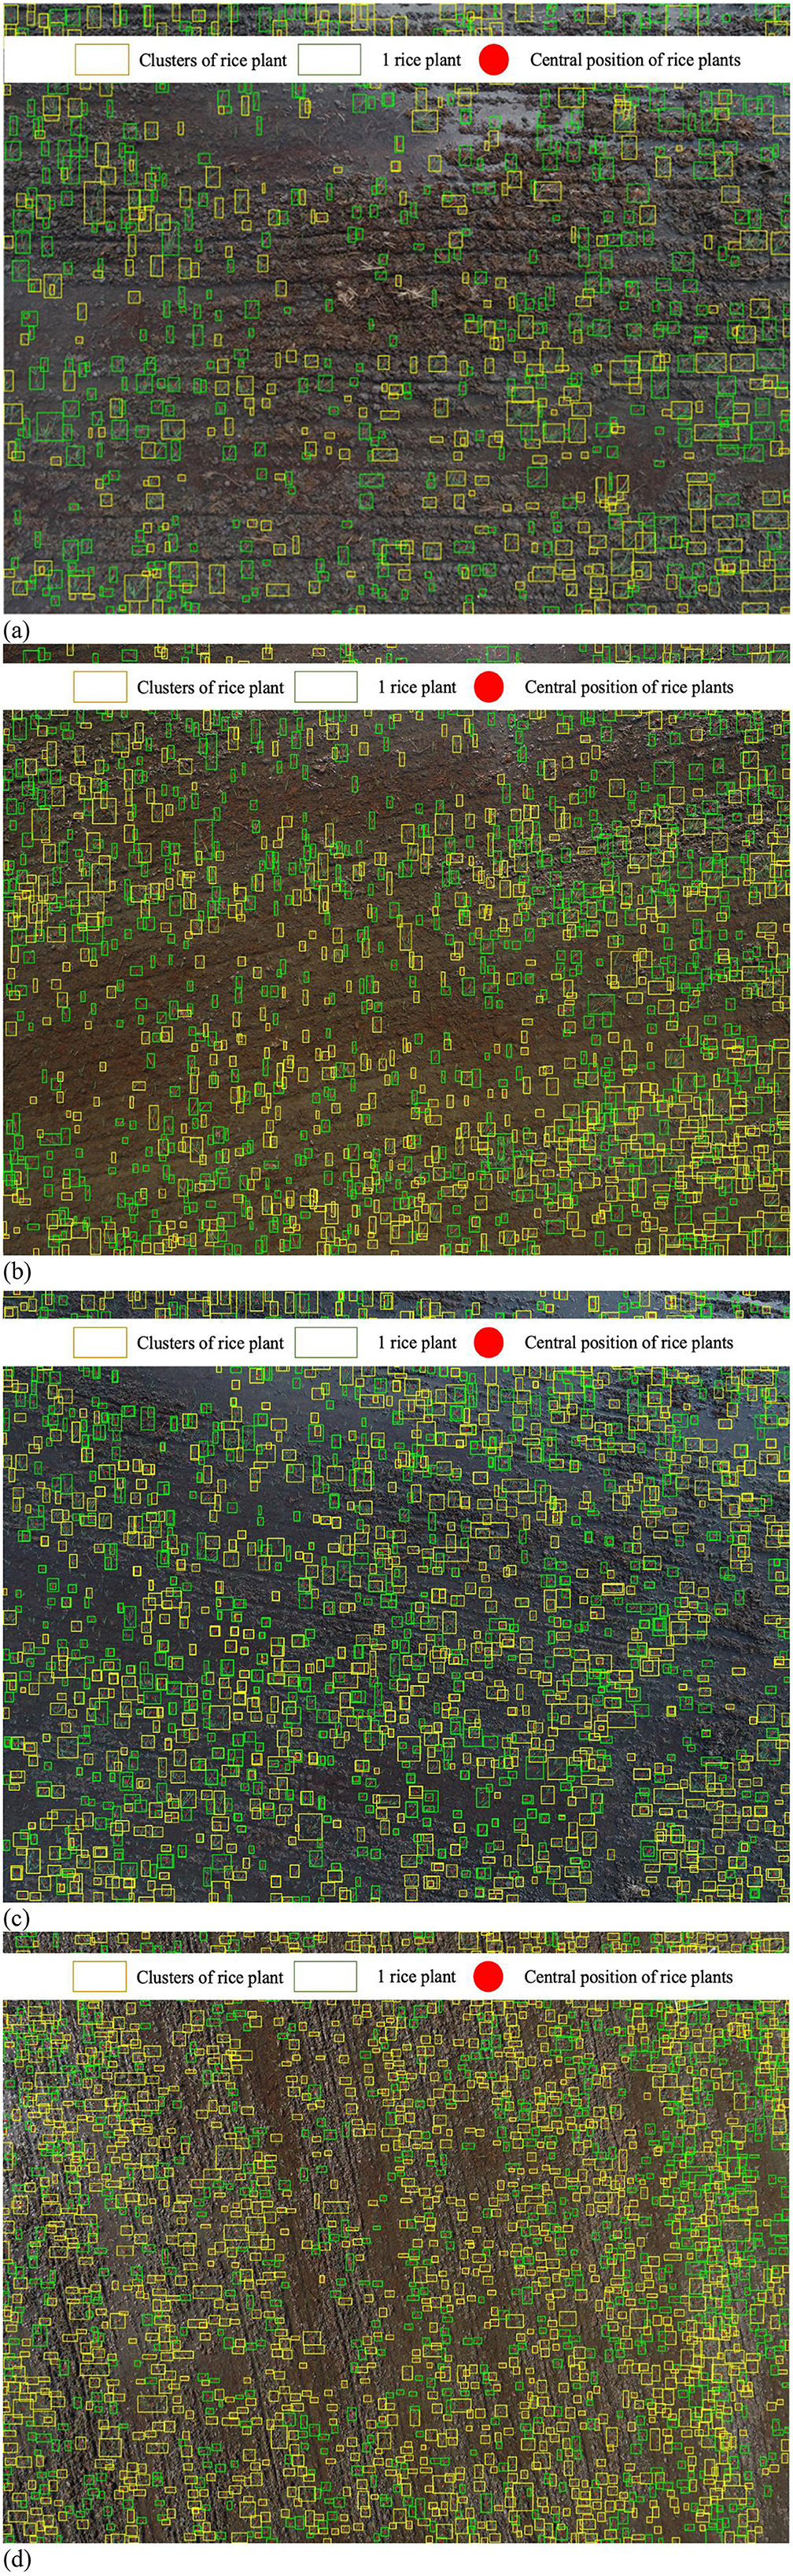
Figure 12. Rice seed detection and evaluation at different heights. (a) At 4-meter height. (b) At 6-m height. (c) At 8-m height. (d) At 10-m height.
3.2. Evaluation of rice seed density using YOLOv10 method
In the context of assessing rice plant density utilizing the YOLOv10 object detection model, the initial procedure entails the incorporation of the image data into the model's processing framework. The outcomes of this process are graphically depicted in Figure 13. Notably, at this early stage of analysis, the model provides accurate spatial localization of rice seed voids within the image. However, it is imperative to note that the model's capability is confined to the determination of void locations, without the capacity to discern whether these voids represent individual rice seeds or clusters of seeds.
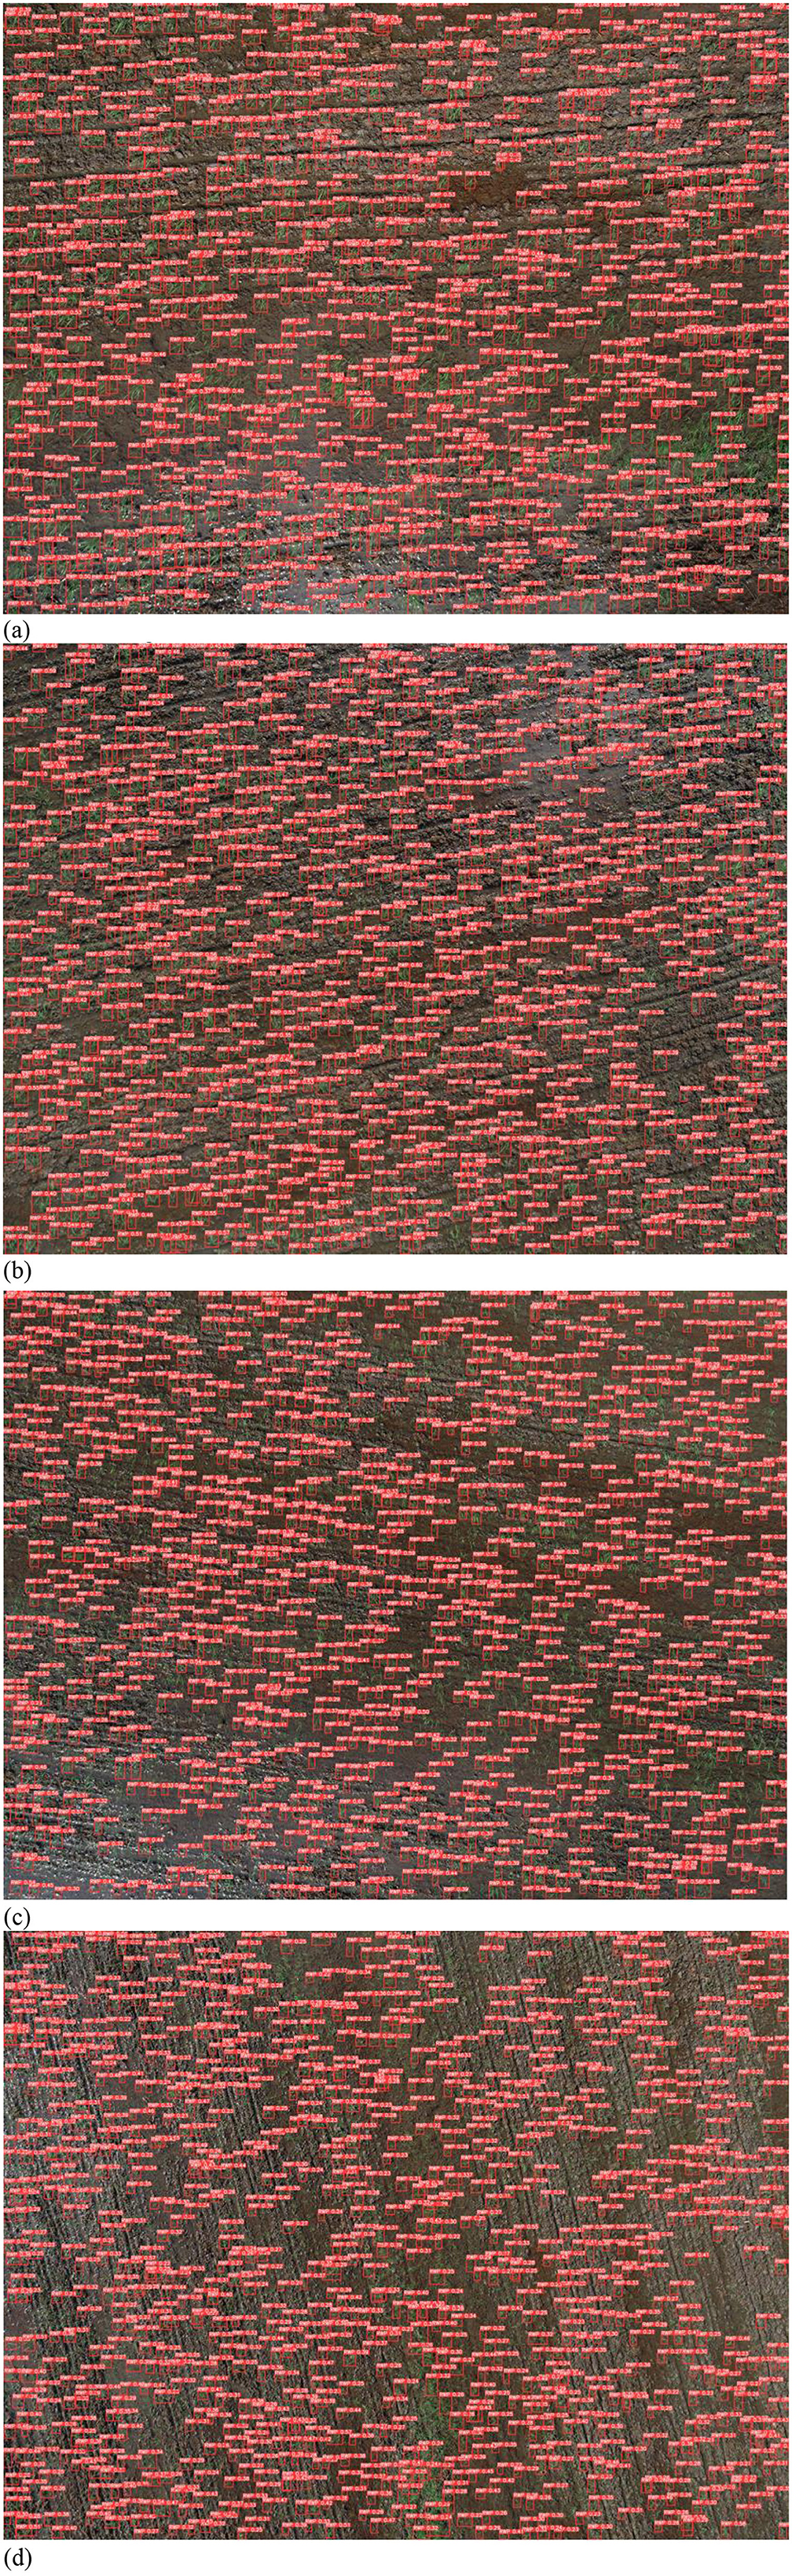
Figure 13. Rice seed position classified by YOLOv10. (a) At 4-m height. (b) At 6-m height. (c) At 8-m height. (d) At 10-m height.
Evidently, YOLOv10 exhibits a high degree of proficiency in accurately detecting the spatial coordinates of individual rice seeds. Nevertheless, when dealing with scenarios involving groups of rice plants where the canopies overlap, the detection results become notably challenged, rendering it incapable of identifying the positions of rice seeds within such densely vegetated areas. It is essential to underscore that this issue persists across varying observation altitudes, thus constituting a recurrent challenge in the application of the YOLOv10 model for rice seed detection.
The output of the YOLOv10 model, denoting the positions of rice seed holes, serves as the primary input for a three-layer CNN model employed to discern both individual instances of rice plants and the aggregation of rice plants within the image, as illustrated in Figure 14. Regrettably, this configuration results in a pronounced misclassification rate for a significant number of objects, which are erroneously categorized as “undefined objects.” This phenomenon underscores the substantial challenges encountered by the CNN model when integrating the information provided by YOLOv10 into its classification process.
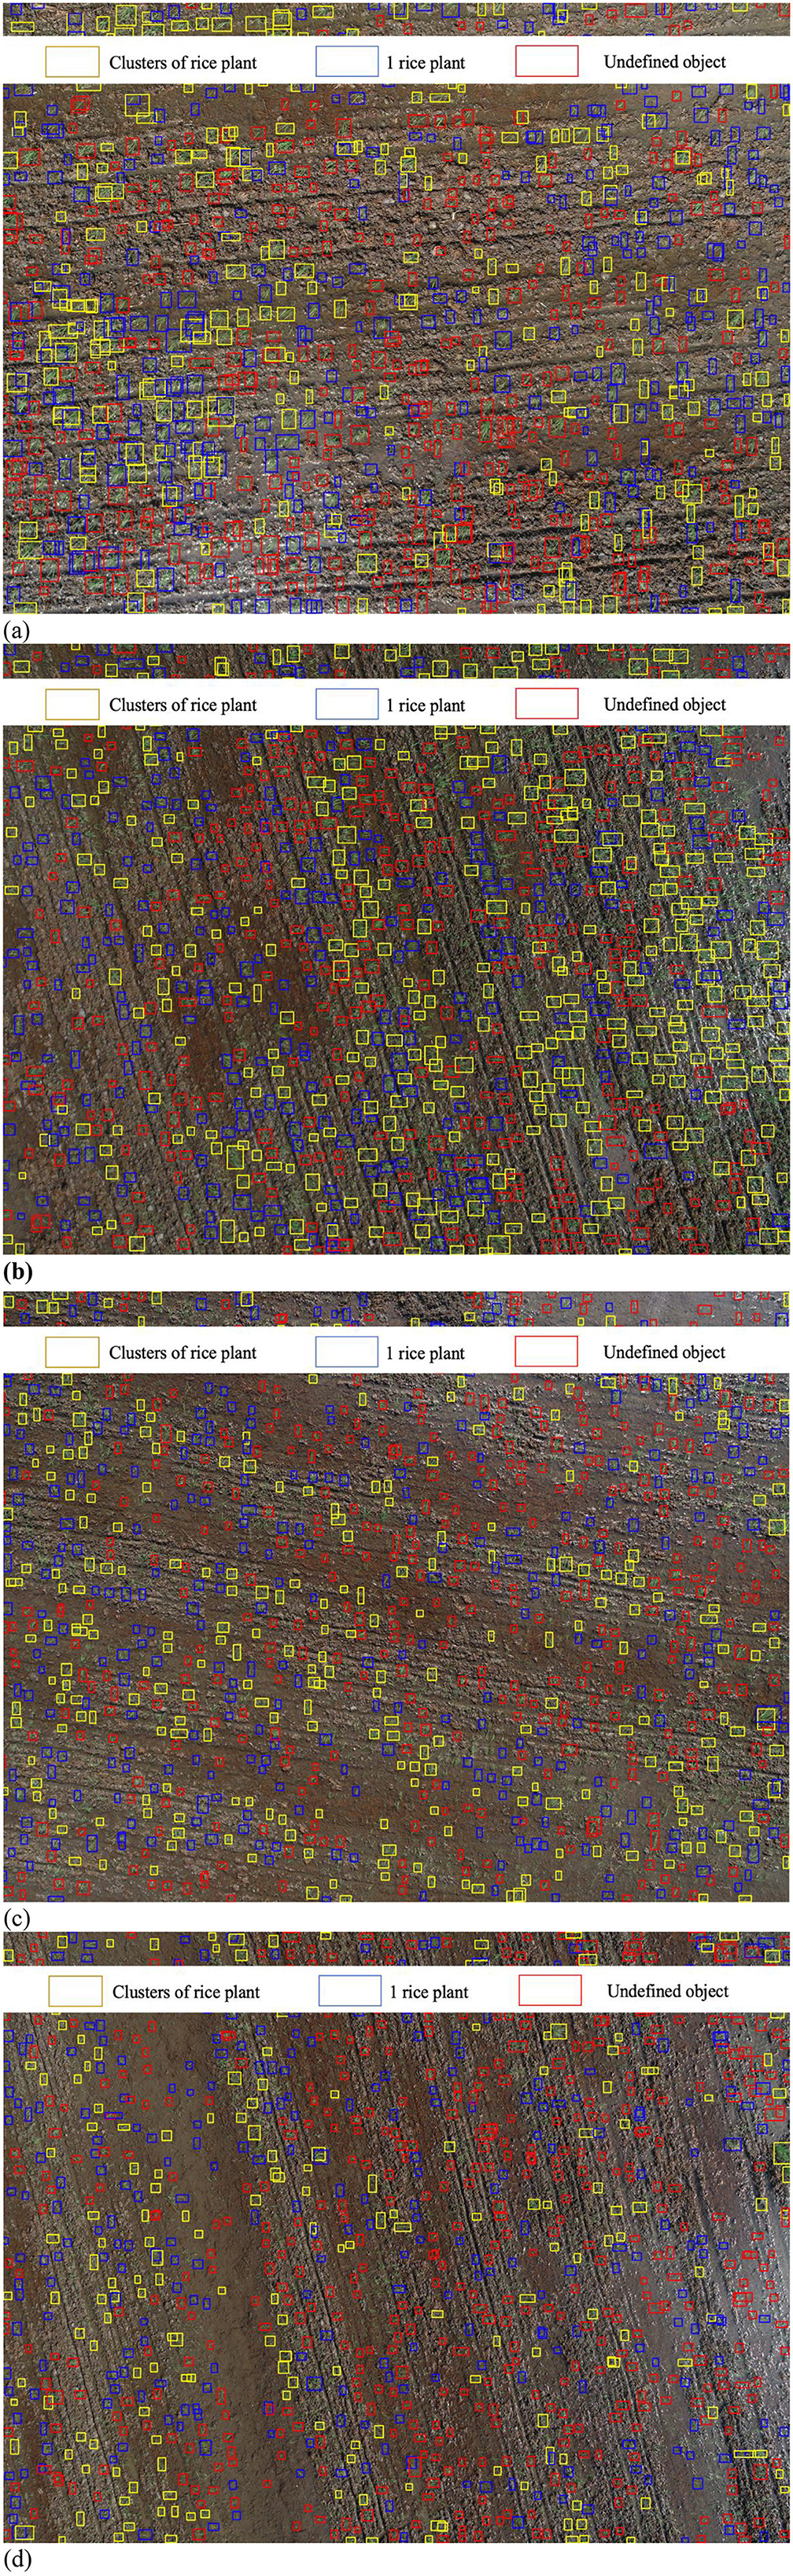
Figure 14. Rice seed density using YOLOv10. (a) At 4-m height. (b) At 6-m height. (c) At 8-m height. (d) At 10-m height.
This phenomenon is attributed to the outcomes generated by the YOLOv10 model. Specifically, this model employs object cropping techniques with aspect ratios of either 1:2 or 1:3 in relation to the original object dimensions. Following this cropping process, the resultant images are resized to a standardized format of 224 × 224 × 3, which serves as the input data for a three-layer CNN. This transformation is intended to condense the salient features within the images (see Figure 15). Consequently, it is our contention that the integration of YOLOv10 and the CNN architecture is not suitable for the accurate classification of single rice plants and clusters of rice plants.
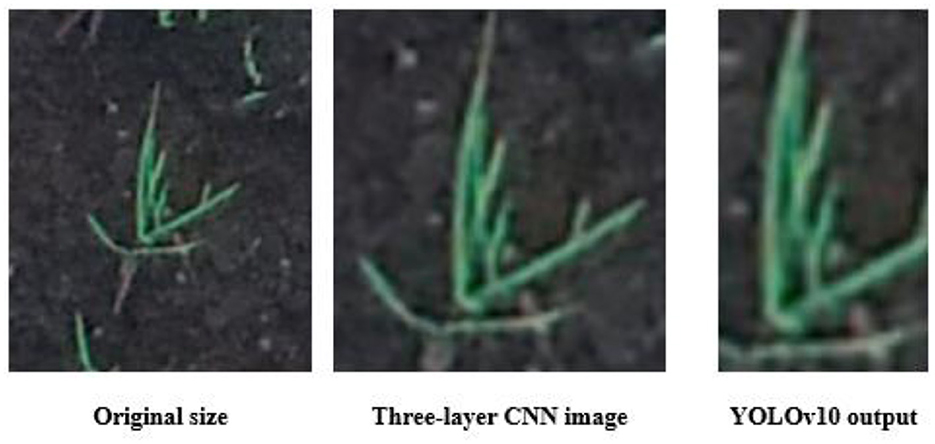
Figure 15. Comparison of crop image sizes using two methods.
4 Discussion
In order to assess the effectiveness of unmanned aerial vehicle (UAV) technology in comparison to conventional methods, our primary focus lies on two key targets: “hill/m2” and “tiller number/m2.” However, due to overlapping canopies resulting from germination, only the parameter “hill/m2” is measured. Multiple images were analyzed at different altitudes to enhance the diversity of data, with each image position varying for each respective altitude. It is important to note that only two methods were applied to the same set of photographs, ensuring a focused and rigorous comparative analysis (as in Table 6).
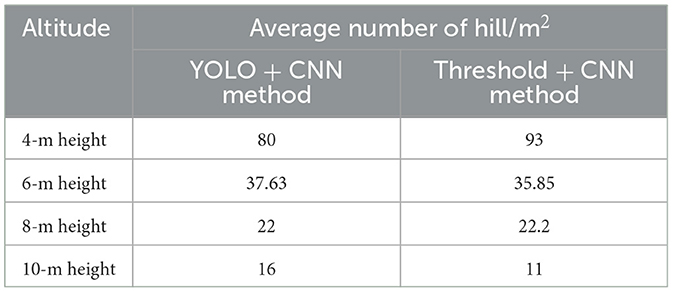
Table 6. Comparison of rice seed density evaluation at different altitudes and methods.
Table 6 distinctly illustrates that the recommended altitude for the evaluation of rice plant density is 6 m. The discrepancies between the UAV method and the traditional approach are minimal, with both the thresholding and YOLOv10 method yielding average values of hill/m2, amounting to 37.62 and 35.85, respectively, as compared to the conventional manual calculation of 39.5 hill/m2, indicating a difference of only 2–4 hill/m2. At the altitudes at 8 and 10 m, the variations in data are less pronounced when compared to manual calculations. This phenomenon can be attributed to the limitations of the two proposed methods in effectively detecting all rice seeds present in each image. In contrast, at a 4-m altitude, errors in data accuracy stem from the segmentation method. The lower altitude results in an apparent enlargement of rice seed size within each photograph, with some being misidentified as noise (in the form of large objects) or leading to instances of overlapping in detection.
The findings of various state-of-art studies on detecting and counting seedling are presented in Table 6 and compared with our achievement in the current research. Wu et al. (2019) count the number of seedling plants to predict the agronomical component of yield using the combination of segmentation and VGG-16. This research used UAV at a 20-m height to collect 40 seedling images, with an accuracy higher than 93%. Moreover, Xu et al. (2023) used a Canon IXUS 1000 HS camera to detect and classify seedling and weed. Fully convolution network (FCN) and U-net model attained a precision of 89.5 and 70.8% on classification achievement. In addition, Yang et al. (2021) and Tseng et al. (2022) used the same UAV Open Dataset setup of UAV flight at a height of 40 m to detect transplanting plants. The detection area measured 8 × 8 m, and various deep learning method were used, achieving an accuracy of 99%−100%. Besides, in a previous study, Bai et al. (2023) improved the accuracy of rice plant counting by proposing a RiceNet network. Compared to other networks, this research reached the lowest value of mean absolute error (MAE) at 8.6 and root mean square error (RMSE) at 11.2. Prior research primarily focused on improving detection methods for transplanting plants, while neglecting to assess the germination rates of rice sowing, as well as the density of plants on the paddy field and flight altitude. As a comparison, our study approached behavior recognition by examining the germination situation of sowing rice on the paddy field and considering flight height. We developed a combination of thresholding and the CNN network to directly process raw aerial photos taken by UAV in the field. Our finding suggests that, with a height of 4–10 m, an altitude of 6 might be the optimal choice for data acquisition.
Our segmentation method demonstrates a notable strength in its impressive accuracy for rice plant identification. However, a key limitation lies in its susceptibility to noise interference, particularly when encountering variations in rice plant size at altitudes exceeding 8 m. In contrast, our thresholding method offers a unique capability to quantify tillering rice seeds and cluster densities, a strength not shared by YOLOv10. Nevertheless, while excelling in this specific quantification, it may present a limitation in broader object detection capabilities compared to YOLOv10. For optimal data acquisition, scheduling UAV flights between 14- and 20-days post-sowing is advisable, aligning with the critical seedling growth stage, representing a strategic strength. However, this recommendation's sensitivity to local climate and rice variety growth patterns could be a limitation requiring adaptive adjustments. At a 6-m altitude, both our thresholding and YOLOv10 methodologies exhibit strength in achieving optimal accuracy for average yield per square meter, showing relatively low variances compared to traditional methods. However, the significant variation in rice density across different altitudes (4, 6, 8, and 10 m) highlights a limitation concerning the consistency of data acquisition based on flight altitude, suggesting 6 m as potentially the most suitable but underscoring altitude's impact. Finally, the efficient performance of both pretrained and training models significantly reduced the time for label identification, a clear strength. However, a current limitation is the dataset's origin within a single crop season, indicating that future research should prioritize incorporating multi-seasonal data to enhance the model's robustness and generalizability.
5 Conclusion
This study introduces a methodology for assessing rice plant density at varying altitudes, employing a camera mounted on an unmanned aerial vehicle (UAV). Manual observations were conducted on the same day in a paddy field exhibiting tillering. The phenomenon observed is categorized into three distinct labels: “1 rice seed plants,” “clusters of rice seed plants,” and “undefined objects.” The UAV operated autonomously with flight altitudes adjusted to 4, 6, 8, and 10 m to capture aerial images. The evaluation of rice plant density entails a two-step process: the detection of rice plant positions and their subsequent classification into labels.
In the initial step, we propose two methods: the segmentation thresholding method and You Only Look Once (YOLOv10). In the subsequent stage, a three-layer CNN is introduced. The segmentation method is equipped with 12 segmentation blocks, tailored to address three primary environmental conditions: backlit, normal, and underwater scenarios, each complemented by three noise removal steps. In the case of YOLOv10, a dataset of 30,000 manually labeled images was compiled across various altitudes. For the CNN model, a pretrained model was developed to evaluate the accuracy of the proposed labels, subsequently enhancing the training model's speed, convergence, accuracy, and efficiency.
Data availability statement
The datasets presented in this study can be found in online repositories. The names of the repository/repositories and accession number(s) can be found at: https://zenodo.org/records/10960906.
Author contributions
TH: Writing – original draft. TN: Data curation, Resources, Validation, Writing – original draft. QN: Data curation, Writing – review & editing. HN: Funding acquisition, Investigation, Methodology, Writing – review & editing. PP: Methodology, Software, Supervision, Writing – review & editing.
Funding
The author(s) declare that no financial support was received for the research and/or publication of this article.
Acknowledgments
We would like to thank Mr. Luong Gia Bao and Mr. Tran Minh Tan last year's students at the College of Engineering, Can Tho University, for helping us generate training and testing datasets as well as validate the model manually.
Conflict of interest
The authors declare that the research was conducted in the absence of any commercial or financial relationships that could be construed as a potential conflict of interest.
Generative AI statement
The author(s) declare that no Gen AI was used in the creation of this manuscript.
Publisher's note
All claims expressed in this article are solely those of the authors and do not necessarily represent those of their affiliated organizations, or those of the publisher, the editors and the reviewers. Any product that may be evaluated in this article, or claim that may be made by its manufacturer, is not guaranteed or endorsed by the publisher.
References
Adeluyi, O., Harris, A., Foster, T., and Clay, G. G. (2022). Exploiting centimetre resolution of drone-mounted sensors for estimating mid-late season above-ground biomass in rice. Eur. J. Agron. 132:126411. doi: 10.1016/j.eja.2021.126411
Bai, X., Liu, P., Cao, Z., Lu, H., Xiong, H., Yang, A., et al. (2023). Rice plant counting, locating, and sizing method based on high-throughput UAV RGB images. Plant Phenomics 5:20. doi: 10.34133/plantphenomics
Bezabih, Y. A., Salau, A. O., and Abuhayi, B. M. (2023). CPD-CCNN: classification of pepper disease using a concatenation of convolutional neural network models. Sci. Rep. 13:15581. doi: 10.1038/s41598-023-42843-2
Feng, Q., Liu, J., and Gong, J. (2015). UAV remote sensing for urban vegetation mapping using random forest and texture analysis. Remote Sens. 7, 1074–1094. doi: 10.3390/rs70101074
Gao, X., Zan, X., Yang, S., Zhang, R., Chen, S., Zhang, X., et al. (2023). Maize seedling information extraction from UAV images based on semi-automatic sample generation and Mask R-CNN model. Eur. J. Agron. 14:126845. doi: 10.1016/j.eja.2023.126845
García-Martínez, H., Flores-Magdaleno, H., Khalil-Gardezi, A., Ascencio-Hernández, R., Tijerina-Chávez, L., Vázquez-Peña, M. A., et al. (2020). Digital count of corn plants using images taken by unmanned aerial vehicles and cross-correlation of templates. Agronomy 10:469. doi: 10.3390/agronomy10040469
Guo, Y., Li, S., Zhang, Z., Li, Y., Hu, Z., Xin, D., et al. (2021). Automatic and accurate calculation of rice seed setting rate based on image segmentation and deep learning. Front. Plant Sci. 12:770916. doi: 10.3389/fpls.2021.770916
Jung, M., Song, J. S., and Shin, A. Y. (2023). Construction of deep learning-based disease detection model in plants. Sci. Rep. 13:7331. doi: 10.1038/s41598-023-34549-2
Kellner, J. R., Armston, J., Birrer, M., Cushman, K., Duncanson, L., Eck, C., et al. (2019). New opportunities for forest remote sensing through ultra-high-density drone LiDAR. Surv. Geophys. 40, 959–977. doi: 10.1007/s10712-019-09529-9
Li, B., Xu, X., Han, J., Zhang, L., Bian, C., Jin, L., et al. (2019). The estimation of crop emergence in potatoes by UAV RGB imagery. Plant Methods 15, 1–13. doi: 10.1186/s13007-019-0399-7
Liang, W. J., Zhang, H., and Zhang, G. F. (2019). Rice blast disease recognition using a deep convolutional neural network. Sci. Rep. 9:2869. doi: 10.1038/s41598-019-38966-0
Liu, S., Baret, F., Andrieu, B., Burger, P., and Hemmerlé, M. (2017). Estimation of wheat plant density at early stages using high resolution imagery. Front. Plant Sci. 8:739. doi: 10.3389/fpls.2017.00739
Liu, T., Yang, T., Li, C., Li, R., Wu, W., Zhong, X., et al. (2018). A method to calculate the number of wheat seedlings in the 1st to the 3rd leaf growth stages. Plant Methods 14, 1–14. doi: 10.1186/s13007-018-0369-5
Liu, Y., Feng, H., Fan, Y., Yue, J., Yang, F., Fan, J., et al. (2025). Utilizing UAV-based hyperspectral remote sensing combined with various agronomic traits to monitor potato growth and estimate yield. Comput. Electron. Agric. 231:109984. doi: 10.1016/j.compag.2025.109984
Ma, J., Li, Y., Liu, H., Du, K., Zheng, F., Wu, Y., et al. (2020). Improving segmentation accuracy for ears of winter wheat at flowering stage by semantic segmentation. Comput. Electron. Agric. 176:105662. doi: 10.1016/j.compag.2020.105662
Ma, X., Deng, X., Qi, L., Jiang, Y., Li, H., and Wang, Y. (2019). Fully convolutional network for rice seedling and weed image segmentation at the seedling stage in paddy fields. PLoS ONE 14:e0215676. doi: 10.1371/journal.pone.0215676
Oard, J., Cohn, A. M., Linscombe, S., Gealy, D., and Gravois, K. (2020). Field evaluation of seed production, shattering, and dormancy in hybrid populations of transgenic rice (Oryza sativa) and the weed, red rice (Oryza sativa). Plant Sci. 157, 13–22. doi: 10.1016/S0168-9452(00)00245-4
Qi, H., Wu, Z., Zhang, L., Li, J., Zhou, J., Jun, Z., et al. (2021). Monitoring of peanut leaves chlorophyll content based on drone-based multispectral image feature extraction. Comput. Electron. Agric. 187:106292. doi: 10.1016/j.compag.2021.106292
Sankey, T. T., McVay, J., Swetnam, T. L., McClaran, M. P., Heilman, P., and Nichols, M. (2018). UAV hyperspectral and LiDAR data and their fusion for arid and semi-arid land vegetation monitoring. Remote Sens. Ecol. Conserv. 4, 20–33. doi: 10.1002/rse2.44
Su, J., Yi, D., Coombes, M., Liu, C., Zhai, X., McDonald-Maier, K., et al. (2022). Spectral analysis and mapping of blackgrass weed by leveraging machine learning and UAV multispectral imagery. Comput. Electron. Agric. 192:106621. doi: 10.1016/j.compag.2021.106621
Trepekli, K., and Friborg, T. (2021). Deriving aerodynamic roughness length at ultra-high resolution in agricultural areas using UAV-borne LiDAR. Remote Sens. 13:3538. doi: 10.3390/rs13173538
Tseng, H. H., Yang, M. D., Saminathan, R., Hsu, Y. C., Yang, C. Y., and Wu, D. H. (2022). Rice seedling detection in UAV images using transfer learning and machine learning. Remote Sens. 14:2837. doi: 10.3390/rs14122837
Velumani, K., Lopez-Lozano, R., Madec, S., Guo, W., Gillet, J., Comar, A., et al. (2021). Estimates of maize plant density from UAV RGB images using faster-RCNN detection model: impact of the spatial resolution. Plant Phenomics 2012:9824843. doi: 10.34133/2021/9824843
Wang, A., Chen, H., Liu, L., Chen, K., Lin, Z., Han, J., et al. (2024). YOLOv10: Real-time end-to-end object detection. arXiv [Preprint]. arxiv:2405.14458. doi: 10.48550/arxiv.2405.14458
Wu, J., Yang, G., Yang, X., Xu, B., Han, L., and Zhu, Y. (2019). Automatic counting of in situ rice seedlings from UAV images based on a deep fully convolutional neural network. Remote Sens. 11:691. doi: 10.3390/rs11060691
Xu, X., Wang, L., Liang, X., Zhou, L., Chen, Y., Feng, P., et al. (2023). Maize seedling leaf counting based on semi-supervised learning and UAV RGB images. Sustainability 15:9583. doi: 10.3390/su15129583
Yang, L., Yang, F., Yue, J., Zhu, W., Fan, Y., Fan, J., et al. (2024). Crop canopy volume weighted by color parameters from UAV-based RGB imagery to estimate above-ground biomass of potatoes. Comput. Electron. Agric. 227:109678. doi: 10.1016/j.compag.2024.109678
Yang, M., Tseng, H., Hsu, Y., Yang, C., Lai, M., and Wu, D. (2021). A UAV open dataset of rice paddies for deep learning practice. Remote Sens. 13:1358. doi: 10.3390/rs13071358
Yoshida, S. (1981). Fundamentals of Rice Crop Science. International Rice Research Institute. Available online at: http://books.irri.org/9711040522_content.pdf (Accessed June 26, 2025).
Yu, R., Luo, Y., Zhou, Q., Zhang, X., Wu, D., and Ren, L. L. (2021). Early detection of pine wilt disease using deep learning algorithms and UAV-based multispectral imagery. For. Ecol. Manage. 497:119493. doi: 10.1016/j.foreco.2021.119493
Zhang, H., Li, W., Wang, G., Song, F., Wen, Z., Zhang, H., et al. (2025a). Predicting stomatal conductance of chili peppers using TPE-optimized LightGBM and SHAP feature analysis based on UAVs' hyperspectral, thermal infrared imagery, and meteorological data. Comput. Electron. Agric. 231:110036. doi: 10.1016/j.compag.2025.110036
Zhang, H., Wang, G., Song, F., Wen, Z., Li, W., Tong, L., et al. (2025b). Improving chili pepper LAI prediction with TPE-2BVIs and UAV hyperspectral imagery. Comput. Electron. Agric. 235:110368. doi: 10.1016/j.compag.2025.110368
Zhang, T., Li, K., and Chen, X. (2023). Aphid cluster recognition and detection in the wild using deep learning models. Sci. Rep. 13:13410. doi: 10.1038/s41598-023-38633-5
Zhao, B., Zhang, J., Yang, C., Zhou, G., Ding, Y., Shi, Y., et al. (2018). Rapeseed seedling stand counting and seeding performance evaluation at two early growth stages based on unmanned aerial vehicle imagery. Front. Plant Sci. 9:1362. doi: 10.3389/fpls.2018.01362
Keywords: UAV, multiple flight altitudes, rice plant density, detection and classification, precision agriculture
Citation: Hieu Luu T, Nguyen TT, Ngo QH, Nguyen HC and Phuc PNK (2025) UAV-based estimation of post-sowing rice plant density using RGB imagery and deep learning across multiple altitudes. Front. Comput. Sci. 7:1551326. doi: 10.3389/fcomp.2025.1551326
Received: 25 December 2024; Accepted: 16 June 2025;
Published: 11 July 2025.
Edited by:
Syed Agha Hassnain Mohsan, Zhejiang University, ChinaReviewed by:
Milad Eskandari, University of Guelph, CanadaYang Liu, China Agricultural University, China
Copyright © 2025 Hieu Luu, Nguyen, Ngo, Nguyen and Phuc. This is an open-access article distributed under the terms of the Creative Commons Attribution License (CC BY). The use, distribution or reproduction in other forums is permitted, provided the original author(s) and the copyright owner(s) are credited and that the original publication in this journal is cited, in accordance with accepted academic practice. No use, distribution or reproduction is permitted which does not comply with these terms.
*Correspondence: Quang Hieu Ngo, bnFoaWV1QGN0dS5lZHUudm4=