 Peter Neigel
 Andrew Vargo1
- 1Graduate School of Informatics, Osaka Metropolitan University, Sakai, Japan
- 2School of Computer Science and Engineering, University of New South Wales, Sydney, NSW, Australia
Introduction: In theory, wearable physiological sensing devices offer an opportunity for institutions to monitor and manage the health and well-being of a group of people. For instance, schools or universities could leverage these devices to track rising stress levels or detect signs of illness among students. Advances in sensing accuracy and utility design in wearables might make this feasible; however, real-world adoption faces challenges, as users often fail to wear or use these devices consistently and correctly. Additionally, institutional monitoring raises privacy concerns.
Methods: In this study, we analyze real-world data from a cohort of 103 Japanese university students to identify periods of cyclical stress while ensuring individual privacy through aggregation. We identify potential stress patterns by observing elevated waking heart rate (HR) and maximum waking HR, supported by related metrics such as sleep HR, sleep heart rate variability (HRV), activity patterns, and sleep phases.
Results: The physiological changes align with significant academic and societal events, indicating a strong link to stress.
Discussion: Our findings demonstrate the potential of consumer wearables to detect collective changes in stress biomarkers within a cohort using in-the-wild data, i.e., data that is noisy and has gaps. Furthermore, we explore how universities could implement such monitoring in practice, highlighting both the potential benefits and challenges of real-world application.
1 Introduction
Stress describes a combination of physiological phenomena and responses to a stressor (Fink, 2009). These stressors can be acute, such as a presentation in front of a large audience or a life-threatening situation, or chronic, such as a stressful everyday job or excessive worrying (Collier et al., 2017). Stress and stressful situations can occur in regular cycles, such as yearly health checkups. In this work, we use data from university students who wore smart rings in the wild to identify cyclical stress typical for different periods of the academic year. This analysis takes place without adjusting for any other individual source of personal, work-related, or other non-academic stress, meaning that classification is possible even with significant noise.
The fight-or-flight hypothesis suggests that physiological changes in response to stressors have the purpose of mobilizing available energy resources, enhancing an individual's ability to either confront or escape a threat. While this response is beneficial for short-term stressors, the demands of modern work life frequently trigger it in many people on a routine basis. When stress becomes regular and chronic, it can have serious effects on people's mental well-being, as well as causing actual physiological harm to the body. It is estimated that 80% of people experience stress at work (Salleh, 2008) and roughly half of the work-related illnesses are related to stress (European Comission, 2004). The effects of permanent stress include worsened sleep (Kim and Dimsdale, 2007), anxiety and depression (Richter-Levin and Xu, 2018), headaches (Stubberud et al., 2021), weight gain (Scott et al., 2012), digestive problems (Madison and Kiecolt-Glaser, 2019), problems with memory and focus (Klier and Buratto, 2020), muscle tension (Zieliński et al., 2021), and pain, and can, in severe cases, lead to heart disease, heart attacks (Rozanski et al., 1999), high blood pressure (Laitinen et al., 1999), and strokes (Reddin et al., 2022). When the body perceives a situation as threatening, the balance of activity in the ANS shifts away from the Parasympathetic Nervous System (PNS) toward the Sympathetic Nervous System (SNS), dilating pupils, increasing Heart Rate (HR) and forcing vasoconstriction. Heart Rate Variability (HRV), which is the fluctuation of the length between heartbeats, is a strong indicator of ANS balance (Shaffer and Ginsberg, 2017), self-regulation (Laborde et al., 2017) and all-cause mortality (Jarczok et al., 2022). It is usually calculated from the tachogram derived from Electrocardiogram (ECG) signals by analyzing QRS-complexes and obtaining the variance in the distance between two R-R peaks. The LF/HF power ratio in the frequency domain analysis of HRV is especially indicative of ANS activity. Since these measurements require precise medical-grade equipment, comprehensive detection of these physiological markers has not been obtainable in the wild for most of the past. However, the recent ubiquity of wearable health devices (Hood and Price, 2023) such as smart rings or watches, with their capability of unobtrusively measuring physiological data like HR, HRV, body temperature, breathing rate, etc., over prolonged periods of time, makes this attainable.
Large public-oriented institutions, such as universities, could benefit from deploying wearables (Laborde et al., 2023) but face the issues of usage enforcement, data organization, and privacy concerns (Vargo et al., 2023). Privacy concerns, in particular, are a barrier to using these devices (González Ramírez et al., 2023), calling for new methods that allow for effective passive data acquisition methods that do not burden or endanger individual users.
In this work, we analyze the physiological data obtained via a smart ring on a cohort of Japanese university students for group-wide changes in stress biomarkers. The usage of the device was not enforced or guided, resulting in natural data that is noisy and has gaps. We find heightened waking HR and maximum waking HR during exams, New Year's, and spring break when the traditional job hunting season takes place in Japan. Sleep HR, sleep HRV, activity patterns, and sleep phases further substantiate the indication of stress-related effects.
The results of this study are promising for a number of reasons. First, they indicate that identifying stressful periods in a cohort in the wild is possible, which means that the results could be applied in education and workplace settings for managing cyclical stress. This could be especially important for identifying and designing interventions where participants cannot self-report stress. In addition, the results represent an important opportunity for the HCI community to build information interfaces that allow users to better understand and prepare for cyclical stress.
The contribution of this work is to demonstrate the feasibility of detecting group-wide changes in stress-related biomarkers using data from a cohort wearing wearable health trackers without compromising individual privacy or imposing restrictions on device usage.
2 Related work
The significant research corpus on stress detection can be divided into laboratory settings and in-the-wild settings. In both settings, physiological and contextual data and stress information are collected, which is then used to build models for predicting stress, usually for the individual. In laboratory settings, both precise medical equipment (Prinsloo et al., 2011; Kirschbaum et al., 1996) or wearable devices (Wijsman et al., 2011; Abouelenien et al., 2016; Mozos et al., 2017; Setz et al., 2010; Umematsu et al., 2019) can be used for the former and controlled stressors for the latter (Prinsloo et al., 2011; Kirschbaum et al., 1996; Abouelenien et al., 2016; Wijsman et al., 2011; Mozos et al., 2017; Setz et al., 2010; Umematsu et al., 2019). In in-the-wild settings, wearable health devices have been used effectively to gather physiological data. Here, self-reported stress is often used as ground truth for stress (Bogomolov et al., 2014; Booth et al., 2022; Järvelin-Pasanen et al., 2018; Vrijkotte et al., 2000; Vildjiounaite et al., 2019; Gjoreski et al., 2017; Sano et al., 2018; Gjoreski et al., 2015). Alternatively, contextual information, e.g., events such as exams, can be used to infer stress levels (Bauer and Lukowicz, 2012; Bloomfield et al., 2024; Pakhomov et al., 2020). Can et al. (2020) and Gjoreski et al. (2017) showed that incorporating data from laboratory-controlled stressors into the models can aid in stress prediction in real-life contexts. Kazdagli et al. (2024) take an approach similar to ours, but look only at exams instead of the whole year and group participants according to their scores on anxiety assessments.
These research methods (a) typically predict individuals' stress and (b) rely mostly on self-reported or in-situ induced (controlled) stress. A limitation of these studies is their utility for institutions in real-world environments. Our work aims to address this limitation by focusing on the collective stress levels of a cohort rather than predicting individual stress while not requiring explicit stress surveys or stress induction such as in the works above. This shift in focus is significant as it highlights the potential of stress monitoring in institutional settings, such as schools. By leveraging real-world data from a cohort of 103 Japanese university students, we demonstrate the capability of off-the-shelf wearable devices to monitor group stress levels despite the presence of noisy and incomplete data. Our methodology involves passive sensing and using the structured academic calendar, eliminating the need for self-reported stress measures and reducing the burden on participants. We maintained user privacy by not exposing any daily activities and ensuring that the data analysts were completely unknowing of any identifiers of the participants, such as gender or university grade. Our approach detects group-wide changes within a rigid curriculum instead of predicting individual participants' episodes of stress, which to the best of our knowledge is a unique approach.
In the field of policy making, (Laborde et al. 2023), (2022) proposed a range of strategies for assessment, intervention and evaluation across domains such as public health, occupational settings, education, mental healthcare, and geriatric care. While their policy recommendations align closely with ours, we advance their work by presenting the first experimental data supporting the feasibility of this approach using current wearable technology under significant noise. Furthermore, we expand on their framework by addressing additional implementation challenges in the discussion section.
3 Data collection
Starting in late 2021, volunteers from a Japanese university joined an in-the-wild experiment wearing the Oura Ring,1 a commercial finger-worn sleep and fitness tracker. The Oura ring was chosen due to its unobtrusive form factor (especially the lack of a screen), long battery life, and sleep-stage tracking abilities. The participants were graduate and undergraduate students taking classes affiliated with the university's engineering school and were recruited via an open call. The dissemination of the call was carried out through student mailing lists, the engineering school's Slack channel, and during lectures. Participants were recruited from among university students who agreed to wear the ring; no additional eligibility criteria were specified. There was no remuneration for wearing the rings, but participants could be remunerated for participating in shorter studies for which recruitment was done separately. The main incentive for participants was the free use of a wearable and access to their personal data. In return for this, the participants signed agreements that their anonymized data could be used for research purposes. All participants agreed and gave informed consent. Participants could also drop out from the study any time if they desired to do so. Participants who joined after the beginning of 2022 received the updated generation 3 rings instead of generation 2 rings. After obtaining their rings, students attended an orientation session on the features and capabilities of the Oura Ring and were informed about what data the investigators would collect. In particular, the investigators emphasized that this project is an in-the-wild study and that participants were free to use the rings as they wished, including ceasing the use of the ring with no penalty. Approval of all ethical and experimental procedures and protocols was granted by the ethics committees of the Graduate School of Engineering, Osaka Prefecture University, and the Graduate School of Informatics, Osaka Metropolitan University.
3.1 Choice of wearable
There is a wide range of smart health devices available to measure physiological signals related to stress (Thapliyal et al., 2017). An important factor behind the choice to use the Oura Ring was its form-factor. The Oura Ring is relatively small and unobtrusive, meaning that its presence would not cause a distraction for most participants. Additionally, it provides measurement quality comparable to medical-grade devices for sleep HR and HRV (Cao et al., 2022; Miller et al., 2022; Kinnunen et al., 2020; Lu et al., 2025) and sleep staging (Ong et al., 2024; Svensson et al., 2024). Another deciding factor was the good battery life, which requires participants to charge it only once every four to five days. One full charging cycle takes about 2 hours. Participants have an accompanying smartphone application where they can see their data. This application needs to be opened once every 4-5 days so that the ring can connect to the application, send the gathered data to the servers, and clear its cache. If the application is not opened for longer periods, the ring can overwrite old data in its cache, rendering previous unsynced data unusable.
3.2 How the oura ring collects data
The Oura ring automatically collects a range of physiological data during the day using red, green, and infrared LEDs, as well as an NTC (Negative Temperature Coefficient) temperature sensor and a 3D accelerometer. The LEDs measure blood vessel dilation and contraction and blood oxygen saturation (SpO2) using photoplethysmography, sampling 250 times per second with “99.9% reliability compared to a medical-grade electrocardiogram according to Oura (2020). From this measurement, HR, HRV, and breathing rate are calculated. While the generation 2 rings measure HR and HRV only during sleep, generation 3 rings also measure daytime values. According to Oura (passive) daytime HR measurement is carried out every 5 min (Oura, 2022a), although in practice we find the measuring interval to show fluctuations based on movement (Oura, 2022b) and also on the chosen ring size (Neigel et al., 2023). Additionally, generation 3 users can use the smartphone application to get a live measurement of their HR carried out anytime as well as starting workout or meditation sessions, during which the sampling rate for HR is increased. The NTC temperature sensor measures skin temperature every minute, but the temperature data is only published in the form of the deviation of the average temperature during the last night compared to a long-term average (Oura, 2021). The 3D accelerometer tracks movements and is used in classifying periods of high/medium/low activity, such as walking. An overview of which data is available for how many participants can be seen in Table 1.
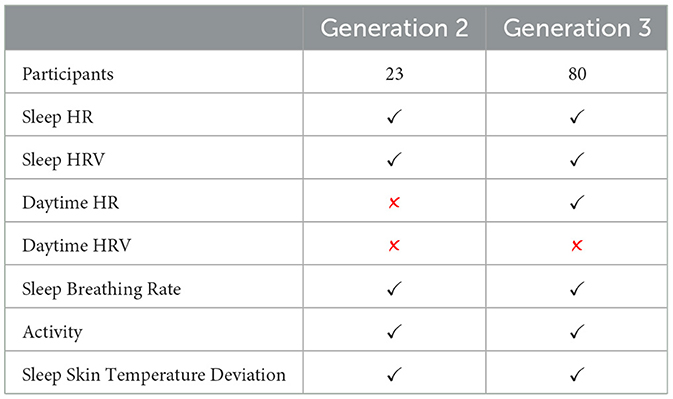
Table 1. Oura ring data by generation and percentage of participants.
3.3 Participants considered in this work
Due to the participant onboarding described previously, a total of 151 users wore the Oura ring for up to 28 months. The first and last dates considered for analysis are the 30th July 2021 and the 21st November 2023, respectively. An overview of the usage of the ring by the participants over that time frame can be seen in Figure 1. Here, the blue marker denotes the availability of either a daily activity or daily sleep summary for that user and day, indicating usage on that day or the previous night. Since some of the participants are university staff and other non-students, and our focus was on student body stress, we included only students in this study, resulting in n = 103 participants. Out of these, 91 identified as male and 12 as female, with a mean age of 21.8 (1.9 SD). 83 participants used Generation 3, while 20 used Generation 2 rings.
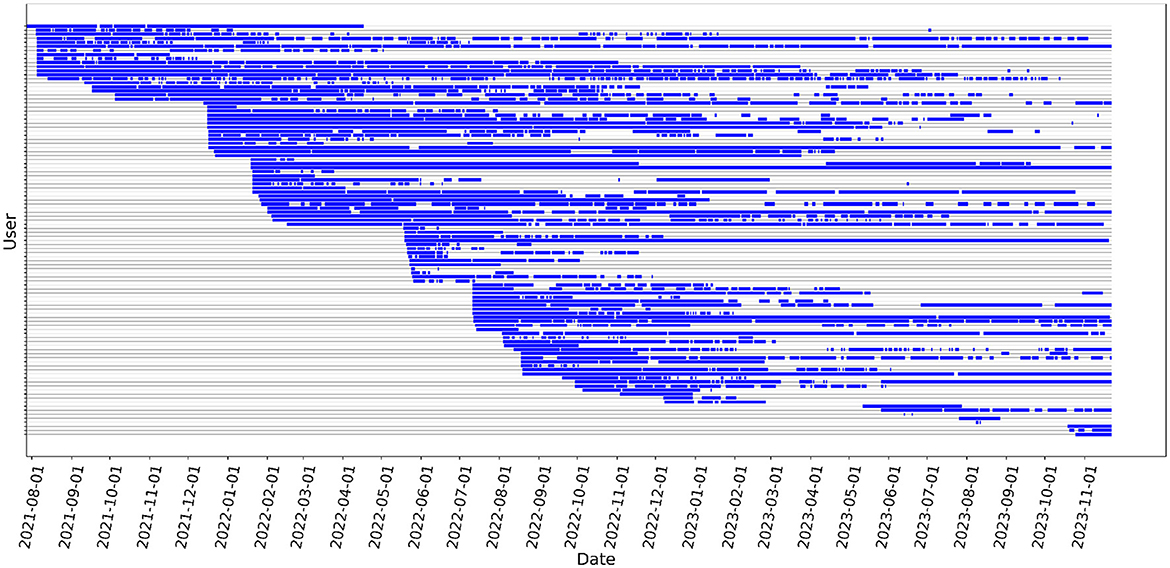
Figure 1. Daily Oura ring data availability (indicative of usage) of participants.
To ensure that no single user dominates the data pool during any period, we analyze the share of the total data every user makes up per calendar week. The results are in Figure 2, and show that our participant and data pool is sufficiently large so that no single user or small group of users dominates any academic period or calendar week.
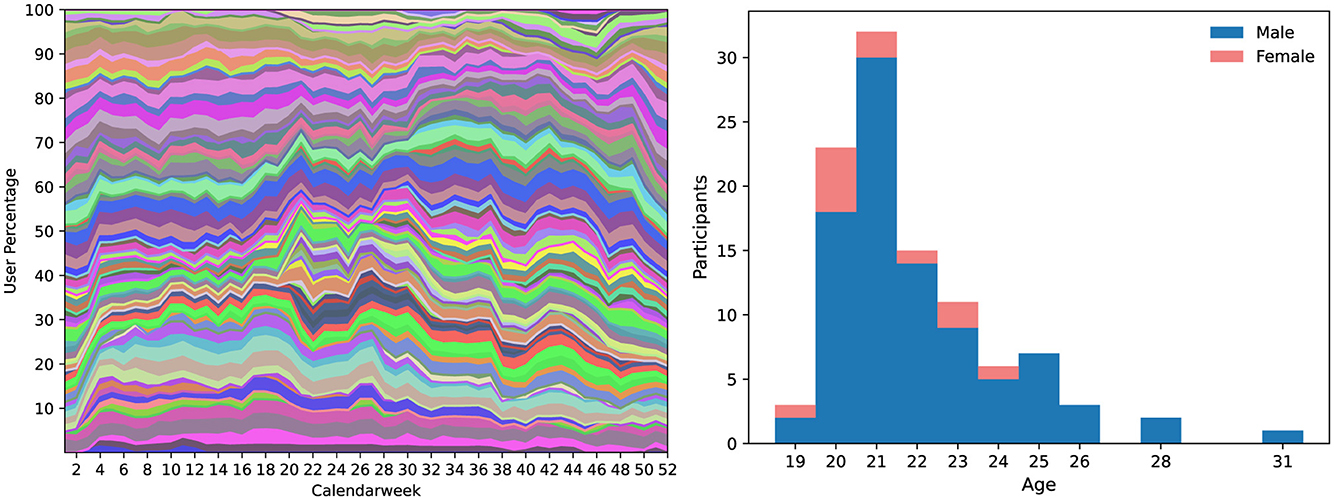
Figure 2. Left: User data distribution per calendar week. Every separated color band corresponds to a single user, and the band's width shows what percentage of the total data available for that calendar week is from that user. No single user or small group of users dominates the data of any given calendar week. Right: Age distribution for genders.
4 Analysis
4.1 Academic year
The host university follows a two-semester system, with the Spring semester starting in April and ending in September and the Fall semester starting in October and ending in March. Final exams are typically given in the first two weeks of August and February, respectively. Many programs also require students to accomplish a yearly research project within a lab. The time after a semester's final exam until the start of the next semester is considered a semester break. Our analysis also considered Golden Week, a period comprising several Japanese national holidays. For students, it offers a full week of leisure, often dedicated to relaxation and travel (Hara and Yamaguchi, 2021).
Students also typically begin applying for employment in either their third year of undergraduate studies or after their first year of graduate studies. Job hunting follows a calendar structure and is often stressful as it requires them to travel to companies and participate in centralized job fairs (Kawanishi, 2020).
4.2 Choice of physiological measurements
As described in Section 1, stress can manifest itself in various physiological measurements. Similar to existing literature, we look at daytime (waking HR), nighttime (sleep) HR and nighttime (sleep) HRV as one of the main indicators of stress (Gradl et al., 2019) that the Oura ring can gather. The Oura ring does not measure daytime (waking) HRV. We also look at the daily maximum waking HR of participants as an indicator of at least one stressful event during that day. While this daily maximum is more of an indicator of acute stress, sleep HR and HRV are more indicative of lingering, potentially chronic, stress (Schubert et al., 2009; Turner, 1994; Brosschot et al., 2007) or alcohol consumption (Pabon et al., 2022). Moreover, we also look at sleep-related data such as total sleep duration, sleep phase percentage, and sleep efficiency or restless periods to get further insights.
4.3 Data preparation
4.3.1 Removal of seasonal effects
As (Koskimäki et al. 2019) show, sleep HR and HRV are subject to seasonal fluctuations related to daily sunlight hours. We detrend the sleep HR and HRV data by first fitting the data points of each participant to a sinusoidal model:
where t is the time since the first measurement in seconds, A is the amplitude of the sine wave, i.e., the peak deviation from the central value D, B is the angular frequency determining how many cycles there are in a given period, and C is the phase shift. We fit the parameters to the data by using Maximum Likelihood estimation. From looking at the experimental data and typical seasonal fluctuations, for the optimization, we bound parameter A in the range for HR and [0, 20]ms for HRV. Parameter C was fixed to a value representing a wavelength of 365 days. C was bound to [−π, π], representing a phase shift between -180 and 180 days since we consider the first recorded data point as t = 0. D was initialized as the average value for that measure over the whole observed period and bounded to the range [0.5Dinit, 1.5Dinit] during optimization. We detrend the data for seasonal effects by subtracting the computed model value y and re-adding the vertical shift D. An illustration for one participant with the resulting fit can be seen in Figure 3.
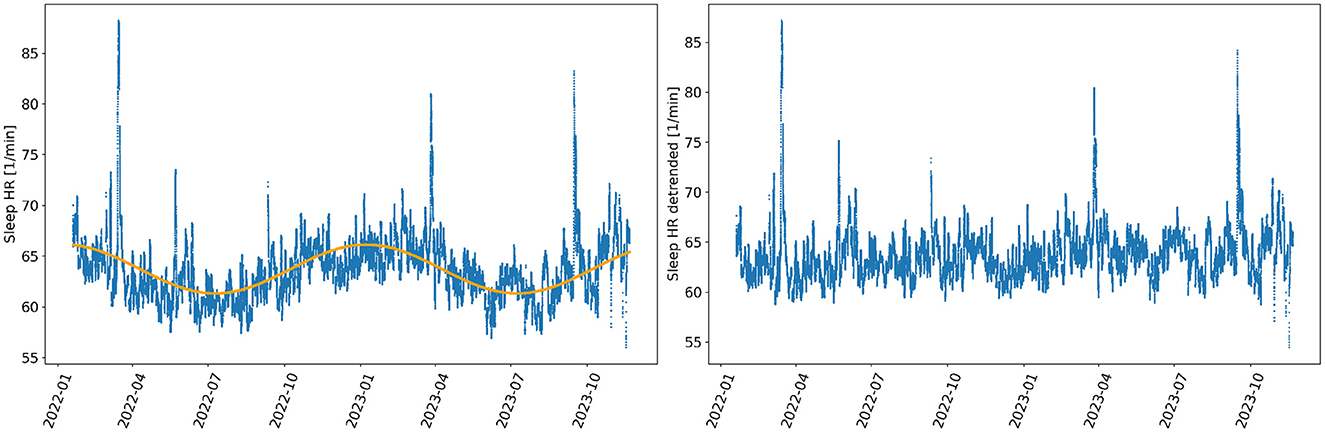
Figure 3. Left: HR recorded during sleep for one participant (blue). The seasonal fluctuation (in unison with daily sunlight hours) is clearly visible. We fit a sinusoidal model (orange) in order to detrend the data. Right: Sleep HR after detrending.
4.3.2 Baseline estimation
Since baselines for measures like HR or HRV differ between individuals, in addition to the raw values, we normalize all measurements of a user to their respective baseline and variance to ensure comparability in changes between participants. To estimate the baseline for HR and HRV, we model the distribution of these measurements as a skewed-normal distribution (see Equation 2 and Figure 4).
Here, ξ, ω and α are parameters for location, scale and skewness of the distribution, in that order. We estimate these parameters for each measure and user individually by using Maximum Likelihood Estimation. We then consider the mode of the fitted distribution m0 as the baseline for that measure and that participant, see Figure 4. During baseline estimation, we ignore HR measurements obtained during live recorded work-outs since these make up another overlapping distribution with its own parameters outside users' resting baselines.
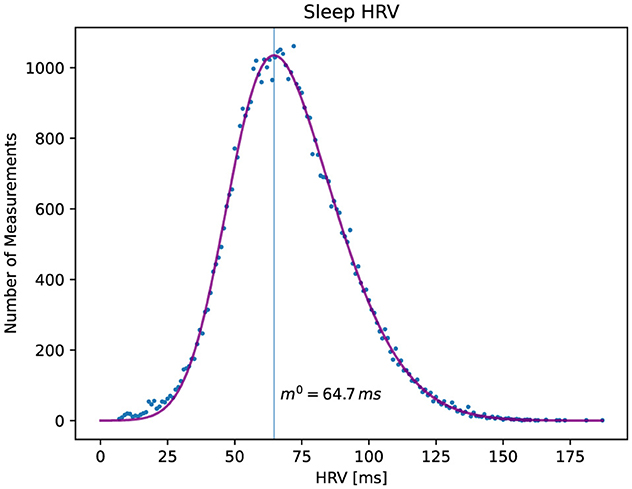
Figure 4. Exemplary illustration of estimation of baseline. A skewed normal distribution is fitted (blue line) to the distribution of a participant's HRV values (scattered dots) from the whole observed period. The argument maximum of the fit, the mode m0, is considered the baseline of that measure (here: HRV) for that participant. © 2024 Peter Neigel, Andrew Vargo, Benjamin Tag, and Koichi Kise. Used with permission.
As a variance measure, we use the median absolute difference (MAD) of measured values to the respective baseline m0:
where M is the set of measurements of one type of physiological measure, i.e. either waking HR, sleep HR or sleep HRV, and nM is the number of measurements a user has for that measure. Finally, we normalize all measures by subtracting the baseline and scaling by the inverse MAD:
4.3.3 Daily aggregation
While some measures supplied by the Oura Ring are timestamped by a specific date and describe a summary or aggregation of that measure during that day or the previous night (e.g., total hours slept), other measures like HR or HRV are available as measurements timestamped multiple times throughout the day or night (hh:mm:ss). We take the daily maximum value per participant to analyze the maximum waking HR.
4.4 Linear mixed effects model
To analyze the physiological data gathered from our participants and its changes during the academic year, we chose to employ linear mixed effects models because they allow for the modeling of population-wide fixed effects (e.g., periods of the academic year or calendar week) while also taking into account individual variability through random effects.
In mixed effect models, the probability model for a disjoint group i is:
where Y, X and Z correspond to the observed dependent variable, the fixed effects and the random effects respectively, and β and the covariance of γ are estimated using optimization techniques.
More information about the mixed effects linear model as well as the implementation that we used for our experiments can be found in (Seabold and Perktold 2010).
For all our models we used restricted maximum likelihood (REML) optimization to fit the parameters to the model.
4.5 Pre-defined periods
In the first part of the analysis, we cluster data into pre-defined periods based on the academic calendar. The periods and their explanations can be found in Table 2. Often the boundary between two periods is soft. There could be effects that spill over into one period from another. For instance, the effects of the pre-exam could occur earlier for one student than another. In addition, not all participants will be experiencing the same influences from the periods as they are happening. Nonetheless, the definitions provide a basis for understanding the status of the cohort as a whole.
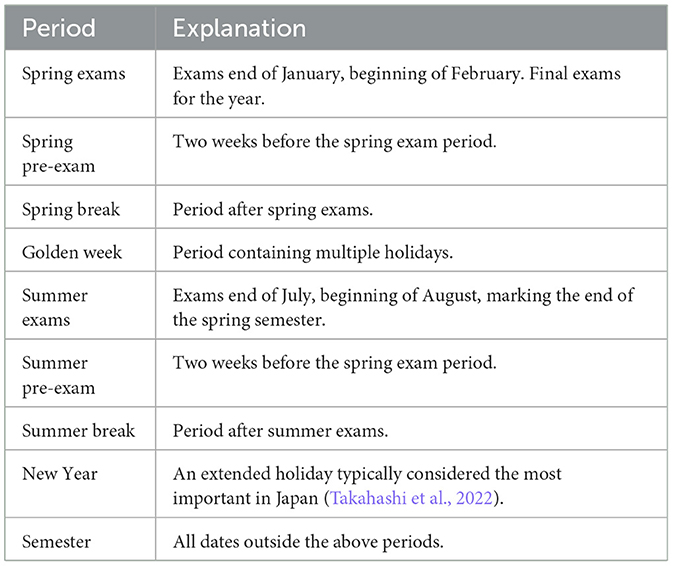
Table 2. Pre-defined periods and their descriptions.
5 Results
To analyze the physiological data gathered from our participants and its changes during the academic year, we employed mixed effects linear models (Seabold and Perktold, 2010). They allow for the modeling of population-wide fixed effects while controlling individual variability through random effects. We used restricted maximum likelihood (REML) optimization for all our models.
5.1 By periods
We fit mixed effects linear models with the un-aggregated sleep HR and HRV data (one model per data type), where we set the academic period as a categorical fixed effect and the users as random effects. We allow for individual intercepts per participant while keeping a common slope. The results can be seen in Table 3. For raw values, the intercept is the cohort average under the semester, measured in BPM for HR and ms for HRV. The coefficients indicate the group trend in the respective measure compared to intercept during a period, considering individual differences. Normalized values represent the fraction of the individual baseline.
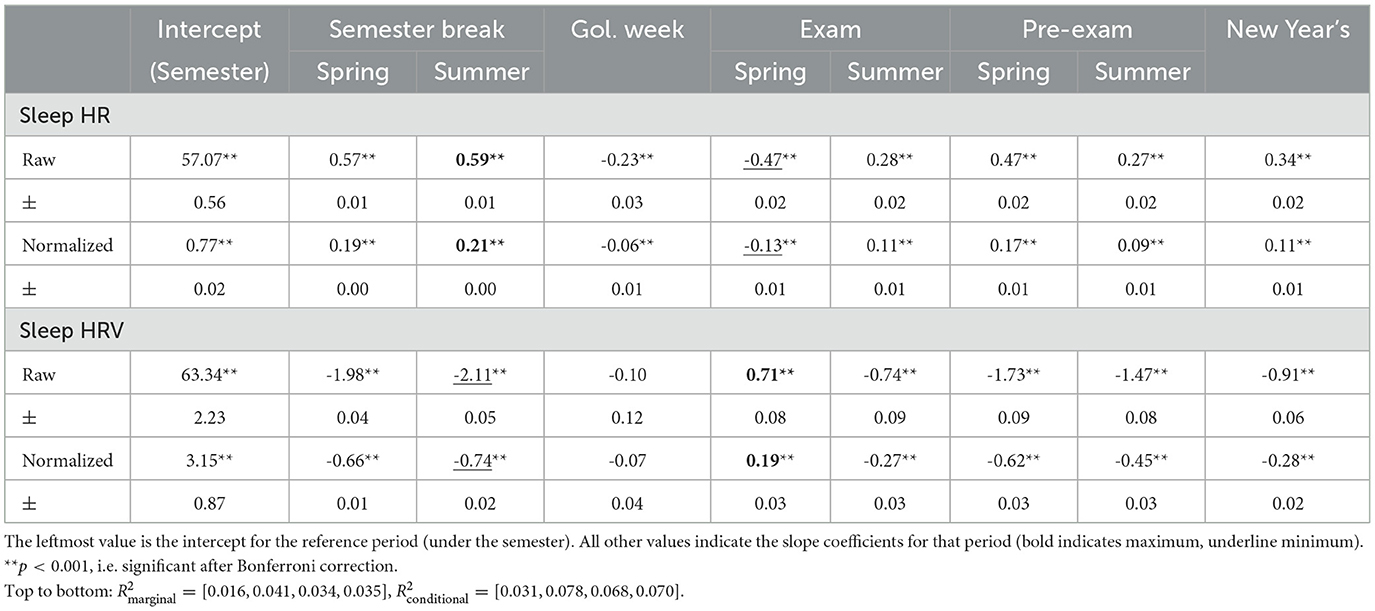
Table 3. Mixed effects model results for sleep HR and HRV.
The general trend and ordering of observed periods are similar for raw and normalized values. The periods with the highest sleep HR are both semester breaks, the two weeks before the spring exam, and New Year's. The period with the lowest sleep HR is the spring exam period. For sleep HRV, the period with the highest coefficient is the spring exam period, and the periods with the lowest values are the semester breaks and both pre-exam periods. Since higher HR and lower HRV indicate stress or need for recovery, both HR and HRV agree on the three most stressful and two least stressful periods, with some variation in the middle. Only the coefficients for sleep HRV, raw and normalized, during Golden Week lack significance. However, the Golden Week period shows the highest variance between participants for all measurements.
For waking HR, we also use the un-aggregated time-stamped HRs for this model. The results can be seen in Table 4. The periods with the highest coefficients for waking HR are spring break, spring exam, and the two weeks prior, followed by New Year's. In contrast, summer pre-exam, Golden Week, summer exams, and summer break periods show lower values. The order of stressfulness does not change when looking at normalized values. Only Golden Week and summer pre-exam exhibit non-significance, indicating higher variance between participants for these periods. Golden Week shows the highest variance between participants.
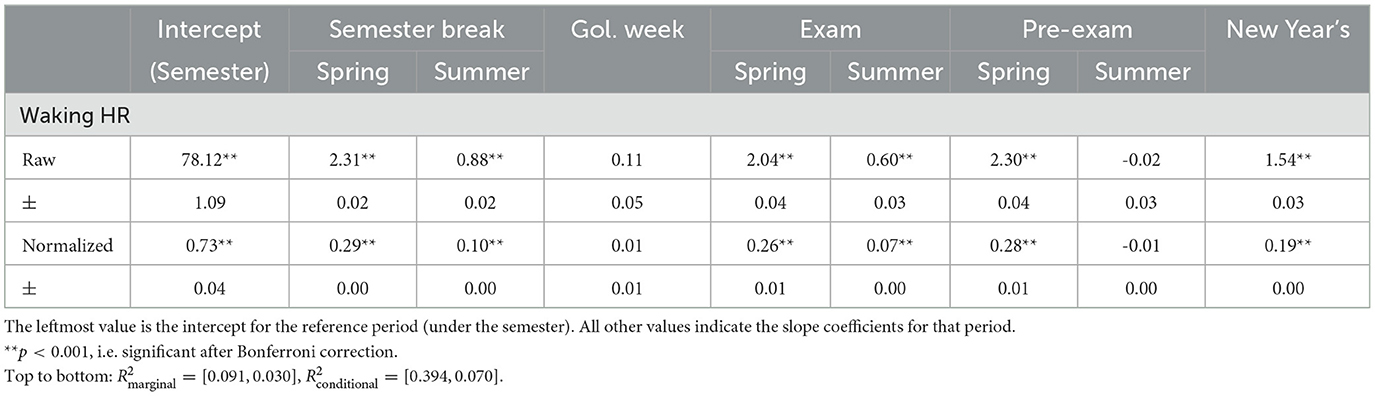
Table 4. Mixed effects model results for waking HR, raw () and normalized values.
Following this, we aggregate the waking HR data into daily maximum values, as described in Section 4.3.3. This indicates the maximum severity of physical stress per day. The results can be found in Table 5. When looking at the maximum waking HR during the day, we find that summer exams and the two weeks prior show the greatest group-wise increase. In contrast, Golden Week shows the greatest decrease (although with missing significance), followed by New Year's, spring pre-exams, and spring break. Again, raw and normalized values indicate the same stress ranking of periods.
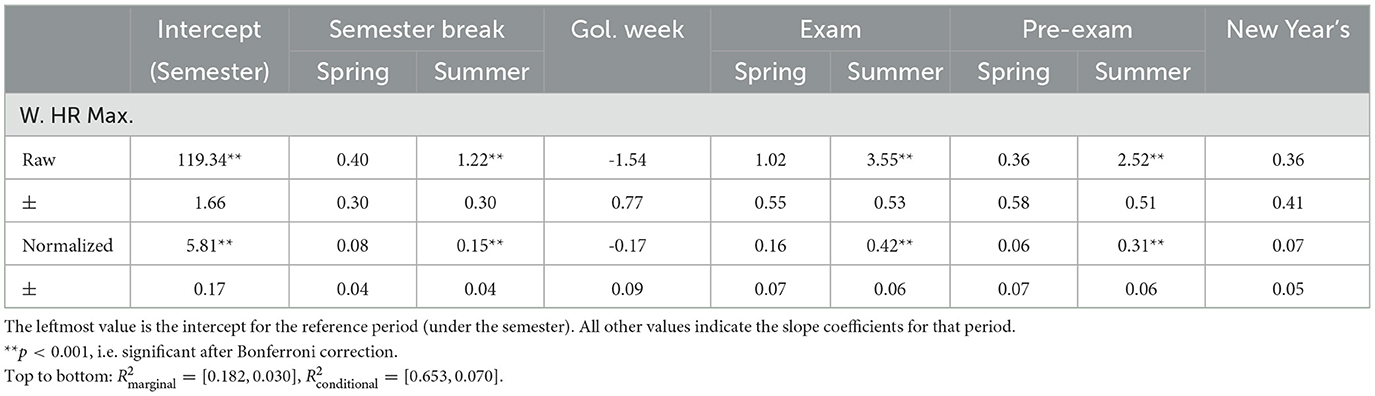
Table 5. Mixed effects model results for maximum waking HR, raw () and normalized values.
5.2 By calendar week
Since the corner dates of the academic year fall within the same calendar week or within one week difference maximum every year, we chose to “fold” multi-year data by reducing every measurement timestamp to the respective calendar week. Similar to the previous section, we use the calendar week as a categorical variable that defines the fixed effect of the mixed effects linear model, with the participants as random effects. We allow for individual intercepts per participant but for a common slope. This way, the group-wide movement over the year can be observed visually by plotting the coefficients against the respective calendar week. The reference value for every respective measure to which the denoted intercept value belongs gives the basis from which the plotted coefficients show the change compared to that calendar week. For this reference value, we chose to take the median of all measurements that fall into the “semester” category from Section 4.5. The resulting coefficients can be seen in Figure 5.
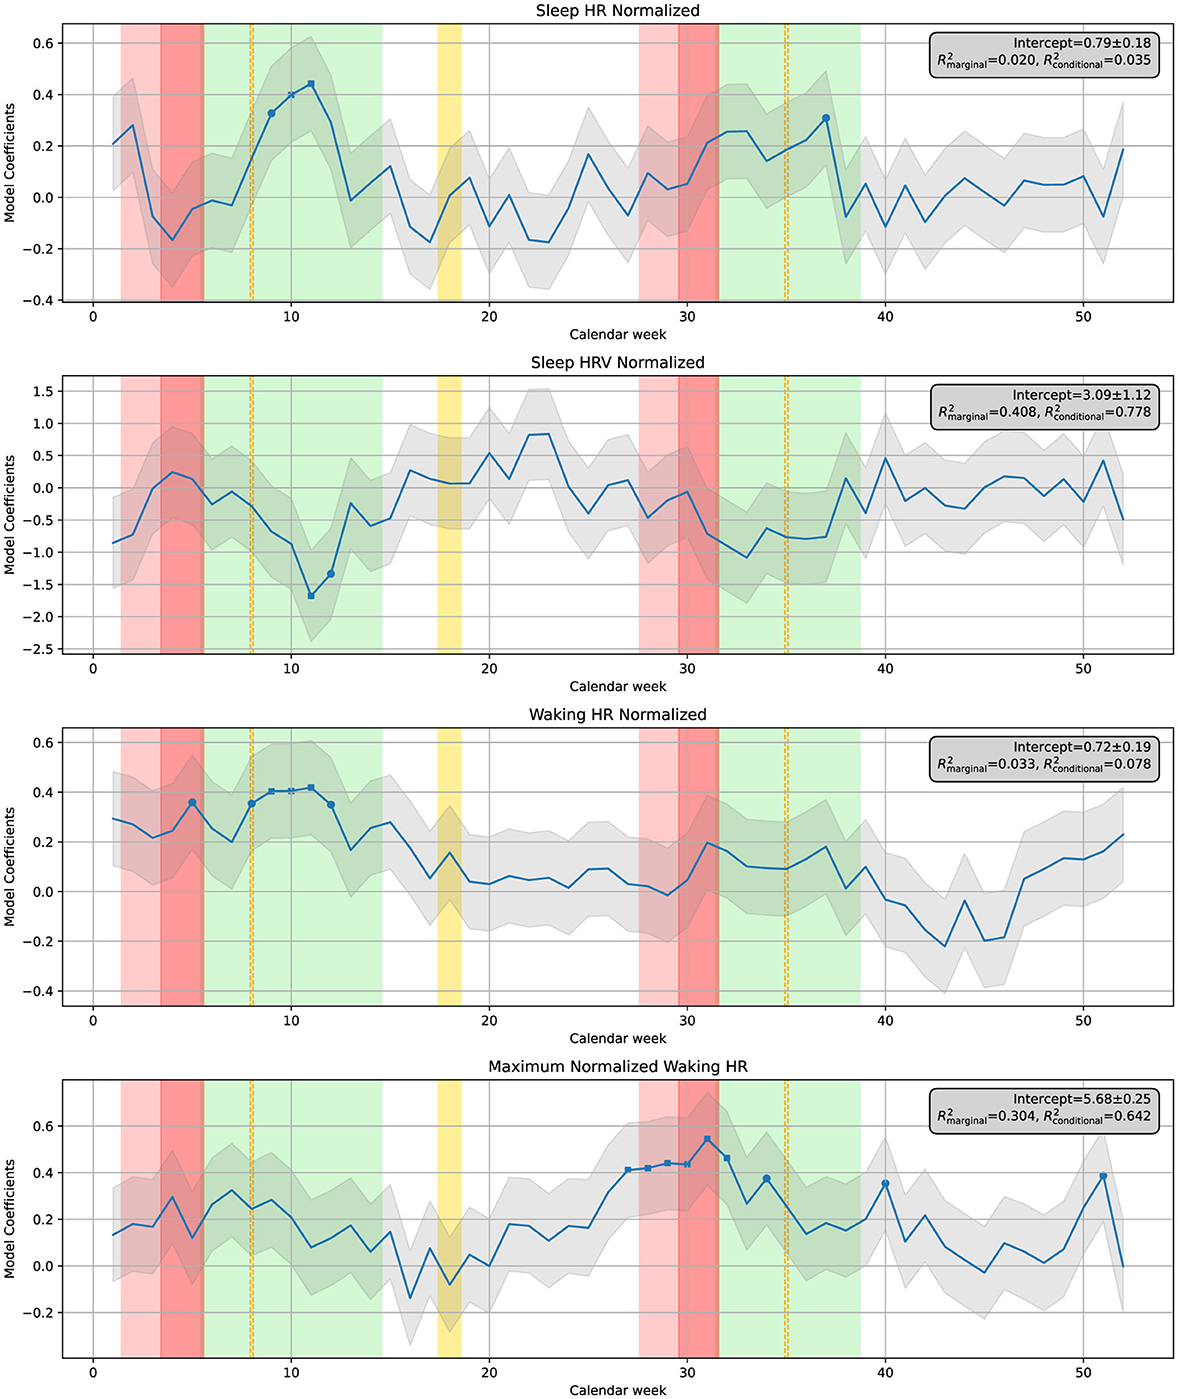
Figure 5. Mixed effects linear model coefficients (unit: MAD) plotted against the respective calendar week for normalized sleep HR, sleep HRV, waking HR and waking HR max. Every graph represents a single fitted model for a single variable denoted at the top of the graph. The background coloring indicates the period according to Section 4.5: pink, pre-exam; red, exam; green, break; gold, golden week; orange lines, grade result release. The gray box gives the intercept for the reference value—the median of all values during the semester—as well as the model fit (R2). Circle dots denote a p-value < 0.1, square dots a p-value < 0.05. © 2024 Peter Neigel, Andrew Vargo, Benjamin Tag, and Koichi Kise. Used with permission.
Various factors can influence physiological measurements; however, because our primary focus is on stress, we look at further confounding factors related to stress to investigate the sources of changes in the measurements. These factors consist of high activity time, measured in seconds per day, total daily sleep duration, and percentage of deep and light sleep for the night. We found REM sleep to be relatively constant compared to deep and light sleep changes and omitted the graph. All these are obtained from the wearable device and the HR and HRV data. The analysis of these factors is carried out similarly to HR and HRV; the results of the mixed effects linear models can be seen in Figure 6. Due to less available data per category, many weeks lack the required significance, but the movements of coefficients can give an understanding of patterns nonetheless.
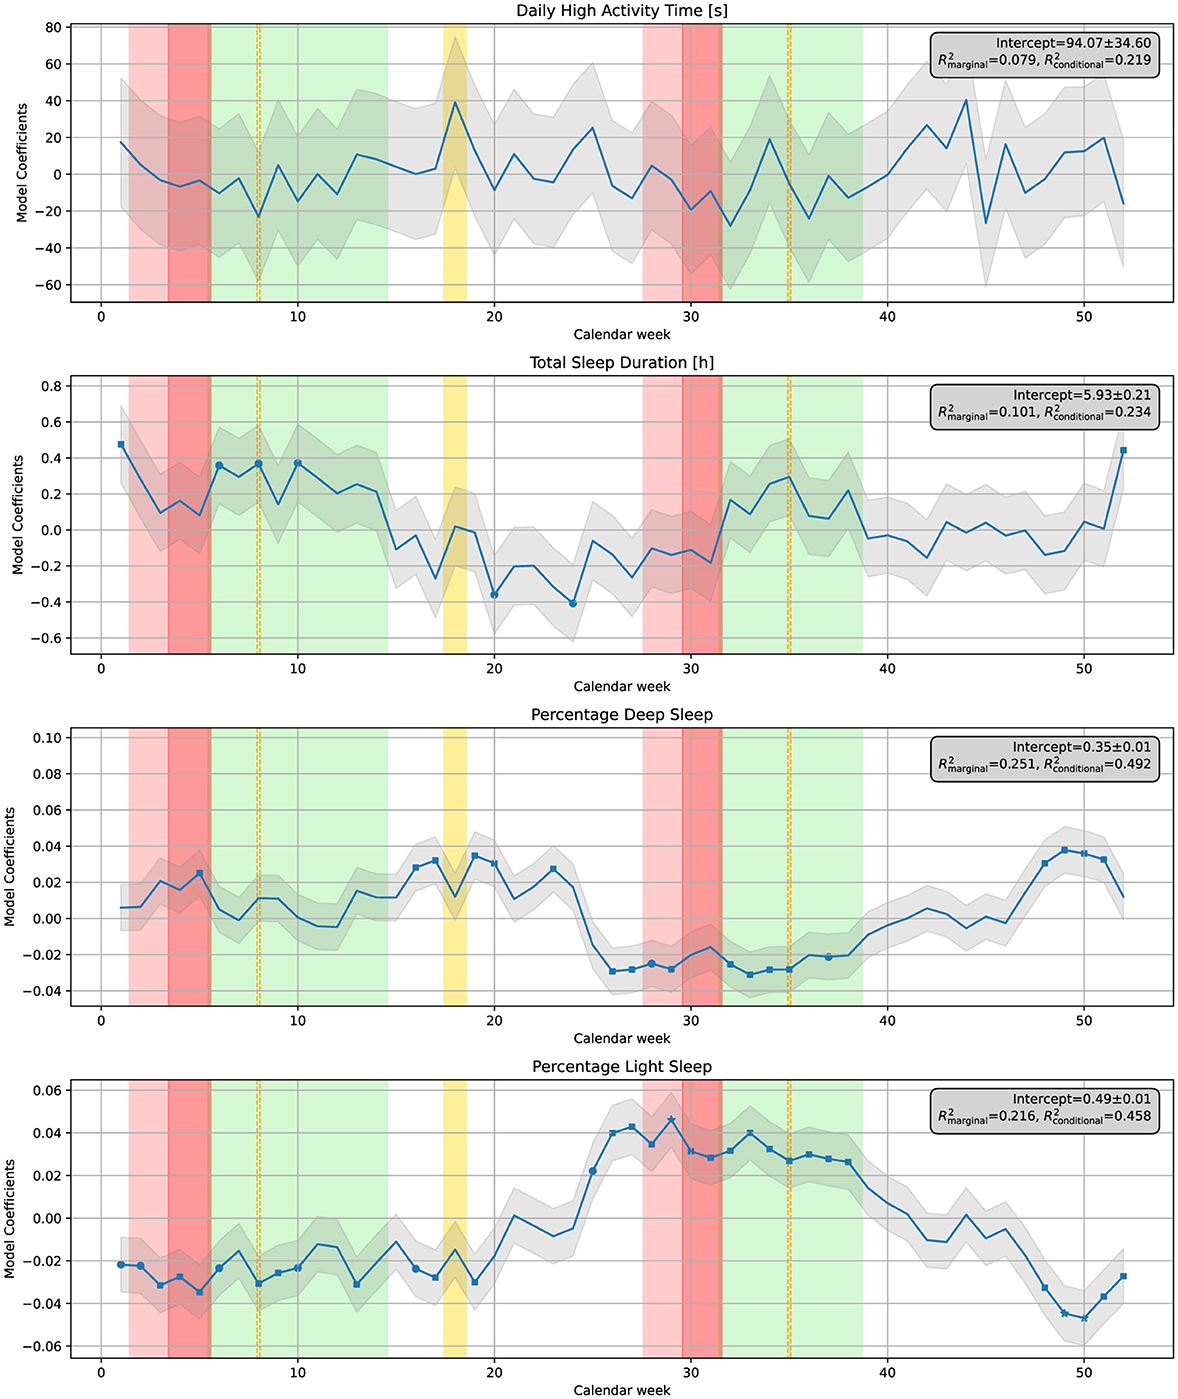
Figure 6. Similar to Figure 5, this plot depicts coefficients for the mixed effects model for the confounding factors high activity time, total sleep duration, percentage of deep sleep and light sleep. Every graph represents a single fitted model for a single variable denoted at the top of the graph. The background coloring indicates the period according to Section 4.5: pink, pre-exam; red, exam; green, break; gold, golden week; orange lines, grade result release. The gray box gives the intercept for the reference value—the median of all values during the semester—as well as the model fit (R2). Circle dots denote a p-value < 0.1, square dots a p-value < 0.05. © 2024 Peter Neigel, Andrew Vargo, Benjamin Tag, and Koichi Kise. Used with permission.
Due to less available data per category, many weeks lack the required significance, but the movements of coefficients can give an understanding of patterns nonetheless.
6 Discussion and limitations
6.1 Discussion of results
To interpret these results, it is essential to distinguish between different types of stress and other confounding factors (Schubert et al., 2009). While the daily maximum waking HR is indicative of a physiologically stressful episode during the day, it's unclear whether that physiological stress is due to a stressful event exciting the participant, e.g., an exam, a presentation, an accident, etc., or due to physical activity like sports. Sleep-related values, however, are indicative of a different type of stress. Sleep HR can increase temporarily, i.e. for single nights, due to illness (Park et al., 2017; Davies and Maconochie, 2009; Vargo et al., 2023) or alcohol consumption (Pabon et al., 2022), but increased HR over several nights or long periods are indicative of chronic stress (van Kraaij et al., 2020), fretting and a general need for recovery. Exercise done the day before only has an effect on unaccustomed individuals (Tseng et al., 2020; O'Connor et al., 1993; Koskimäki et al., 2019). Due to the fact that our observed periods consist of several weeks' worth of data (since every period includes data from several calendar years), it is reasonable to assume that one-off events like illness can be ruled out as causes, especially considering the significance of most coefficients for the period analysis.
The analysis of waking HR, sleep HR, and sleep HRV reveals different periods of elevation (HR) or decrease (HRV) for sleep measures than for waking measures. Sleep HR shows significant group-wide elevation during both spring and summer breaks as well as spring pre-exam and the end of the year. In contrast, the spring exam and golden week show significant decreases compared to the reference period. Sleep HRV reversely mirrors these movements mostly, showing a rise when sleep HR goes down and vice versa. Waking HR, on the other hand, is significantly elevated during the spring months in general: spring exam, pre-exam, and break show the highest elevation with the new year's following. While the summer exams and summer break also show a significant increase from the reference period, it's not as pronounced as during spring, and it's worth mentioning that the reference period (semester) shows the lowest group-wide HR. The maximum waking HR has very pronounced and significant increases for both the summer exams and the summer pre-exam period, and to a lesser degree for summer break, indicating stressful events during these periods. Golden week shows a strong decreasing effect on maximum waking HR but lacks significance.
To better understand the movements before, during, and after specific periods, the model coefficients for individual calendar weeks are particularly useful. The strongest indicator for academic-related stress is the increase in maximum waking HR just before the summer pre-exam period, when many students are beginning to prepare for exams, with a significantly elevated plateau during the pre-exam weeks and significant global peak during summer exams (Figure 5). This is accompanied by a significant reduction in the ratio of deep sleep to total daily sleep and an increase in light sleep, indicating less restorative sleep and signs of stress (Kim and Dimsdale, 2007). Meanwhile, total sleep duration drops much earlier, starting at the beginning of the semester (Figure 6). After the summer exams (as well as spring exams), we can see total sleep duration rise sharply, very likely due to the semester breaks starting and students' free time increasing. Heightened activity cannot explain this increase in maximum HR, as can be taken from the activity coefficients for that period.
While the apparent increase in stress during the summer exams, as indicated by the maximum waking HR, is intuitive, the spring exam period shows a smaller and non-significant increase in the same measure. This is accompanied by a decrease in nighttime HR and an increase in HRV as compared to the reference period, showing an apparent contradiction of the stress hypothesis. At the same time, un-aggregated waking HR shows a significant peak during the spring-exam period. This raises the question of how these findings can be mediated. Several possible explanations can be speculated based on the data. One such explanation is that exams – and the studying period beforehand—serve as the primary stressor, as indicated by waking HR and maximum waking HR. Physiological recovery from this stress period appears to begin after the exam ends, during the semester breaks. An indication of this is that sleep HR is increased for both break periods and especially seems to increase after the grades are released (see Figure 5 top). Another possibility is that the regular schedule of studying for exams leads to more restorative sleep. The reality, however, is that the analysis in this paper identifies the need for additional data collection, possibly qualitative, to identify the reason for the phenomena clearly.
Another period of relevance is the spring break itself. During spring break, waking HR is notably higher when compared to the reference period (under the semester). This increased HR is present not only over the entire break period but also remains elevated in specific weeks when the data is broken down by calendar week. This is accompanied by a rise in sleep HR, a drop in HRV, and a drop in deep sleep duration, indicating that the spring semester break is a period of stress for the student body. This seems to harmonize with a peculiarity of the Japanese job market: the job hunting season (Section 4.1). Further, the spring break is a period of uncertainty for students, besides looking for, applying to and interviewing for jobs, many students often need to find new apartments and can have significant changes to their lifestyles.
Golden week as a period stands out by the fact that for the period analysis, only sleep HR yielded significant results with a mild decrease in HR, hinting to a recovery period. That other measures failed to obtain significant coefficients indicates that this week is characterized by a high variation between participants in physiological measurements and possibly behaviors.
The end of the year, including New Year, is again very clear cut: All measures point to a stressful period for the student body, although the effect is not as pronounced as it is for summer exams. New Year's in Japan is a major holiday, where people typically visit their families and friends, often involving extensive travel. Students may be traveling or attending parties, which may explain the phenomenon.
Looking at the maximum waking HR coefficients by calendar week, we see that weeks 40 and 51 show significant increases, indicating that group-wide multi-year stress events are occurring. While the nature of these events remains unclear, they lead to the broader implications of this study.
6.2 Broader implications
The results in this paper apply to a specific context: students at one university in Japan. This environment contains a lot of structure, benefiting the analyses. However, the results point to broader implications regarding the possibilities of group-wide stress detection and implied policy decisions. Our results show that it is possible today to detect group-wide changes in physiological measurements indicative of broader factors, as suggested by Laborde et al. (2023), by using current wearable technology and without exposing an individual user's measurements. Moreover, even though our cohort is homogeneous, it could be split into more fine-grained groups to improve stress detection. For example, the distinction by current academic year would offer insights into which students are facing stressful activities. On an individual level, features such as GPA could indicate periodic stress. It is possible to detect these group-wide patterns without these fine-grained subdivisions, strengthening the general applicability. Our work shows that even noisy in-the-wild data can detect group-wide patterns.
Therefore, the implications apply to other types of groups in a wide range of contexts. This is important because it opens the opportunities for the usage of consumer wearables for the purpose of policy-making and management at large institutions that do not seek or have control over their potential wearers. This is significant since we know that devices like the Oura Ring have great potential in contexts where control is maintained, such as the military (Conroy et al., 2022). In a university context, a few volunteers wearing sensing devices can help administrators respond to expected and unexpected stress by adjusting policies and preparing students better. For example, consistent stress measures during spring break, as in our sample, suggest the university could enhance its support systems for job-hunting. Since universally correct usage is not required, it is also more feasible for an institution to achieve the required deployment, maintenance, and analysis schemes.
7 Application in a university setting
Monitoring specific characteristics of students using wearables has been proposed or experimented in multiple contexts including pandemic prevention (Vargo et al., 2023; Drury, 2022) or mental health (Ueafuea et al., 2021; Shin et al., 2023; Gilley et al., 2022; Laborde et al., 2023). For stress, most methods predict individuals' stress and rely on self-reported or controlled stress (see Section 2). A significant gap exists between the potential use of a health-tracking device like the Oura Ring and actual organizational implementation. This section considers the value of a passive monitoring regime in a university and the myriad of possibilities that will make implementation difficult.
7.1 Usefulness of a passive and non-individualized monitoring system
A system that is anonymous, opt-in, and can handle missing data could monitor the whole student body without infringing on individual privacy, allowing the university to evaluate institutional changes and proactively support student well-being. By using statistical aggregation rather than individual tracking, such a system can provide valuable insights while maintaining ethical standards and protecting student autonomy. It could also measure fluctuations in student stress over time, allowing stakeholders (such as university administrators, faculty, and student support services) to gain an overview of mental well-being trends. Real-time or periodic assessments could highlight peak stress periods (e.g., exam seasons, natural disasters) and potential burnout risks. With this information, the system could reveal hidden stress sources, such as specific courses, administrative procedures, or campus environmental factors. Correlations with factors like workload, housing conditions, financial concerns, or extracurricular pressures could be explored to identify key issues. The system can assess how institutional changes, external crises (e.g., pandemics), or campus-wide events (e.g., policy changes, protests) influence student stress. Universities can make evidence-based adjustments by comparing stress levels before, during, and after events. Longitudinal data gathered in this way over years could be useful for tracking long-term trends and their effects on student performance and well-being. This could lead to changes such as restructuring academic calendars, introducing mental health breaks, adjusting class loads, or improving counseling resources. Major institutional decisions, such as revising curricula or modifying exam policies, could be guided (apart from academic considerations) by objective well-being data rather than assumptions. Students could receive recommendations for campus well-being initiatives, including faculty mentorship or peer support groups. Departments or student organizations could tailor mental health initiatives based on real data rather than anecdotal feedback. Campus members could be offered to take part in well-being health activities.
7.2 Challenges to implementation and operation
The challenges to implement and operate such a monitoring system include management of participants and participation rate, type of wearable device, data hosting solutions that are data protective, analysis of the data that is privacy-preserving, and inference of actionable solutions based on the analysis.
The type of wearable chosen for such a system should allow for passive monitoring, i.e., it should be easy to maintain, require as little interaction from participants as possible, and not disturb users' everyday lives, neither through its form factor nor through notifications. Ring-shaped devices fulfill most of these criteria, but other types of wearables might be suited just as well. For example, students who are used to wearing smartwatches might not be bothered by a watch-type device. Additionally, these students will be more open to a monitoring system, as discussed in this work. Due to the pervasiveness of wearable health devices, an implementation could even allow participants to use their own devices optionally. A monitoring system developed by a university could potentially make use of existing APIs such as Samsung Health or Apple Health, although data privacy considerations need to be addressed. The possibility for future developments in the wearable sector, especially in terms of ever-decreasing form factors, should be kept in mind.
To have meaningful aggregate data, the university needs to ensure a sufficient participation rate. Our work shows that around 100 people can be sufficient for insights, although higher participation rates can ensure a better diversity of participants in terms of age, sex, and student or staff status.
Ensuring data ownership and transparency is crucial for ethical implementation. Universities need to clearly communicate how data is collected, stored, and used while granting students control over their personal information. Transparent policies and opt-in participation mechanisms can help build trust and encourage engagement in such monitoring initiatives. Students should be made aware that their data is used only in aggregation and not individually, and the analysis results should be accessible to them.
Ideally, data gathered from the participants should be self-hosted by the institution in a data-secure and privacy-preserving manner. While there are several ways to anonymizing the data, e.g. data pseudonymization (Neubauer and Heurix, 2011), differential privacy (Dwork, 2006) or K-anonymity (Sweeney, 2002), hosting it securely can be challenging from a technological perspective. Depending on the jurisdiction, the requirements for this can make self-hosting infeasible or associated with high costs. In such a case, hosting with a secure provider adhering to strict protection laws, e.g., the General Data Protection Regulation (GDPR) of the European Union (EU, 2016), might be an option.
In terms of analysis, our proposed statistically-aggregated approach offers a few advantages. It does not require universities to use individual information, e.g., student status, or gather ground truth for stress, which is a prerequisite for most approaches that are not feasible for many institutions. Additionally, most published work deals with individual stress.
Besides the implementation and operational challenges, there are possible second-order effects to consider. Having a system that monitors the students' or staff's stress levels could raise the expectations of real-time interventions. While in rare cases and depending on the cause, it is conceivable that some immediate measures could be taken, in most cases, the bigger benefit lies in the long-term decision support systems like these can enable. Other possible second-order effects include the Hawthorne Effect (McCarney et al., 2007), where students might change their behavior due to being observed. In this case, it would be important for the administration to ensure the anonymity of data collection and storage continually. Another negative possibility is the Panopticon Effect (Semple, 1993), where administrators increase the exerted power due to the monitoring. One could imagine that using sensing to detect phenomena might lead to the administration expanding its data monitoring to a level where campus members are under constant observation.
For interventions based on the data group dynamics have to be considered (Drury et al., 2021) in order to increase trust and adherence. In the context of a university, this means fostering a strong sense of shared identity among students, staff, and faculty to promote collective responsibility and mutual care. Health policies should be communicated through trusted in-group figures, such as student leaders or well-regarded faculty members, to enhance credibility and adherence. Moreover, the university should support and recognize student-led initiatives like peer support and mutual aid groups not only as a means of practical assistance but also as vital contributors to campus resilience and behavioral engagement.
7.3 Limitations
This study aims to show the feasibility of in-situ privacy-preserving stress-tracking for in-the-wild cohorts. However, some limitations need to be considered to contextualize our findings appropriately.
First, while we hypothesized that elevated heart rate (HR) and reduced heart rate variability (HRV) would correspond to periods of academic stress, our data reveals both supporting and contradicting patterns across different timepoints (see Tables 3, 5). This inconsistency likely reflects the complex nature of real-world stress and the influence of uncontrolled confounding variables in naturalistic settings. As such, the observed associations in this study should be regarded as exploratory and correlational rather than diagnostic.
Second, the small number of female participants in our cohort limits the generalizability, especially considering the effect of gender on the relationship between stress and HR (van Kraaij et al., 2020). While a separate analysis between genders would be beneficial regarding these differences, the limited data availability prohibits a similar evaluation as in Section 4. for female participants only. In addition, the cohort is largely uniform in nationality, major of study, and age. Future work must be conducted on diverse populations and contexts to ensure stress detection is universally viable.
We also only look at purely physiological data, without taking into account contextual data like movement patterns, smartphone use, sociability, etc., which were shown to improve stress detection over just physiological data (Stojchevska et al., 2022). While this is a limitation in one sense, these added data points would increase complexity and the amount of data that is required from each user, thus creating increased privacy risks and making implementation more difficult for institutions.
We also do not look for the reasons for stress in the cohort. While the academic calendar allows us to make reasonable inferences about the causes, underlying factors may be unseen from our approach alone. Qualitative investigations are needed to find any underlying causes. However, these investigations could also increase privacy risks and participant burden.
8 Conclusion and future work
In this paper, we explored the potential of consumer-grade wearable devices to detect stress-related patterns at the group level in a university setting. By analyzing HR, HRV, sleep, and activity data collected over 28 months from 103 participants, we identified physiological changes that coincided with academic cycles, including exams and holiday breaks, despite noisy data and uncontrolled variables. Our findings suggest that distributing wearable health devices to small groups allows unobtrusive analysis of group-wide effects without enforcing usage or singling out individuals. This can also enable the identification of previously unknown forms of stress or other group-wide effects, having broad implications for universities' policies. We also lay out possible ways for universities to apply this in a real-world setting, highlighting the benefits and obstacles of institution-wide monitoring of stress.
Data availability statement
The datasets presented in this article are not readily available because dataset will be published in a separate publication soon. Requests to access the datasets should be directed to c3cyMzgyNHFAc3Qub211LmFjLmpw.
Ethics statement
The studies involving humans were approved by Ethics Committees of the Graduate School of Engineering, Osaka Prefecture University, and the Graduate School of Informatics, Osaka Metropolitan University. The studies were conducted in accordance with the local legislation and institutional requirements. The participants provided their written informed consent to participate in this study. Written informed consent was obtained from the individual(s) for the publication of any potentially identifiable images or data included in this article.
Author contributions
PN: Conceptualization, Data curation, Formal analysis, Investigation, Methodology, Project administration, Supervision, Validation, Visualization, Writing – original draft, Writing – review & editing. AV: Conceptualization, Formal analysis, Funding acquisition, Investigation, Methodology, Project administration, Supervision, Validation, Writing – original draft, Writing – review & editing. BT: Supervision, Writing – original draft, Writing – review & editing. KK: Conceptualization, Funding acquisition, Methodology, Project administration, Resources, Supervision, Validation, Writing – original draft, Writing – review & editing.
Funding
The author(s) declare that financial support was received for the research and/or publication of this article. This work was supported in part by grants from the JST Trilateral AI Research (JPMJCR20G3), JSPS Grant-in-Aid for Scientific Research (20KK0235, 23KK0188), the Grand challenge of the Initiative for Life Design Innovation (iLDi), and the Tateisi Science and Technology Foundation Research Grant (S).
Conflict of interest
The authors declare that the research was conducted in the absence of any commercial or financial relationships that could be construed as a potential conflict of interest.
Generative AI statement
The author(s) declare that no Gen AI was used in the creation of this manuscript.
Publisher's note
All claims expressed in this article are solely those of the authors and do not necessarily represent those of their affiliated organizations, or those of the publisher, the editors and the reviewers. Any product that may be evaluated in this article, or claim that may be made by its manufacturer, is not guaranteed or endorsed by the publisher.
Footnotes
References
Abouelenien, M., Burzo, M., and Mihalcea, R. (2016). “Human acute stress detection via integration of physiological signals and thermal imaging,” in Proceedings of the 9th ACM International Conference on PErvasive Technologies Related to Assistive Environments, PETRA '16 (New York, NY: Association for Computing Machinery), 1–8.
Bauer, G., and Lukowicz, P. (2012). “Can smartphones detect stress-related changes in the behaviour of individuals?,” in 2012 IEEE International Conference on Pervasive Computing and Communications Workshops(Lugano: IEEE), 423–426.
Bloomfield, L. S. P., Fudolig, M. I., Kim, J., Llorin, J., Lovato, J. L., McGinnis, E. W., et al. (2024). Predicting stress in first-year college students using sleep data from wearable devices. PLOS Digit. Health 3:e0000473. doi: 10.1371/journal.pdig.0000473
Bogomolov, A., Lepri, B., Ferron, M., Pianesi, F., and Pentland, A. S. (2014). “Daily stress recognition from mobile phone data, weather conditions and individual traits,” in Proceedings of the 22nd ACM International Conference on Multimedia, MM '14 (New York, NY: Association for Computing Machinery), 477–486.
Booth, B. M., Vrzakova, H., Mattingly, S. M., Martinez, G. J., Faust, L., and D'Mello, S. K. (2022). Toward robust stress prediction in the age of wearables: modeling perceived stress in a longitudinal study with information workers. IEEE Trans. Affect. Comp. 13, 2201–2217. doi: 10.1109/TAFFC.2022.3188006
Brosschot, J. F., Van Dijk, E., and Thayer, J. F. (2007). Daily worry is related to low heart rate variability during waking and the subsequent nocturnal sleep period. Int. J. Psychophysiol. 63, 39–47. doi: 10.1016/j.ijpsycho.2006.07.016
Can, Y. S., Gokay, D., Kılıç, D. R., Ekiz, D., Chalabianloo, N., and Ersoy, C. (2020). How laboratory experiments can be exploited for monitoring stress in the wild: a bridge between laboratory and daily life. Sensors 20:838. doi: 10.3390/s20030838
Cao, R., Azimi, I., Sarhaddi, F., Niela-Vilen, H., Axelin, A., Liljeberg, P., et al. (2022). Accuracy assessment of oura ring nocturnal heart rate and heart rate variability in comparison with electrocardiography in time and frequency domains: comprehensive analysis. J. Med. Internet Res. 24:e27487. doi: 10.2196/27487
Collier, R. J., Renquist, B. J., and Xiao, Y. (2017). A 100-Year Review: Stress physiology including heat stress. J. Dairy Sci. 100, 10367–10380. doi: 10.3168/jds.2017-13676
Conroy, B., Silva, I., Mehraei, G., Damiano, R., Gross, B., Salvati, E., et al. (2022). Real-time infection prediction with wearable physiological monitoring and AI to aid military workforce readiness during COVID-19. Sci. Rep. 12:3797. doi: 10.1038/s41598-022-07764-6
Davies, P., and Maconochie, I. (2009). The relationship between body temperature, heart rate and respiratory rate in children. Emerg. Med. J. 26, 641–643. doi: 10.1136/emj.2008.061598
Drury, J., Carter, H., Ntontis, E., and Guven, S. T. (2021). Public behaviour in response to the COVID-19 pandemic: Understanding the role of group processes. BJPsych Open 7:e11. doi: 10.1192/bjo.2020.139
Drury, R. (2022). Geolocated wireless heart rate variability sentinel surveillance in immunological assessment, intervention and research concerning COVID-19 and other pandemic threats. Med. Res. Arch. 10:3021. doi: 10.18103/mra.v10i9.3021
Dwork, C. (2006). “Differential privacy,” in Automata, Languages and Programming, eds. M. Bugliesi, B. Preneel, V. Sassone, and I. Wegener (Berlin: Springer), 1–12.
EU (2016). Regulation (EU) 2016/679 of the European Parliament and of the Council of 27 April 2016 on the protection of natural persons with regard to the processing of personal data and on the free movement of such data, and repealing Directive 95/46/EC (General Data Protection Regulation) (Text with EEA relevance). Available online at: https://eur-lex.europa.eu/eli/reg/2016/679/oj/eng
European Comission (2004). “Commission asks workers and employers what action should be taken to combat musculoskeletal disorders,” in European Commission Press Release IP/04/1358. Available online at: https://ec.europa.eu/commission/presscorner/detail/en/ip_04_1358
Fink, G. (2009). “Stress: definition and history,” in Encyclopedia of Neuroscience, ed. L. R. Squire (Oxford: Academic Press), 549–555.
Gilley, K. N., Baroudi, L., Yu, M., Gainsburg, I., Reddy, N., Bradley, C., et al. (2022). Risk factors for COVID-19 in college students identified by physical, mental, and social health reported during the fall 2020 semester: observational study using the roadmap app and fitbit wearable sensors. JMIR Mental Health 9:e34645. doi: 10.2196/34645
Gjoreski, M., Gjoreski, H., Lutrek, M., and Gams, M. (2015). “Automatic detection of perceived stress in campus students using smartphones,” in 2015 International Conference on Intelligent Environments (IEEE), 132–135 .
Gjoreski, M., Luštrek, M., Gams, M., and Gjoreski, H. (2017). Monitoring stress with a wrist device using context. J. Biomed. Inform. 73, 159–170. doi: 10.1016/j.jbi.2017.08.006
González Ramírez, M. L., García Vázquez, J. P., Rodríguez, M. D., Padilla-López, L. A., Galindo-Aldana, G. M., and Cuevas-González, D. (2023). Wearables for stress management: a scoping review. Healthcare 11:2369. doi: 10.3390/healthcare11172369
Gradl, S., Wirth, M., Richer, R., Rohleder, N., and Eskofier, B. M. (2019). “An overview of the feasibility of permanent, real-time, unobtrusive stress measurement with current wearables,” in Proceedings of the 13th EAI International Conference on Pervasive Computing Technologies for Healthcare, PervasiveHealth'19 (New York, NY: Association for Computing Machinery), 360–365.
Hara, Y., and Yamaguchi, H. (2021). Japanese travel behavior trends and change under COVID-19 state-of-emergency declaration: Nationwide observation by mobile phone location data. Transport. Res. Interdiscipl. Perspect. 9:100288. doi: 10.1016/j.trip.2020.100288
Hood, L., and Price, N. (2023). The Age of Scientific Wellness: Why the Future of Medicine Is Personalized, Predictive, Data-Rich, and in Your Hands. Cambridge: Harvard University Press.
Jarczok, M. N., Weimer, K., Braun, C., Williams, D. P., Thayer, J. F., Gündel, H. O., et al. (2022). Heart rate variability in the prediction of mortality: A systematic review and meta-analysis of healthy and patient populations. Neurosci. Biobehav. Rev. 143:104907. doi: 10.1016/j.neubiorev.2022.104907
Järvelin-Pasanen, S., Sinikallio, S., and Tarvainen, M. P. (2018). Heart rate variability and occupational stress–systematic review. Ind. Health 56, 500–511. doi: 10.2486/indhealth.2017-0190
Kazdagli, H., Ozel, H. F., Ozturk, S., Ceylan, D., Erdeniz, B., Ozbek, M., et al. (2024). Electrophysiological detection of exam stress in health schools' students. Physiol. Int.111, 222–241. doi: 10.1556/2060.2024.00354
Kim, E.-J., and Dimsdale, J. E. (2007). The effect of psychosocial stress on sleep: a review of polysomnographic evidence. Behav. Sleep Med. 5, 256–278. doi: 10.1080/15402000701557383
Kinnunen, H., Rantanen, A., Kenttä, T., and Koskimäki, H. (2020). Feasible assessment of recovery and cardiovascular health: Accuracy of nocturnal HR and HRV assessed via ring PPG in comparison to medical grade ECG. Physiol. Measurem. 41:04NT01. doi: 10.1088/1361-6579/ab840a
Kirschbaum, C., Wolf, O. T., May, M., Wippich, W., and Hellhammer, D. H. (1996). Stress- and treatment-induced elevations of cortisol levels associated with impaired declarative memory in healthy adults. Life Sci. 58, 1475–1483. doi: 10.1016/0024-3205(96)00118-X
Klier, C., and Buratto, L. G. (2020). Stress and long-term memory retrieval: a systematic review. Trends in Psychiat. Psychothera. 42, 284–291. doi: 10.1590/2237-6089-2019-0077
Koskimäki, H., Kinnunen, H., Rönkä, S., and Smarr, B. (2019). “Following the heart: What does variation of resting heart rate tell about us as individuals and as a population,” in Adjunct Proceedings of the 2019 ACM International Joint Conference on Pervasive and Ubiquitous Computing and Proceedings of the 2019 ACM International Symposium on Wearable Computers, UbiComp/ISWC '19 Adjunct (New York, NY: Association for Computing Machinery), 1178–1181.
Laborde, S., Ackermann, S., Borges, U., D'Agostini, M., Giraudier, M., Iskra, M., et al. (2023). Leveraging vagally mediated heart rate variability as an actionable, noninvasive biomarker for self-regulation: assessment, intervention, and evaluation. Policy Insights Behav. Brain Sci. 10, 212–220. doi: 10.1177/23727322231196789
Laborde, S., Mosley, E., Bellenger, C., and Thayer, J. (2022). Editorial: Horizon 2030: innovative applications of heart rate variability. Front. Neurosci. 16:937086. doi: 10.3389/fnins.2022.937086
Laborde, S., Mosley, E., and Thayer, J. F. (2017). Heart rate variability and cardiac vagal tone in psychophysiological research-recommendations for experiment planning, data analysis, and data reporting. Front. Psychol. 8:213. doi: 10.3389/fpsyg.2017.00213
Laitinen, T., Hartikainen, J., Niskanen, L., Geelen, G., and Länsimies, E. (1999). Sympathovagal balance is major determinant of short-term blood pressure variability in healthy subjects. Am. J. Physiol. 276, H1245–1252. doi: 10.1152/ajpheart.1999.276.4.H1245
Lu, J. K., Wang, W., Goh, J., and Maier, A. B. (2025). Selecting wearable devices to measure cardiovascular functions in community-dwelling adults: application of a practical guide for device selection. Mayo Clinic Proc.: Digit. Health 3:100202. doi: 10.1016/j.mcpdig.2025.100202
Madison, A., and Kiecolt-Glaser, J. K. (2019). Stress, depression, diet, and the gut microbiota: Human-bacteria interactions at the core of psychoneuroimmunology and nutrition. Curr. Opin. Behav. Sci. 28, 105–110. doi: 10.1016/j.cobeha.2019.01.011
McCarney, R., Warner, J., Iliffe, S., van Haselen, R., Griffin, M., and Fisher, P. (2007). The Hawthorne effect: a randomised, controlled trial. BMC Med. Res. Methodol. 7:30. doi: 10.1186/1471-2288-7-30
Miller, D. J., Sargent, C., and Roach, G. D. (2022). A validation of six wearable devices for estimating sleep, heart rate and heart rate variability in healthy adults. Sensors 22:6317. doi: 10.3390/s22166317
Mozos, O. M., Sandulescu, V., Andrews, S., Ellis, D., Bellotto, N., Dobrescu, R., et al. (2017). Stress detection using wearable physiological and sociometric sensors. Int. J. Neural Syst. 27:1650041. doi: 10.1142/S0129065716500416
Neigel, P., Vargo, A., Komatsu, Y., Blakely, C., and Kise, K. (2023). “Exploring users' ability to choose a proper fit in smart-rings: a year-long “in the wild” study,” in Human-Computer Interaction-INTERACT 2023, volume 141415 of Lecture Notes in Computer Science, eds. J. Abdelnour Nocera, M. Kristín Lárusdóttir, H. Petrie, A. Piccinno, and M. Winckler (Cham: Springer Nature Switzerland), 486–490.
Neubauer, T., and Heurix, J. (2011). A methodology for the pseudonymization of medical data. Int. J. Med. Inform. 80, 190–204. doi: 10.1016/j.ijmedinf.2010.10.016
O'Connor, P. J., Crowley, M. A., Gardner, A. W., and Skinner, J. S. (1993). Influence of training on sleeping heart rate following daytime exercise. Eur. J. Appl. Physiol. Occup. Physiol. 67, 39–42. doi: 10.1007/BF00377702
Ong, J. L., Golkashani, H. A., Ghorbani, S., Wong, K. F., Chee, N. I. Y. N., Willoughby, A. R., et al. (2024). Selecting a sleep tracker from EEG-based, iteratively improved, low-cost multisensor, and actigraphy-only devices. Sleep Health 10, 9–23. doi: 10.1016/j.sleh.2023.11.005
Oura (2020). Technology in the Oura Ring. Available online at: https://ouraring.com/blog/ring-technology/ (Accessed February 1, 2024).
Oura (2021). Oura Blog: Body Temperature. Available online at: https://support.ouraring.com/hc/en-us/articles/360025587493-Body-Temperature (Accessed February 1, 2024).
Oura (2022a). Oura Blog: Heart Rate Graph. Available online at: https://support.ouraring.com/hc/en-us/articles/4410656562579-Heart-Rate-Graph (Accessed February 1, 2024).
Oura (2022b). Troubleshooting Gaps in Heart Rate Graphs. Available online at: https://support.ouraring.com/hc/en-us/articles/360025446954-Troubleshooting-Gaps-in-Heart-Rate-Graphs (Accessed February 1, 2024).
Pabon, E., Greenlund, I. M., Carter, J. R., and de Wit, H. (2022). Effects of alcohol on sleep and nocturnal heart rate: relationships to intoxication and morning-after effects. Alcohol. Clin. Exp. Res. 46, 1875–1887. doi: 10.1111/acer.14921
Pakhomov, S. V. S., Thuras, P. D., Finzel, R., Eppel, J., and Kotlyar, M. (2020). Using consumer-wearable technology for remote assessment of physiological response to stress in the naturalistic environment. PLoS ONE 15:e0229942. doi: 10.1371/journal.pone.0229942
Park, W.-C., Seo, I., Kim, S.-H., Lee, Y.-J., and Ahn, S. V. (2017). Association between resting heart rate and inflammatory markers (white blood cell count and high-sensitivity C-reactive protein) in healthy Korean people. Korean J. Fam. Med. 38, 8–13. doi: 10.4082/kjfm.2017.38.1.8
Prinsloo, G. E., Rauch, H. G. L., Lambert, M. I., Muench, F., Noakes, T. D., and Derman, W. E. (2011). The effect of short duration heart rate variability (HRV) biofeedback on cognitive performance during laboratory induced cognitive stress. Appl. Cogn. Psychol. 25, 792–801. doi: 10.1002/acp.1750
Reddin, C., Murphy, R., Hankey, G. J., Judge, C., Xavier, D., Rosengren, A., et al. (2022). Association of psychosocial stress with risk of acute stroke. JAMA Netw. Open 5:e2244836. doi: 10.1001/jamanetworkopen.2022.44836
Richter-Levin, G., and Xu, L. (2018). How could stress lead to major depressive disorder? IBRO Reports 4, 38–43. doi: 10.1016/j.ibror.2018.04.001
Rozanski, A., Blumenthal, J. A., and Kaplan, J. (1999). Impact of psychological factors on the pathogenesis of cardiovascular disease and implications for therapy. Circulation 99, 2192–2217. doi: 10.1161/01.CIR.99.16.2192
Sano, A., Taylor, S., McHill, A. W., Phillips, A. J., Barger, L. K., Klerman, E., et al. (2018). Identifying objective physiological markers and modifiable behaviors for self-reported stress and mental health status using wearable sensors and mobile phones: observational study. J. Med. Internet Res. 20:e210. doi: 10.2196/jmir.9410
Schubert, C., Lambertz, M., Nelesen, R. A., Bardwell, W., Choi, J. B., and Dimsdale, J. E. (2009). Effects of stress on heart rate complexity–A comparison between short-term and chronic stress. Biol. Psychol. 80:325–332. doi: 10.1016/j.biopsycho.2008.11.005
Scott, K. A., Melhorn, S. J., and Sakai, R. R. (2012). Effects of chronic social stress on obesity. Curr. Obes. Rep. 1:16–25. doi: 10.1007/s13679-011-0006-3
Seabold, S., and Perktold, J. (2010). “Statsmodels: econometric and statistical modeling with python,” in 9th Python in Science Conference.
Semple, J. (1993). “Jeremy bentham and the origins of the panopticon,” in Bentham's Prison: A Study of the Panopticon Penitentiary, ed. J. Semple (Oxford: Oxford University Press).
Setz, C., Arnrich, B., Schumm, J., La Marca, R., Tröster, G., and Ehlert, U. (2010). Discriminating stress from cognitive load using a wearable EDA device. IEEE Trans. Inform. Technol. Biomed. 14, 410–417. doi: 10.1109/TITB.2009.2036164
Shaffer, F., and Ginsberg, J. P. (2017). An overview of heart rate variability metrics and norms. Front. Public Health 5:258. doi: 10.3389/fpubh.2017.00258
Shin, G. D., Jeong, W., and Lee, H.-E. (2023). Factors affecting female college students' intention to use digital technology in wearable devices to stimulate health monitoring. Heliyon 9:e18118. doi: 10.1016/j.heliyon.2023.e18118
Stojchevska, M., Steenwinckel, B., Van Der Donckt, J., De Brouwer, M., Goris, A., De Turck, F., et al. (2022). Assessing the added value of context during stress detection from wearable data. BMC Med. Inform. Decis. Mak. 22:268. doi: 10.1186/s12911-022-02010-5
Stubberud, A., Buse, D. C., Kristoffersen, E. S., Linde, M., and Tronvik, E. (2021). Is there a causal relationship between stress and migraine? Current evidence and implications for management. J. Headache Pain 22:155. doi: 10.1186/s10194-021-01369-6
Svensson, T., Madhawa, K., Nt, H., Chung, U., and Svensson, A. K. (2024). Validity and reliability of the Oura Ring Generation 3 (Gen3) with Oura sleep staging algorithm 2.0 (OSSA 2.0) when compared to multi-night ambulatory polysomnography: a validation study of 96 participants and 421,045 epochs. Sleep Med. 115, 251–263. doi: 10.1016/j.sleep.2024.01.020
Sweeney, L. (2002). K-anonymity: a model for protecting privacy. Int. J. Uncertain. Fuzziness Knowl.-Based Syst. 10, 557–570. doi: 10.1142/S0218488502001648
Takahashi, S., Yamada, S., Sasaki, S., Minato, Y., Takahashi, N., Kudo, K., et al. (2022). Increase in people's behavioural risks for contracting COVID-19 during the 2021 New Year holiday season: Longitudinal survey of the general population in Japan. BMJ Open 12:e054770. doi: 10.1136/bmjopen-2021-054770
Thapliyal, H., Khalus, V., and Labrado, C. (2017). Stress detection and management: a survey of wearable smart health devices. IEEE Consumer Electron. Magaz. 6, 64–69. doi: 10.1109/MCE.2017.2715578
Tseng, T.-H., Chen, H.-C., Wang, L.-Y., and Chien, M.-Y. (2020). Effects of exercise training on sleep quality and heart rate variability in middle-aged and older adults with poor sleep quality: A randomized controlled trial. J. Clin. Sleep Med. 16, 1483–1492. doi: 10.5664/jcsm.8560
Ueafuea, K., Boonnag, C., Sudhawiyangkul, T., Leelaarporn, P., Gulistan, A., Chen, W., et al. (2021). Potential applications of mobile and wearable devices for psychological support during the COVID-19 pandemic: a review. IEEE Sens. J. 21, 7162–7178. doi: 10.1109/JSEN.2020.3046259
Umematsu, T., Sano, A., Taylor, S., and Picard, R. W. (2019). “Improving students' daily life stress forecasting using lstm neural networks,” in 2019 IEEE EMBS International Conference on Biomedical and Health Informatics, BHI 2019 - Proceedings (Piscataway, NJ: Institute of Electrical and Electronics Engineers Inc.), 8834624.
van Kraaij, A. W. J., Schiavone, G., Lutin, E., Claes, S., and Hoof, C. V. (2020). Relationship between chronic stress and heart rate over time modulated by gender in a cohort of office workers: cross-sectional study using wearable technologies. J. Med. Internet Res. 22:e18253. doi: 10.2196/18253
Vargo, A., Neigel, P., and Kise, K. (2023). Considering wearable health tracking devices and pandemic preparedness for universities. IEEE Pervasive Comp. 22, 35–44. doi: 10.1109/MPRV.2023.3322460
Vildjiounaite, E., Huotari, V., Kallio, J., Kyllönen, V., Mäkelä, S.-M., and Gimel'farb, G. (2019). Unobtrusive assessment of stress of office workers via analysis of their motion trajectories. Pervasive Mob. Comput. 58:9. doi: 10.1016/j.pmcj.2019.05.009
Vrijkotte, T. G. M., van Doornen, L. J. P., and de Geus, E. J. C. (2000). Effects of work stress on ambulatory blood pressure, heart rate, and heart rate variability. Hypertension 35, 880–886. doi: 10.1161/01.HYP.35.4.880
Wijsman, J., Grundlehner, B., Liu, H., Hermens, H., and Penders, J. (2011). “Towards mental stress detection using wearable physiological sensors,” in Annual International Conference of the IEEE Engineering in Medicine and Biology Society (Boston, MA: IEEE Engineering in Medicine and Biology Society), 1798–1801.
Keywords: wearables, rings, wellness, stress, in-the-wild
Citation: Neigel P, Vargo A, Tag B and Kise K (2025) Unobtrusive stress detection using wearables: application and challenges in a university setting. Front. Comput. Sci. 7:1575404. doi: 10.3389/fcomp.2025.1575404
Received: 12 February 2025; Accepted: 04 July 2025;
Published: 18 August 2025.
Edited by:
Xiao Liu, Deakin University, AustraliaReviewed by:
Robet L. Drury, ReThink Health, United StatesSamaneh Madanian, Auckland University of Technology, New Zealand
Copyright © 2025 Neigel, Vargo, Tag and Kise. This is an open-access article distributed under the terms of the Creative Commons Attribution License (CC BY). The use, distribution or reproduction in other forums is permitted, provided the original author(s) and the copyright owner(s) are credited and that the original publication in this journal is cited, in accordance with accepted academic practice. No use, distribution or reproduction is permitted which does not comply with these terms.
*Correspondence: Peter Neigel, c3cyMzgyNHFAc3Qub211LmFjLmpw