 Polyzois Bountzis1,2*
 Dimitris Kavallieros2
 Theodora Tsikrika2
 Stefanos Vrochidis2
 Ioannis Kompatsiaris2
- 1Department of Mathematics and Physics, University of Campania “L. Vanvitelli”, Caserta, Italy
- 2Information Technologies Institute (ITI), Centre for Research and Technology Hellas (CERTH), Thessaloniki, Greece
Introduction: The integration of deep learning models into Network Intrusion Detection Systems (NIDS) has shown promising advancements in distinguishing normal network traffic from cyber-attacks due to their capability to learn complex non-linear patterns. These approaches typically rely on both benign and malicious network traffic during training. However, in many organizations, collecting malicious traffic is challenging due to privacy restrictions, high costs of manual labeling, and requirement for advanced security expertise.
Methods: In this study, we introduce a deep one-class classification model that is trained exclusively on flow-based benign network traffic data, with the goal of identifying attacks during inference. The proposed anomaly detection model consists of two steps, a One-Class Support Vector Machine (OC-SVM) and a deep AutoEncoder (AE). While autoencoders have shown great potential in anomaly detection, their effectiveness can be undermined by spurious network activity located on the boundaries of their discriminating capabilities, thus failing to identify malicious behavior. Our model leverages the topological structure of the OC-SVM to generate decision scores for each traffic flow, which are subsequently incorporated into an autoencoder as part of the input feature space.
Results: This approach enhances the ability of the autoencoder to detect incidents that deviate from normal patterns. Furthermore, we propose a heuristic method for tuning the trade-off parameter of the OC-SVM, based only on one-class data, achieving comparable performance to grid-based methods that require both benign and malicious labeled data. Experimental results on a benchmark network intrusion data set, the UNSW-NB15, suggest that OCSVM-AE performs well on unseen attacks and is more effective than traditional and deep-learning based one-class classifiers.
Discussion: The method makes no specific assumptions about the data distribution, making it broadly applicable and suitable as a complementary tool to signature-based intrusion detection systems.
1 Introduction
Network Intrusion Detection Systems (NIDS) play a crucial role in the defense strategy of modern cybersecurity infrastructure, tasked with the identification of malicious traffic at the edge of a network. This protective layer ensures the security of network-connected devices, such as personal computers, mobile units, and server infrastructures, against unauthorized intrusions and security breaches (Tidjon et al., 2019). Signature-based NIDS have been widely adopted for their superior effectiveness in identifying threats when compared to other network security methodologies. These systems operate by comparing network traffic against a database of known attack signatures, which are indicative of malicious activity.
As networks grow more complex and interconnected, particularly with the rise of the Internet of Things (IoT), traditional signature-based NIDS approaches often struggle with high false positive rates and poor generalization to novel attacks (Thakkar and Lohiya, 2022). In addition, obtaining labeled anomalous data becomes a major challenge due to several factors, including data sensitivity, the need for expert annotation, and high labeling costs (Nicolau et al., 2018). Network administrators often avoid sharing intrusion-related data, as it may expose system vulnerabilities or compromise user privacy. At the same time, the increased volume of network data, especially in IoT environments, along with the surge of sophisticated cyber threats make it extremely difficult to reliably detect, extract, and annotate malicious activity. This process demands significant time, domain expertise, and computational resources, which are often limited in real-world networks. To address these challenges, recent research increasingly turns to anomaly detection methods, which offer promising capabilities in identifying previously unseen threats without relying on extensive labeled anomalous data. Anomaly-based NIDS aim to effectively learn the patterns of normal (benign) network traffic and classify as an anomaly (malicious activity) any behavior that deviates from this distribution, independently of its type (Ahmed et al., 2016). This is based on the assumption that patterns of previously unknown malicious activity are more similar to past attacks than to normal incidents. This type of intrusion detection systems is a common case in deployed network environments where often only labeled normal activity is available for training a model.
Anomaly detection approaches that are based solely on labeled instances from normal activity during the learning process, operate in a semi-supervised mode and are known as one-class classification techniques (Chandola et al., 2009). A model, called classifier, learns from a set of normal labeled data instances (training phase) and then, classifies a test instance as benign or malicious (testing phase). The main assumption is that the model can learn to distinguish between benign and malicious activity based on the feature space of the normal training data set. An advantage of the one-class classifiers is that they can be easily trained on any environment, without the need of a security expert collecting and labeling both benign and malicious network traffic or relying on a benchmark data set for training the model.
A surge of machine learning (ML) and deep learning (DL) techniques has emerged in recent years within the scope of anomaly detection, to enhance the effectiveness of NIDS (Ahmad et al., 2021). One well-suited model for this type of anomaly detection problem is the class of Autoencoders (AEs) (Rumelhart et al., 1985), a neural network used for handling non-linear, high-dimensional data sets. Its architecture consists of two parts: an encoder that refines the input data into a lower-dimensional latent representation and a decoder that attempts to reconstruct the original input from this compressed form. This latent space, known as the bottleneck layer, forces the AE to map the characteristics of the input data into a lower-dimensional space. When applied to the one-class classification setting, AEs are trained exclusively on normal data, learning to minimize reconstruction errors for instances similar to their training set. Consequently, in the testing phase anomalies are identified through significantly higher reconstruction errors, as these samples deviate from the distribution of the normal training data. In this type of networks, we assume that similar input patterns can be mapped to similar output ones, making the reconstruction error a reliable metric for spotting outliers.
However, the assumption that anomalies produce higher reconstruction errors might not always hold true. In particular, Gong et al. (2019) observed that some anomalies might share similar patterns with normal training incidents—a common scenario when anomalies correspond to malicious activity, which by design often mimics normal behavior—thus leading to small reconstruction errors when they are given as input to an AE. Another issue is that AEs could generalize so “well” that anomaly inputs will be mapped to latent representations similar to the normal ones, resulting to small reconstruction errors as well (Zong et al., 2018).
One-Class Support Vector Machine (OC-SVM) represents another widely used one-class classification method for anomaly detection (Schölkopf et al., 2001). OC-SVM main objective during the training phase is to find a half-space, that encloses most of the normal incidents under the constraint of maximum distance from an origin point. During the testing phase if a data point falls within this half-space it is classified as normal, otherwise it is considered an anomaly. Along with the label, the model outputs a decision value, i.e, the distance of the testing incident from the boundary of the half-space.
A challenge during the optimization of the OC-SVM is the selection of the hyper-parameter, nu, that controls the trade-off between the proportion of data points that are allowed to be on the negative (anomalies) and positive (normal incidents) side of the fitted hyperplane, respectively. Although, we assume a training set that consists of normal activity, outliers or missed malicious incidents might exist, thus the choice of the trade-off parameter is crucial (Wang et al., 2018). Commonly used fine-tuning approaches for choosing this hyper-parameter, such as grid-space methods require information of both labels, essentially rendering it a supervised approach. Furthermore, the default value provided by standard software packages, like scikit-learn (Pedregosa et al., 2011), is not tailored to the specific data set characteristics, potentially leading to sub-optimal performance. As a result, hyper-parameter selection of OC-SVM remains a challenging open problem and many attempts have been made to tackle this problem, which will be reviewed in
For this reason, we propose a heuristic method that exploits the inherent characteristics of the one-label data set (normal incidents) instead of relying on information from both classes, making it particularly suited for real-world tasks. We introduce an index that indicates the optimal trade-off parameter based on the assumption that an effective separation of the outliers (e.g., missed anomalies merged with normal incidents) from high-density areas within the normal labeled data during the training phase, is crucial for enhancing the model's ability to distinguish between normal and anomalous incidents in the testing phase. We validated this hypothesis on a benchmark data set, demonstrating that our approach yields metrics that are comparable with those obtained by supervised grid-search methods. The results reveal the significant gain of our tuning strategy over default configurations, illustrating the potential of the approach as a hyper-parameter tuning strategy in OC-SVMs.
In this work, we propose a two-step deep classifier for anomaly-based network intrusion detection, within a learning framework where the training and optimization of the model is performed solely on benign network traffic. The first stage of the proposed two-tier framework, involves the OC-SVM, whose output, the decision values, are subsequently fed into an AE as part of the input feature space (second-stage). The decision values can be interpreted as a measure of similarity/dissimilarity relative to the learned normal patterns of the OC-SVM, thus providing additional information that enhances the discriminating capabilities of the AE.
The main contributions of our work can be summarized as follows:
• We propose a two-step deep classifier for network anomaly detection that augments the performance of AE by taking into account the topological properties of the OC-SVM. The additional information that is incorporated to the feature space enhances the detection capabilities of the AE.
• We propose a semi-supervised heuristic method to tune the trade-off parameter of OC-SVM. In this way, the proposed model can be optimized in the setting where only normal data is available during training and validation.
• We evaluate the proposed approach on a subset of the benchmark network data set UNSW-NB15v2 (Sarhan et al., 2022). We show that a power-law relation exists between data set size and performance (generalization error), which allows us to compare models using smaller training sets, as performance is expected to scale proportionally across different models.
• We conduct a performance comparison between the proposed model, OCSVM-AE, and traditional as well as deep anomaly detection models. Our method performs well on detecting malicious activity and is more effective that the competing baselines.
This paper is organized as follows. In Section 2, we present some key related works of one-class classification approaches for NIDS, whereas in Section 3 we introduce the proposed OCSVM-AE method along with the new heuristic approach for OC-SVM parameter tuning. The data set information and the results on the performance of our method are presented in Section 4. Finally, discussion and concluding remarks are provided in Sections 5 and 6, respectively.
2 Related work
One of the major challenges in designing effective NIDS is the limited availability of labeled anomalous data. This scarcity makes it difficult to train traditional supervised models, especially for identifying novel or evolving threats. To address this, anomaly detection approaches that leverage semi-supervised learning have become increasingly prominent. These methods rely solely on normal data during the training phase and aim to identify deviations from learned normal behavior at testing phase. Representative approaches in this category include OC-SVM (Zhang et al., 2015), Local Outlier Factor (LOF), and Isolation Forest (IF) (Zhang et al., 2017).
Several state-of-the-art NIDS approaches have also incorporated deep learning models such as AEs. Kitsune (Mirsky et al., 2018) employs an ensemble of AEs for online intrusion detection, offering real-time protection without the need for manual supervision. Meidan et al. (2018) applied deep AEs to detect IoT botnets attacks, evaluating their performance on real network traffic data, originating from nine IoT devices infected by authentic botnets. This paper focuses on a network intrusion detection system designed to spot Distributed Denial of Service (DDoS) attacks in industrial control systems using deep autoencoders. Ortega-Fernandez et al. (2024) focused on a network intrusion detection system aimed at detecting DDoS attacks in industrial control systems using deep AEs. Their AE was trained on network flow-based traffic and tested primarily against DDoS attacks. The model demonstrated low false positive rates and near real-time performance.
Zavrak and Iskefiyeli (2020) proposed a similar strategy using Variational Autoencoders (VAE) to detect anomalies in the CICIDS2017 flow-based data set. Their findings suggest that VAE outperform both AE and OC-SVM in most cases. However, their study lacks a systematic optimization procedure. OC-SVM was evaluated using default parameters, and a fixed network architecture was adopted, limiting insights into the models full potential.
Many studies have introduced hybrid methods to combine AEs with an additional layer. Mhamdi et al. (2020) firstly trained an AE to represent the patterns of normal traffic obtained from the CICIDS2017 NIDS data set and subsequently fed the compressed data that is extracted from the bottleneck layer as an additional feature to the OC-SVM. However, the evaluation lacks diversity in attack types, and it is unclear whether the optimization was conducted in a semi-supervised setting. Gong et al. (2019) introduced the concept of memory-augmented autoencoder, MemAE, to improve anomaly detection by learning prototypical elements of normal data, based on the observation that many anomaly inputs might be reconstructed well from the autoencoder, due to similar feature patterns. During the reconstruction process, the memory module retrieves the most relevant memory items based on the input query generated by the encoder. This retrieval mechanism allows MemAE to access important information stored in memory for reconstruction (Zong et al., 2018). A deep one-class learning technique known as Deep Support Vector Data Description (Ruff et al., 2018) is used by Sarhan et al. (2023) to map input features to an enhanced low-dimensional embedding, which is subsequently used by a Histogram-Based Outlier Score for anomaly detection. Their model is evaluated on two flow-based NIDS data sets, the NF-UNSW-NB15-v2 and NF-CSE-CIC-IDS2018-v2.
Graph Neural Networks (GNNs) have emerged as powerful tools for anomaly detection by modeling structures between the data. A representative approach for semi-supervised anomaly detection is LUNAR (Goodge et al., 2022). This work proposes a framework which integrates classical local outlier detection techniques, such as LOF and DBSCAN, with graph-based learning. Data instances are represented as nodes within a graph, with edges linking each node to its k-nearest neighbors. However, determining an appropriate value for k becomes challenging in high-dimensional spaces, where traditional distance metrics often lose their discriminative power. Despite the growing use of GNNs in anomaly detection tasks, their adoption within the anomaly-based NIDS domain has been limited. DynKDD (Mir et al., 2025), is a recent effort to incorporate a series of time-based graph snapshots of the NSL-KDD dataset to capture how network behavior evolves over time. However, DynKDD is inherently designed for sequential data and temporal graph modeling, whereas our approach is tailored to static flow-based features. Table 1 summarizes key approaches in recent literature, highlighting the novelty of the proposed OCSVM-AE method.
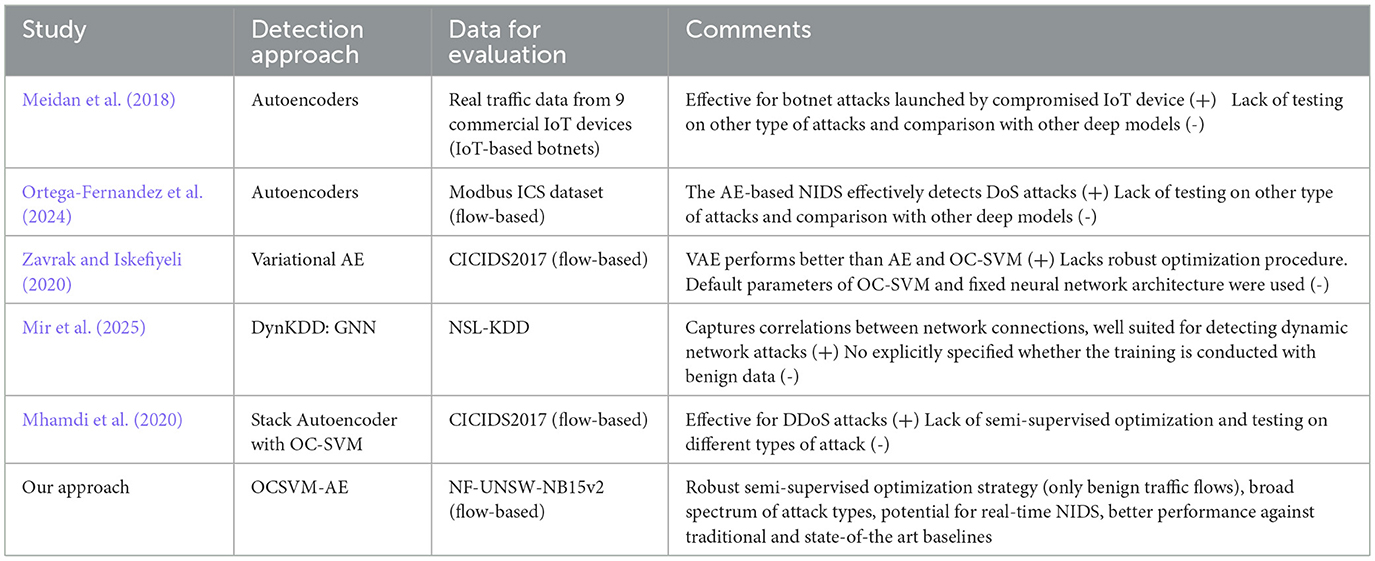
Table 1. Prior studies conducted on the detection of flow-based malicious activity using one-class classification methods.
A major challenge for one-class classification approaches lies in selecting appropriate hyper-parameter optimization strategies. Although many studies are labeled as semi-supervised, they often rely on labeled benign and malicious data for tuning, which limits their generalizability in real-world scenarios where such labels are typically unavailable. AEs, on one hand, can be fine-tuned by evaluating their ability to reconstruct patterns of normal data on a hold-out validation set, typically using metrics such as Mean Squared Error (MSE). In contrast, hyper-parameter tuning for OC-SVMs is less straightforward. For OC-SVMs, two key hyper-parameters need to be be determined: (1) the kernel function K(), which maps the input data to a higher-dimensional feature space to handle non-linearity, and (2) the trade-off parameter nu, which controls the fraction of training data to be included in the negative side of the decision boundary (i.e., potential outliers).
Xiao et al. (2014) showed that when a Gaussian kernel is adopted, the normalized distances from sample mappings to the OC-SVM hyper-plane effectively reflect the distance to the enclosing surfaces. Thus, using the geometric locations of edge and interior sample mappings in the feature space, they proposed a measure that provided a suitable Gaussian kernel width.
For the trade-off parameter, nu, there are few heuristic strategies available. Some studies set nu = 0 under the assumption that all training data consists of normal incidents (Ruff et al., 2018); however, this might not be an appropriate choice when the training set contains noisy or mislabeled instances. Ratsch et al. (2002) proposed a heuristic based on the assumption that outliers are sufficiently distant from normal samples; therefore, by increasing nu, we reach a point that maximizes the separation between normal and rejected incidents. However, in case of no clear boundaries between the samples, this proposed heuristic will give trivial outputs, i.e., nu = 0 or nu = 1.
An unsupervised heuristic method proposed by Ghafoori et al. (2016) uses a variation of the elbow method to optimize both the scaling parameter of the kernel function and nu. The scaling factor is increased until the occurrence of a break on the structure of normal incidents, which is expressed through their k-neighbors density. This break point is subsequently used to estimate nu and divide the training samples into three groups: outliers, border, and normal points.
In our work, we propose a simple tuning strategy to estimate nu. Specifically, we define an index based on the distribution of decision scores that captures the alignment of high-density regions and potential outliers. The optimal value of nu is identified as the point at which this alignment begins to break, revealing the boundary between normal and anomalous behavior.
To summarize, contrary to previous studies, in our approach we focus on enhancing the information incorporated into the feature space though the use of an OC-SVM, rather than taking advantage of the latent representations derived by the AEs. Additionally, we provide a clear semi-supervised optimization strategy (use of benign traffic flows during training and validation), and evaluate the model on a broad spectrum of attack types against traditional and state-of-the art baselines.
3 Methodology
In this section, we introduce OCSVM-AE, a method for network intrusion detection based on one-class classification. We present the two-tier anomaly detection framework designed to identify malicious activity in network environments. The architecture of our approach integrates two main components: (1) a OC-SVM which learns to enclose all the benign traffic flows within a tight boundary producing decision scores that indicate how confidently a sample belongs to the normal class. and (2) a deep AE, which receives as input an augmented feature vector that includes both the original feature space and the decision scores produced by OC-SVM. This architecture is designed to leverage the strengths of both models. Specifically, the OC-SVM is well-suited for learning a compact representation of benign behavior without requiring anomalous data. The extracted decision scores are especially valuable when clear class boundaries are difficult to establish from original features alone. Meanwhile, the AE is capable of learning compressed representations of the input and detecting deviations from normal patterns via reconstruction errors. Figure 1 illustrates the structure of the proposed system.
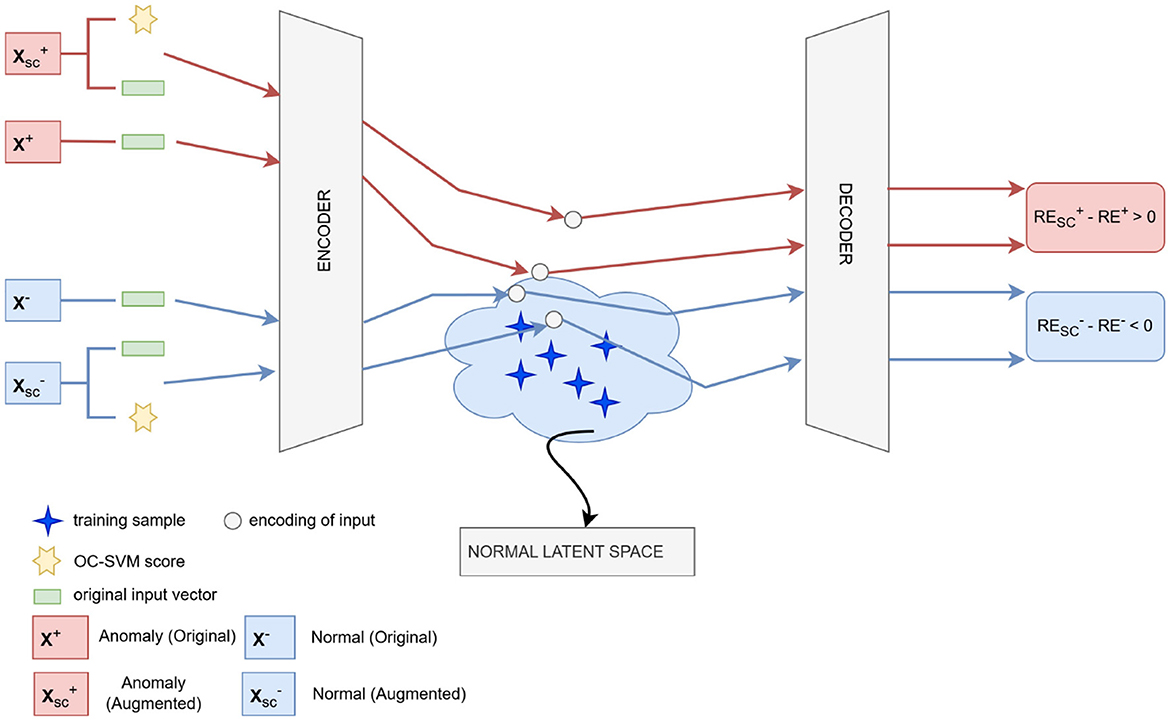
Figure 1. A schematic diagram of the proposed anomaly detection framework. Original, x, and augmented, xsc feature vectors–appended with the decision scores from the OC-SVM– are passed as inputs to the AE. The augmented feature vectors force the encodings (latent representation) either closer to the normal latent space (light blue cloud) for a normal sample, , or further away for an anomaly, . This leads to a smaller reconstruction error for the normal sample relative to the original feature vector (), and a higher one for the anomaly (). The figure was created by the authors, inspired by the visualization in Gong et al. (2019).
3.1 One-class support vector machine
OC-SVM can be considered an extension of the support vector machine algorithm to the case of one-class classification. The goal is to find a decision function, f(x), which returns positive values for samples, x, that lie within a target (normal) region and negative values, elsewhere. In the context of a NIDS, positive values correspond to benign activity, whereas negative values indicate potential malicious behavior. This makes OC-SVM particularly suitable for network intrusion detection settings, where training data often consists almost exclusively of benign traffic, while malicious incidents are rare, diverse, or even entirely unknown during the training of the model.
The OC-SVM is a kernel-based binary classifier that maps the non-linear high-dimensional data space, x ∈ Rd, through a mapping function Φ:x→F into a feature space F where a hyperplane can separate the normal instances from outliers. The objective of the OC-SVM during the training phase is to maximize the margin between the hyperplane and the origin point under the constraint that normal incidents lie in the positive side. The solution to this problem is based on a quadratic equation (Schölkopf et al., 2001) that maximizes the distance of the hyperplane from the origin and is given through the following optimization formula
where w corresponds to the normal vector of the hyperplane, m is the number of training samples, xi, and nu is the trade-off hyper-parameter of the model that determines the fraction of samples that can be considered outliers (works as an upper-bound). The selection of its value will be discussed later. The ξi are non-negative slack variables that allow some samples to fall outside the boundary, getting however penalized, and ρ is the distance between the origin and the hyperplane. The decision function takes the following form, f(x) = 〈w·Φ(xi)〉−ρ, and is expected to be positive for most samples xi contained in the training set.
Instead of solving the initial quadratic problem, we obtain the dual problem of OC-SVM based on the Lagrangian method
where K(xi, xj) = 〈Φ(xi, xj)〉 is a kernel function and αi are Lagrange coefficients computed for the optimization of the quadratic equation. Training examples xi with αi≠0 are called support vectors (SV) and are located either on the boundaries of the hyperplane or on the negative side (outliers). The kernel trick is used to map the data to a linear feature space and we use the Gaussian function , which essentially expresses the similarity among any two samples. Based on this transformation, the decision function takes the following form:
whose value we call decision score, representing the signed distance of each input from the learned boundary. During the testing phase, if f(x)≥0, then x is considered a benign incident; otherwise, it is labeled as malicious. In network environments, the decision score serves as a soft anomaly signal, reflecting how confidently a flow conforms to the learned profile of normal traffic. This makes it particularly valuable for use as an additional feature to models like the AEs, to enhance their ability to discriminate between benign and malicious samples.
3.2 Deep autoencoders
Autoencoders are a class of neural network models designed to learn compressed representations of input data through a process known as dimensionality reduction and to subsequently reconstruct the compressed vectors back into the original input. The architecture of the model consists of two main groups of layers: the encoder and the decoder.
The encoder E maps an input vector x ∈ ℝd to a latent representation z ∈ ℝp, where typically p<d, compressing the input into a lower-dimensional space. This mapping can be represented as z = E(x), where E:ℝd → ℝp. The decoder D, on the other hand, reconstructs the input from the latent representation, denoted as , where D:ℝp → ℝd.
The training objective for the AE is to minimize the difference between the original input x and its reconstruction , typically using the mean squared error (MSE) loss function: . By minimizing the reconstruction error (RE) over a data set consisting of normal incidents, the AE learns to capture the characteristic patterns of the one-label training set. In the context of network intrusion detection, deep AEs are particularly effective in capturing underlying patterns of normal traffic, even when such patterns are complex and non-linear. Their semi-supervised training setting aligns well with real-world NIDS settings, where malicious data is either sparse or unavailable during training.
During inference, the trained AE acts as an discriminator between benign and malicious incidents. It is expected to reconstruct normal instances with low error, whereas anomalies that deviate from the normal patterns will result in higher reconstruction errors, as the AE has not learned their structure during the training phase. Thus, the reconstruction error serves as an anomaly indicator: samples with an error exceeding a predefined threshold are classified as anomalies. However, when used alone, AEs may struggle to distinguish anomalies that closely resemble benign patterns in structure. To address this limitation, we propose incorporating OC-SVM derived decision scores into the AE's input.
3.3 Proposed architecture
The proposed OCSVM-AE model consists of two main components: an OC-SVM for the derivation of the decision scores and an AE that plays the role of the anomaly detector.
A key component of our approach involves the computation of decision scores by the OC-SVM, whose values reflect the relative position of each sample from the estimated hyperplane and can be used as a metric for the degree of anomaly for each instance. In particular, the larger a positive value is, the more confidently a sample can be considered normal, and vice versa. In this work, these decision scores are utilized to enhance the original feature set, creating an augmented data set that captures not only the inherent characteristics of the network data but also its anomaly level as determined by the OC-SVM. This data set is then given as an input vector to the AEs.
The main idea of the two-step anomaly detection process proposed in this work is illustrated in Figure 1. Specifically, after training the model on normal incidents (blue symbols in Figure 1), an anomaly sample, x+, and a normal sample, x−, are fed into the trained AE. These samples are also provided in an augmented form, appended with the decision scores from the OC-SVM, and denoted as , respectively. Figure 1 shows a case where the original inputs are located close to the boundaries of the normal latent space learned by the model, leading to similar reconstruction errors (RE+~RE−) and, consequently to poor discrimination between them. By incorporating as additional input features the corresponding decision scores (yellow hexagons in Figure 1) derived from the OC-SVM, the encodings (latent representations) are forced either closer to the normal latent space for the normal sample () or further away for the anomaly (). This leads to a smaller reconstruction error for the normal sample (), and a higher one, , for the anomaly, thus improving their separation. Essentially, the decision scores provide additional information regarding the degree of separation between the normal incidents and the malicious activity, enhancing the model's discriminative capacity.
In general, let us denote as
the mean scores of the normal incidents and the anomalies, respectively. N is the total number of samples and yi∈{0, 1} for i = 1, …, N, the corresponding labels with 0 and 1 corresponding to normal incidents and anomalies, respectively. Our assumption is that a sufficient large M>0 exists with so that
where correspond to the average reconstruction errors of the normal samples and the anomalies, respectively, whereas to the reconstruction errors of the enhanced feature vectors.
The overall structure of the proposed framework is outlined in the pseudocode of Figure 2. Algorithm 1 describes the training process, including the integration of OC-SVM decision scores with the AE input, while Algorithm 2 details the inference phase used for intrusion detection.
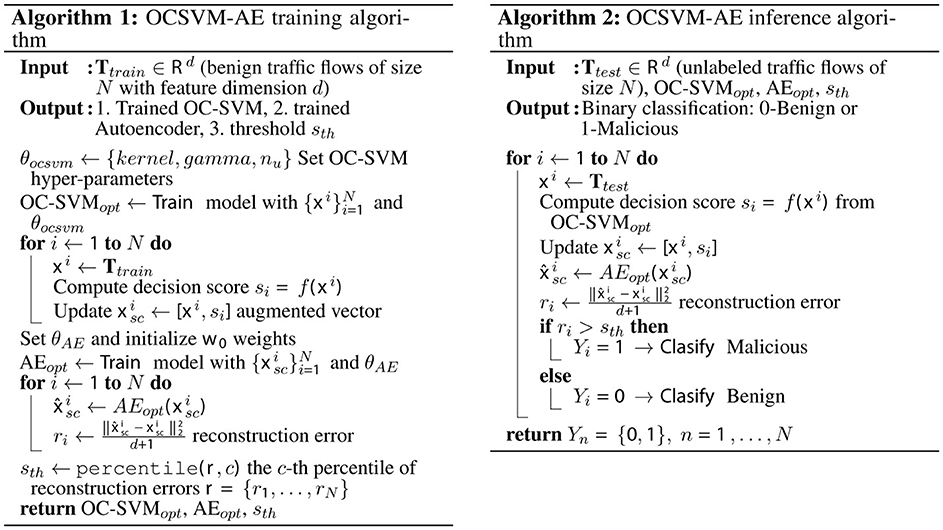
Figure 2. Training and inference procedures for the proposed OCSVM-AE method.
3.4 Heuristics for OC-SVM
As discussed in Section 3.1, the OC-SVM model has two hyper-parameters, the kernel function, K(), used for mapping the non-linear high-dimensional data into a linear space, and the trade-off parameter nu that corresponds to the probability a training sample to be found outside the boundaries of the half-space, reflecting the robustness of the fitted hyperplane. Very small values of nu lead to an extended hyperplane, forcing all samples to be on the positive side of the half-space including outliers. By increasing its value the boundary is tightened around the majority of the data.
The choice of the kernel function is usually trivial, with the non-linear Radial Basis Function (RBF) kernel, , with x, x′∈ℝp, being generally acceptable and highly effective. We have decided to keep it fixed for the rest of the study. However, the choice of the trade-off parameter nu, which is crucial in one-class classification problems, lacks commonly accepted procedures for its determination. This makes optimization more abstract and dependent on the specific characteristics of the data set and the problem at hand. For this reason, we will focus on the optimization of nu by proposing a method based on the use of the decision function.
The decision function, f(x), given by Equation 3, corresponds to the distance of each new sample x from the separating hyperplane. However, distance in the feature space induced by the RBF kernel is expressed in terms of similarity of each new sample, x, to the supporting vectors, xi. In particular, in high-density regions, which are located close to the support vectors, we will observe large values due to the exponential function in the RBF kernel K(xi, x) ( is small). This reflects the strong alignment with the learned "normal" pattern by the model. On the contrary, large negative values are indicators that the samples are well outside the normal target region defined by the fitted hyperplane of the OC-SVM, i.e., the sample's similarity to all support vectors is very low, insufficient to outweigh the model's threshold, ρ, for considering a point as normal.
Let first define the average decision score for each nu,
over all the normal incidents. Our idea is based on the existence of three distinct phases for the average decision score, which is illustrated as a schematic diagram in Figure 3. In particular, for very small nu values, the hyperplane will be forced to extend in order to include every sample within its boundaries. Due to the existence of outliers, this will lead to many small positive decision function scores, as dense areas of normal samples will be far from the frontier (see Figure 3 upper left panel for ). As nu increases, the robustness of the hyperplane is also increased. In particular, the boundary tightens, bringing closer more dense clusters of normal samples, yielding higher decision function scores due to their relative position and density (see Figure 3 upper middle panel for ). We call this phase one (PH-1), shown in Figure 3 lower panel. However, this behavior will hold until a certain critical point, phase two (PH-2), where a more stable behavior of will be observed. Increasing nu even more, we force the hyperplane to break the strong alignment of the normal samples, leading to more negative decision scores, phase three (see Figure 3 upper right panel for ) and consequently to the decrease of the average score (PH-3 in Figure 3 lower panel).
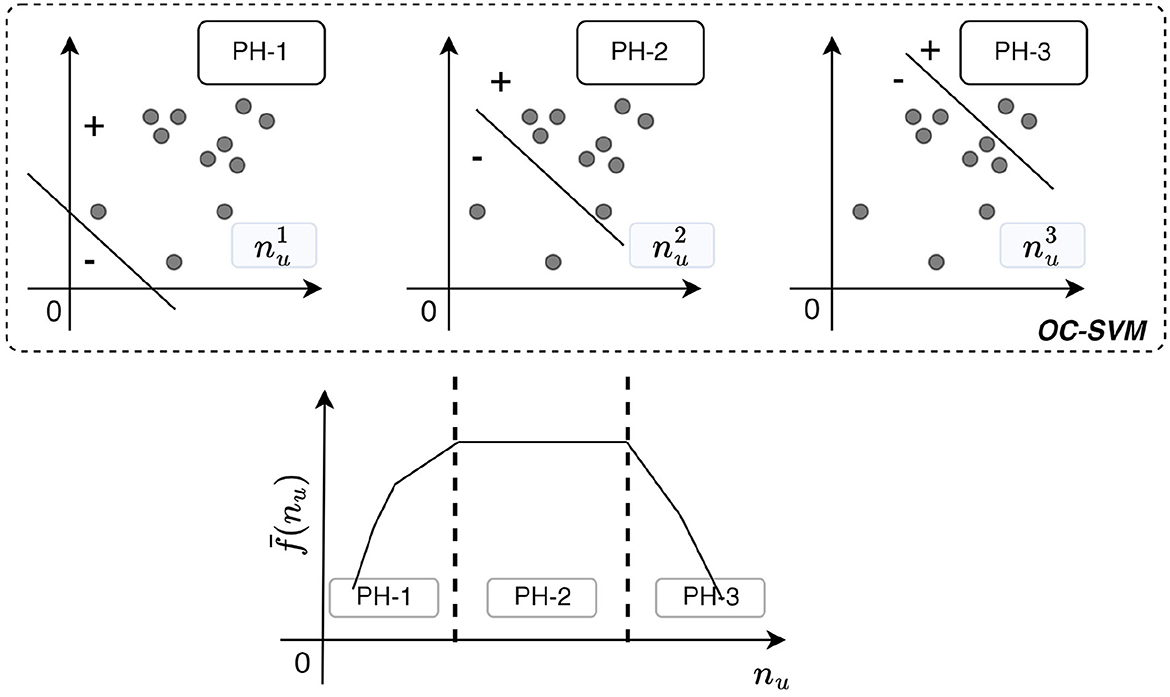
Figure 3. Schematic diagram for OC-SVM heuristic strategy. Points below the line are considered anomalies (minus index), whereas above the line lie the normal samples (plus index). Upper left panel: Fitted hyperplane for small nu, where outliers are considered normal samples (phase-one). Upper middle panel: Fitted hyperplane for nu that tightens the boundary with dense clusters of normal samples (phase-two). Upper right panel: Fitted hyperplane for large nu, here the structure of normal samples breaks from the hyperplane. Negative scores are dominant (phase-three). Lower panel: The behavior of the average decision score as a function of nu.
Essentially, our assumption is that increasing the compactness of the decision boundary, whose effect is governed by the trade-off parameter nu, we will minimize the binary misclassification. This critical point corresponds to the transition from PH-1 to PH-2 (Figure 3), i.e., an abrupt change in the slope of , and can be used as an index for the selection of the hyper-parameter nu, free from any assumption on the distribution of the anomalies. Intuitively, a good separation is achieved if there is a good separation between outliers and high density areas of normal incidents. In Section 4.7, we perform experiments for the evaluation of the strategy.
4 Experiments
In this section, the evaluation of the proposed OCSVM-AE model for anomaly detection is performed on a modern network traffic data set that includes a variety of attacks. The details of the data set along with the experimental setup and the performance measures are provided in the following subsections. The results are compared with several baseline models including different versions.
4.1 Environment configuration
All experiments in this study were conducted in a controlled computational environment. The hardware configuration included an Intel(R) Xeon(R) Gold 5218R CPU 2.10GHz and 62 GB of RAM. The software environment consisted of Ubuntu 20.04.6 LTS as the operating system, with Python 3.10.16 as the primary programming language. Code development was performed using Visual Studio Code. The implementation utilized standard Python libraries, including PyOD 2.0.5, Pandas 2.2.3, NumPy 1.26.4, Keras 2.11.0, TensorFlow 2.11.0, scikit-learn 1.5.1, and Matplotlib 3.9.2. (Hunter, 2007).
4.2 Data set
The proposed model framework is evaluated on the version 2 of the NetFlow-based (Claise, 2004) UNSW-NB15 data set. This is a standard representation format of network flows, each defined as a sequence of packets that share common source/destination IP address, port numbers, or L4 protocol. The UNSW-NB15 data set (Moustafa and Slay, 2015) represents a significant advancement in the field of NIDS, designed to overcome limitations of older benchmark data sets, such as KDD-Cup99 (Tavallaee et al., 2009), by incorporating a broader range of modern network behaviors and sophisticated cyber-attacks. This data set is a product of a simulated environment, released by the cyber range lab of the Australian Centre for Cyber Security, involving a traffic generator capable of producing a wide variety of both normal and malicious network activities. The data set contains 2, 295, 222 (96.02%) benign and 95, 053 (3.98%) malicious samples, respectively, resulting to, 2, 390, 275 traffic flows in total, covering a range of attack types, including, backdoors, denial of service (DoS), exploits, generic, reconnaissance, shellcode, and worms (see Table 2). The diverse nature of the traffic generated ensures that the data set reflects real-world network scenarios, providing a robust benchmark data set for the testing of NIDS solutions. For the purposes of our proposed NIDS framework, which is focused on distinguishing between benign and malicious traffic regardless of the attack type, we reclassified each flow into one of two categories: benign and malicious, encompassing all types of attack-related flows.
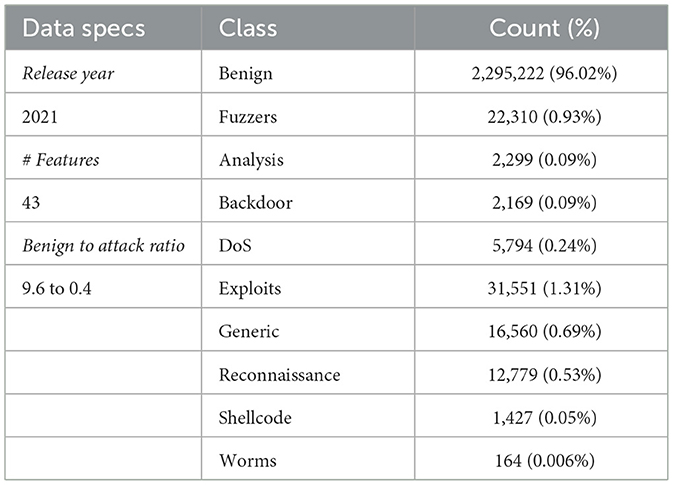
Table 2. Specification of UNSW-NB15v2 data set and class distribution.
The version 2 of the NetFlow format (Sarhan et al., 2022) provides an extended set of the UNSW-NB15 feature vector, with 43 features, originally comprised of 12 flow-based features (Sarhan et al., 2021). This extensive feature set enables a detailed analysis of network traffic, facilitating the identification of subtle patterns and characteristics indicative of malicious activity.
4.3 Data pre-processing
Network traffic data comprises various types of variables, including categorical (e.g., protocol types, port numbers), continuous (e.g., duration), and discrete (e.g., packet counts) variables. As a first step, we proceed to the extraction of categorical features from the data, such as source and destination IP addresses, port numbers, and protocols, keeping only numerical-type features, such as the number of bytes or packets per traffic flow. Although techniques for incorporating information such as IP addresses and port numbers exist (Lopez-Martin et al., 2021), our main focus lies on evaluating the performance of our proposed model, rather than optimizing the selection of features for the context of NIDS.
Next, we remove samples with NaN and infinite values, and finally, we drop constant and quasi-constant features that hold the same value for at least q = 90% of the data, which we deem to be a reasonable value. These features are characterized by minimal variability, resulting in low or even zero predictive power for any model. Moreover, by removing these features, we simplify the model's structure, decreasing the computational complexity and the risk of over-fitting.
Next, the traffic flows are normalized based on the min-max scaling procedure, to avoid large ranges in the feature values due to the existence of outliers. The performance of machine learning models increases on normalized data sets, reducing the potential bias in the results as an effect of dominance of large-scale features in the optimization procedure.
Moreover, the Mutual Information (MI) method is used to select important features in terms of the contribution of each one to the target labels. MI output is a non-negative value, which quantifies the dependency between two variables. A value equal to zero indicates independence, whereas higher values mean higher dependency, so the score obtained between each feature and the class label enables selecting the most relevant ones. After computing the importance of each feature, we perform a ranking based on their normalized values, selecting them in descending order. The selection continuous until the cumulative importance of the selected features surpasses a correlation threshold of corrthr = 0.95, aiming to retain features that account for at least 95% of the information relevant to the class labels. Given the volume of our data set, we prioritize on the inclusion of as much information as possible to enhance the predictive power of the model. At the end of this process, irrelevant features are discarded. The final number of selected features is 18. Figure 4 illustrates the pre-processing steps applied to the network traffic data set, as described in the section.
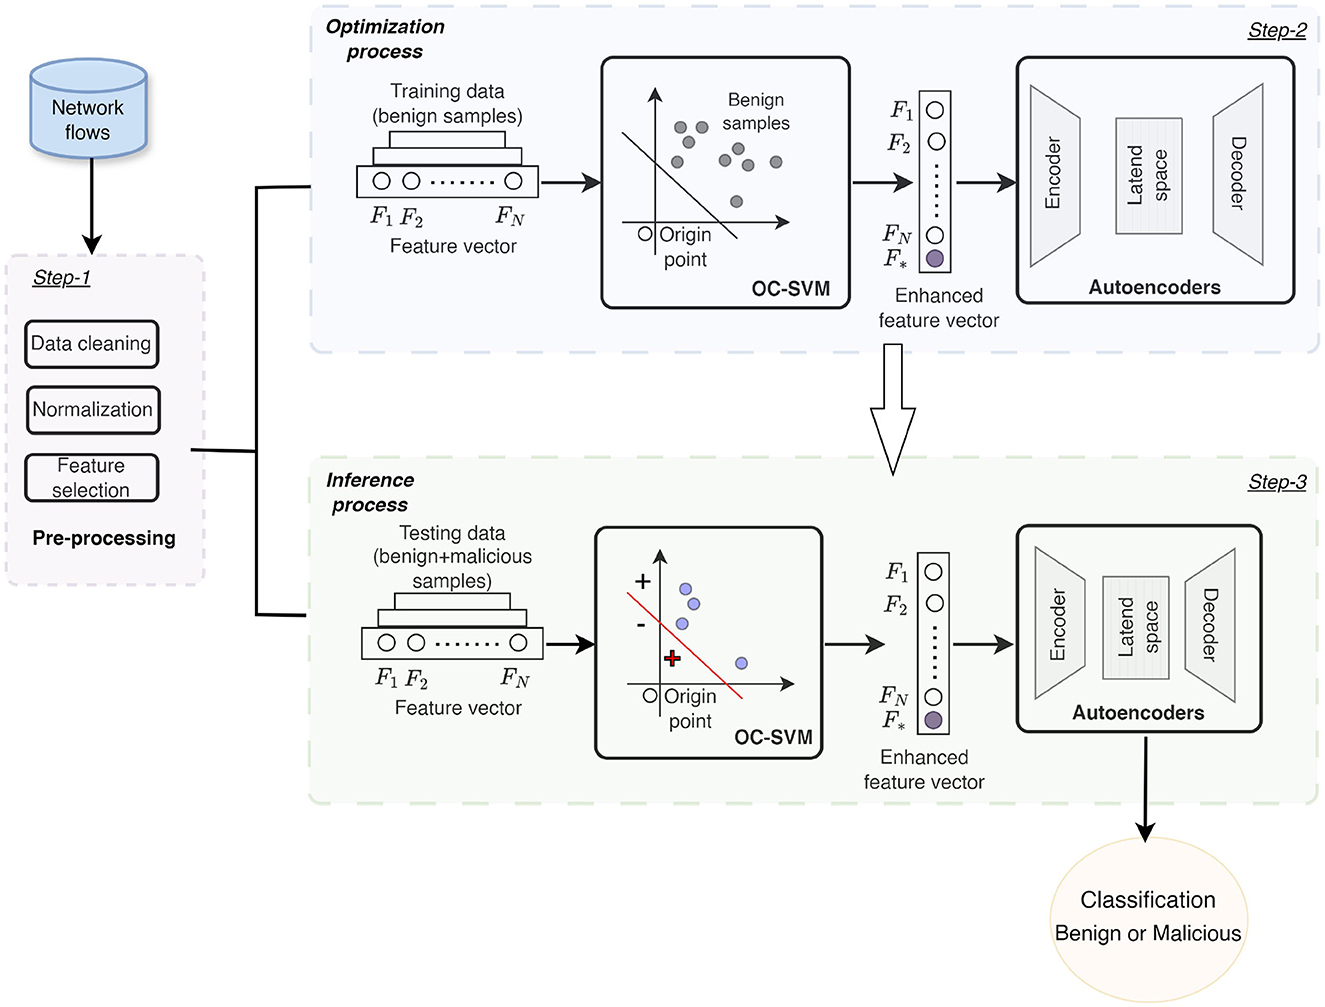
Figure 4. Schematic of the complete setup for the proposed two-step anomaly detection process. The original data set is first passed through a pre-processing layer (step 1), after which it is split into training and testing sets. During the optimization phase (step 2), the OC-SVM is trained and the decision scores for each training sample are appended as a new feature to the original feature vector. The augmented data is then used to train the AE. In the inference process (step 3), the optimized OC-SVM and the weights of the fine-tuned AE are passed. The testing samples are given as input to the optimized OC-SVM, which are again appended with the decision scores before being fed into the AE. Finally, the reconstruction errors from the AE are compared against a pre-defined threshold to classify each sample as benign or malicious.
4.4 Evaluation measures
The traffic flows are assigned either label -1 (benign) or 1 (malicious). After the implementation of the classifier, we can compute the number of correctly classified malicious (true positives–TP) and benign (true negatives–TN) flows, and the number of flows wrongly classified as benign (false negatives–FN) or malicious (false positives–FP), respectively. The data set is characterized by class imbalance, so we choose additional metrics that provide a more accurate representation of the model's performance by accounting equally for the contribution of each class. In particular, we employ five well-known metrics for the evaluation of the models: the F1 score, the Detection-Rate (DR), the False-Positive Ratio (FPR), the Geometric Mean (GM), and the Balanced Accuracy (BA).
The Detection Rate is defined as the percentage of malicious activity that the anomaly detector correctly identifies. A high detection rate means that the model effectively detects real attacks, while a low rate indicates missed threats. It is given by
The false positive rate on the other hand is defined as the percentage of benign activity incorrectly categorized as malicious (false positives) and is given by
F1 score is a harmonic mean of precision (TP/(TP+FP)) and detection rate, which balances the two metrics equally and is given by
It is useful when you want to avoid both false positives and false negatives, as precision measures the proportion of inferred positives that are correctly identified as true positives, whereas recall measures the proportion of actual positives that are identified correctly, i.e., the detection rate.
The geometric mean measures the ability of the model to correctly identify both the positive and negative samples, which is particularly useful when you want to account for the imbalance of the labels. It is given by
where specificity measures the proportion of true negative samples correctly identified by a classifier; in other words it evaluates the ability of the model to avoid false alarms. A high GM means that the detector avoids unnecessary alerts, while maintaining a good detection rate.
An alternative to accuracy for imbalanced data sets is balanced accuracy, which is defined as the average of detection rate and specificity. The formula for balanced accuracy is
Finally, we also consider the Area Under Receiver Operating Characteristic the Curve (AUC-ROC), which evaluates the model's ability to discriminate between the positive and negative classes across all possible classification thresholds. One of the main advantages of the AUC score is that it is threshold-independent, meaning it evaluates the model's ranking quality regardless of any particular decision threshold. AUC values range from 0 to 1, with scores below 0.5 indicating performance worse than random guessing.
4.5 Evaluation setup
Following Figure 4, the pre-processed data are segmented into a training and testing set (Ttest). The benign traffic flows are split in a 80% to 20% ratio, whereas all the malicious instances are included to the testing set in accordance with the one-class classification framework. Moreover, we hold out a 20% of the training set for the fine-tuning of the models, resulting in the training, Ttrain, and validation set, V, respectively.
During the optimization process, the hyperplane of OC-SVM is found by optimizing (Equation 1) on the training set, Ttrain, while the validation set, V, serves to fine-tune the nu parameter, using the proposed heuristic strategy presented in Section 3.4.
The AE is also trained on the Ttrain data set that comprise solely benign traffic flows. For the AE setup, we use encoding layers of stable decreasing size, equal to 2, and we consider a symmetric architecture so that the decoding layers increase inversely to the encoding ones. A grid-based procedure is followed for the fine-tuning of the hyper-parameters listed in Table 3. All the models are trained for 40 epochs; however, we also included an early stopping rule to avoid over-fitting. In particular, we assume that an increase in ten consecutive epochs for the validation loss is a sign of over-fitting and the training procedure should stop. The parameter set corresponding to the smallest generalization error, i.e., the minimum value of the validation loss function, θopt = arg minθkL(θk/V), considering the average of a 3-fold procedure, is stored for training the final model and provide predictions for the testing set.
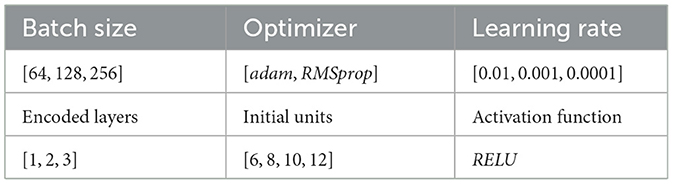
Table 3. Hyper-parameter grid for AE fine-tuning.
During the inference process, the testing data is passed to the fitted OC-SVM extracting for each sample the decision score that is subsequently incorporated as an additional feature to the original feature space. The trained AE considers as input the enhanced feature vector and is used to discriminate malicious from benign flows based on how well can reconstruct every instance. We expect the model to reconstruct benign flows more accurately than malicious activity. The final training and testing procedure of the AE is repeated for 30 iterations, to take into account the stochastic part of the optimization algorithm, such as the initialization of the weight vectors. Figure 4 illustrates the structure of the proposed system.
Finally, a threshold needs to be determined for discriminating the testing traffic data into benign and malicious. The threshold is set using the 95% percentile of the reconstruction errors over the validation set, V. In this way, we align with the one-class classification assumption, where no prior knowledge on the anomalies should be considered for model optimization.
4.6 Power-law scaling of data set size
We perform the experiments on a subset of the initial benchmark dataset to reduce computational cost while preserving a wide range of attack scenarios. Generally, the implementation of a one-class anomaly detector requires a large volume of data during training in order to capture the diverse patterns of normal traffic and to achieve high classification performance during testing. However, in real-world scenarios where an IDS is deployed, computational resources may be limited, increasing the processing time, particularly for hyper-parameter tuning.
Although the relation between model depth and training size is not straightforward, empirical evidence shows that model performance improves with growing data set size, up to an irreducible error, following a power-law distribution (Hestness et al., 2017). Following this, we consider six subsets of the original data set, D, as shown in Table 4. These subsets span approximately three orders of magnitude in size, and the class distribution is preserved using stratified random sampling (see Table 2 for the different classes).
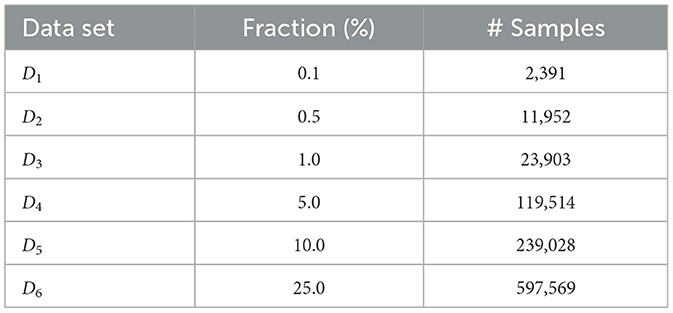
Table 4. Details on the data subsets.
We prepare each subset for training and testing an AE, which we use as a reference model. The choice of the optimal subset size is based on two performance criteria for the reference model: (i) its ability to generalize to unseen data, quantified by the MSE on benign flows in the testing set, and (ii) its classification performance on both benign and malicious traffic, measured using the F1, GM, BA, and DR metrics.
Figure 5 illustrates the performance of the AEs across all subsets, following the evaluation setup described in Section 4.5. The left panel shows the average classification metrics from 30 testing trials for the best model per data set, while the right panel presents the average generalization error (green) and training error (red). When plotted in log-log scale, the generalization error demonstrates a power-law relation with data set size, modeled as axβ, with an exponent β = −0.55 (blue line in right panel of Figure 5). This predictable pattern indicates that model comparison is feasible using smaller data sets. Since this power-law behavior is consistent across different domains and models in hand (Hestness et al., 2017; Bahri et al., 2024), we expect that relative performance metrics among models will remain stable as data set size increases.
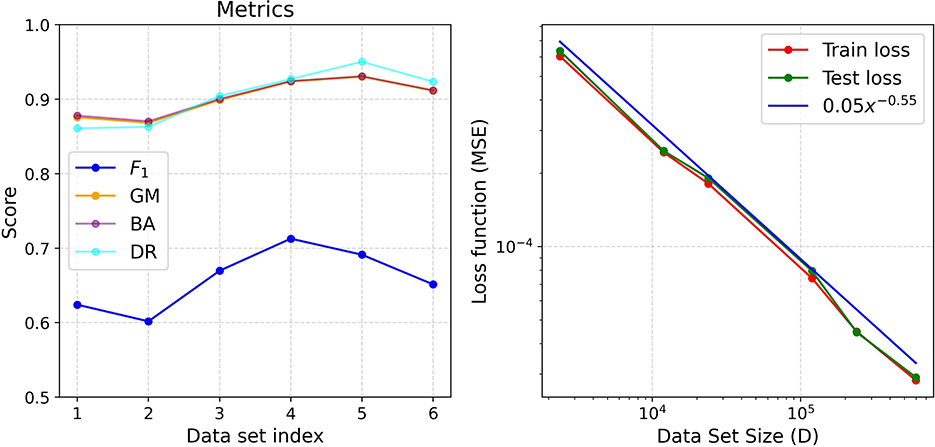
Figure 5. Left panel: Scoring metrics for each data set. Right panel: Training (red) and testing (green) error for each data set.
Additionally, the classification metrics in Figure 5 left panel show quasi-stable behavior for data sets of size D4 and larger. A slight decrease in the F1 score is observed for D2, D5 and D6, likely due to the increased complexity of attack patterns compared to smaller data sets.
Based on these observations, we conclude that subset D4, containing 119,515 samples, is sufficient to capture the distribution of benign traffic while achieving good classification performance. Therefore, we use D4 as the reference data set in the following experiments.
4.7 Evaluation on OC-SVM heuristics
We performed an evaluation of the heuristic strategy presented in Section 3.4 on the benchmark data set D4, considering multiple values for the trade-off parameter nu, while keeping the kernel function (RBF) fixed. We ran the same experiments for five different γ (kernel parameter) values in order to investigate whether our approach is robust across different parameters of the kernel function.
First, the OC-SVM is fitted on the training set, Ttrain, and subsequently, we compute the decision scores on the hold-out set, V, both containing solely benign traffic flows. We recall that high values of (Equation 5) indicate, with high confidence, the proximity of the samples to the positive side of the decision boundary. Thus, we expect high positive scores for good nu choices; otherwise, many samples are classified as anomalies and are associated with negative decision scores. Finally, for each parameter setting, its effectiveness in binary classification is evaluated on the testing set, Ttest, which contains data from both classes.
Figure 6 upper panels shows the values of (pink) for five scalar parameters of the kernel function, γ∈{auto, scale, 0.01, 0.1, 1.0}, with γ = auto and scale being the default values in the scikit-learn library (Pedregosa et al., 2011), and for nu∈[0.01, 0.5]. In all cases, we observe the same behavior: an increasing function for small nu values (PH-1, see Section 3.4), which changes abruptly at a certain point and then follows a more stable pattern (PH-2), until it begins to decrease again for large nu values (PH-3).
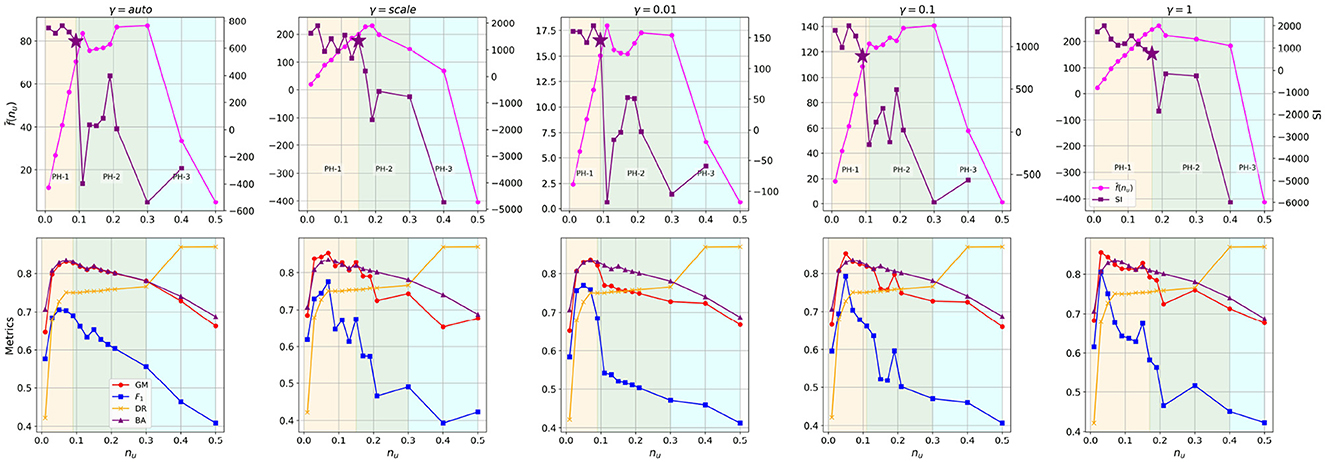
Figure 6. Evaluation of OC-SVM across varying values of the nu parameter for different kernel settings (γ) and its correlation to the stability index. Upper panels: Average decision scores, , with pink color, stability index, df/dnu, with purple color. Each subplot corresponds to a different scalar parameter, γ. Three distinct phases as a function of nu are visible for the average decision score (pink color) in all five subplots. Each subplot is divided into three color-shaded regions representing the distinct phases of behavior: PH-1 (light yellow), PH-2 (light green), and PH-3 (light blue). The star symbol corresponds to the optimal value. Lower panels: Classification metrics for each scalar, γ, and nu parameter.
Increasing nu means that the model is forced to identify a higher number of outliers in the training set. One would expect a decrease or, at the very least, a more stable behavior in the decision scores. On the contrary, we observe an increasing trend for , up to a certain point in all cases. As previously discussed, this is due to the presence of outliers: for small nu values, these outliers are incorrectly included on the positive side of the hyperplane, resulting in an extended decision boundary and larger margins with respect to the normal samples. As nu increases to a certain threshold, this constraint is relaxed, allowing many of these points to be excluded from the target half-space. This leads to a more compact decision boundary and increased decision scores for the remaining inliers (since their distance from the boundary is minimized). However, beyond a certain point, the upward trend in decision scores stops. This “corner” point serves as an indicator of the optimal nu value, beyond which high-density regions begin to break.
To highlight this behavior, we also compute the derivative of this function, which we refer to as the Stability Index (SI), df/dnu (purple curve in Figure 6 upper panels). The abrupt change in SI is used by our method to identify the optimal nu value (indicated by a star in Figure 6).
Figure 6 lower panels shows the performance of the OC-SVM on the testing set for each parameter configuration. We observe that in almost all cases, the optimal nu value (purple star in the upper panels) lies within a region of high classification performance, independently of the scalar parameter γ. For instance, when γ = auto, i.e., 1/nf ≈ 0.05, where nf is the number of features in the data set, the difference between the best classification metrics (CM), , and the metrics corresponding to the optimal value nu = 0.09 based on the SI, is negligible. Specifically: GM = 0.831 (CM), 0.827 (SI); F1 = 0.703 (CM), 0.690 (SI); BA = 0.829 (CM), 0.831 (SI); DR = 0.727 (CM), 0.750 (SI). For the rest of the experiments we consider γ = scale and nu = 0.15 (SI) as the baseline case.
4.8 Comparison with baseline models
We evaluate the proposed model, OCSVM-AE, against a collection of both traditional and state-of-the-art anomaly detectors. All models are trained using the same benign subset of the UNSW-NB15v2 dataset to ensure a fair and consistent comparison.
The LOF model is a density-based anomaly detection method utilized in scenarios where training data comprises solely benign instances. By measuring the local density deviation of a given data point with respect to its neighbors, LOF identifies instances that significantly diverge from the distribution of the normal samples, classifying them as anomalies. This approach is based on the assumption that anomalies will be located in lower density regions compared to normal instances. The LOF algorithm needs two hyper-parameters as input: the number of nearest neighbors, k, to consider for the computation of the local density around a data point and the contamination factor, c, that represents the proportion of outliers present in the data set. Essentially, c is a sensitivity parameter that adjusts the balance between missing true anomalies and considering too many normal points as outliers. We implemented two model versions for LOF, one based on a supervised fine-tuning grid search with c ∈ [0.001 − 0.5] and k ∈ [10 − 35], which we denote as LOF-CM, and the other on a semi-supervised setting considering the default parameters from the scikit-learn library (k = 20) denoted as LOF-DF. In the first version the malicious flows are splitted 50–50 between the validation and testing data.
For OC-SVM, we consider three model versions, the first based on the proposed semi-supervised heuristic strategy, OC-SVM-SI (see Section 4.7), with γ = scale and nu = 0.15(SI), the second considering the best case scenario after a supervised grid-search, OC-SVM-CM, with γ = scale and nu = 0.07 and the third considering the default parameters from scikit-learn library, OC-SVM-DF, with nu = 0.5.
Additionally, we compare our model with the traditional AEs and the Variational AEs, which is a probabilistic extension (Kingma et al., 2013). The latter learns both the latent representation and its underlying distribution. It optimizes a variational lower bound to reconstruct input data while regularizing the latent space to follow a prior distribution, typically Gaussian. This regularization facilitates better generalization and anomaly detection. In NIDS, VAEs are used to model normal traffic distributions, with higher reconstruction errors indicating potential attacks.
Another deep baseline model is the Deep Support Vector Data Description (Deep-SVDD), a deep learning-based one-class classification approach designed for anomaly detection (Ruff et al., 2018). It maps input data into a feature space using a fully connected neural network and minimizes the volume of a hyper-sphere that encloses the representations of normal data. The assumption is that anomalous samples will lie outside this hyper-sphere. In the context of NIDS, Deep-SVDD has shown promise in modeling normal network behavior and detecting deviations indicative of intrusions (Sarhan et al., 2023).
Finally, we chose the LUNAR(Local Unified Neighborhood-based Anomaly Ranker) as a deep baseline, which is a graph-based neural network framework that unifies various local outlier detection methods. It constructs a graph from input data and uses GNN layers to learn context-aware anomaly scores, effectively capturing local structure and feature interactions. LUNAR has been shown to outperform traditional one-class detection methods, particularly in high-dimensional and structured data environments (Goodge et al., 2022).
The OCSVM-AE and the simple AE are implemented using the Tensorflow library (Abadi et al., 2015) and fine-tuned using a grid-search with hyper-parameter ranges shown in Table 3, following the evaluation setup described in Section 4.5. The best model consists of a single encoding layer with 12 initial units and learning rate equal to 0.001 using the adam optimizer. For the VAE, Deep-SVDD and LUNAR models, the experiments are implemented in Python library PyOD (Chen et al., 2024; Zhao et al., 2019) with the default hyper-parameters adopted in designing the models.
The UNSW-NB15v2 data set contains nine distinct attack types (see Table 2). We create ten one-class classification experiments, one with all attacks grouped as one anomaly class and nine specific to each attack class. In all experiments, models are trained exclusively on the same benign flows and tested on a mixed (imbalanced) test set comprising both benign and malicious flows.
Regarding the first experiment, as expected the supervised settings of both LOF and OC-SVM achieve higher metrics than the corresponding semi-supervised settings. Specifically, the F1 score of LOF-CM increased by approximately 81.1% relative to the LOF-DF value, whereas the FPR decrease by 60%. Similar differences observed for the other metrics as well (see Table 5). Table 5 highlighting the benefit of supervised fine-tuning.
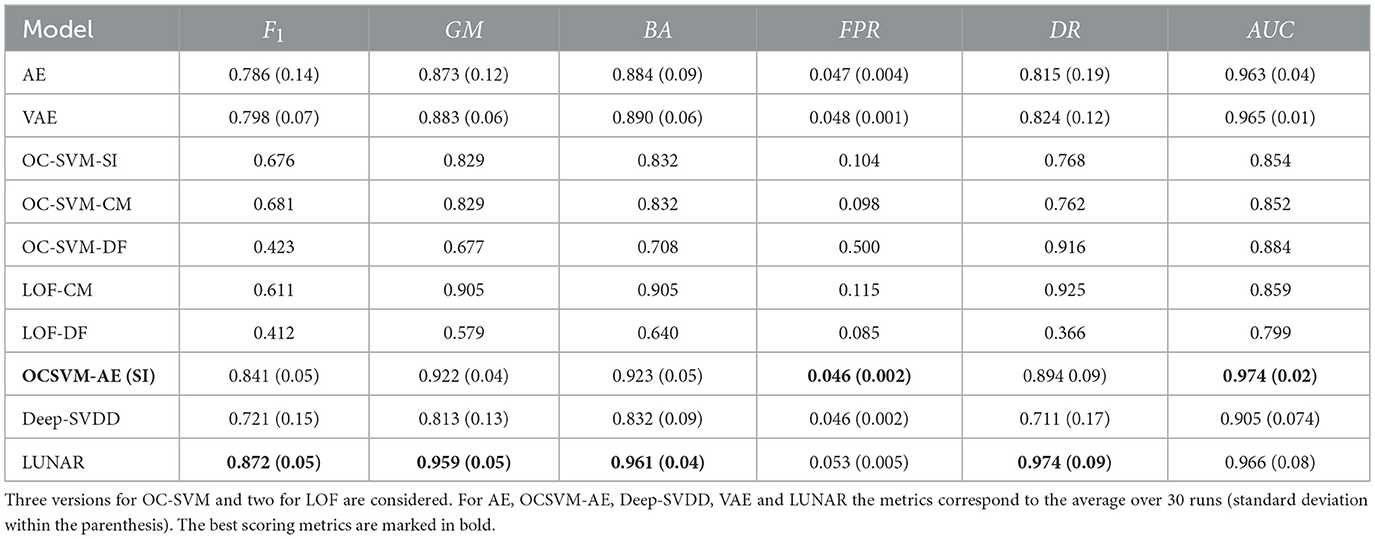
Table 5. Evaluation results with UNSW-NB15 data set (subset D4).
Similar are the results for the OC-SVM-CM and OC-SVM-DF version, respectively. For the supervised setting we achieve a 41% increase in the F1 score, and a 410% decrease in the FPR. Intriguingly, the optimized version of the OC-SVM based on our proposed semi-supervised strategy, OC-SVM-SI, gives comparable results to the supervised setting (Table 5), with GM = 0.829 (OC-SVM-CM), 0.829 (OC-SVM-SI); F1 = 0.681 (OC-SVM-CM), 0.676 (OC-SVM-SI); BA = 0.832 (OC-SVM-CM), 0.832 (OC-SVM-SI); DR = 0.762 (OC-SVM-CM), 0.768 (OC-SVM-CM) and FPR = 0.098 (OC-SVM-CM), FPR = 0.104 (OC-SVM-SI). This shows that without any prior information on the anomalous patterns we can achieve comparable detection rates to supervised methods.
Table 5 presents the classification metrics of all evaluated models. For the deep learning-based models, AE, VAE, Deep-SVDD, LUNAR, and the proposed OCSVM-AE, we report the average scores over 30 runs along with standard deviations, using different random seeds to account for the stochastic variability due to batch sampling and weight initialization.
Among all models, LUNAR achieves the highest F1-score (0.872), geometric mean (GM = 0.959), balanced accuracy (BA = 0.961), and detection rate (DR = 0.974). These results highlight the strength of graph-based architectures in capturing complex structural dependencies in the input space.
However, the proposed OCSVM-AE achieves the lowest false positive rate (FPR = 0.046) and the highest AUC score (AUC = 0.974), outperforming all other baselines and achieving consistent results across all metrics. Compared to classical baselines, OCSVM-AE outperforms even the supervised versions of OC-SVM-CM and LOF-CM, which benefit from access to labeled data from both classes during validation. Notably, OCSVM-AE surpasses Deep-SVDD and standard AE/VAE models, indicating that the enhanced feature representation introduced by the two-step approach yield gains in anomaly detection performance. In Supplementary material, we provide an analysis of the contribution of the OC-SVM scores to the latent space of the AE.
In the other nine experiments we evaluate model performance using as testing data the normal flows along with only one type of malicious flow. For instance, when evaluating the detection of “Exploits” attacks, the testing set includes “22,953” benign flows and “1,578” malicious flows.
Table 6 presents the AUC scores across all models for each of the nine attack categories. This metric was selected due to its threshold-independent nature, which allows for a fair and robust comparison between models, regardless of the threshold optimization strategy.
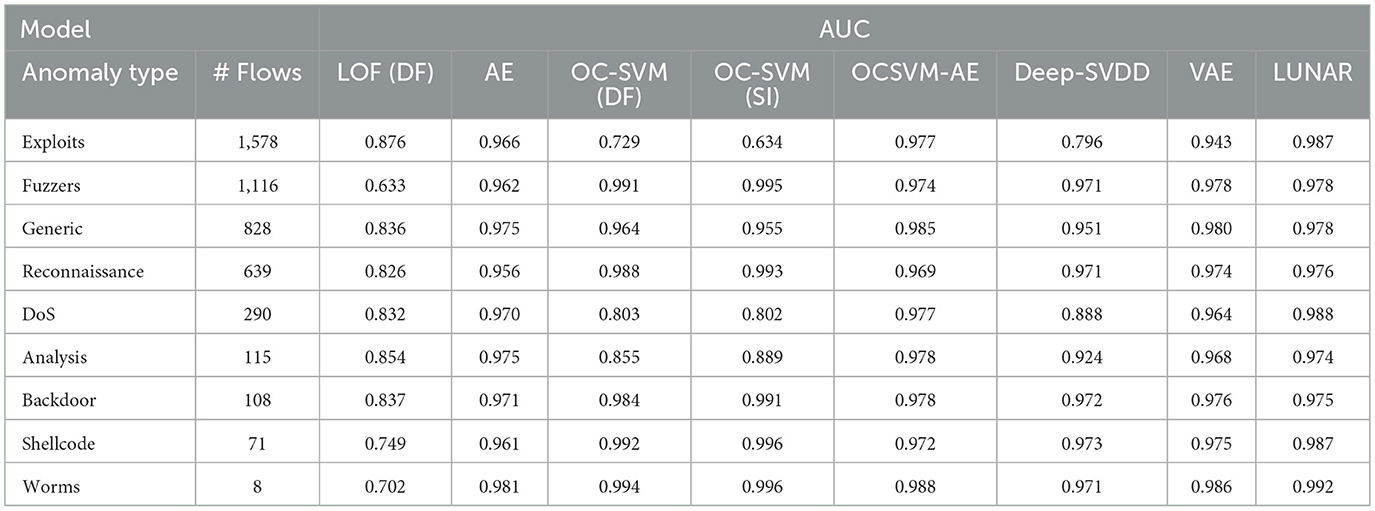
Table 6. The AUC results of the methods for nine different attack types.
As shown in Table 6, the proposed OCSVM-AE model consistently achieves competitive or superior AUC scores across most attack types, showcasing the effectiveness of incorporating OC-SVM decision scores as an additional feature in the input vector. In particular, OCSVM-AE ranks among the top-performing models in nearly every category, often exceeding the performance of deep learning-based baselines such as Deep-SVDD, VAE, and even LUNAR.
In Exploits, Fuzzers, and DoS, attack types where traditional detectors (OC-SVM-DF or LOF-DF) tend to underperform, OCSVM-AE demonstrates marked improvements, achieving AUC values above 0.97. These attacks may exhibit greater overlap with normal traffic, making detection more challenging; however, the enhanced representation appears to improve class separability. Moreover, the semi-supervised OC-SVM (SI) configuration, which uses our heuristic for tuning the nu parameter, also performs well and outperforms the default OC-SVM in almost all cases. The OCSVM-AE model remains robust even on low-frequency attack types such as Shellcode, Backdoor, and Worms, despite the class imbalance issues, suggesting improved generalization.
Overall, the results indicate that the proposed model maintains high detection capability across a diverse range of attack types, both frequent and rare, supporting its applicability in realistic and evolving threat scenarios.
In addition to classification performance, inference efficiency is a critical factor for the practical deployment of intrusion detection systems, particularly in real-time or high-throughput environments. To this end, we evaluated the testing time per network flow (in milliseconds) for all models under consideration. Table 7 summarizes the average per-flow testing time across models.
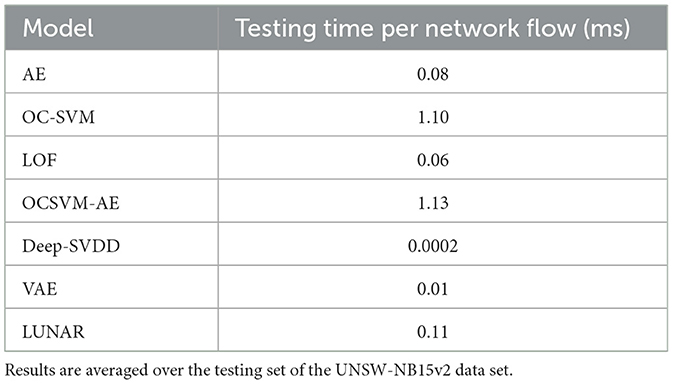
Table 7. Comparison of inference (testing) time per network flow for all models.
As shown in Table 7, the proposed OCSVM-AE model shows moderate computational overhead relative to the baselines. Specifically, it requires approximately 1.13 milliseconds per flow, which is notably higher than lightweight models such as AE (0.08 ms) or VAE (0.01 ms). This increase is primarily attributed to the additional OC-SVM scoring step during inference. Nonetheless, the testing time remains well within acceptable limits for practical scenarios.
5 Discussion
Our contribution lies in two parts: (i) the integration of a geometric modeling signal derived by an OC-SVM into the anomaly detection pipeline of an AE for identifying novel cyber-attacks, and (ii) the semi-supervised optimization of the OCSVM hyper-parameter, nu, using only benign network traffic during training and validation.
Regarding the first aspect, while our method may not introduce architectural innovations to either OCSVMs or AEs, it presents an important insight for anomaly-based NIDS. Specifically, incorporating the geometric alignment of data samples relative to the OCSVM decision boundary, expressed via the decision function, as an additional input feature enhances the AE's ability to learn meaningful patterns of normal traffic. This hybrid approach enables the AE to discriminate between benign and malicious patterns with greater precision (Tables 5, 6). Our experimental results support this, especially when the OCSVM's nu parameter is fine-tuned using our proposed index, as shown in Table 5, where OCSVM-AE (SI) outperforms both AE and OC-SVM baselines with default settings.
This methodology can be generalized as a modular framework applicable to other state-of-the-art anomaly detection models within NIDS. The enhanced feature vector, augmented with OCSVM decision scores, can be fed into any detection architecture, not only AEs. For instance, it can be seamlessly integrated with more advanced AE variants such as Variational AEs (Kingma et al., 2013), which model the latent space as a probability distribution and are capable of capturing more complex patterns. Additionally, the framework could enhance architectures that directly target latent space optimization, such as the Shrink AE (Nicolau et al., 2018), which promotes compact representations by shrinking the latent distribution into an origin point, or the Memory-Augmented AE (Gong et al., 2019), which maintains a learnable memory module to better reconstruct normal patterns while isolating anomalous behaviors. These directions highlight the flexibility of the proposed augmentation and its potential to serve as a plug-in module for a broad class of one-class NIDS models.
Recent advancements in unsupervised clustering provide promising avenues for further improving anomaly-based NIDS. For instance, Yang et al. (2024) combine fuzzy clustering with graph convolutional networks (GCNs) to uncover latent community structures in attributed graphs, which can help identify coordinated or stealthy intrusion attempts. Meanwhile, Yang et al. (2025) introduce a generative Bayesian framework that models graph topologies and node attributes simultaneously, enabling nuanced detection of complex attack patterns. Such techniques may complement our approach, particularly in detecting topological or behaviorally irregular intrusions.
Additionally, the index proposed for selecting nu serves as a practical alternative to heuristics that rely on labeled malicious samples, which are rarely available in operational environments. Along with the semi-supervised modeling setting assumed in this study can provide a proposal for realistic deployment scenarios, where only normal (benign) traffic is available for training due to the scarcity or sensitivity of labeled attack data. In this context, our model supports a proactive security system, in which an one-class anomaly detector flags suspicious activity that can be further analyzed or validated by a secondary, supervised model or human analyst. We acknowledge that real-world deployment would involve additional operational constraints, including scalability, response latency, and noise in traffic. However, the objective of this work is to introduce and validate a detection-enhancing modeling approach, rather than to deliver a production-ready NIDS prototype. While our model demonstrates promising performance across diverse attack types, we acknowledge that the additional computational overhead introduced by combining OC-SVM and AE stages could present challenges for high-throughput, low-latency applications. As shown in Table 7, the average inference time remains under 1.2 ms per flow, which is reasonable for many use cases (Mhamdi et al., 2020) but may require further optimization for real-time deployment. However, since this work is not focused on a real-world deployment scenario, detailed exploring of hardware-specific memory usage or latency is considered beyond the current scope and assessing its feasibility for online-detection remains for future work.
Another critical area for future work involves optimizing the detection threshold used in AE-based anomaly scoring. While we used a fixed percentile-based strategy, alternative approaches, such as extreme value theory (Yang et al., 2021), have shown promise in the literature for capturing tail Behavior in reconstruction error distributions. Incorporating such techniques could further refine the model's detection capabilities.
Finally, the benchmark data set used in this study includes a broad spectrum of attack types (see Table 2), in contrast to works focused on specific threat categories such as DDoS (Ortega-Fernandez et al., 2024) or botnets (Meidan et al., 2018). Furthermore, while our model operates on flow-based features, it could be extended to process packet, level data or temporal sequences, e.g., via recurrent neural networks or attention-based models, to capture deeper protocol behaviors and long-term dependencies in traffic.
6 Conclusions
In this work, we presented a two-step anomaly-based NIDS that combines a one-class anomaly detection model, OC-SVM, with deep AEs for classifying network traffic flows as benign or malicious. The proposed framework takes advantage of the topological structure of the OC-SVM, expressed through its decision scores, which are subsequently fed as an additional feature dimension to the AEs. This integration enhances the AE's performance by incorporating valuable information. Our two-tier approach leverages the strengths of both models: the AE ability to learn complex data representations and the OC-SVM effectiveness in isolating anomalies. Experimental evaluation demonstrates significant performance gains over baseline models, offering a promising solution for detecting unknown cyber threats.
All experiments were conducted on a subset of a benchmark network data set selected to meet two critical conditions: (1) ensuring good model performance, and (2) maintaining a low generalization error. Through empirical validation, we found that the generalization error of the AE decreases with data set size, following a power-law with exponent β = −0.55.
As part of the model selection process, we proposed an effective semi-supervised heuristic strategy for tuning the OC-SVM trade-off parameter, nu, which achieved performance comparable to that of supervised settings. The use of semi-supervised strategies like this is essential for enabling efficient deployment of one-class anomaly detection models.
Additionally, we evaluated the model using a benchmark data set with NetFlow format features, which offers broader generalization potential. Since this format is standard across various NIDS datasets and attack types, our results are more transferable to diverse network environments, facilitating the deployment in practical settings.
Finally, the model is well-suited for real-world use, as it does not rely on a predefined set of attack types for training. Instead, it learns from normal network activity alone, allowing for easier implementation in real-world cases.
Data availability statement
The original contributions presented in the study are included in the article/supplementary material, further inquiries can be directed to the corresponding author.
Author contributions
PB: Data curation, Methodology, Writing – review & editing, Software, Conceptualization, Investigation, Validation, Writing – original draft, Formal analysis, Visualization. DK: Funding acquisition, Project administration, Validation, Conceptualization, Writing – review & editing, Supervision, Formal analysis, Data curation, Writing – original draft. TT: Writing – review & editing, Conceptualization, Formal analysis, Writing – original draft, Resources, Project administration, Funding acquisition, Validation, Data curation. SV: Resources, Writing – review & editing, Writing – original draft, Project administration, Funding acquisition. IK: Writing – original draft, Funding acquisition, Resources, Writing – review & editing, Project administration.
Funding
The author(s) declare that financial support was received for the research and/or publication of this article. This research was funded by the European Union under Waterverse (GA 101070262) and XTRUST-6G (GA 101192749). Views and opinions expressed are however those of the author(s) only and do not necessarily reflect those of the European Union, the European Commission, or the Smart Networks and Services Joint Undertaking. Neither the European Union nor the granting authorities can be held responsible for them.
Conflict of interest
The authors declare that the research was conducted in the absence of any commercial or financial relationships that could be construed as a potential conflict of interest.
The author(s) declared that they were an editorial board member of Frontiers, at the time of submission. This had no impact on the peer review process and the final decision.
Generative AI statement
The author(s) declare that no Gen AI was used in the creation of this manuscript.
Any alternative text (alt text) provided alongside figures in this article has been generated by Frontiers with the support of artificial intelligence and reasonable efforts have been made to ensure accuracy, including review by the authors wherever possible. If you identify any issues, please contact us.
Publisher's note
All claims expressed in this article are solely those of the authors and do not necessarily represent those of their affiliated organizations, or those of the publisher, the editors and the reviewers. Any product that may be evaluated in this article, or claim that may be made by its manufacturer, is not guaranteed or endorsed by the publisher.
Author disclaimer
Views and opinions expressed are however those of the author(s) only and do not necessarily reflect those of the European Union, the European Commission, or the Smart Networks and Services Joint Undertaking. Neither the European Union nor the granting authorities can be held responsible for them.
Supplementary material
The Supplementary Material for this article can be found online at: https://www.frontiersin.org/articles/10.3389/fcomp.2025.1646679/full#supplementary-material
References
Abadi, M., Agarwal, A., Barham, P., Brevdo, E., Chen, Z., Citro, C., et al. (2015). TensorFlow: Large-scale machine learning on heterogeneous systems. Software available from tensorflow.org.
Ahmad, Z., Shahid Khan, A., Wai Shiang, C., Abdullah, J., and Ahmad, F. (2021). Network intrusion detection system: a systematic study of machine learning and deep learning approaches. Trans. Emer. Telecommun. Technol. 32:e4150. doi: 10.1002/ett.4150
Ahmed, M., Mahmood, A. N., and Hu, J. (2016). A survey of network anomaly detection techniques. J. Netw. Comput. Applic. 60, 19–31. doi: 10.1016/j.jnca.2015.11.016
Bahri, Y., Dyer, E., Kaplan, J., Lee, J., and Sharma, U. (2024). Explaining neural scaling laws. Proc. Nat. Acad. Sci. 121:e2311878121. doi: 10.1073/pnas.2311878121
Chandola, V., Banerjee, A., and Kumar, V. (2009). Anomaly detection: a survey. ACM Comput. Surv. 41, 1–58. doi: 10.1145/1541880.1541882
Chen, S., Qian, Z., Siu, W., Hu, X., Li, J., Li, S., et al. (2024). Pyod 2: a python library for outlier detection with LLM-powered model selection. arXiv preprint arXiv:2412.12154.
Claise, B. (2004). Cisco systems netflow services export version 9. Technical report. doi: 10.17487/rfc3954
Ghafoori, Z., Rajasegarar, S., Erfani, S. M., Karunasekera, S., and Leckie, C. A. (2016). “Unsupervised parameter estimation for one-class support vector machines,” in Advances in Knowledge Discovery and Data Mining: 20th Pacific-Asia Conference, PAKDD 2016, Auckland, New Zealand, April 19–22, 2016, Proceedings, Part II 20 (Springer), 183–195. doi: 10.1007/978-3-319-31750-2_15
Gong, D., Liu, L., Le, V., Saha, B., Mansour, M. R., Venkatesh, S., et al. (2019). “Memorizing normality to detect anomaly: memory-augmented deep autoencoder for unsupervised anomaly detection,” in Proceedings of the IEEE/CVF International Conference on Computer Vision, 1705–1714. doi: 10.1109/ICCV.2019.00179
Goodge, A., Hooi, B., Ng, S.-K., and Ng, W. S. (2022). “Lunar: unifying local outlier detection methods via graph neural networks,” in Proceedings of the AAAI Conference on Artificial Intelligence, 6737–6745. doi: 10.1609/aaai.v36i6.20629
Hestness, J., Narang, S., Ardalani, N., Diamos, G., Jun, H., Kianinejad, H., et al. (2017). Deep learning scaling is predictable, empirically. arXiv preprint arXiv:1712.00409.
Hunter, J. D. (2007). Matplotlib: a 2D graphics environment. Comput. Sci. Eng. 9, 90–95. doi: 10.1109/MCSE.2007.55
Kingma, D. P., and Welling, M. (2013). Auto-encoding variational bayes. arXiv preprint arXiv:1312.6114.
Lopez-Martin, M., Carro, B., Arribas, J. I., and Sanchez-Esguevillas, A. (2021). Network intrusion detection with a novel hierarchy of distances between embeddings of hash IP addresses. Knowl. Based Syst. 219:106887. doi: 10.1016/j.knosys.2021.106887
Meidan, Y., Bohadana, M., Mathov, Y., Mirsky, Y., Shabtai, A., Breitenbacher, D., et al. (2018). N-baiot–network-based detection of IoT botnet attacks using deep autoencoders. IEEE Perv. Comput. 17, 12–22. doi: 10.1109/MPRV.2018.03367731
Mhamdi, L., McLernon, D., El-Moussa, F., Zaidi, S. A. R., Ghogho, M., and Tang, T. (2020). “A deep learning approach combining autoencoder with one-class SVM for DDOS attack detection in SDNS,” in 2020 IEEE Eighth International Conference on Communications and Networking (ComNet) (IEEE), 1–6. doi: 10.1109/ComNet47917.2020.9306073
Mir, A. A., Zuhairi, M. F., Musa, S., and Namoun, A. (2025). “Dynkdd: dynamic graph-based network intrusion detection using graph neural networks,” in 2025 19th International Conference on Ubiquitous Information Management and Communication (IMCOM) (IEEE), 1–8. doi: 10.1109/IMCOM64595.2025.10857434
Mirsky, Y., Doitshman, T., Elovici, Y., and Shabtai, A. (2018). Kitsune: an ensemble of autoencoders for online network intrusion detection. arXiv preprint arXiv:1802.09089.
Moustafa, N., and Slay, J. (2015). “Unsw-nb15: a comprehensive data set for network intrusion detection systems (unsw-nb15 network data set),” in 2015 Military Communications and Information Systems Conference (MilCIS) (IEEE), 1–6. doi: 10.1109/MilCIS.2015.7348942
Nicolau, M.McDermott, J., et al. (2018). Learning neural representations for network anomaly detection. IEEE Trans. Cybern. 49, 3074–3087. doi: 10.1109/TCYB.2018.2838668
Ortega-Fernandez, I., Sestelo, M., Burguillo, J. C., and Piñón-Blanco, C. (2024). Network intrusion detection system for DDOS attacks in ICS using deep autoencoders. Wirel. Netw. 30, 5059–5075. doi: 10.1007/s11276-022-03214-3
Pedregosa, F., Varoquaux, G., Gramfort, A., Michel, V., Thirion, B., Grisel, O., et al. (2011). Scikit-learn: machine learning in python. J. Mach. Learn. Res. 12, 2825–2830.
Ratsch, G., Mika, S., Scholkopf, B., and Muller, K.-R. (2002). Constructing boosting algorithms from SVMS: an application to one-class classification. IEEE Trans. Pattern Anal. Mach. Intell. 24, 1184–1199. doi: 10.1109/TPAMI.2002.1033211
Ruff, L., Vandermeulen, R., Goernitz, N., Deecke, L., Siddiqui, S. A., Binder, A., et al. (2018). “Deep one-class classification,” in International Conference on Machine Learning (PMLR), 4393–4402.
Rumelhart, D. E., Hinton, G. E., Williams, R. J., et al. (1985). Learning internal representations by error propagation. Technical Report. doi: 10.21236/ADA164453
Sarhan, M., Kulatilleke, G., Lo, W. W., Layeghy, S., and Portmann, M. (2023). “Doc-nad: a hybrid deep one-class classifier for network anomaly detection,” in 2023 IEEE/ACM 23rd International Symposium on Cluster, Cloud and Internet Computing Workshops (CCGridW) (IEEE), 1–7. doi: 10.1109/CCGridW59191.2023.00016
Sarhan, M., Layeghy, S., Moustafa, N., and Portmann, M. (2021). “Netflow datasets for machine learning-based network intrusion detection systems,” in Big Data Technologies and Applications: 10th EAI International Conference, BDTA 2020, and 13th EAI International Conference on Wireless Internet, WiCON 2020, Virtual Event, December 11, 2020, Proceedings 10 (Springer), 117–135. doi: 10.1007/978-3-030-72802-1_9
Sarhan, M., Layeghy, S., and Portmann, M. (2022). Towards a standard feature set for network intrusion detection system datasets. Mobile Netw. Applic. 27, 357–370. doi: 10.1007/s11036-021-01843-0
Schölkopf, B., Platt, J. C., Shawe-Taylor, J., Smola, A. J., and Williamson, R. C. (2001). Estimating the support of a high-dimensional distribution. Neural Comput. 13, 1443–1471. doi: 10.1162/089976601750264965
Tavallaee, M., Bagheri, E., Lu, W., and Ghorbani, A. A. (2009). “A detailed analysis of the kdd cup 99 data set,” in 2009 IEEE Symposium on Computational Intelligence for Security and Defense Applications (IEEE), 1–6. doi: 10.1109/CISDA.2009.5356528
Thakkar, A., and Lohiya, R. (2022). A survey on intrusion detection system: feature selection, model, performance measures, application perspective, challenges, and future research directions. Artif. Intell. Rev. 55, 453–563. doi: 10.1007/s10462-021-10037-9
Tidjon, L. N., Frappier, M., and Mammar, A. (2019). Intrusion detection systems: a cross-domain overview. IEEE Commun. Surv. Tutor. 21, 3639–3681. doi: 10.1109/COMST.2019.2922584
Wang, S., Liu, Q., Zhu, E., Porikli, F., and Yin, J. (2018). Hyperparameter selection of one-class support vector machine by self-adaptive data shifting. Pattern Recognit. 74, 198–211. doi: 10.1016/j.patcog.2017.09.012
Xiao, Y., Wang, H., and Xu, W. (2014). Parameter selection of gaussian kernel for one-class svm. IEEE Trans. Cybern. 45, 941–953. doi: 10.1109/TCYB.2014.2340433
Yang, J., Chen, X., Chen, S., Jiang, X., and Tan, X. (2021). Conditional variational auto-encoder and extreme value theory aided two-stage learning approach for intelligent fine-grained known/unknown intrusion detection. IEEE Trans. Inf. Forens. Secur. 16, 3538–3553. doi: 10.1109/TIFS.2021.3083422
Yang, Y., Hu, L., Li, G., Li, D., Hu, P., and Luo, X. (2025). Link-based attributed graph clustering via approximate generative Bayesian learning. IEEE Trans. Syst. Man Cybern. Syst. 55, 5730–5743. doi: 10.1109/TSMC.2025.3572738
Yang, Y., Li, G., Li, D., Zhang, J., Hu, P., and Hu, L. (2024). Integrating fuzzy clustering and graph convolution network to accurately identify clusters from attributed graph. IEEE Trans. Netw. Sci. Eng. 12, 1112–1125. doi: 10.1109/TNSE.2024.3524077
Zavrak, S., and Iskefiyeli, M. (2020). Anomaly-based intrusion detection from network flow features using variational autoencoder. IEEE Access 8, 108346–108358. doi: 10.1109/ACCESS.2020.3001350
Zhang, J., Jones, K., Song, T., Kang, H., and Brown, D. E. (2017). “Comparing unsupervised learning approaches to detect network intrusion using netflow data,” in 2017 Systems and Information Engineering Design Symposium (SIEDS) (IEEE), 122–127. doi: 10.1109/SIEDS.2017.7937701
Zhang, M., Xu, B., and Gong, J. (2015). “An anomaly detection model based on one-class svm to detect network intrusions,” in 2015 11th International conference on mobile ad-hoc and sensor networks (MSN) (IEEE), 102–107. doi: 10.1109/MSN.2015.40
Zhao, Y., Nasrullah, Z., and Li, Z. (2019). Pyod: a python toolbox for scalable outlier detection. J. Mach. Learn. Res. 20, 1–7.
Keywords: anomaly detection, autoencoders, network intrusion detection, one-class support vector machine, one-class classification, semi-supervised learning
Citation: Bountzis P, Kavallieros D, Tsikrika T, Vrochidis S and Kompatsiaris I (2025) A deep one-class classifier for network anomaly detection using autoencoders and one-class support vector machines. Front. Comput. Sci. 7:1646679. doi: 10.3389/fcomp.2025.1646679
Received: 13 June 2025; Accepted: 15 September 2025;
Published: 03 October 2025.
Edited by:
Aikaterini Kanta, University of Portsmouth, United KingdomReviewed by:
Peisen Yuan, Nanjing Agricultural University, ChinaLun Hu, Chinese Academy of Sciences (CAS), China
Nawal Ahmed El-Fishawy, Menoufia University, Egypt
Copyright © 2025 Bountzis, Kavallieros, Tsikrika, Vrochidis and Kompatsiaris. This is an open-access article distributed under the terms of the Creative Commons Attribution License (CC BY). The use, distribution or reproduction in other forums is permitted, provided the original author(s) and the copyright owner(s) are credited and that the original publication in this journal is cited, in accordance with accepted academic practice. No use, distribution or reproduction is permitted which does not comply with these terms.
*Correspondence: Polyzois Bountzis, cG1wb3VudHpwQGdlby5hdXRoLmdy