 Daniel Lai
 Sook Ling Lew2*
- 1Faculty of Information Science and Technology, Multimedia University, Malacca, Malaysia
- 2Centre for Advanced Analytics, CoE for Artificial Intelligence, Faculty of Information Science and Technology, Multimedia University, Melaka, Malaysia
Introduction: Recent educational transformations have caused teachers to face difficulties in learning and adopting online tools to establish student course engagement (SCE). Thus, three significant problems are outlined in this research: lack of SCE in virtual classrooms, ineffective technology integration into pedagogy and lack of self-proficiency in technologies to enhance students’ academic performance. Moreover, three research questions emerged regarding the SCE, the teachers’ proficiency in technological, pedagogical and content knowledge (TPACK) for teaching, and the students’ academic performance. Hence, a framework that adopted the TPACK framework and the Student Course Engagement Questionnaire (SCEQ) was developed.
Methods: A developed mobile interactive system (MIS) integrated into the virtual classroom, determining factors that contributed to improving SCE, assessing teachers’ proficiency in teaching with technology from students’ perspectives, and assessing SCE and academic performance improvement. A quasi- experimental design was employed in the current research to collect quantitative data and for statistical analysis. Pretest-posttest experiments were conducted with 80 local university undergraduate students from two different groups, with and without developed MIS integration. Homogeneity among the participants was assured by distributing a pre-knowledge checking test before the actual experiment began. The TPACK and SCEQ surveys were distributed for further analysis.
Results: The SCE and TPACK R2 values are 0.111 and 0.748, respectively, indicating that SCE has low predictive power. However, the experiment results indicate that teachers’ proficiency in TPACK has a medium effect on SCE. Additionally, the student’s academic performance has shown significant improvement.
Discussion: Moreover, the current research suggested that content and technological knowledge are more vital than pedagogical knowledge in the virtual classroom. Therefore, the current research results indicated that the integration of developed MIS improves students’ SCE and academic performance significantly. The integration of the developed MIS in the virtual classroom also enhanced teachers’ proficiency in TPACK. Moreover, the change of perspectives when examining teachers’ TPACK proficiency provides more valuable insights as students benefited from the lessons directly.
1 Introduction
Advanced technology is essential for supporting modern education. The evolution of technology enhances efficacy and convenience, leading to further improvements in the teaching and learning environment. It enriches the teaching and learning experience for teachers and students by offering a more versatile classroom setting and teaching and learning approaches that align with Education 4.0 for higher education (Qureshi et al., 2023). Thus, the roles of teachers and students underwent drastic changes. Despite modern technologies, teachers remain the key to selecting information and communication technologies (ICT) to enhance their teaching approaches. There are no specific rules or guidelines to follow for technology integration in their classrooms. However, the teacher’s prior experience and proficiency in operating ICT reflect their competencies in handling and integrating ICT (Molero Jurado et al., 2022). Therefore, integrating advanced technology does not always guarantee a positive teaching and learning experience. Although virtual classrooms have been the preferred choice due to the recent pandemic, bonding and building relationships between students and teachers is challenging (Nur Fitria, 2023). This research intends to outline three primary issues that surfaced because of the transformation of the classroom environment from physical to virtual classroom: (1) lack of student course engagement (SCE) in the virtual classroom, (2) ineffective technology integration into pedagogy, and (3) low teacher self-proficiency in technology because of the steep learning curve.
Several researchers have investigated students’ engagement, and their thoughts and findings differed (Al-Obaydi et al., 2023; Cayubit, 2022; Wong and Liem, 2022). In contrast to student engagement, SCE refers to the commitment a student makes to their academics. Therefore, there is a possibility that the SCE results in better academic performance. Additionally, the engagement between teachers and students is crucial for determining students’ academic performance in online classes. However, the students are not favorable toward the online synchronous sessions. Moreover, very few researchers attempt to measure engagement in specific courses (Oraif and Elyas, 2021). Hence, there is a need for this research to evaluate the SCE in the virtual environment by implementing the proposed mobile interactive system (MIS) into teaching.
The learning curve for every technology varies. It can be as simple as a laser pointer or as complex as an interactive whiteboard (IWB). Higher-end technology also provides users with top-notch functionalities and features, which often require them to undergo complex yet troublesome procedures to achieve the ideal outcome. Therefore, a teacher’s proficiency in implementing and handling technology is far more essential than the selection of technology. Mass involvement in technology might improve students’ academic performance in online classes (Noor et al., 2022; Younas et al., 2022). However, it lies with the foundation, where the self-proficiency of teachers in online technologies is on par (Bossman and Agyei, 2022). In the long term, it can negatively affect SCE and delivery. The teacher’s technology integration proficiency can influence SCE in the virtual classroom environment to a certain extent (Prakasha et al., 2023). This research also examines whether the technological, pedagogical and content knowledge (TPACK) of teachers affects the SCE due to technology integration in teaching.
The lack of pre-planning hindered the potential of technology, and the teachers had difficulties selecting appropriate technology to meet their teaching objectives (Alieto et al., 2024). Most academic institutions made the common mistake of overly idealistically focusing on nitpicking the most appropriate technology to support teaching and learning. Having teachers know how to operate specific technology does not necessarily translate into a higher level of technology integration. Teachers can effectively integrate the curriculum if they possess the necessary knowledge, skills, resources, and support. Therefore, this research aims to investigate the effectiveness of teachers’ proficiency by integrating the proposed MIS as a complementary tool into their pedagogy.
The findings from the previous sections illustrate the importance of SCE. It is closely related to the students’ academic performance. Students with better and more positive SCE tend to perform better academically, and vice versa. Hence, the SCE depends on their teachers’ pedagogy and the integration of technology in the classroom (Bossman and Agyei, 2022). The teacher with higher self-proficiency in teaching with technology will know how to pre-plan the use of technology in teaching and maximize its advantages.
Hence, this research formulated the following research questions:
1. What factors influence teachers’ proficiency in integrating technology into the virtual classroom of higher education to improve SCE?
2. How does the integration of the proposed MIS in the virtual classroom of higher education enhance teachers’ proficiency in teaching with technology from students’ perspectives?
3. How does the integration of the proposed MIS in the virtual classroom of higher education impact the students’ academic performance and SCE?
As a result, the objectives of this research are as follows:
1. To develop a framework that addresses technology integration, teachers’ proficiency in TPACK and SCE in the virtual classroom.
2. To determine the teachers’ TPACK proficiency in teaching with the proposed MIS integrated into the virtual classroom from students’ perspectives.
3. To evaluate the students’ academic performance and SCE with the proposed MIS integrated into the virtual classroom.
The research questions, objectives, methods, and contributions are outlined in Supplementary Table 1.
2 A literature review
2.1 Virtual classroom environment
The common practice for conducting synchronous online classes is through video conferencing. Video conferencing is, literally, a virtual face-to-face approach to coping with online classes. Moreover, it is an ideal approach to maintaining education during the COVID-19 pandemic, as it offers more convenience in monitoring students (Aldosari et al., 2022). The interaction between the teachers and the students in the virtual classroom is often minimal.
In addition, the presence of teachers or instructors in classes is crucial, regardless of whether the classroom is physical or virtual. They ensure the learning objectives are accomplished, making them irreplaceable by technology. During the transition to the virtual classroom, teachers continued to use traditional teaching methods, with minimal modifications to suit the new teaching and learning environment (Castelli and Sarvary, 2021). Therefore, the mode and the mean of teaching changed in the virtual classroom, forcing the teachers to comply and adapt to the new norm. Generally, it influences the lesson delivery approach of the teachers to align with their objectives. Despite these modern technologies playing a supportive role in education, assisting teachers in overcoming the challenges faced in online classes, the distinctiveness of the virtual classroom environment requires teachers to acquire new skills and knowledge (Lai et al., 2022b). Hence, teachers nowadays require a thorough understanding of technology, pedagogy, and subject content to plan and tailor the curriculum according to students’ needs and fully utilize the technology integrated into the classroom.
2.2 Technology integration in education
In modern education, technology is almost inseparable from the teaching and learning process. Technology can be classified into the following six types: communication, electrical, energy, mechanical, medical, and transportation (Pacey and Bray, 2021). This research will focus on the integration of communication and electrical technology in education, as these are commonly used technologies. In terms of communication technology, it can be smartphones and the Internet. Electrical technology encompasses computers, software, artificial intelligence, and audio and video technologies. Educators have been integrating these technologies into education for years, if not decades.
Furthermore, people should not treat modern technology as a complete replacement for conventional practices, despite the convenience it offers. In fact, technology integration in higher education should focus on providing different or alternate approaches instead of pursuing the most advanced solution. Therefore, claiming the technology as a betterment is rather too broad and vague. Technology integration in higher education is almost inseparable from the teaching environment, even during face-to-face class sessions. Do not forget that the recent pandemic catalyzed the education transition process. The drastic change in education causes institutions to struggle with unexpected challenges (Ali, 2020). Therefore, implementing educational technology, applications, and platforms complements the existing pedagogy and practice. It also allows the teachers to access online resources while conducting classes in the virtual classroom.
2.3 Technology pedagogical content knowledge framework
TPACK represents the knowledge teachers require to teach with technology, thereby enhancing and elevating the learning environment (Lai et al., 2024). Unlike the domains discussed earlier, TPACK encompasses the fundamentals of unique yet effective teaching with technology integration. It conceptualizes the content of the subject using technology and designs teaching methods and practices as supportive tools for delivering knowledge. TPACK is about how teachers use technology to express their thoughts in designing the lesson, identifying the technology that can enhance students’ understanding of the subject.
Based on the findings of previous studies examined, one significant limitation is the validity of the results. In addition, due to the self-assessment, the data collected from the survey questionnaire have a high likelihood of bias (Kosiol and Ufer, 2024). Teacher self-assessment of their TPACK knowledge domains does not necessarily justify the teacher’s actual knowledge proficiency regarding TPACK (Kosiol and Ufer, 2024). The teachers assessed their TPACK proficiency based on their perceptions, rather than seeking feedback from their students regarding their TPACK proficiency. It prevented teachers from fine-tuning their lesson plans according to students’ feedback, which in turn affected the teaching and learning experience. Therefore, teachers’ TPACK proficiency should be examined from students’ perspectives, rather than through self-assessment. This research will develop and distribute a fine-tuned TPACK survey to the students to gather their responses regarding their teachers’ TPACK in virtual classroom teaching.
In accordance with the post-pandemic phenomenon, conducting lessons through virtual classrooms has slowly become the norm. Disparities of technology and modern education emphasize the importance of teachers’ readiness in preparing teaching materials with their TPACK proficiency (Li, 2025). With the technology that has vastly developed nowadays, teachers’ proficiency in TPACK translates to their ability and efficacy in integrating technology into their teaching (Antony et al., 2025). Hence, adapting the technology and progressively exploring how it can help teach is a more practical approach. Therefore, technology-related elements such as TK, TCK, TPK, and TPACK are critical in determining teachers’ proficiency in integrating technology into their curriculum. This research proposed and developed a MIS. The teachers will then utilize the proposed MIS to support and enhance their teaching practices and content representations in the virtual classroom. From the TPK aspect, the teachers were required to maintain their students’ interest in the virtual classroom with the help of technology. From the perspective of TCK, the teachers had to utilize the integrated technology to present the subject’s teaching materials. However, due to the restriction on interactivity between teachers and students in the virtual classroom, examining the SCE is more feasible, as it reflects their interest and commitment to academic activities that have the potential to influence their academic performance positively.
2.4 Student course engagement
According to Handelsman et al., the students’ engagement leans more toward external factors such as the teaching and learning environment and practices (Handelsman et al., 2005). Therefore, it remains unclear whether the students are committed to the course. Thus, the Student Course Engagement Questionnaire (SCEQ) was developed to address the known issue. Introducing SCEQ is concerned with the instantaneous class atmosphere. Initially, the SCEQ should assess the engagement of the students who enrolled conventionally and physically (Handelsman et al., 2005). The SCEQ offers a clearer picture and overview of students’ engagement with their courses. Students can achieve better academic performance and higher satisfaction levels toward their courses if they thoroughly understand SCE satisfaction. Compared to NSSE and AUSSE, which were developed and tailored for specific countries coping with the culture and trends, SCEQ offered a more generic assessment for SCE.
On top of that, SCEQ is also viable for accessing online learning. The engagement in the online learning environment, which is closely related to it, remains unhindered by the course of study (Naiker et al., 2022). However, the level of engagement varies depending on the type of course content, delivery approaches and techniques. Therefore, the SCEQ is a preferred instrument for this research, based on previous studies and findings. It is essential to assess a student’s SCE, as it indicates a student’s commitment or interest in academic activities that can have a positive influence on their academic performance.
2.5 Interactive whiteboard
In the past, teachers invented the chalkboard to assist with teaching. The concept conveyed by the chalkboard makes it a crucial component of the educational technology puzzle. The chalkboard has evolved into an IWB in the modern era, sharing a similar appearance but improved with more functionalities. The IWB enables teachers to achieve better interactivity and engagement, as well as increased accessibility of information and multimedia representation of content (Jahangir et al., 2024). In addition, it helps teachers with better visualization capabilities in presenting content. It is a type of equipment that offers teachers an innovative teaching approach with effects on several senses (Uduak and Kasumu, 2022). It involves visuals, audio and interactions while operating the IWB. It enriches the lessons with a more vibrant environment and approaches, boosting the teacher’s teaching efficacy in teaching and digitalizing the teaching and learning process.
Meanwhile, students can engage in a constructive discussion in the presence of the IWB, encouraging collaborative learning (Shi et al., 2023). However, despite the benefits of IWB implementation, it has various drawbacks. The most significant disadvantage is the cost of the IWB. The purchase and maintenance costs of the IWB are relatively high when compared head-to-head with mobile technology. In addition, the IWB is a highly dependent piece of hardware that requires a complex setup, which can be troublesome for teachers. It also fell short due to a lack of technical support and insufficient training for teachers who use it in the classroom (Mokoena et al., 2022). The steep learning curve of IWB results in teachers having low efficacy in utilizing IWB for problem-solving during lessons (Mokoena et al., 2022). Although online classes recently became trendy, most teaching materials are still optimized for conventional face-to-face classroom teaching practices (Lai et al., 2022a). In fact, the effectiveness of IWBs in the classroom has yet to be proven due to the lack of empirical studies on them. Ironically, the teachers could not spare quality time for their students to use the IWB, which defied its purpose.
2.6 Screen share
The transformation of the classroom environment results in the physical face-to-face class being conducted in a synchronous online session. Hence, virtual whiteboards are necessary for synchronous online classes (Khan et al., 2021). Because of the nature of synchronous online classes, the tools used must be real time. In synchronous sessions, teachers often use screen sharing to present their teaching materials and content (Basilaia and Kvavadze, 2020). In addition, synchronous online sessions have become an increasingly essential part of online teaching platforms due to recent changes in the education trend. One of the most concerning aspects of the online teaching and learning mode is that most third-party software used during the COVID-19 pandemic involves synchronous online sessions (Dash et al., 2022). Therefore, the screen-sharing feature is an inseparable component that assists teachers in the virtual classroom, providing real-time interactions.
Furthermore, although someone may have given or distributed lecture slides to the students during a lecture session, the whiteboard often contains more valuable information (Rai, 2020). Hence, the teachers must utilize the digital whiteboard to present their teaching materials and the subject. Various video conference services are available for teachers to choose from for conducting classes in a virtual environment (Dash et al., 2022). However, regarding the content presentation using the digital whiteboard provided by these video conference platforms, teachers found it very inconvenient to use a mouse to write or draw (Heraty et al., 2021). It is preferable to use a smartphone or tablet as a medium to write on a digital whiteboard and screen-share with the class (Lai et al., 2022a). However, the screen-share is not always a pre-built feature for smartphones or tablets. Therefore, these prior studies depict that the screen-share feature is one of the vital elements of teaching in the virtual classroom environment. Therefore, the findings of prior studies indicated the need for a digital whiteboard in the virtual classroom. These studies also revealed that using a mouse to write on the digital whiteboard is troublesome. They cannot use their devices as digital whiteboards, and screen sharing is cumbersome. Hence, providing an all-in-one solution that transforms smartphones and tablets into digital whiteboards and offers screen-sharing services is crucial for conducting online classes.
2.7 Research gap
Researchers determined research gaps after conducting the literature review in the previous section. First, the researchers from prior studies adopted the TPACK framework to assess the proficiency of the teachers in the knowledge, specifically: (1) PK, (2) CK, (3) TK, (4) PCK, (5) TCK, (6) TPK, and (7) TPACK. Their proficiency in these knowledge domains reflected their ability to integrate technology effectively and their students’ academic performance. However, most related studies examined the TPACK framework from an educator’s perspective. Limited studies have investigated the TPACK framework from the students’ perspective. Hence, there is a need for the research to be more extensive to study the framework from a different perspective. The research gaps are tabulated in Supplementary Table 2.
The TPACK framework did not relate to the SCE factor, where technology and engagement are inseparable in online classes (Bond et al., 2020). SCE is vital in the virtual classroom and needs to be examined in conjunction with the TPACK framework (Mohammad Hisham et al., 2021). Therefore, it became necessary to research SCE alongside TPACK from a broader perspective.
3 Methodology
The current research adopted the TPACK framework and the SCEQ to design a framework that is fundamental in answering the research questions raised. Hence, a research framework is proposed, as illustrated in Figure 1.
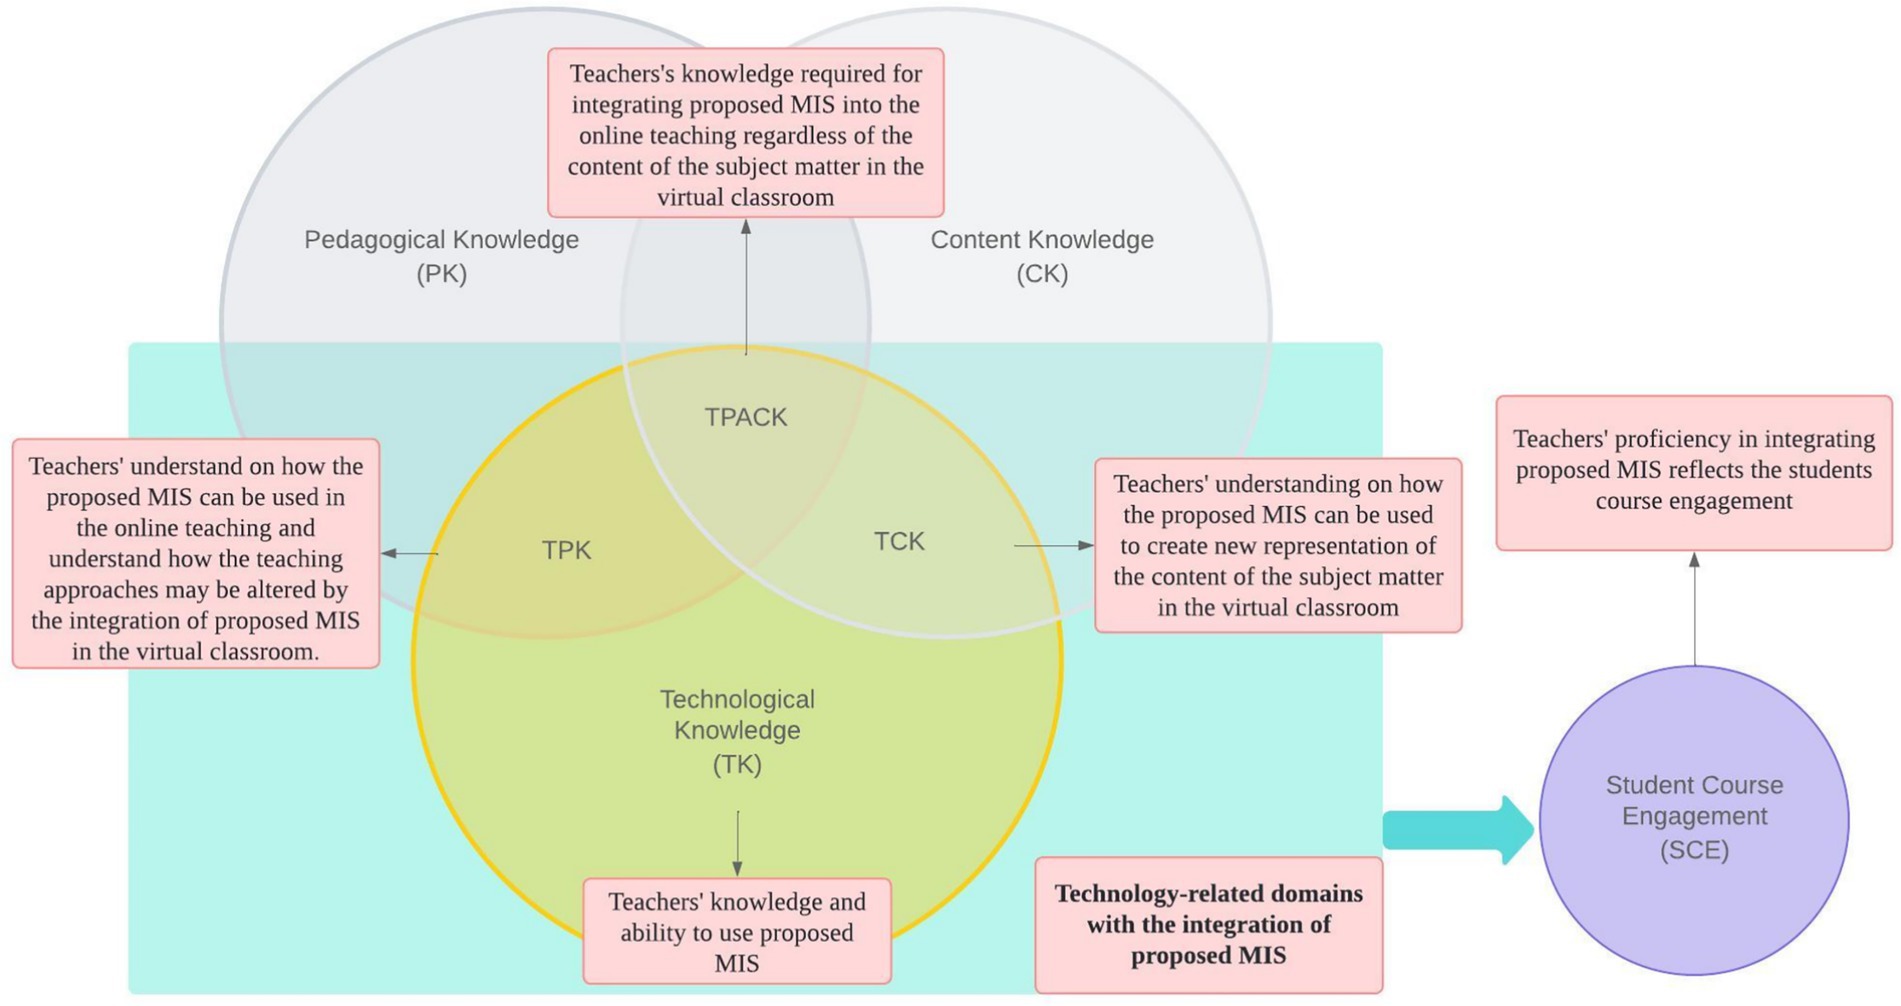
Figure 1. Proposed research framework.
The proposed MIS is considered the independent variable in the proposed research framework. Aside from the independent variable, there are five dependent variables: (1) TK, (2) TCK, (3) TPK, (4) TPACK, and (5) SCE. The researchers conducted the classes in two different settings to manipulate the independent variable: (1) an online teaching session without the proposed MIS integration (controlled condition) and (2) an online teaching session with the proposed MIS integration (experimental condition).
3.1 Research methods and activities
To achieve the stated outcomes, the current research methods and activities were conducted following four phases: (1) literature review, (2) development of the proposed MIS, (3) development of survey instruments, and (4) test of hypotheses formed. In Phase I, the team reviewed the literature on mobile application design, drawing on existing studies. This phase should gain findings and serve as the foundation for the design of the proposed MIS. They also planned hypotheses during this phase. Phase II saw the development of the proposed MIS, which included adequate features and a tailored user interface. They developed the proposed MIS with freehand digital writing and synchronous display features. In Phase III, the team discussed the quantitative method and analysis of the research survey instruments. The surveys adopted in the current research were the TPACK questionnaire and the SCEQ.
The adopted questionnaires were modified to fit the current research, and experts from related fields of study validated the questionnaire items. In Phase IV, the formulated hypotheses were assessed using various data analysis techniques to examine the proposed MIS’s effect on teachers’ proficiency in TPACK, students’ academic performance, and SCE. Figure 2 shows an overview of these phases.
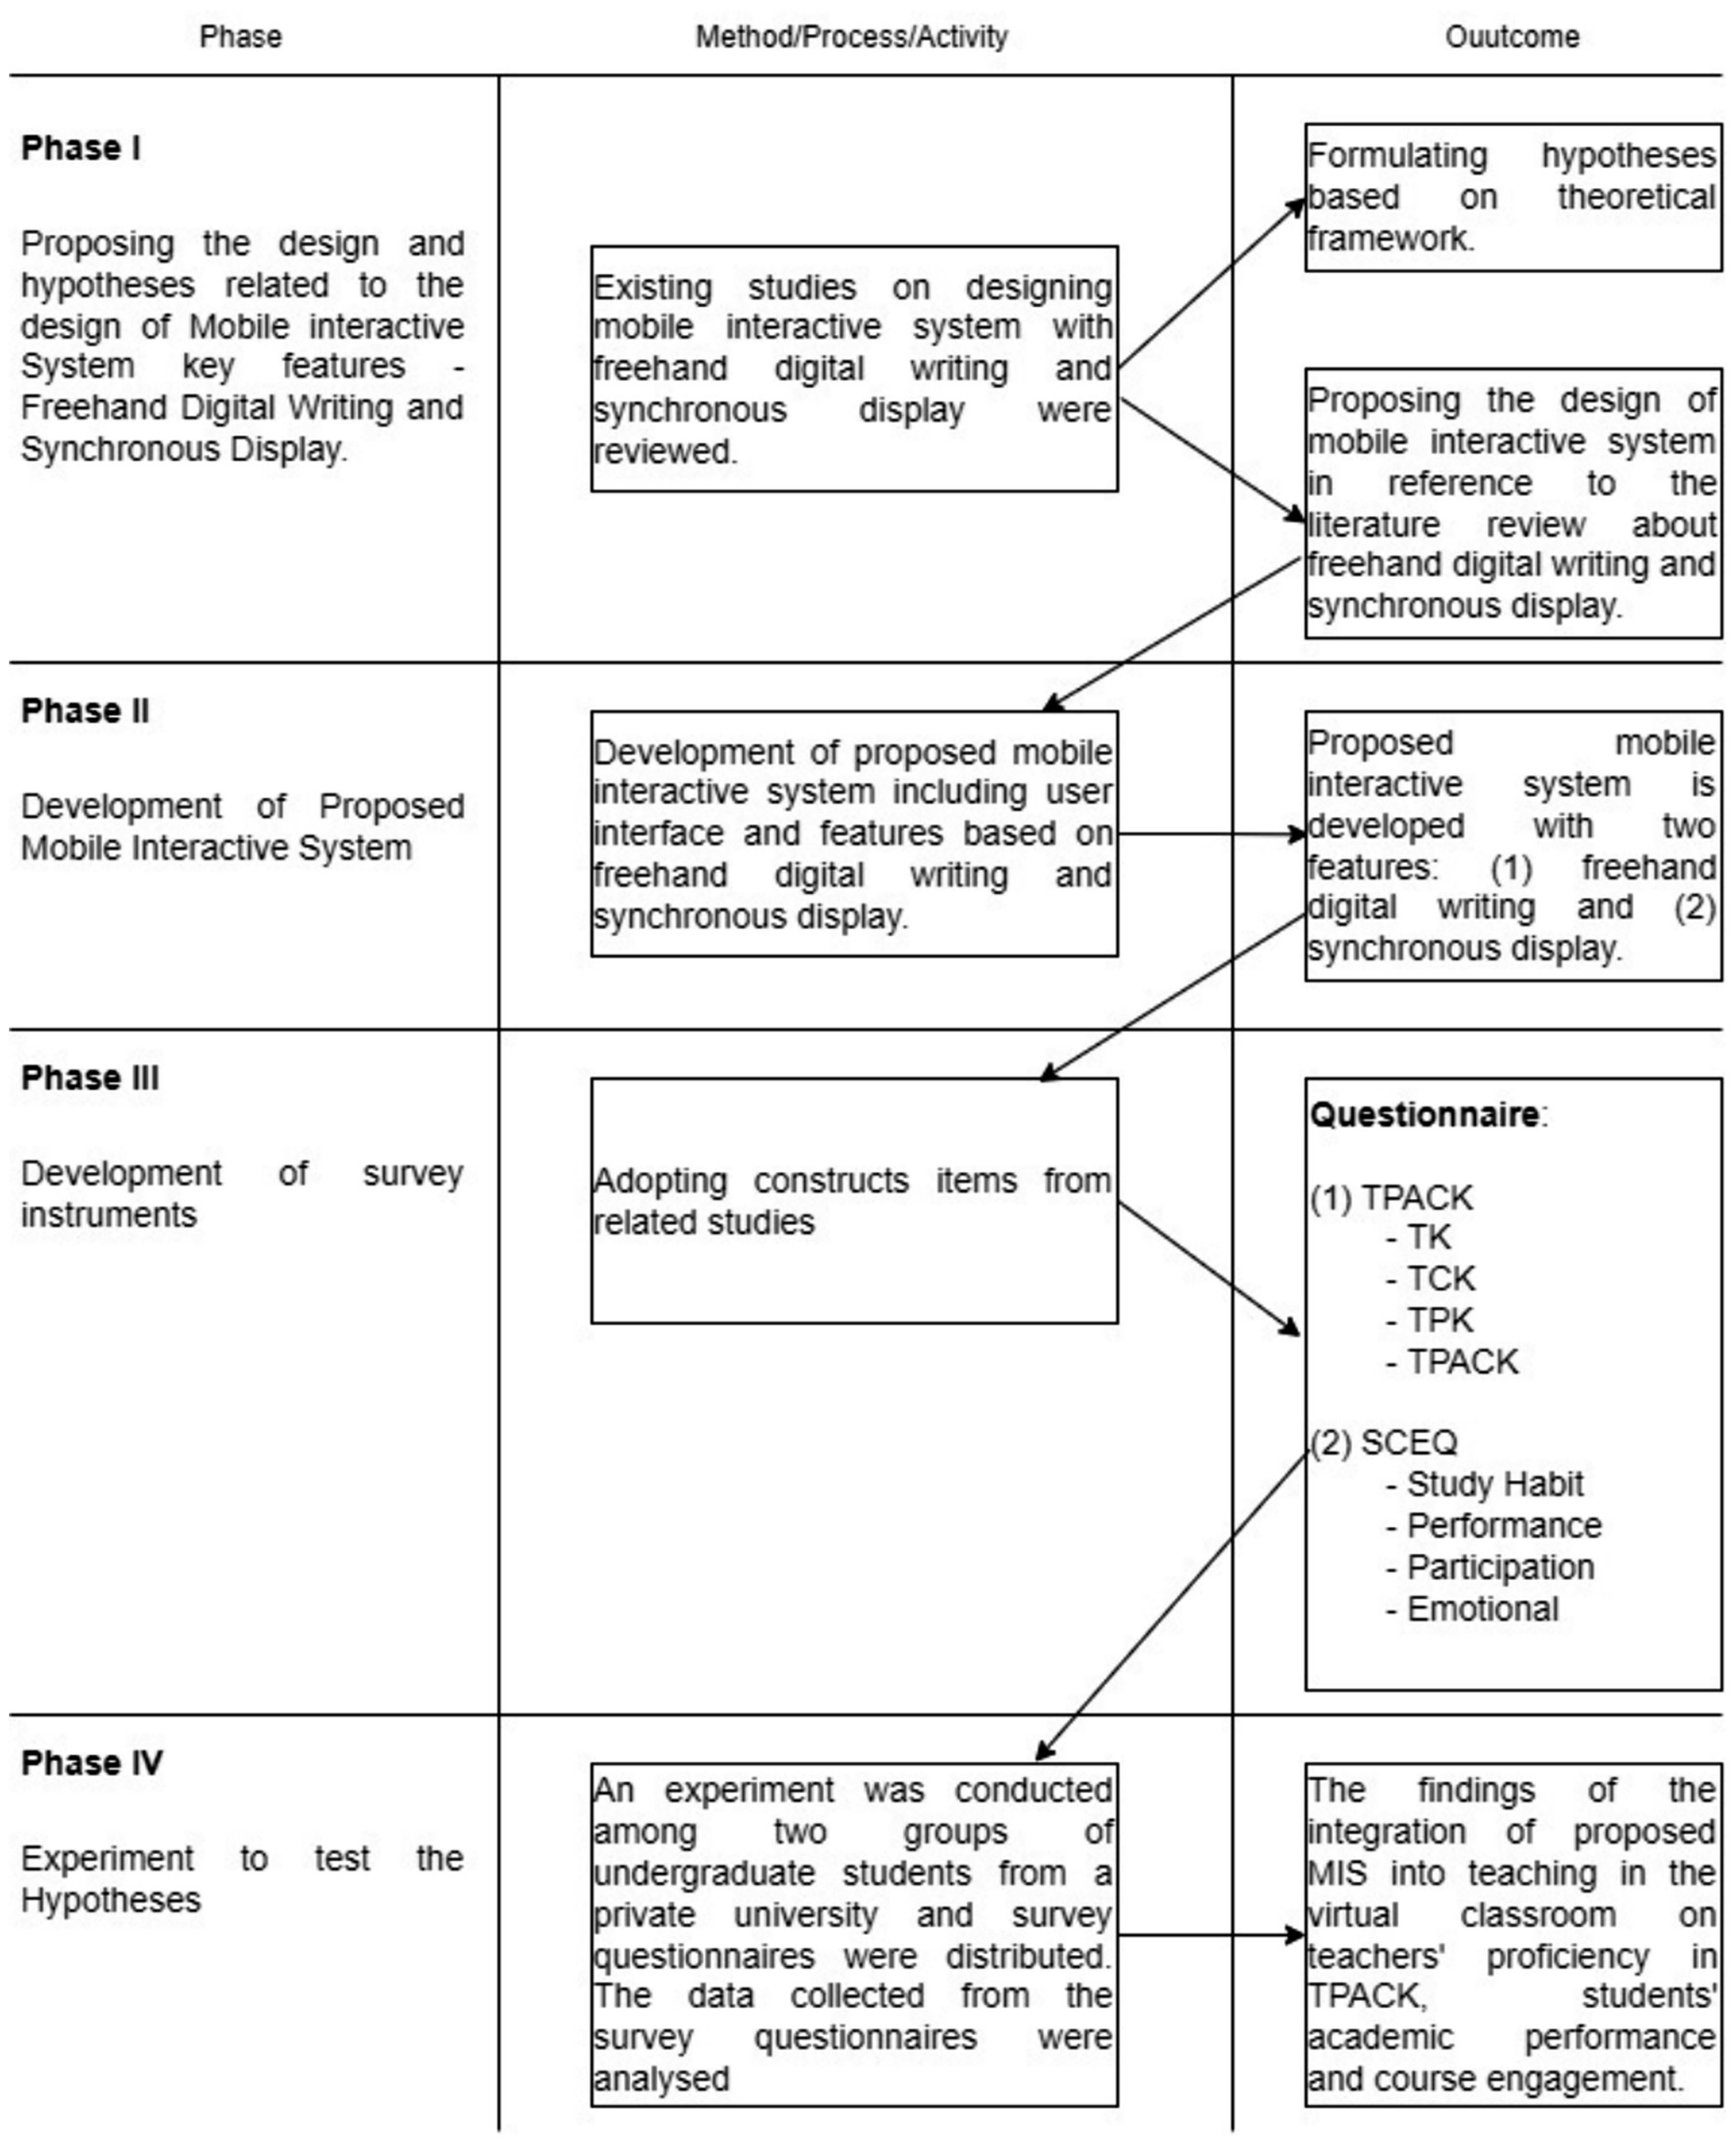
Figure 2. Overview of methods, processes, and activities framework.
In the initial phase, the TPACK-SCE framework, which adopted the TPACK framework with the inclusion of SCE as an additional variable, was formed. The previous study focused mainly on technology integration (Habibi et al., 2020). The current research intended to provide a more thorough understanding of the interconnection between TPACK elements and their relationship with technology integration and SCE. Figure 3 displays the formulated TPACK-SCE framework.
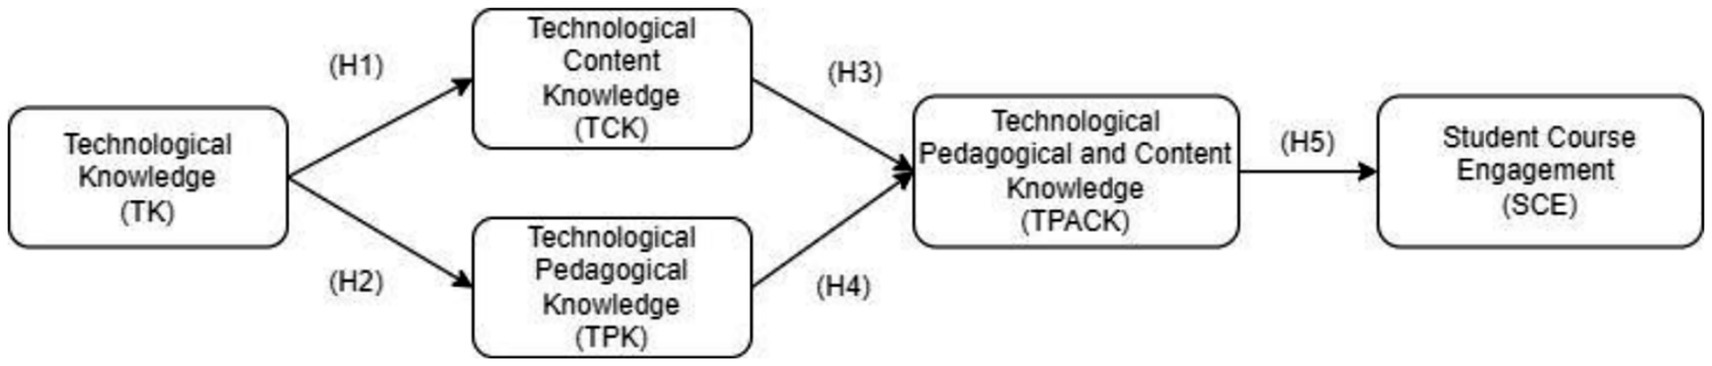
Figure 3. TPACK-SCE framework.
Therefore, the hypotheses of the current research can be formulated as follows:
H1: TK positively predicts TCK in the virtual classroom environment.
H2: TK positively predicts TPK in the virtual classroom environment.
H3: TCK positively predicts TPACK in the virtual classroom environment.
H4: TPK positively predicts TPACK in the virtual classroom environment.
H5: TPACK positively predicts SCE in the virtual classroom environment.
In the phase of proposing the design of the proposed MIS, the key features must adhere to the virtual classroom teaching needs. Hence, the proposed MIS utilized freehand digital writing to replicate the conventional whiteboard experience. Although an alternative like an IWB is available, it is bulky and has a high learning curve, making it unsuitable for virtual classrooms. Most importantly, it requires the teachers and the students to be physically present in the classroom to utilize it. Therefore, the IWB is not an ideal tool for virtual classrooms because of its technical and technological issues. The researchers designed the proposed MIS in this research with simplicity and a digital writing feature that helps to promote SCE with a low learning curve. Moreover, it is intended as a mobile application that uses the smartphone as a freehand digital writing board. The proposed MIS synchronous display feature allows the freehand digital writing board to be projected through all web browsers. It eases online teaching in the virtual classroom environment by replicating and mimicking the physical classroom environment. Therefore, the proposed design of the current study is the simplified replication of the digital whiteboard in the virtual classroom, excluding the complexities of its predecessor mechanism.
In the development phase of the proposed MIS, with considerations gathered from prior studies, the proposed MIS was developed as a mobile application for flexibility and extensiveness. As a software-based solution, it eliminates the high learning curve and technical support IWBs require. Compared to IWBs, the proposed MIS freehand digital writing board was a complementary tool for the teachers, assisting and enriching their teaching in the virtual classroom. Such a feature helps teachers convey their thoughts and knowledge to their students in the virtual classroom, providing similar experiences to those they had in the physical classroom. It reduced the learning curve drastically compared to IWB implementation. It only requires the teachers to use their fingertips or a stylus to write on their smartphone screen, which brings utmost simplicity and convenience while teaching in the virtual classroom. Additionally, the freehand digital writing board offers various customizations to help teachers adapt to different use cases and scenarios. The customization includes (1) stroke thickness selector, (2) stroke color selector, (3) eraser thickness selector, and (4) local storage for written/drawn work pieces. Aside from the core functionalities of the freehand digital writing feature, it can also share screens by offering a synchronous display feature. The synchronous display feature captures the screen of the installed device and displays it in real time on the chosen browser. The proposed MIS freehand digital writing feature is presented in Figure 4.
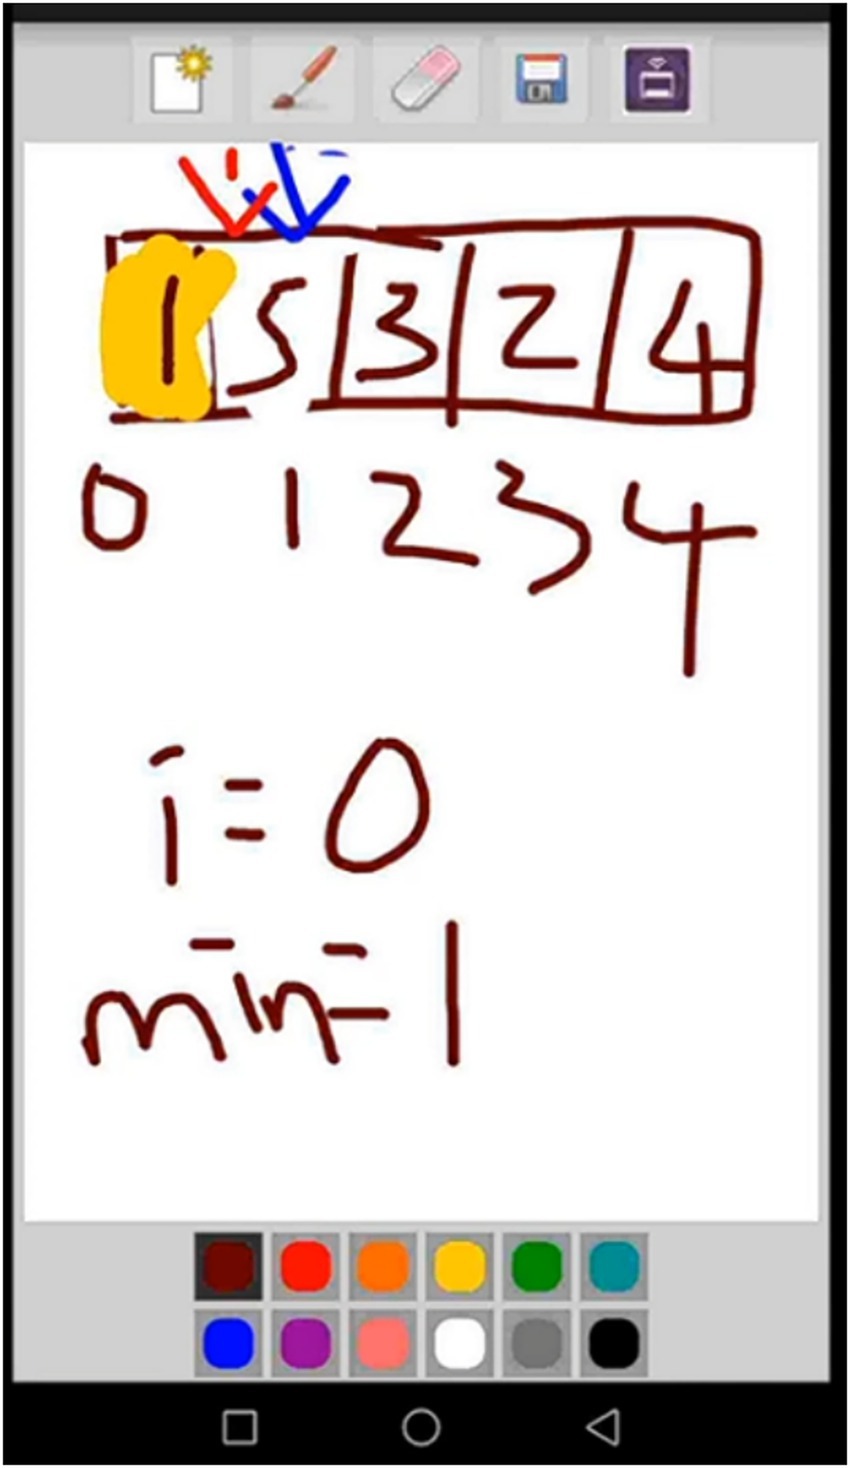
Figure 4. TPACK-SCE framework.
In feature wise, the proposed MIS freehand digital writing feature functions are illustrated in Figure 5. The leftmost icon is the “new drawing” function, where a new dedicated writing and drawing blank space will be created by clearing the existing used space. The function is shown in Figure 6. In addition to that, the second leftmost icon is the “stroke thickness selector” function, which allows the teachers to pick their preferred stroke thickness to fit different scenarios in the content representation of the subject matter. Similarly, the proposed MIS freehand digital writing feature also comprises the “eraser thickness selector” function, allowing the teachers to erase or edit the writings and drawings. The thickness selector for both stroke and eraser is shown in Figure 7. Moreover, the writing and drawings can be saved in the local storage of the smartphone device. The function is shown in Figure 8, whereas the saved location of the writings and drawings is shown in Figure 9. Finally, the rightmost icon in the screen sharing function in which the synchronous display feature of the proposed MIS will be prompted and triggered. It is illustrated in Figure 10.

Figure 5. Main functions of proposed MIS freehand digital writing feature.

Figure 6. New drawing.
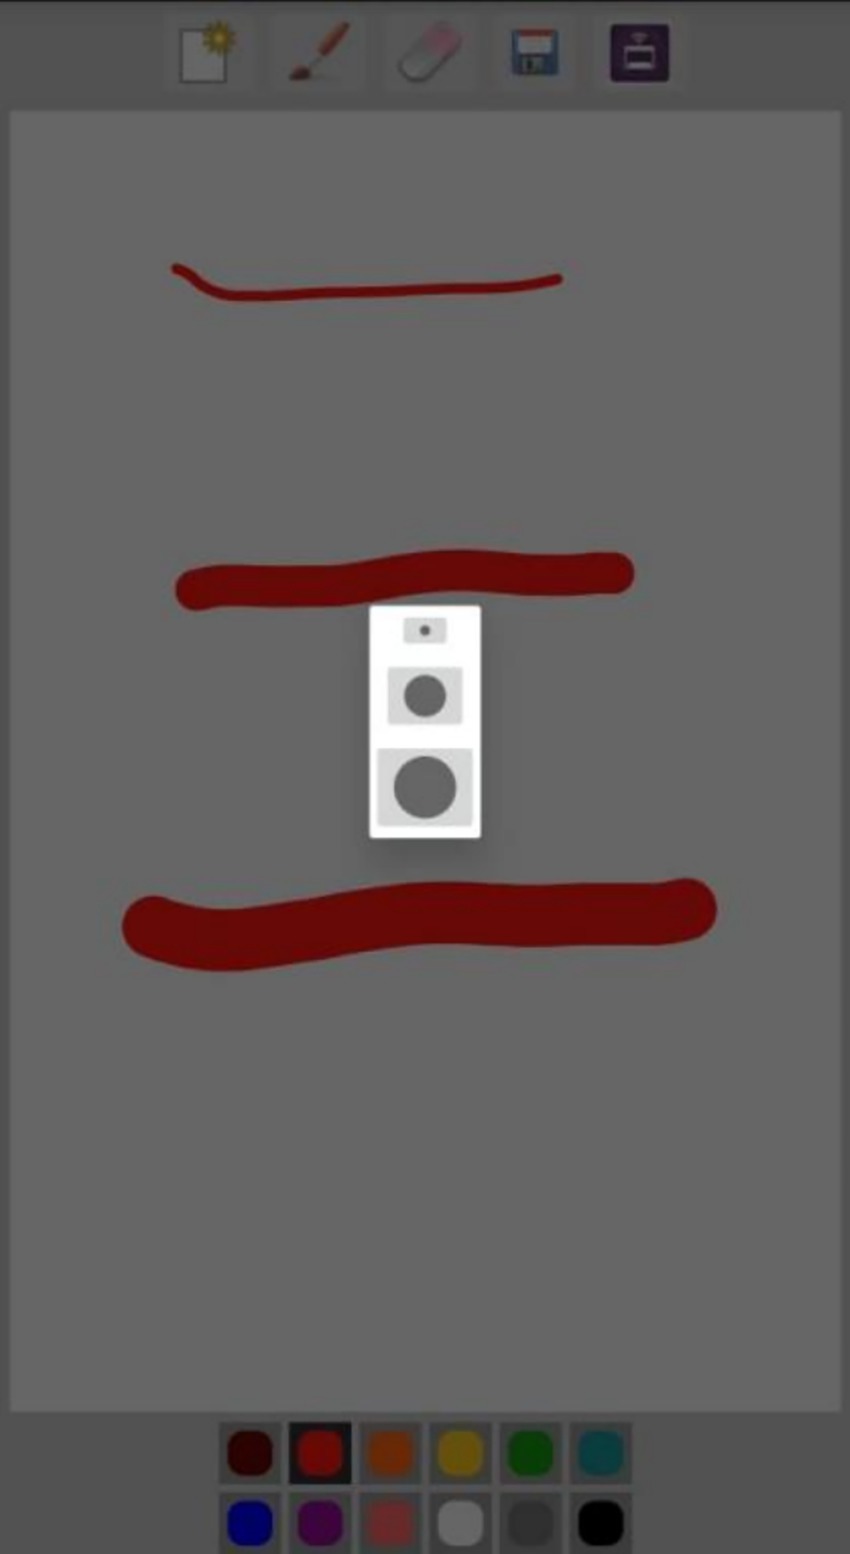
Figure 7. Thickness selector for stroke and eraser.
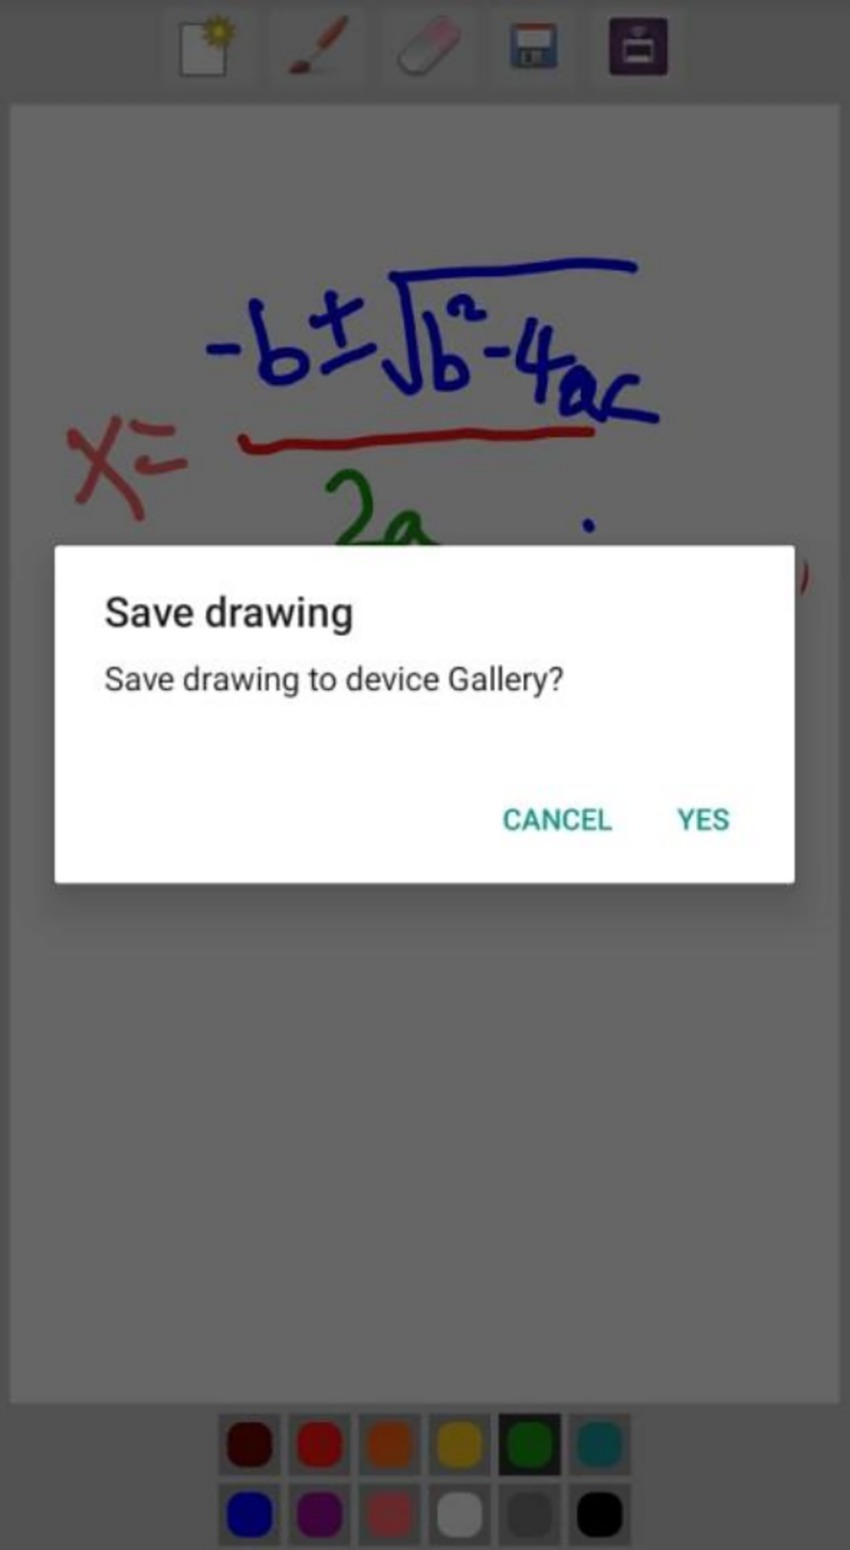
Figure 8. Save drawing.
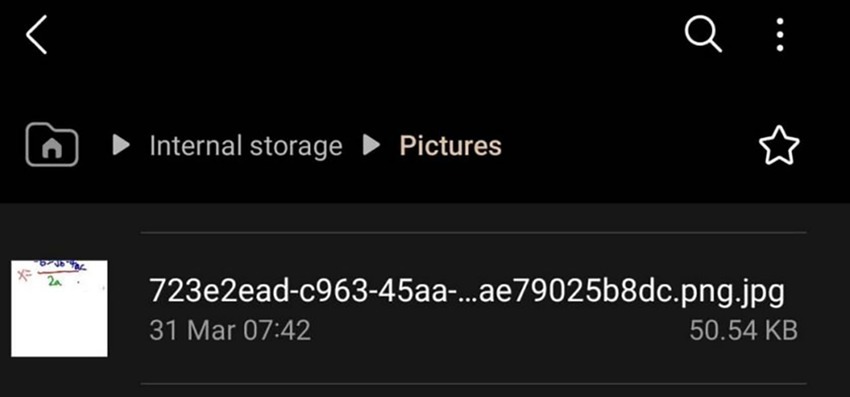
Figure 9. Writings and drawings saved location.
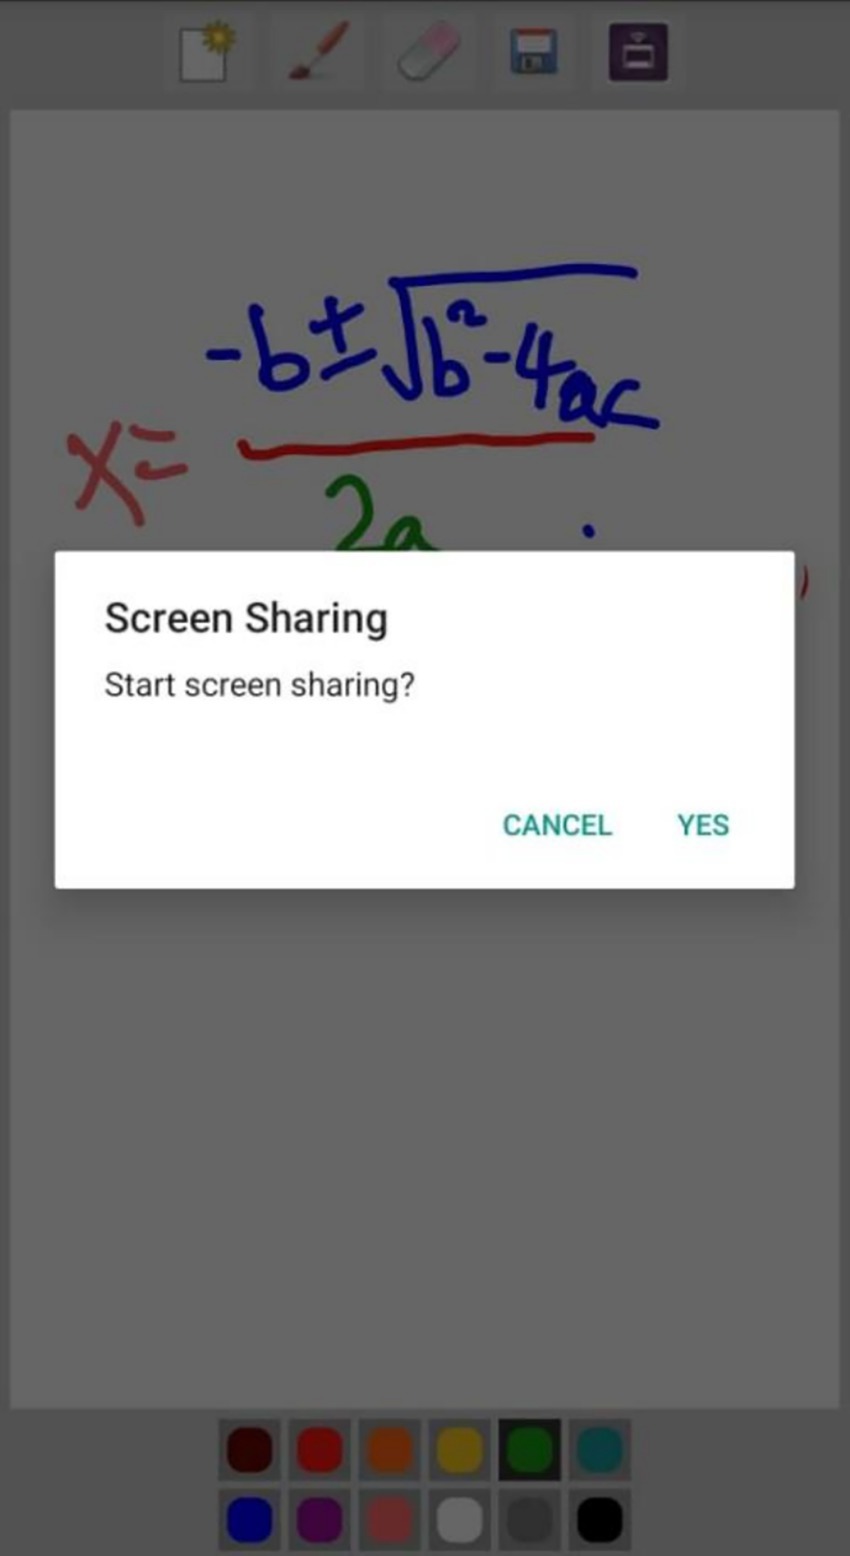
Figure 10. Screen sharing.
As shown in Figures 11, a connection screen is prompted by agreeing to the screen share service. As the service starts, the synchronous display feature will be executed. The sample screen of the synchronous display feature is shown in Figure 12.
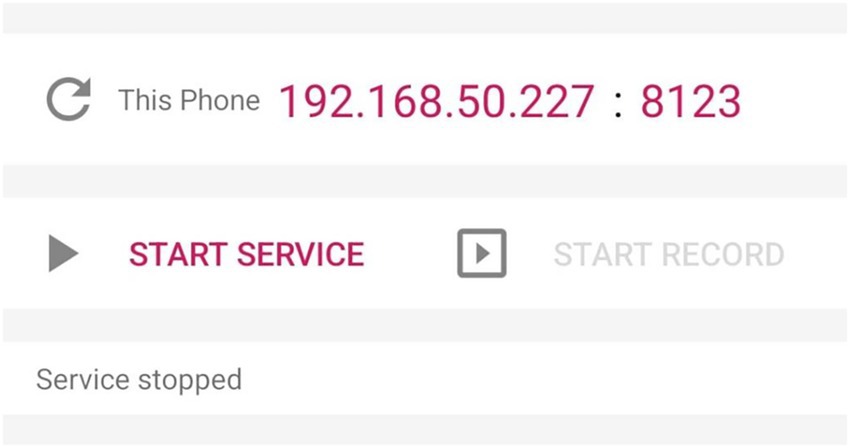
Figure 11. MIS synchronous display connection screen.
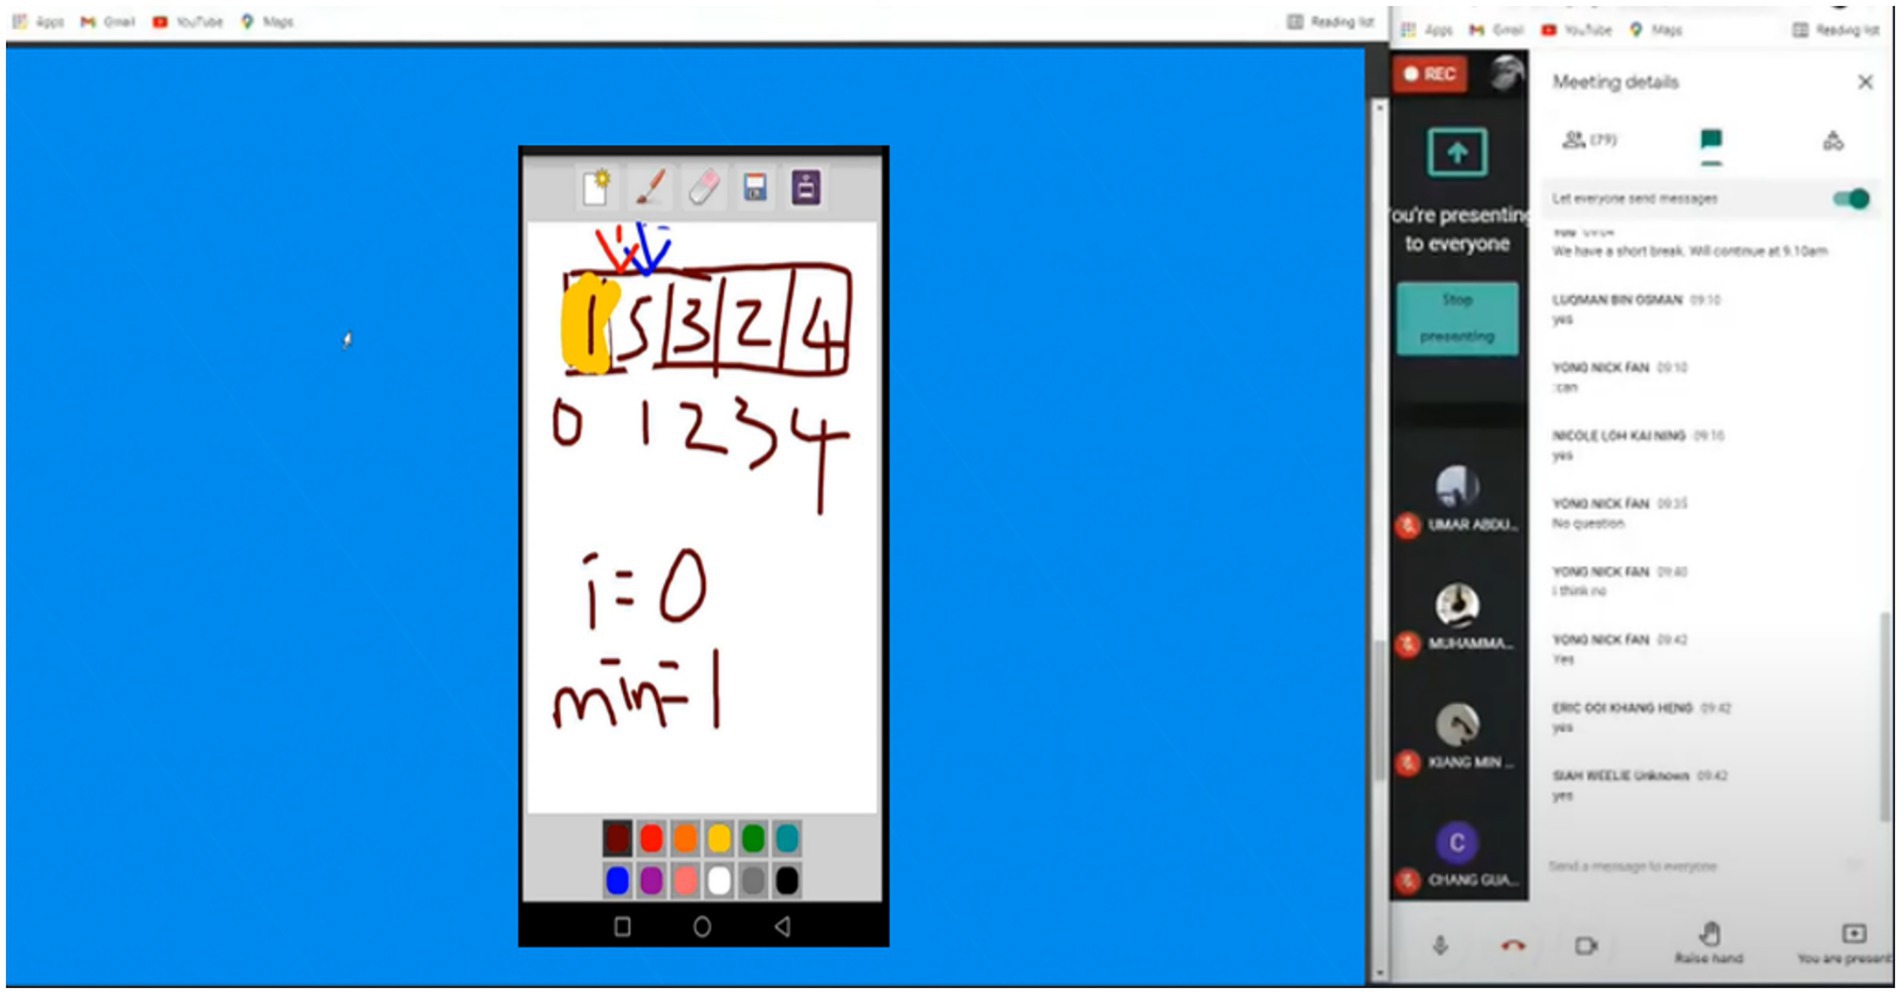
Figure 12. Proposed MIS synchronous display feature.
The proposed MIS and its features are developed through an integrated development environment named Android Studio. It is software for developing and building Android-based applications with a graphical user interface. The proposed MIS is developed as a native Android mobile application that does not support operating systems other than Android-based devices. The choice of the built environment and supported operating system is based on the majority of the user base and the development cost. The Android Studio software is an open-source software ideal for development, as it is free to use. In terms of programming, the programming language used in developing the proposed MIS is Java. Therefore, Java version 1.8.0_311 is used to develop freehand digital writing and synchronous display features. In addition, Java is the chosen programming language because it is capable of socket programming. The socket programming in Java is mainly for the communication between applications that execute in different Java Runtime Environment (JRE). In this research, Java socket programming is required for the synchronous display feature, in which the smartphone or tablet screen will be screen-shared.
Survey instruments were developed in the following phase to assess the proposed MIS. The current phase used quantitative data collection and statistical data analysis approaches for TPACK-SCE framework validation. In addition, the identification of framework factors contributed to predicting teachers’ proficiency in TPACK based on students’ perceptions and its impact on virtual classroom engagement. The adopted constructs from previous research were modified and refined to ensure the validity and relevance of the survey’s content were achieved. Then, the sampling method and survey distribution process were outlined. Finally, quantitative data analysis was implemented to provide statistical insights. Figure 13 illustrates the overall process of the quantitative method.
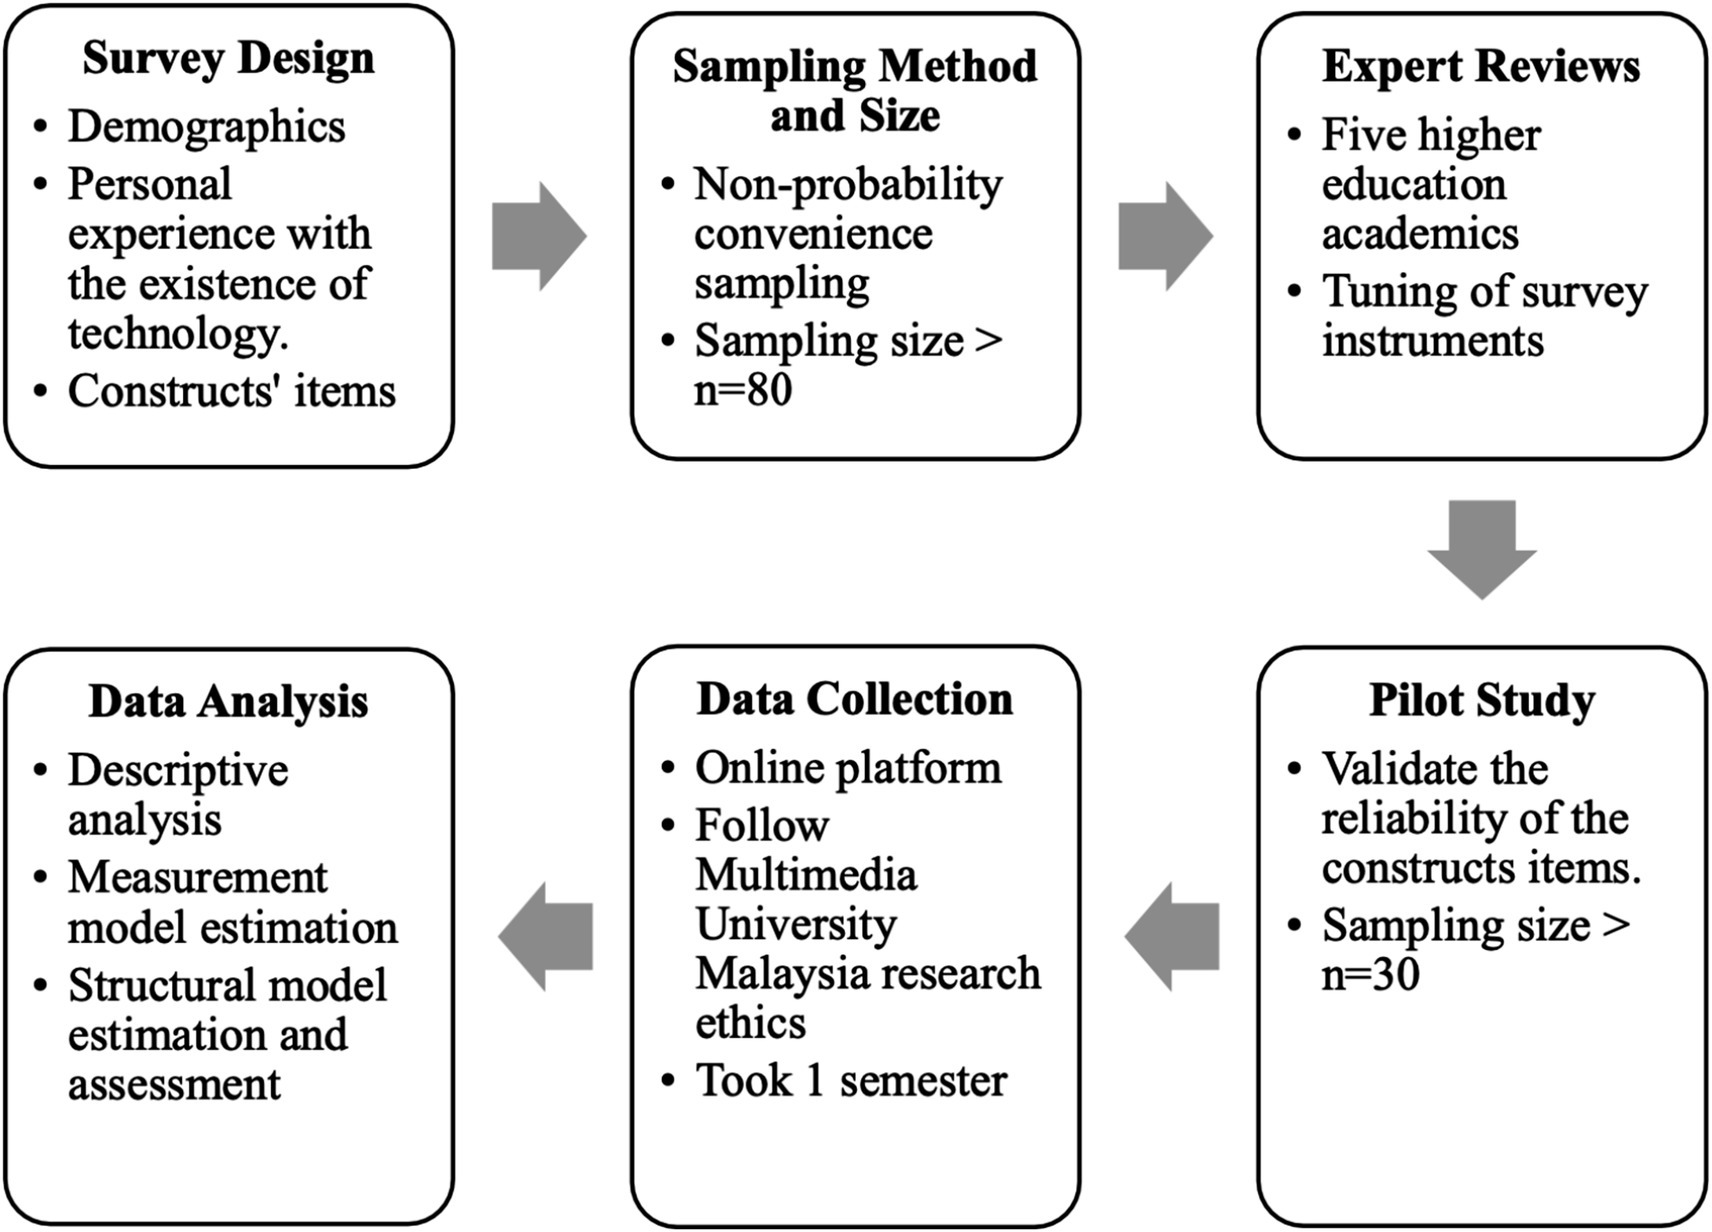
Figure 13. Overall picture of the quantitative methods process.
In terms of survey design, the questionnaire was prepared in English for the TPACK and SCEQ to facilitate ease of understanding. The adopted constructs were translated into scale items for the survey, respectively. The surveys were self-reported, and the constructs were fine-tuned to achieve the research objectives.
The TPACK survey was segmented into three main parts: (1) respondents’ details and academic background, (2) respondents’ experience with technology assistance, and (3) TPACK constructs’ items from students’ perspectives, which were designed with 5-point Likert Scales. The scales ranged from 1 to 5, indicating from “strongly disagree” to “strongly agree,” which is a commonly practiced measuring instrument in social science research (Taherdoost, 2019). The full version of the items is presented in the Appendix, while Supplementary Table 3 shows some of the original and modified scale items.
Technological knowledge (TK) emphasizes respondents’ beliefs and thoughts regarding their teachers’ integration of technology in their teaching. Aside from that, it also reveals the students’ preferences for technology after attending online classes via virtual classrooms, which serve them better. For instance, Table 1 shows a modified scale item from TK, “I prefer my lecturer to enhance online learning by using technological devices in his/her teaching (e.g., Smartphones, Tablets),” indicating the teachers’ proficiency in TK measurement from students’ perspective.
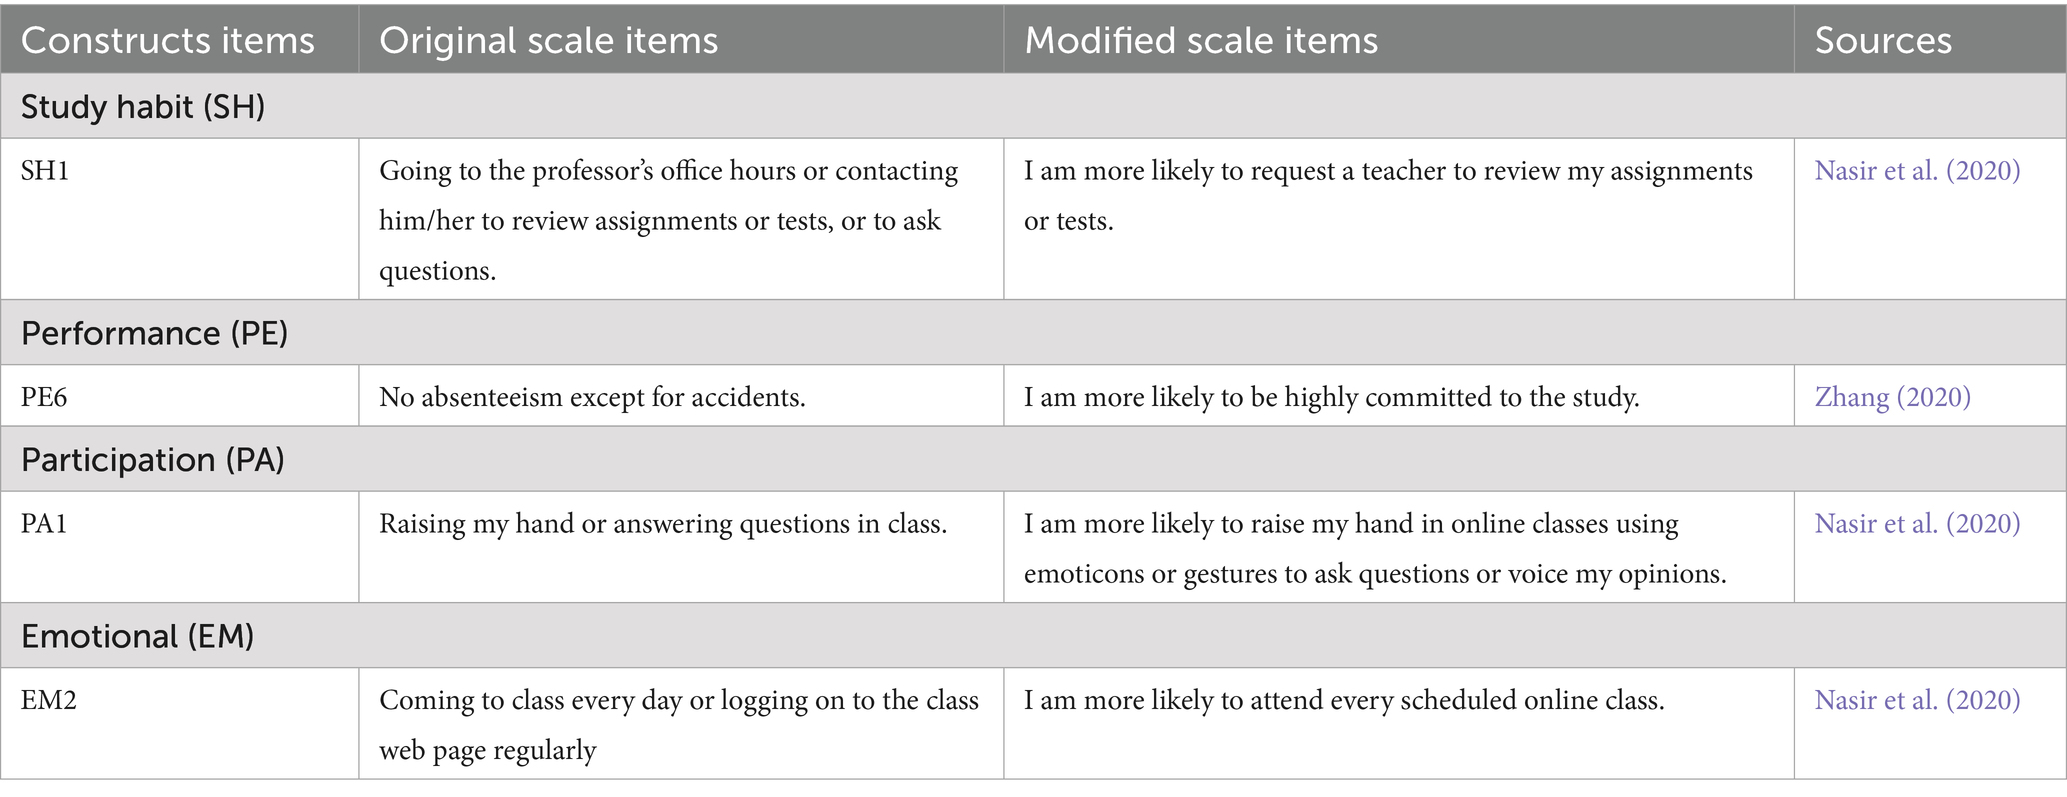
Table 1. Instruments for SCEQ constructs items.
In terms of technological content knowledge (TCK), it emphasizes respondents’ opinions about their teachers’ proficiency in enhancing the online learning experience in virtual classrooms, including technology integration. The technology integrated refers to the developed MIS of the current research. In this context, the modified scale item, “I prefer my lecturer to enhance online learning by utilizing MIS in developing knowledge for the subject that he/she teaches.,” depicts the thoughts of the respondents regarding the MIS integration and its utilization in developing knowledge for the subject.
Technological pedagogical knowledge (TPK) emphasizes respondents’ points of view regarding their teachers’ proficiency in enhancing online learning experiences by integrating the developed MIS. For example, one of the modified scale items, “I prefer my lecturer to enhance online learning by using MIS to enhance his/her online teaching effectiveness,” shows the students’ preferences toward their teachers’ effectiveness in integrating the MIS into their online lessons in the virtual classrooms.
In terms of TPACK, it emphasizes respondents’ thoughts regarding their teachers’ proficiency in escalating online learning experiences with developed MIS features. For instance, one of the modified scale items, “I prefer my lecturer to enhance online learning by integrating MIS in his/her virtual classroom that enhances the teaching and learning experience of the subject that he/she teaches in terms of what he/she teaches, how he/she teaches, and what I’ve learned.,” depicts the students’ preferences toward their teachers’ proficiency and efficacy in integrating MIS features into online lessons in the virtual classrooms.
The current research grouped the SCEQ survey’s scale items into three categories: (1) respondents’ details and academic background, (2) respondents’ online learning experience, and (3) SCEQ constructs’ items. A 5-point Likert scale survey was designed and prepared. The scales ranged from 1 to 5, representing “strongly disagree” to “strongly agree,” respectively. Table 1 presents some of the original and modified scale items; the full version of the items is presented in the Appendix.
Study habits (SH) in SCEQ represent the strategies for students to succeed in their learning. In their learning, it often relates to the effort and self-discipline that students exhibit. One of the modified scale items for SH is, “I am more likely to request a teacher to review my assignments or tests.” As for performance (PE), it emphasizes the students’ motivation to study and learn. PE is strongly related to how students perform academically. For instance, one of the modified scale items reads, “I am more likely to be highly committed to the study.” Moving on to PA, it highlights the students’ willingness and interest to interact with others, regardless of peers or teachers. For instance, “I am more likely to raise my hand in online classes, using emoticons or gestures to ask questions or voice my opinions.” In terms of EM, it depicts the students’ commitment to learning, where eagerness and self-drivenness are the qualities that best describe the known construct item. For instance, I am more likely to attend every scheduled online class.”
Five Malaysian higher education academicians reviewed the modified TPACK and SCEQ surveys used in the current research. These academicians were pioneers in social science studies and had extensive research experience. The forms and surveys were given to them digitally. Their feedbacks were acquired to serve and ensure the validity of the survey instrument.
Before conducting the experiment for the current research, a pilot test was conducted to verify the reliability of the questionnaires. The pilot test involved 40 undergraduate students from the same subject tutorial group. It fulfilled the minimum sample size requirement as suggested for parameter estimation. Throughout the pilot test, the developed MIS was integrated as an assisting tool for online teaching and learning in the virtual classroom. The pilot test lasted for 3 months, which is equivalent to one semester. By the end of the semester, the surveys were distributed to the participants, who had 30 min to complete them. To validate the reliability of the questionnaires’ constructs, the Statistical Package for the Social Sciences (SPSS) was used. The reliability of the questionnaires’ constructs is determined by Cronbach’s alpha, whose values commonly fall between 0 and 1. The closer the value is to 1, the better the reliability of the constructs. The Cronbach’s alpha value has a distinctive measurement benchmark for different degrees of construct reliability. The value >0.60 is considered acceptable (Khanal and Chhetri, 2024), >0.70 is considered good, >0.80 is considered better, and >0.90 and above is considered excellent (Taber, 2018). The reliability of the constructs in the pilot study for the TPACK and SCEQ surveys is shown in Tables 2, 3, respectively. In the meantime, the construct items of SCEQ in the current research were treated as a whole to cater to the extended possibilities of SCE.
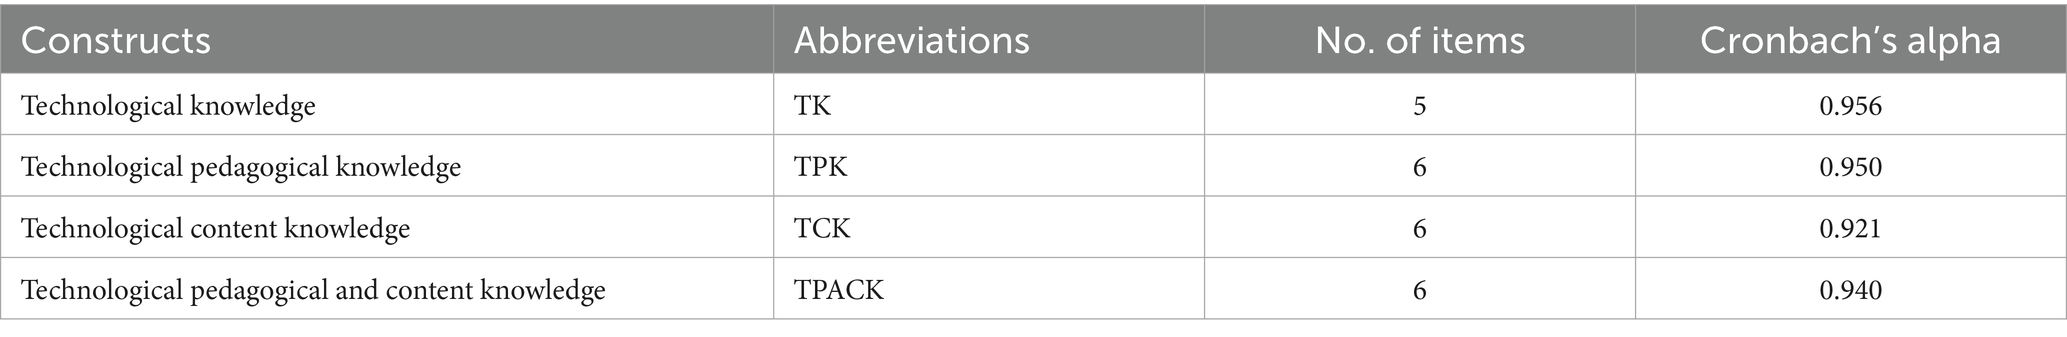
Table 2. Reliability of TPACK survey.
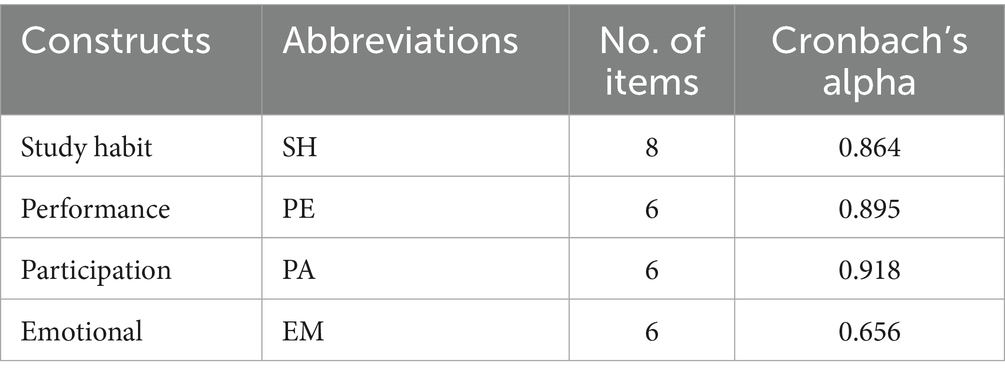
Table 3. Reliability of SCEQ survey.
After a pilot test, the experimenters tested the hypotheses of the current research. In terms of sampling techniques, nonprobability convenience sampling is a preferred sampling technique over probability sampling techniques. In the current research, students from a private higher education institution participated as respondents, and they were assigned to different tutorial groups. One of the groups had developed an MIS integrated when the experiment began. The non-probability convenience sampling technique is an ideal option for the current research experiment because its prerequisite sample size is not mandatory.
Aside from the sampling technique, the sample size is also vital for the validity, reliability, model fit, and statistical power in structural equation modeling (SEM) for the current research. Compared to covariance-based SEM (CB-SEM), partial least squared SEM (PLS-SEM) requires a smaller sample size. PLS-SEM only requires the “10 times” rule of thumb, which depends on the complexity of the research model, while CB-SEM requires at least 200 samples. Theoretically, PLS-SEM is more preferable over CB-SEM in this research as it focuses on the sample’s predictive power (Vukovi’c, 2024).
The constructs of the current research are solely reflective. In the meantime, the current research model comprises two construct types: (1) endogenous constructs and (2) exogenous constructs. In this context, the minimum sample size of the current research model is determined by the maximum arrowhead count that points to any latent variable in the path model of PLS. The minimum sample size for the current research model is the arrowhead count times 10, which is 50 samples, as the research framework of the current study has five arrowheads. The arrowhead count of the research framework is shown in Figure 14.
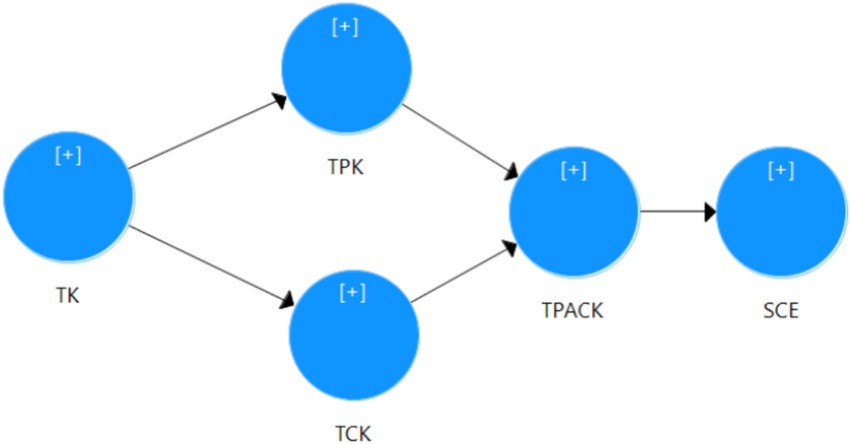
Figure 14. Arrowheads count of the research framework.
In the research experiment, 80 active undergraduate students enrolled in online classes participated as subjects. Due to their mode of class enrollment, they are well-suited to participate in the current research experiment. These participants were also enrolled in the same subject and taught by the same instructor. On top of that, none of the participants were told or informed about the integration of the proposed MIS. Its purpose is to ensure unbiased perceptions among the participants, thereby eliminating the possibility that the experiment’s results may be contaminated by unforeseen bias.
During research experiments, the 80 participants were divided into two groups: one group received instruction with the proposed MIS integration and the other group attended their online class without it. The experiment used an online platform to align with the core features developed in the proposed MIS. In the initial phase of the experiment, both groups took a pre-knowledge checking test. It is intended to examine the participants’ homogeneity of their prior understanding regarding the subject, as they were all at the same level. The test results were kept for the academic performance assessment of the participants in the later phase. The participants were asked to complete the test within 20 min via Google Forms. The participants attended online classes after completing and submitting the test. By the end of the semester, participants were given a post-knowledge checking test to assess their academic performance after the experiment period. The results of the test were compared with the pre-knowledge checking test results obtained at the beginning of the semester. The participants were requested to complete the test within 20 min via Google Forms. After completing the post-knowledge checking test, the participants were given a TPACK questionnaire, which assessed their teachers’ proficiency in the TPACK when conducting online lessons through virtual classrooms. Finally, the participants were given the SCEQ questionnaire to evaluate their SCE. The data acquired from the experiment were further analyzed.
In SEM, exogenous latent variables are independent variables and endogenous latent variables are dependent variables. PLS-SEM aims to develop exploratory theories or predict the purpose of research, focusing on maximizing endogenous constructs variance Hair et al. (2017). Hence, it is ideal for the current research as it involves predictions and theory development. In addition the reliability of the questionnaires in the current research, descriptive statistics regarding the respondents’ demographic data were also produced. To ensure the reliability, validity, and consistency of the TPACK-SCE framework, confirmatory factor analysis (CFA) and PLS-SEM using SmartPLS (v3.3.3) were implemented. On top of that, the formulated hypotheses were tested, and the structural framework of TPACK-SCE was estimated using PLS-SEM.
Regarding the validity measurement of the current research, the data collected from the distributed self-reported survey may be susceptible to common method bias, as the same respondent responded to both the dependent and independent constructs. Therefore, it is crucial to measure the reliability of the constructs. Since the constructs in the TPACK-SCE framework are reflective, examining internal consistency reliability is necessary when assessing the reflective measurement model. Cronbach’s alpha and composite reliability (CR) were used to evaluate the framework’s internal consistency reliability. Additionally, the measurement of convergent validity was applied, as it describes the degree to which the new scale aligns with other variables and measures of the same construct. The indicators’ outer loadings must be higher than 0.7, indicating statistical significance. The average variance extracted (AVE) values are higher than 0.5, showing sufficient convergent validity (Hair et al., 2017).
In addition to that, the measurement of discriminant validity is crucial in distinguishing between overlapping constructs that differ empirically from one another. The current research prefers the Heterotrait-Monotrait ratio of correlations (HTMT) because it offers a more stringent criterion with a higher detection rate and lower false-positive rate than Fornell and Larcker’s criterion (FLC) (Hair et al., 2017). In addition, HTMT also have a higher peculiarity and sensitivity rate up to 97–99%.
In terms of structural model estimation and assessment, the hypothesized relationships between constructs and the predictive capability of the TPACK-SCE framework were examined. The variance inflation factor (VIF) assesses the collinearity statistics of the structural model. Bootstrapping with 5,000 re-samples was used to investigate the significance of the path coefficient. It was intended to achieve path coefficient significance by fitting the recommended thresholds of 1.96 and 2.57 for a 5% and a 1% significance level, respectively (Hair et al., 2017). Regarding the predictive power of the TPACK-SCE framework, R2 explained the variance of the endogenous construct. The closer the value of R2 is to 1, the higher the accuracy of the framework prediction. Moreover, a formula: (R2 included –R2 excluded) / (1 – R2 included) was used to calculate the effect size f2. The effect sizes for enormous, medium, and minor effects are 0.35, 0.15, and 0.02, respectively (Lorah, 2018). In addition, Stone-Geisser’s Q2 was ideal for this research to assess predictive relevance as the TPACK-SCE framework is a reflective model (Hair et al., 2017). It can be evaluated through blindfolding. This technique involved omitting the data points of the endogenous construct’s items and removing the parameters using the remaining data points. If the Q2 value is greater than zero, it indicates that the endogenous construct has predictive relevance in the model. The Q2 values of 0.35, 0.15, and 0.02, respectively, represent substantial, medium, and small predictive relevance (Hair et al., 2017).
4 Results and discussion
The collected data were analyzed and presented accordingly. From a descriptive statistics perspective, the respondents’ demographic data were tabulated. It included 80 undergraduate students from a local private university who were enrolled in the same subject. These respondents were from two different tutorial sessions. Due to incomplete pre- and post-knowledge test submissions, two responses were removed. The tabulated data included the respondents’ gender, year of study and course major. Table 4 depicts the demographic distribution of the respondents.
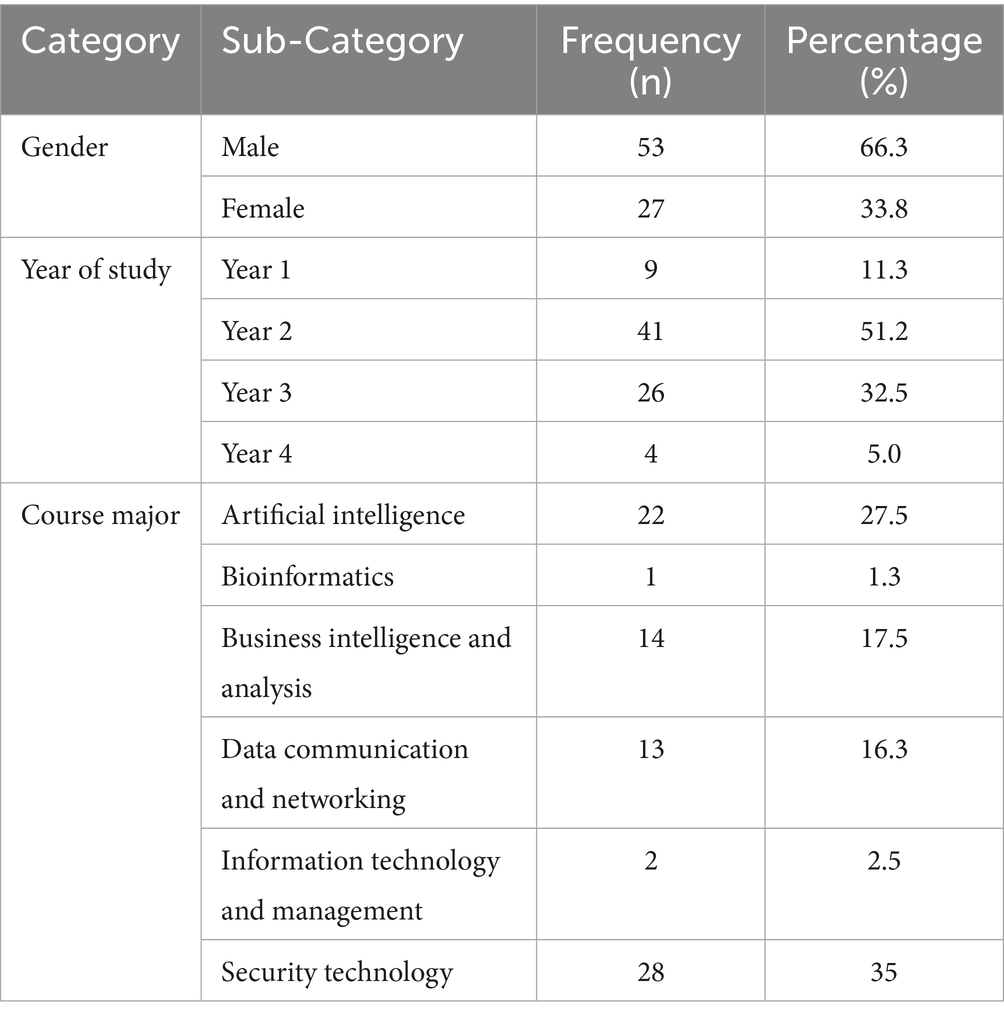
Table 4. Demographic distributions of the respondents (n = 80).
Table 4 indicates that out of 80 respondents, 53 (66.3%) were male, more than half of the sample size. The female respondents were 27 (33.8%). Aside from that, most respondents were second-year students, accounting for 51.3%. The participants, as fourth-year students in this experiment, with only four of them, occupy 5%, which has the fewest respondents. In terms of the course major that respondents enrolled in, “Security Technology’ is the most enrolled course major with 28 respondents (35%).
Furthermore, regarding homogeneity for respondents’ groups, the respondents were assigned to two different tutorial sessions. The academic institution, which was treated as an uncontrollable factor in the current research experiment, assigned the tutorial sessions. Among the assigned tutorial sessions, the respondents from “1BV” were taught using the proposed MIS integration in the current research experiment, and the other group, “1AV,” without. To assess the homogeneity of the groups, a pre-knowledge checking test was administered to all respondents. Each respondent was required to answer 10 questions, totaling 15 marks. The collected data were analyzed using the SPSS 26 software through independent samples t-tests. Hence, Table 5 illustrates the group statistics result, and the independent t-test results of the pre-knowledge checking test are shown in Table 6.
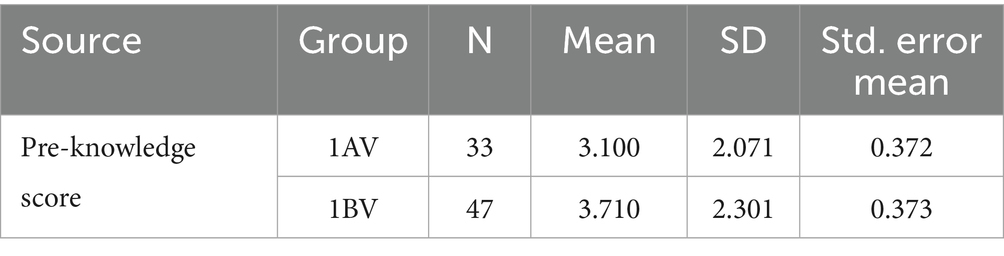
Table 5. Group statistics.
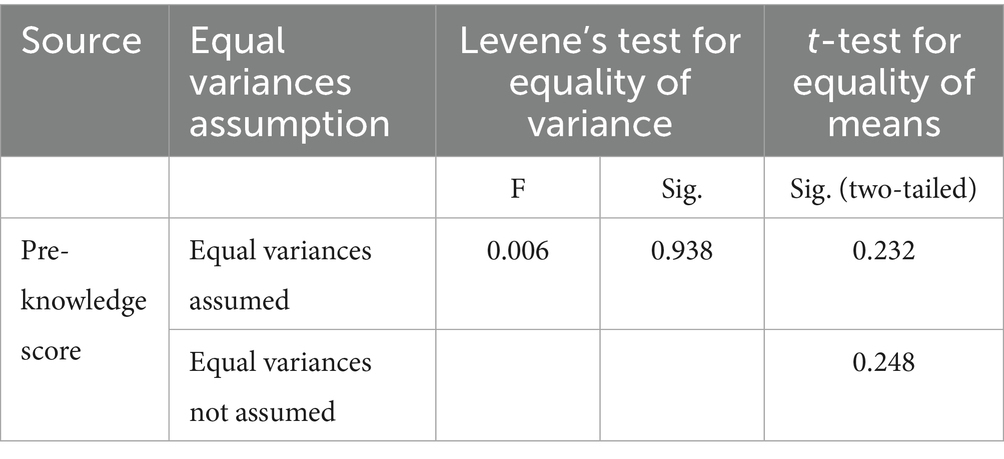
Table 6. Independent sample t-test.
According to the group statistics results, the mean score of the pre-knowledge test of both groups is nearly identical, with a difference of 0.61. The difference between 1AV and 1BV was insignificant, with a p-value of Levene’s test for equality of variance of 0.938. Hence, 1AV and 1BV are homogenous with a p-value of 0.232 through a t-test for equality of means. The proof of homogeneity between 1AV and 1BV is vital, depicting that all participants have a similar level of understanding regarding the subject at the initial stage of the research experiment. Achieving homogeneity in both groups can ensure the comparison between the two groups is more viable.
In terms of CFA, the analysis was conducted using PLS-SEM path modeling, where all constructs in the framework were measured using SmartPLS. Initially, all latent variables must be connected without recursive arrows. Next, the outer loadings, AVE, and construct reliability were assessed using a factor weight scheme, as the PLS algorithm was implemented.
Furthermore, the indicator reliability of the reflective model was investigated. To assess it, outer loadings are essential, as they represent the estimated relationship between the indicators and their latent variable. Any latent variables that carried outer loadings values <0.7, which dissatisfied the threshold of outer loadings >0.708 (Hair et al., 2017), were removed. Thus, the assessed outer loadings of the research model, as shown in Supplementary Table 10, confirmed the estimated relationship between the indicators and their latent variable.
The study used Cronbach’s alpha to assess the internal consistency reliability of the current research reflective model. However, relying solely on Cronbach’s alpha is insufficient because it assumes that all indicators relate to the construct equally. The indicator count in the constructs could make the internal consistency reliability susceptible to underestimation (Hair et al., 2017). Therefore, when assessing reliability, CR is a more appropriate choice than Cronbach’s alpha, as it accounts for indicator loadings. On top of that, a CR value between 0.7 and 0.9 is considered adequate (Gefen et al., 2000). In Table 7, both Cronbach’s alpha and CR are presented, where the Cronbach’s alpha values for all constructs are nearly 1, and the CR values exceed 0.70. These values indicate that the framework’s constructs exhibit outstanding reliability.
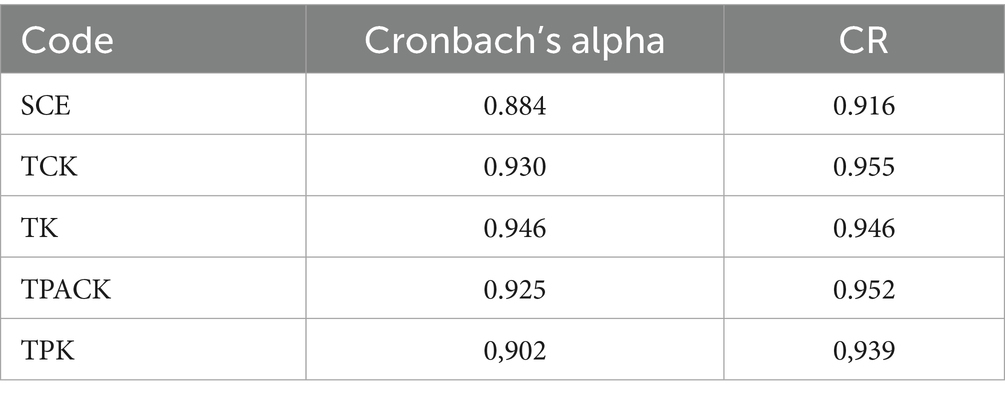
Table 7. Cronbach’s alpha and CR.
Aside from internal consistency reliability, convergent validity is also essential to be assessed. Convergent validity also represents AVE. The value of AVE must be within the threshold, with a minimum of 0.50 for each construct Hair et al. (2017). According to the results in Table 8, the indicators of each construct in this research are related to the other indicators of the same construct.
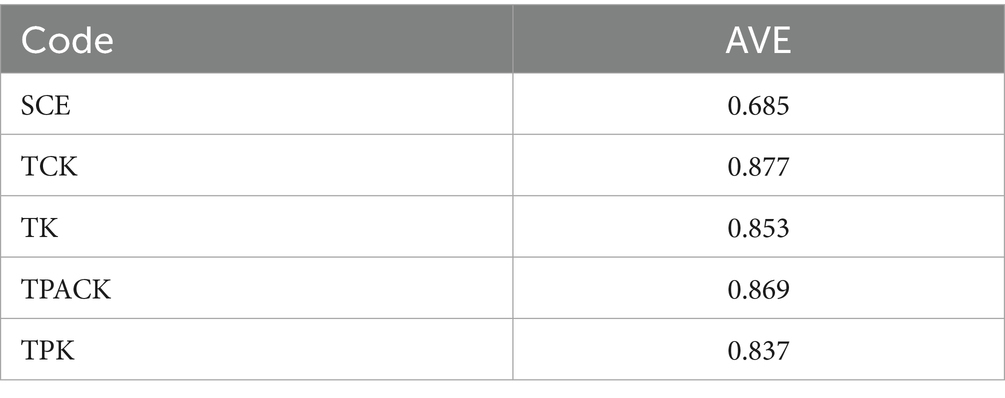
Table 8. AVE.
Discriminant validity describes the measure of constructs that theoretically should be distinctive and not highly correlated with each other (Henseler et al., 2015). In the current research, the HTMT is implemented as an alternative with high detection and low arbitrary violation rates. The value of HTMT closer to 1 indicates a lack of discriminant validity. Most of the HTMT values in the current research meet the threshold requirement, which is <0.85, as shown in Table 9, representing sufficient distinguishability of the constructs from each other. The HTMT value threshold of 0.85 is considered the best, while 0.90 is considered acceptable (Gold et al., 2001). Table 9 presents the HTMT values for the current research.
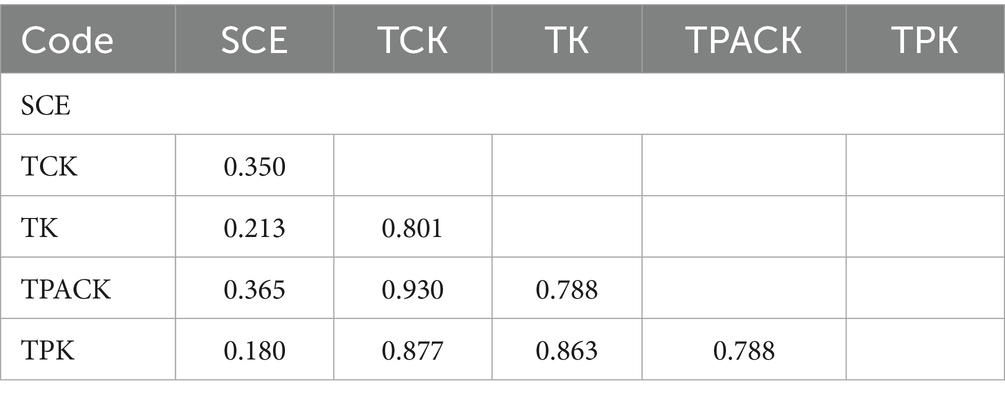
Table 9. Heterotrait-monotrait (HTMT).
As for the structural model assessment in the current research, it includes the predictiveness and relationships between constructs as the examined outcomes. First, the VIF is implemented to assess the collinearity. The threshold of the VIF is <5 to achieve low multicollinearity. The VIF values obtained in this research mainly fulfilled the VIF rule of five. These findings appear in Supplementary Table 14.
4.1 Hypotheses test
Bootstrapping with SmartPLS facilitated the estimation of path coefficients and t-values to test the research’s formulated hypotheses. The results are required to test the hypothesized relationships among the constructs. Table 10 shows the hypothesis test results.
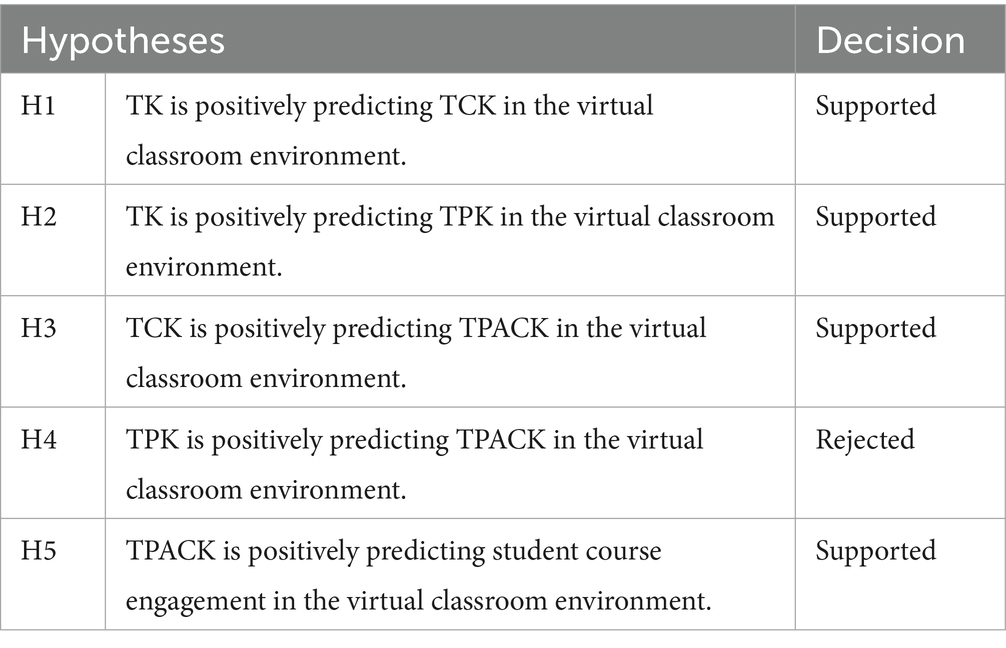
Table 10. Hypotheses and summary of findings.
Based on the tabulated results, the hypotheses indicated a positive relationship between TK and TCK, as well as TK and TPK, with substantial significance levels of p ≈ 0.000 and p ≈ 0.000, respectively. TCK also has a positive relationship with TPACK, with the statistical significance p ≈ 0.000. Also, the relationship between TPACK and SCE is positive, with a statistical significance of p = 0.044. As a result, the research supports hypotheses H1, H2, H3, and H5. Table 11 presents a summary of the hypothesis findings.
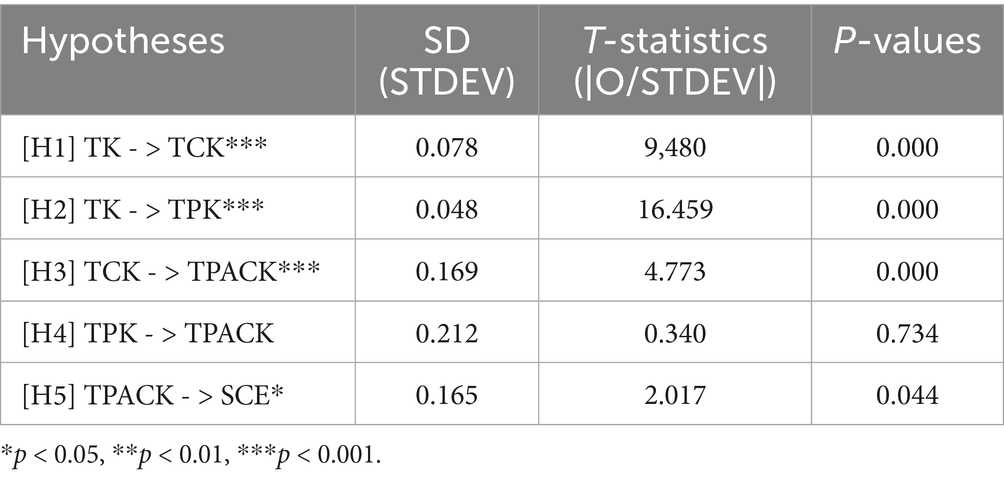
Table 11. Result of hypotheses test.
Due to the relatively new nature of the teaching environment, technology plays a crucial role in modern education. From Table 10, H1 was supported as it explained the current virtual classroom teaching environment phenomenon. It reflected the importance of the teacher’s TK in utilizing the proposed MIS to present their teaching materials. The teacher had to possess sufficient knowledge in handling technology, including hardware and software, to display their teaching materials in the virtual classroom effectively. As indicated in Table 10, H1 demonstrated how the teachers’ proficiency in using the suggested MIS translated into their presentation of teaching materials in the virtual classroom (Tables 12, 13).
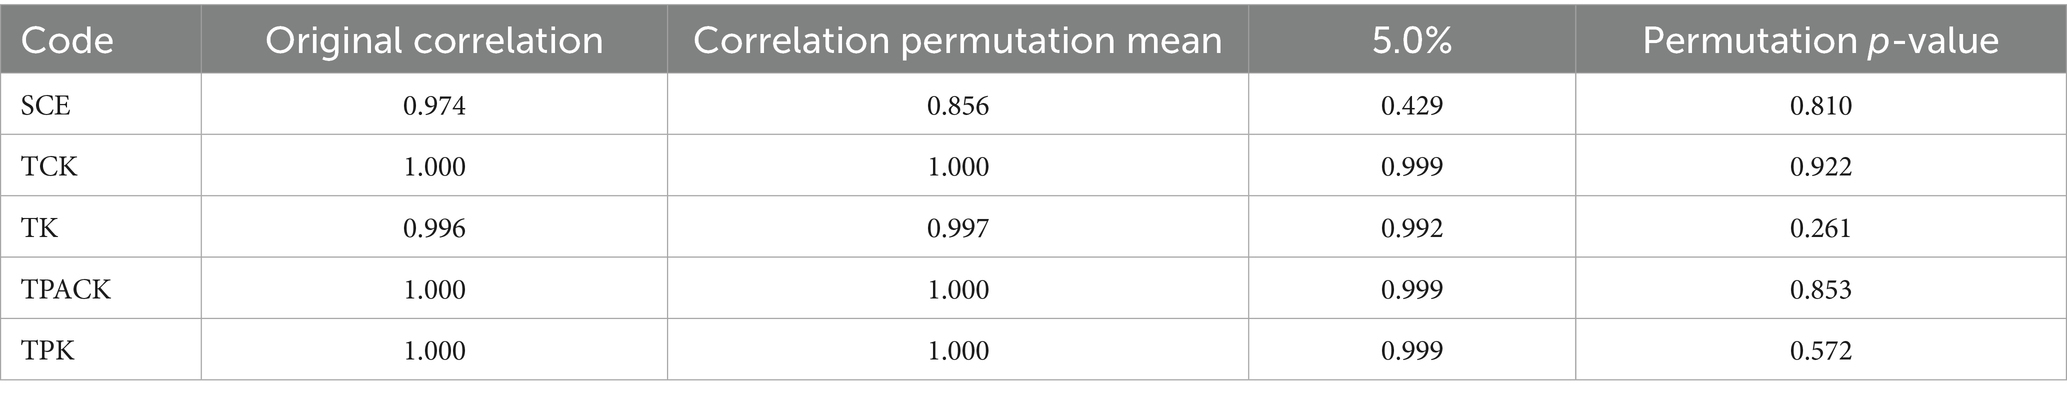
Table 12. Second step MICOM: compositional invariance.
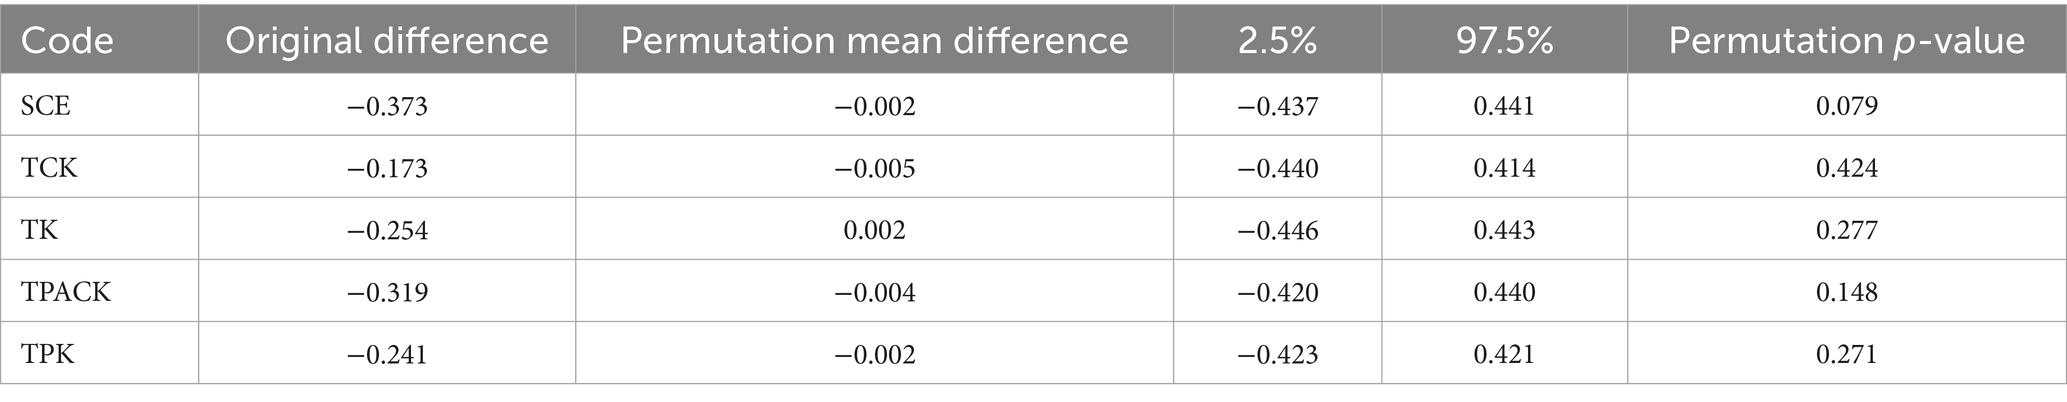
Table 13. Third step MICOM: equal mean results.
In addition, TK also reflected the proficiency of the teachers in terms of their teaching methods in the virtual classroom. The teaching methods in the virtual classroom included massive involvement of the technology, namely the proposed MIS developed in this research. The teacher’s understanding of the employment of the proposed MIS features in their teaching translated into their proficiency in TPK. As mentioned earlier in this research, most prior studies describe the essentials of the pedagogical aspect. In this research, the proposed MIS was used to assist the teachers’ teaching, in which technology positively influenced the teaching environment and methods. Therefore, the teachers’ TK is critical in determining the proficiency in integrating the proposed MIS into teaching in the virtual classroom environment. As mentioned earlier, the teaching and learning in the virtual classroom heavily rely on the technological perspective. Although the teachers could utilize and maximize the potential and capability of the proposed MIS, considering H1 and H2 alone were insufficient to explain the overall technology integration in the virtual classroom.
Despite the support for H1 and H2, teaching entails both presenting teaching materials and transferring knowledge between teachers and students. Therefore, examining the TCK and TPK alone did not provide a complete picture of the virtual classroom technology integration. Assessment of teachers’ TPACK elements was a necessity to determine their proficiency in utilizing technology in conducting online classes. The proposed MIS enhanced the presentation of teaching materials, or content-wise, from the TPACK-SCE framework perspective, which was supported. However, H4 was rejected because it suggested otherwise. Even though the classes were online, the teaching methods practiced were similar or identical to the physical class mode. It showed that the teachers were still in the early stages of adapting to the change in the teaching environment. The sudden transition in the teaching environment necessitated the reconstruction of the teaching plan within a short period, with limited insight, which may not have been feasible. The teachers were inexperienced in pre-planning their classes in the virtual classroom environment, particularly in integrating the proposed MIS developed in this research. Despite the difficulties the teachers faced while integrating the proposed MIS into their pedagogy, they presented their teaching materials using it. The proposed MIS, as a complementary tool for teachers in the virtual classroom, enhanced the presentation of the subject content. During the experiment with the integrated proposed MIS, teachers improved their TPACK proficiency in content presentation.
The teachers’ TPACK proficiency was considered in identifying its effect on the SCE. According to Table 10, the hypothesis was supported, indicating that the proposed MIS integration in the virtual classroom is an effective alternative medium that captures students’ interest in the subject. SCE in this research was not bound or limited to any specific forms. Thence, by investigating it as a whole, research showed that teachers’ improvement in teaching with technology was critical for ensuring the students were engaged and interested in the online class sessions.
Additionally, the data collected from distributed questionnaires for assessing teachers’ TPACK proficiency were gathered differently. Instead of evaluating from the teachers’ standpoint, the students’ perspectives were the primary focus of this research. It was relatively more reliable compared to the teachers’ self-assessment, mitigating possible biased input. Therefore, the support and rejection of the hypotheses were based on the students’ feedback, which is insightful for this research. As the students were participants in the experiment conducted in this research, the impact of integrating virtual classroom environment technology (proposed MIS) directly affected them.
4.2 Measurement of invariance of composite models
The measurement of invariance of composite (MICOM) results indicates an in-depth measurement invariance examination across participant groups: one with MIS integration in the virtual classroom and another group without. The MICOM findings ensure the constructs are measured equivalently across groups (Henseler et al., 2016). MICOM procedure involved: (1) configural invariance, (2) composite invariance, and (3) equality of composite mean values and variances. The current research is running MICOM in SmartPLS, and the configural invariance (Step 1) is automatically confirmed.
Proceeding to Step 2 involves the estimation of compositional invariance based on MICOM. It is tested using SmartPLS using a permutation test. The Step 2 result is shown in Table 12. The MICOM in SmartPLS uses permutation techniques; hence, the result presented is subtly different from the typical ones. On top of that, the permutation test is capable of controlling type I error (familywise error rate). The permutation test is adequate for the current research as its group-specific sample size difference is not huge (Hair et al., 2021). The results of the 1AV and 1BV groups are compared with the 5% quantile. The p-values of the permutation test should be larger than 0.05. It shows the correlation is not significantly lower than 1. The results shown in Table 12 fulfilled the criteria for which the compositional invariance is established.
Furthermore, the constructs’ quality of mean values and variance across groups is assessed to check whether full measurement invariance is achieved in the current research. In terms of the mean original difference, each of the constructs’ value should fall within the 95% confidence interval. The results were obtained via the comparison of the mean original difference to the lower and upper boundaries, which are 2.5 and 95%, respectively. Table 13 shows that the mean original difference results of the current research fall within the stated boundaries range, providing the initial evidence of invariance. Next, the composite variance results are shown in Table 14, where each of the constructs’ values should fall within the 95% confidence interval. The comparison of variance of the original difference between the two groups to the lower and upper boundaries is 2.5 and 95%, respectively. Therefore, the current research satisfied the requirement for full measurement invariance for each group based on the virtual classroom settings (with and without MIS integration).
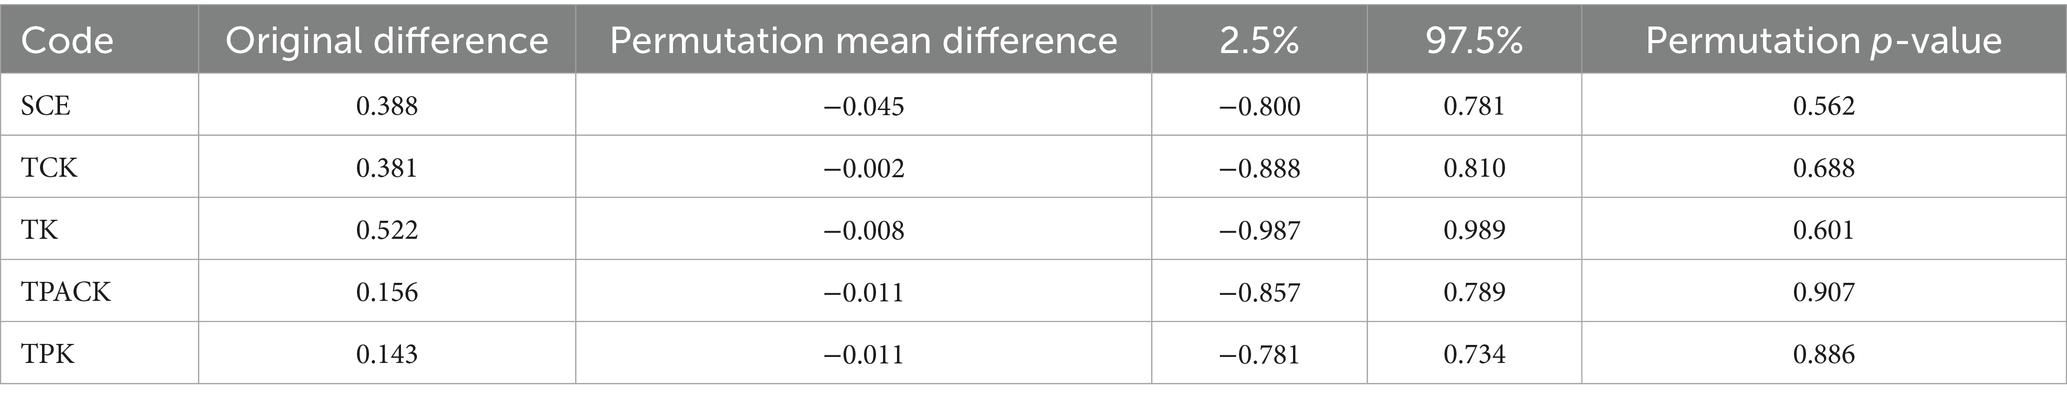
Table 14. Third step MICOM: equal variance results.
4.3 Multi-group analysis
As measurement invariance is established, Multi-Group Analysis (MGA) is applied to examine the group comparisons. In Henseler’s MGA and permutation tests, a 5% significance level of p-value indicates a significant difference between groups in the specific path model (Henseler et al., 2016). The results of MGA are shown in Table 15. From the results, two out of five relationships were statistically different between Group 1AV (without MIS integration) and Group 1BV (with MIS integration). Two of the relationships are as follows: (1) relationships between TCK and TPACK and (2) relationships between TPK and TPACK. The p-value of these relationships is less than 0.05, which is 0.037 and 0.016, respectively.
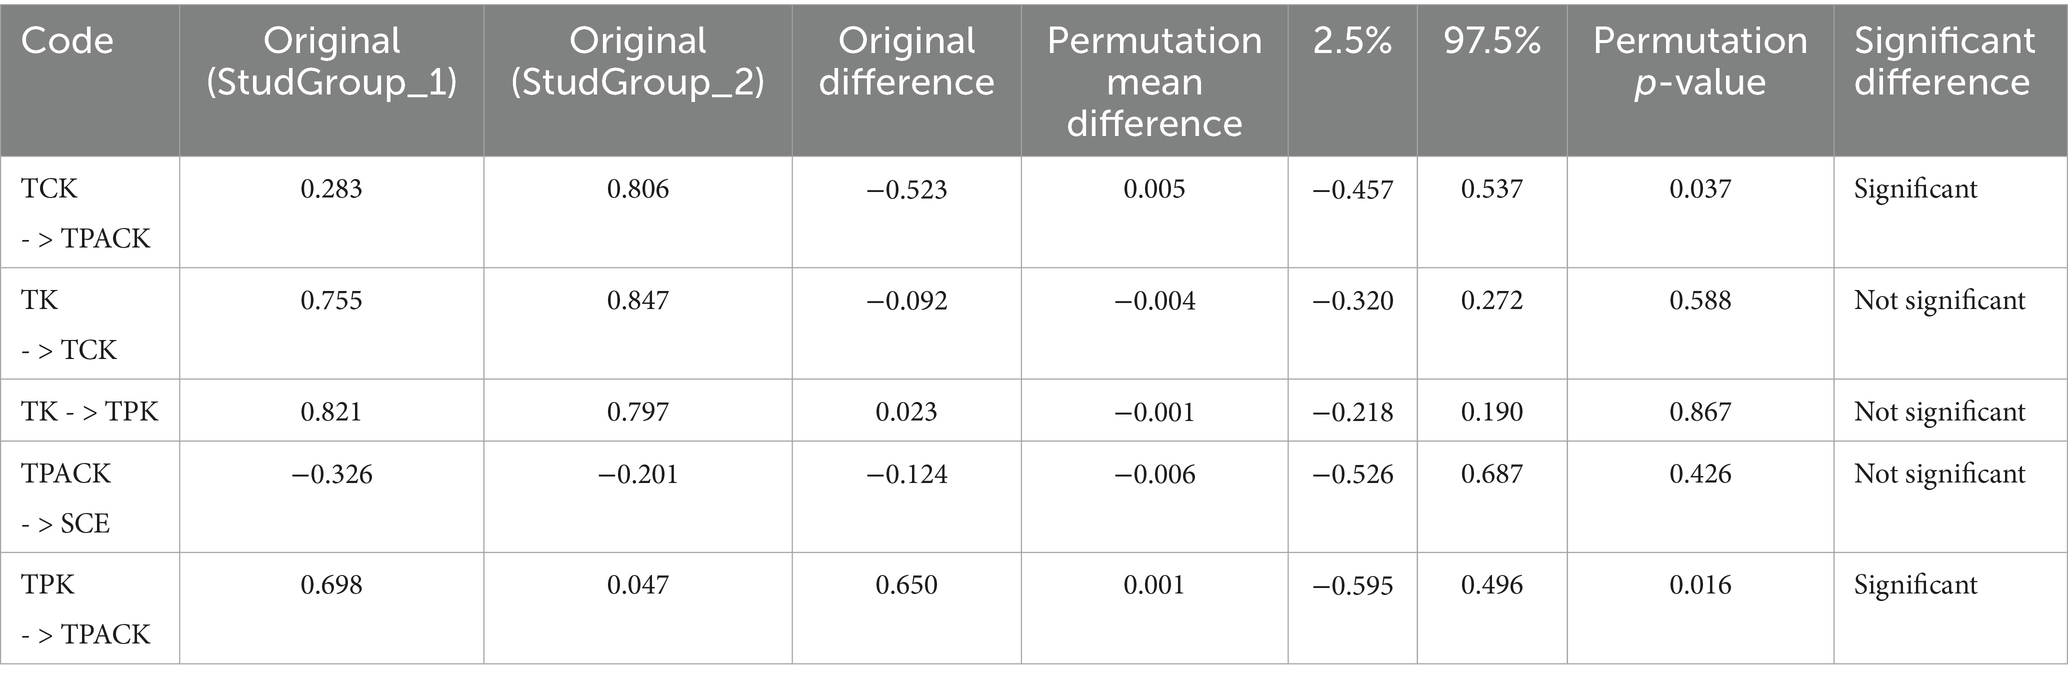
Table 15. Permutation MGA results.
To gain more in-depth group-specific differences, bootstrap multigroup analysis is applied through SmartPLS. The MGA results are shown in Table 16, indicating that the path coefficients of the relationships between TCK and TPACK, and TPK and TPACK are significant, with a p-value of 0.030 and 0.013, respectively. In addition, the Welch-Satterhwaite test shows similar results in Table 17. In other words, these results suggest that the MIS integration in the virtual classroom environment places more emphasis on a teacher’s proficiency in using specific technology to enhance teaching and learning, enhancing content delivery by introducing new means for students to learn and engage.
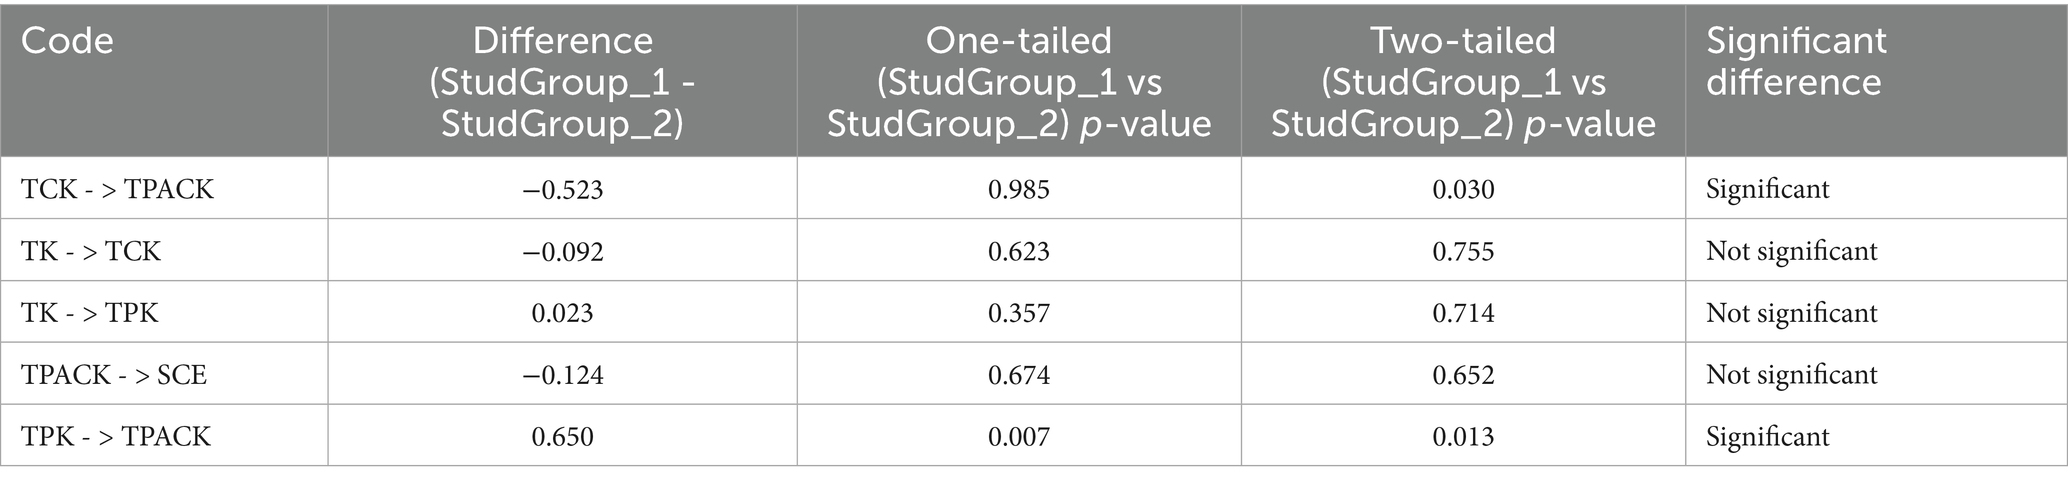
Table 16. Bootstrap MGA results.
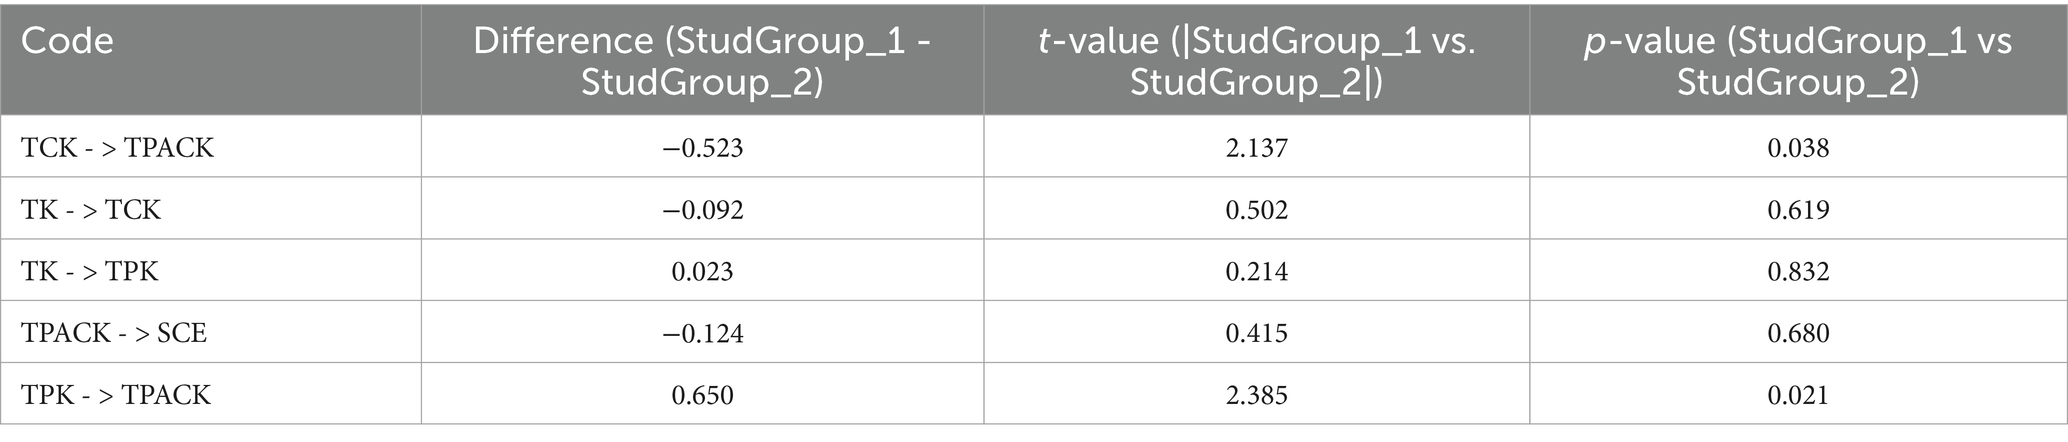
Table 17. Welch-Satterthwaite test results.
4.4 Predictive accuracy, relevance, and effect size
In terms of predictive accuracy, the structural model was examined using R2, the coefficient of determination. The R2 values of the TCK and TPACK are 0.547 and 0.749, respectively, which indicate substantial predictor power (Cohen, 1988). However, the SCE has an R2 value of 0.111, indicating low predictor power. Since the TCK and TPACK show substantial predictor power, an R2 of SCE with at least 0.1 is acceptable (Ozili, 2022). Table 18 shows the R2 values. The f2 value was used to examine the effect size of the framework’s exogenous latent variables. It assesses the strength of the exogenous latent variable in explaining the endogenous latent variable. The classification of effect size strength is as follows: small (f2 = 0.02), medium (f2 = 0.15), and large (f2 = 0.35) (Lorah, 2018). Therefore, the formula’s value of f2 can be calculated as shown in Equation 1, and the f2 results are illustrated in Table 19.
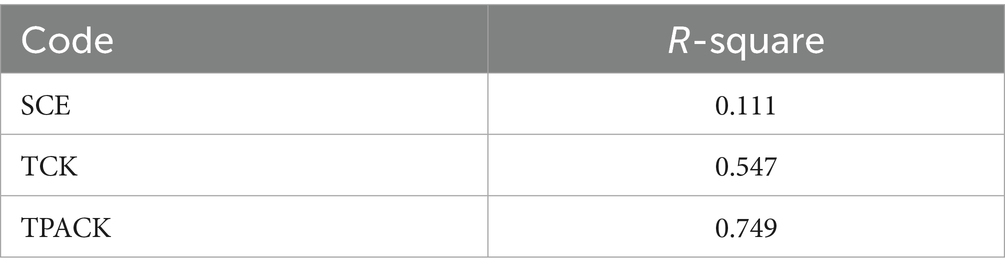
Table 18. R-square values.
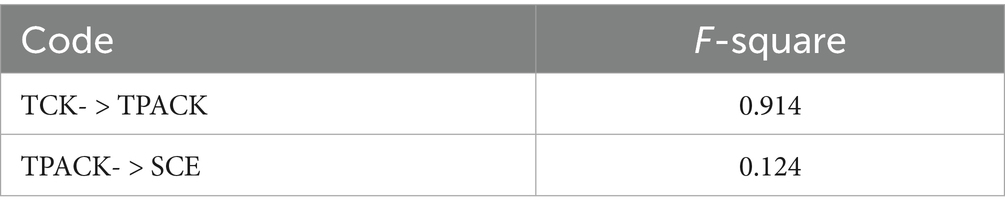
Table 19. F-square results.
Thus, TCK substantially affects TPACK, with an f2 value of 0.914, which exceeds 0.35. Additionally, TPACK has a medium effect size on SCE, with an f2 value of 0.124, which is close to 0.15.
In addition, the Q2 values of the TCK, TPACK, and SCE are 0.475, 0.613, and 0.052, respectively, as shown in Table 20.
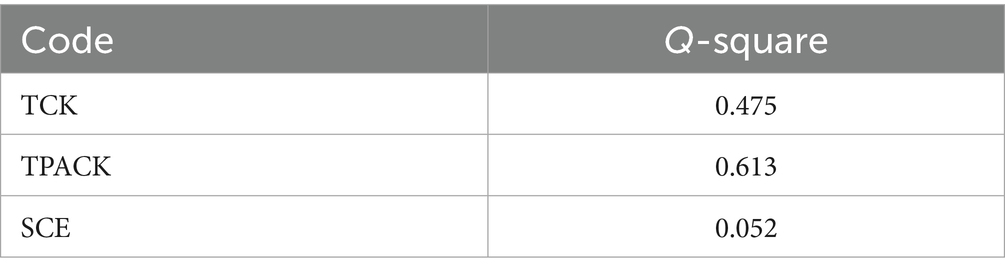
Table 20. Q-square results.
Statistically, considering the predictive accuracy of TPACK-SCE, TCK, and TPACK, all demonstrated significant predictive power, with R2 values of 0.56 and 0.748, respectively. Moreover, the TCK had a substantial effect on TPACK, with an f2 value of 1.011, which is above 0.35. Additionally, TPACK has a medium effect size on SCE, with an f2 value of 0.124, which is close to 0.15. Furthermore, the framework has high predictive relevance for TCK (Q2 = 0.486), TPACK (Q2 = 0.614), and SCE (Q2 = 0.052). Their academic improvement was examined through the difference in scores on pre- and post-knowledge checking tests. Although both groups of students were initially homogeneous, the students who participated in the online class with the proposed MIS integration in teaching scored better on the post-knowledge checking test. Through the paired-samples t-test conducted, the analysis results show that integrating the proposed MIS in teaching can significantly enhance their academic performance. The research thus fulfilled the objectives and answered the research questions.
Therefore, based on Chatelin et al.'s (2002) study, the predictive relevance is substantial if the Q2 is above 0 (Chatelin et al., 2002). Figure 15 illustrates the results of CFA and the structural framework assessment. Despite TK’s significant effect on TPACK, the TPK element was removed from the framework since it had no significant impact.
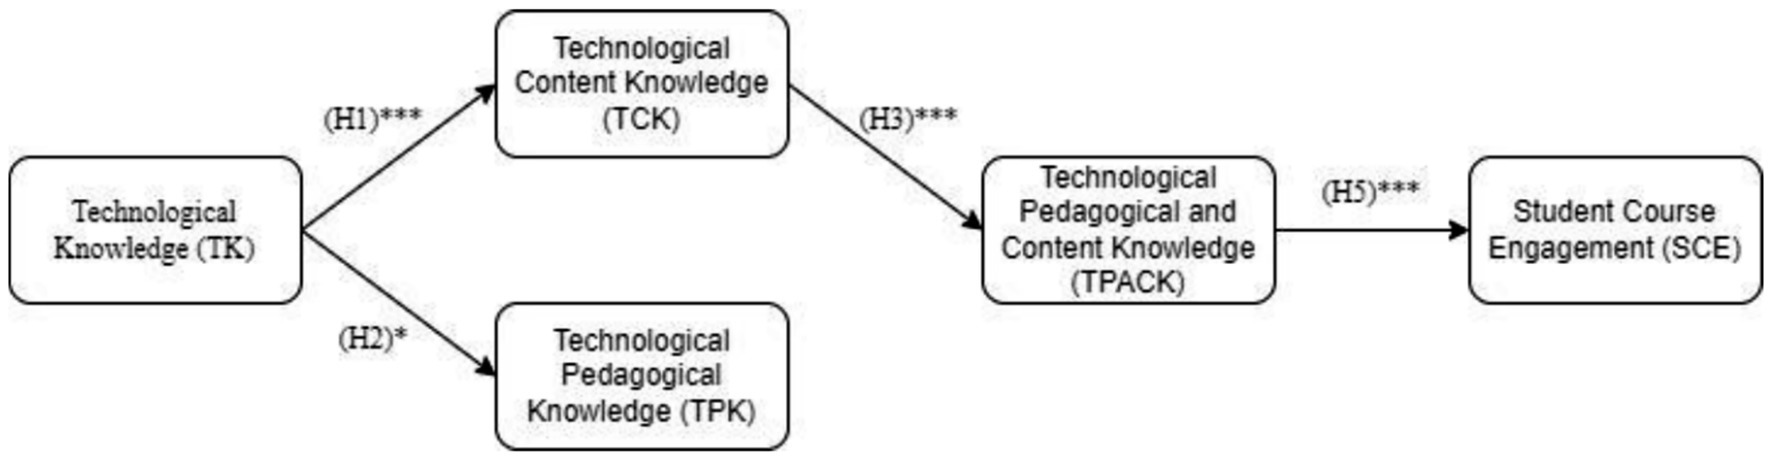
Figure 15. TPACK-SCE framework after measurement and structural analysis. *p < 0.05, **p < 0.01, ***p < 0.001. The line was removed due to the insignificant p-value.
4.5 Effect on teachers’ TPACK proficiency
The instructors had distributed a TPACK survey to the students by the end of the semester. The survey aimed to evaluate whether integrating the proposed MIS in the virtual classroom for online teaching would affect the teachers’ TPACK proficiency. Table 21 presents a comparison of the results between the 1AV and 1BV groups. It indicated that the effect of TCK on TPACK for Group 1AV was insignificant, with a p-value of 0.071. In contrast, the impact of TCK on TPACK for Group 1BV is statistically significant, with a p-value of approximately 0.000. In other words, the teachers from Group 1BV who conducted online classes to integrate the proposed MIS had higher proficiency in TPACK than Group 1AV because the proposed MIS assisted the teachers in terms of content representations in the virtual classroom.
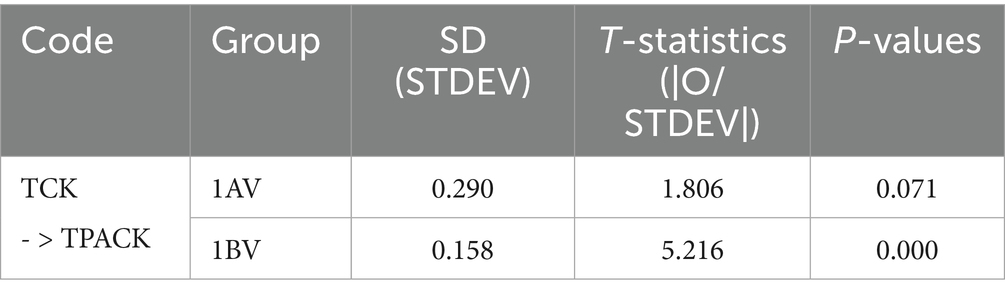
Table 21. Comparison of path coefficient results for teachers’ proficiency in TPACK between two groups.
4.6 Effect on student course engagement
An SCEQ survey was distributed to students at the end of the semester. The survey aimed to determine whether teachers’ proficiency would impact the SCE in TPACK when integrating the proposed MIS in the virtual classroom. Table 22 presents a comparison of the SCE results for the 1AV and 1BV groups. It depicted that the effect of TPACK on SCE for Group 1AV was insignificant, with a p-value of 0.301. In contrast, for Group 1BV, the effect of TPACK on SCE was statistically significant, with a p-value of 0.044. Hence, it showed that integrating the proposed MIS in the virtual classroom positively affected SCE.
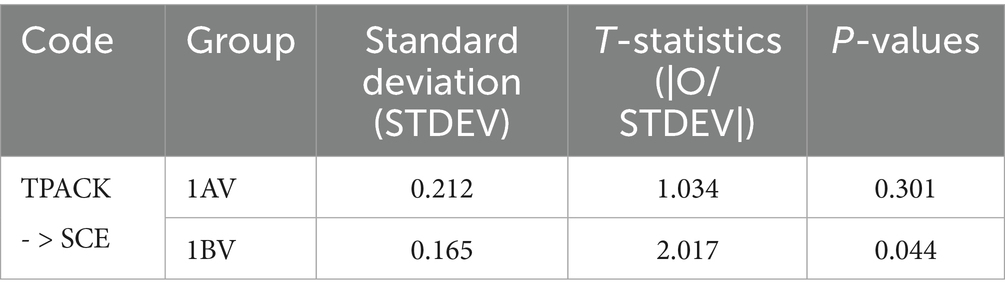
Table 22. Comparison of path coefficient results for student course engagement between two groups.
4.7 Effect on respondents’ academic performance
A post-knowledge checking test was distributed to the students at the end of the semester. The test is intended to evaluate whether integrating MIS into the virtual classroom would affect the students’ academic performance. All the respondents were required to complete the test. Table 23 presents the results of the students’ academic performance. The post-knowledge test mean score of 1AV is 3.806, whereas the 1BV’s mean score is 7.097. The difference in means score between 1AV and 1BV indicates a huge performance boost observed with the MIS integration in the virtual classroom environment. The paired-samples t-test results indicated that integrating the proposed MIS improved the students in Group 1BV academically. The paired-samples t-test’s p-value is statistically significant, with a value of approximately 0.000. The students from 1AV, who did not have the proposed MIS integrated into their virtual classroom lessons, did not show statistically significant academic improvement. The p-value for the paired-samples t-test result of 1AV is 0.088. Additionally, Table 24 presents the paired-sample t-test results comparing the pre-knowledge and post-knowledge check scores for 1AV and 1BV. The results indicate that 1BV (group with MIS integration) improved exceptionally, with Cohen’s d = 1.291, signifying a large effect size. Thus, the proposed MIS, used as a complementary teaching tool in the virtual classroom, positively influenced students’ academic performance.
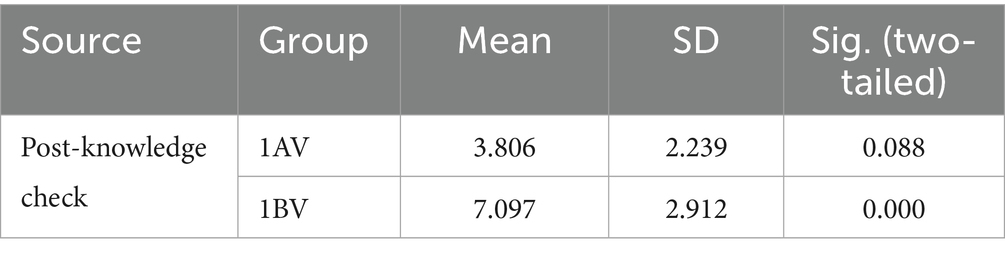
Table 23. Paired-sample t-test for 1AV and 1BV.
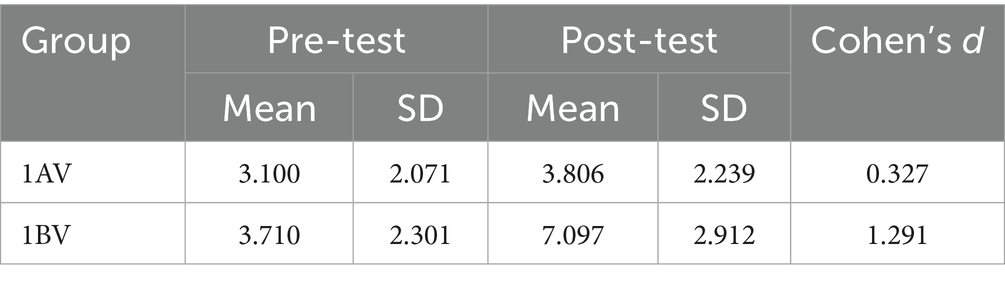
Table 24. Paired-sample t-test results comparing pre-knowledge check and post-knowledge check scores of 1AV and 1BV.
5 Implication of study
The current research extends the existing studies of the TPACK framework by experimenting with and validating the involvement of SCE with the merging of SCEQ into the framework. Therefore, current research has enriched the literature by demonstrating that technology integration has a positive influence on SCE in the virtual classroom. Moreover, the findings of the current research contribute to the existing literature on technology integration and enhance students’ academic performance. Furthermore, this research also extends the study of TPACK by incorporating SCEQ, highlighting the different critical domains that are the focus in the virtual classroom. In addition, the study results from the students’ perspective indicated that teachers’ technological and content knowledge proficiency could enhance student academic performance. It also confirmed that the nature of education varies in different environments. The conventional beliefs and concepts in education, where pedagogy is the key, are not applicable in the virtual classroom environment. Additionally, teachers’ technology proficiency and content delivery quality carry a higher weight in the virtual classroom than pedagogy and mutual engagement.
In terms of practical implications for academic curriculum planners, teachers, and academic institutions, the results convey some valuable insights and a more in-depth understanding of technology integration in the virtual classroom from SCE and academic performance perspectives. People often perpetuate the misconception that the newest technology is always the best for academic institutions to stay on trend. Therefore, this research suggested that a dedicated technology with a low learning curve, serving specific functionalities, is preferred. This research helps curb the overwhelming technology selection issue and saves unnecessary time in adapting to unfamiliar technology. In terms of academic institutions that wish to preserve online classes as an alternative, current research can serve as fundamental technology integration in the virtual classroom for online classes. Additionally, current research suggests that online classes should focus on presenting the subject’s content. Based on the findings of the current research, teachers’ proficiency in TPACK—specifically in technological and content knowledge and its derived subdomains—was crucial for effective technology integration in the virtual classroom. With the help and support of dedicated technology, students can significantly enhance their academic performance. This research also shows that SCE is noticeable through teachers’ high proficiency in TPACK. Overall, the proposed MIS, as dedicated technology integration in the virtual classroom, enhances teachers’ proficiency in TPACK and technology integration, and improves students’ academic performance and SCE.
6 Limitations of study
In this research, several limitations are noticeable and require further consideration and assessment. First, one of the most significant limitations of this research is the small sample size of participants who participated in the experiment. Due to the sample size constraint, the results may not accurately represent the overall population, which could affect the validity of the results. Additionally, the experiment participants were all from the same university and faculty. Furthermore, this research experiment was conducted exclusively through the virtual classroom. Hence, the results and findings may not be representative of the online class phenomenon. Applying the same technology in the physical class does not directly reflect the results. Therefore, the direct application may not be feasible and raises doubts, as it is questionable from the aspects of the student’s academic performance, SCE, and the proficiency of technology integration, which is referred to in this context. Moreover, this research focused solely on the development of one dedicated technology to facilitate technology integration. Notably, the experiment of the current research was conducted in a non-random assignment manner with a single instructor, limiting the variations in results and possibilities. The survey instruments adopted in the current research were modified according to the current research requirements and needs; therefore, they might not be the perfect fit for all nations across the globe due to culture differences.
7 Future recommendation
Since the current research only involved experiment participants from the same university and faculty, having sets of participants from different demographic backgrounds can enhance the experiment results and produce different outcomes, providing more valuable insights. Hence, a larger sample of participants with varied demographic backgrounds is recommended to provide results and findings with greater accuracy and a smaller margin of error. Consequently, future research has to be more versatile when experimenting. Thus, the results will be more precise in addressing the core of technology integration in education, providing better insights and explanations about the relationship between technology integration and SCE. In addition, future studies can be more feasible for developing various techniques of different natures. On top of that, considering additional constructs and factors that would likely contribute to enhancing the explanatory power and the strength of the relationships related to SCE. It helps provide a more in-depth explanation of the low SCE R2 by comparing results side by side. Therefore, the gathered results and findings can be valuable for future educational technology development. In addition, the current research findings are geographically restricted to Malaysian educational institutions. However, the experiment conducted in this research only involved a virtual classroom environment. Neighboring countries such as Thailand and Indonesia might find this research feasible for their virtual lessons’ implementation and practicability.
8 Conclusion
The research study examined the proficiency of technology integration in the virtual classroom for higher education by introducing a proposed MIS in online teaching as a complementary tool. Additionally, the research examined teachers’ proficiency in integrating technology into their teaching by introducing the TPACK-SCE framework, which builds upon the adoption of the TPACK framework and SCEQ. The framework addresses three significant issues: the lack of SCE in the virtual classroom, the ineffectiveness of technology integrated into pedagogy and low teacher self-proficiency in technology because of the steep learning curve. According to prior studies, the teachers were mainly more proficient and confident in the related pedagogical elements of the TPACK framework. Those might be the case for teaching in the physical classroom environment. This research suggested otherwise, where content-related elements are more vital in online classes conducted in virtual classrooms. Moreover, teachers often felt confused about selecting a more suitable choice of education technology, given the freedom to choose. Therefore, there was only one option of technology integrated into this research to mitigate the chance of inappropriately integrating technology into teaching. Furthermore, the findings of this research indicated that the proposed MIS could improve SCE. The predictive accuracy, relevance and effect size results of TPACK-SCE demonstrated that enhancing teachers’ proficiency in TCK has a notable impact on their TPACK proficiency. The TCK and TPACK proficiency also affect the SCE. In other words, teachers’ TCK proficiency could raise their TPACK proficiency and SCE. However, for the student’s academic performance, it has a very significant effect on improving it. All in all, this research provides fresh insights into the possibility of enhancing engagement in the virtual classroom and teachers’ proficiency in integrating dedicated technology into their teaching.
Data availability statement
The data analyzed in this study are subject to the following licenses/restrictions: containing information that could compromise the privacy of research participants. Requests to access these datasets should be directed to ZGFuaWVsbGFpOTMxN0BnbWFpbC5jb20=.
Ethics statement
This study involving human participants was conducted in accordance with the ethical guidelines set forth by the University, as approved by the Technology Transfer Office of Multimedia University (Ethical Approval Number: EA0732021). Written informed consent was obtained from all participants. Personal data were kept confidential and were used solely for the purposes of this study.
Author contributions
DL: Writing – original draft. SL: Writing – review & editing. SO: Writing – review & editing.
Funding
The author(s) declare that financial support was received for the research and/or publication of this article. This research was funded by the MMU GRA under Project SAP ID: MMUI/220155.
Conflict of interest
The authors declare that the research was conducted in the absence of any commercial or financial relationships that could be construed as a potential conflict of interest.
The handling editor TL declared a shared parent affiliation with the author(s) at the time of review.
Generative AI statement
The authors declare that no Gen AI was used in the creation of this manuscript.
Any alternative text (alt text) provided alongside figures in this article has been generated by Frontiers with the support of artificial intelligence and reasonable efforts have been made to ensure accuracy, including review by the authors wherever possible. If you identify any issues, please contact us.
Publisher’s note
All claims expressed in this article are solely those of the authors and do not necessarily represent those of their affiliated organizations, or those of the publisher, the editors and the reviewers. Any product that may be evaluated in this article, or claim that may be made by its manufacturer, is not guaranteed or endorsed by the publisher.
Supplementary material
The Supplementary material for this article can be found online at: https://www.frontiersin.org/articles/10.3389/fcomp.2025.1662386/full#supplementary-material
References
Aldosari, A. M., Alramthi, S. M., and Eid, H. F. (2022). Improving social presence in online higher education: using live virtual classroom to confront learning challenges during COVID-19 pandemic. Front. Psychol. 13:994403. doi: 10.3389/fpsyg.2022.994403
Ali, W. (2020). Online and remote learning in higher education institutes: a necessity in light of COVID-19 pandemic. High. Educ. Stud. 10, 1–16. doi: 10.5539/hes.v10n3p16
Alieto, E., Abequibel-Encarnacion, B., Estigoy, E., Balasa, K., Eijansantos, A., and Torres-Toukoumidis, A. (2024). Teaching inside a digital classroom: A quantitative analysis of attitude, technological competence and access among teachers across subject disciplines. Heliyon. 10. doi: 10.1016/j.heliyon.2024.e24282
Al-Obaydi, L. H., Shakki, F., Tawafak, R. M., Pikhart, M., and Ugla, R. L. (2023). What I know, what I want to know, what I learned: activating EFL college students’ cognitive, behavioral, and emotional engagement through structured feedback in an online environment. Front. Psychol. 13:1083673. doi: 10.3389/fpsyg.2022.1083673
Antony, M. K., Pradana, S. P., Ramadhan, A. N., Dewiyeti, S., and Amri, I. (2025). Exploring the integration of TPACK in post-pandemic biology education: a study of teachers in Magelang City. BIOPENDIX 12, 25–36. doi: 10.30598/biopendixvol12issue1page25-36
Basilaia, G., and Kvavadze, D. (2020). Transition to online education in schools during a SARS-CoV-2 coronavirus (COVID-19) pandemic in Georgia. Pedagog. Res. 5, 1–9. doi: 10.29333/pr/7937
Bond, M., Buntins, K., Bedenlier, S., Zawacki-Richter, O., and Kerres, M. (2020). Mapping research in student engagement and educational technology in higher education: a systematic evidence map. Int. J. Educ. Technol. High. Educ. 17, 1–30. doi: 10.1186/s41239-019-0176-8
Bossman, A., and Agyei, S. K. (2022). Technology and instructor dimensions, e-learning satisfaction, and academic performance of distance students in Ghana. Heliyon 8:e09200. doi: 10.1016/j.heliyon.2022.e09200
Castelli, F. R., and Sarvary, M. A. (2021). Why students do not turn on their video cameras during online classes and an equitable and inclusive plan to encourage them to do so. Ecol. Evol. 11. doi: 10.1002/ece3.7123
Cayubit, R. F. O. (2022). Why learning environment matters? An analysis on how the learning environment influences the academic motivation, learning strategies and engagement of college students. Learn. Environ. Res. 25, 581–599. doi: 10.1007/s10984-021-09382-x
Chatelin, Y.-M., Esposito, V., and Tenenhaus, M. (2002) State-of-art on PLS path modeling through the available software. I de E France. Available online at: https://ideas.repec.org/p/ebg/heccah/0764.html
Cohen, J. (1988). “Statistical power analysis for the behavioural sciences” in Statistical power anaylsis for the behavioral sciences. ed. j. cohen. 2nd ed. Hillsdale, NJ: Lawrence Erlbaum Associates, Publishers.
Dash, S., Samadder, S., Srivastava, A., Meena, R., and Ranjan, P. (2022). Review of online teaching platforms in the current period of COVID-19 pandemic. Indian J. Surg. 84, 12–17. doi: 10.1007/s12262-021-02962-4
Gefen, D., Straub, D., and Boudreau, M.-C. (2000). Structural equation modeling and regression: guidelines for research practice. Communications of the Association for Information Systems. doi: 10.17705/1cais.00407
Gold, A. H., Malhotra, A., and Segars, A. H. (2001). Knowledge management: an organizational capabilities perspective. J. Manag. Inf. Syst. 18, 185–214. doi: 10.1080/07421222.2001.11045669
Habibi, A., Yusop, F. D., and Razak, R. A. (2020). The role of TPACK in affecting pre-service language teachers’ ICT integration during teaching practices: Indonesian context. Educ. Inf. Technol. 25, 1929–1949. doi: 10.1007/s10639-019-10040-2
Hair, J. F., Sarstedt, M., Ringle, C. M., and Gudergan, S. P. (2021). Advanced issues in partial least squares structural equation modeling (PLS-SEM). Thousand Oaks, CA: Sage Publications Inc., 4.
Hair, J., Hult, G. T. M., Ringle, C. M., and Sarstedt, M. (2017). A primer on partial Least Square structural equation modelling (PLS-SEM). J. Chem. Inf. Model. 53.
Handelsman, M. M., Briggs, W. L., Sullivan, N., and Towler, A. (2005). A measure of college student course engagement. J. Educ. Res. 98, 184–192. doi: 10.3200/JOER.98.3.184-192
Henseler, J., Ringle, C. M., and Sarstedt, M. (2016). Testing measurement invariance of composites using partial least squares. Int. Mark. Rev. 33, 405–431. doi: 10.1108/IMR-09-2014-0304
Henseler, J., Ringle, C. M., and Sarstedt, M. (2015). A new criterion for assessing discriminant validity in variance-based structural equation modeling. J. of the Acad. Mark. Sci. 43, 115–135. doi: 10.1007/s11747-014-0403-8
Heraty, C., Mac an Bhaird, C., McGlinchey, A., Mulligan, P., O’Hanrahan, P., O’Malley, J., et al. (2021). Technological explorations in the move to online mathematics support. MSOR Connect. 19, 55–62. doi: 10.21100/msor.v19i1.1130
Jahangir, R., Sultana, Z., Mohim, N. S., Islam, M. T., Kamal, M., Islam, I., et al. (2024). “Identifying design guidelines of interactive whiteboard interfaces through usability evaluation” in Advances in design and digital communication IV. DIGICOM 2023. Springer series in design and innovation, eds. N. Martins and D. Brandão (Cham: Springer) vol. 35. doi: 10.1007/978-3-031-47281-7_8
Khan, R. A., Atta, K., Sajjad, M., and Jawaid, M. (2021). Twelve tips to enhance student engagement in synchronous online teaching and learning. Med. Teach. 44, 601–606. doi: 10.1080/0142159X.2021.1912310
Khanal, B., and Chhetri, D. B. (2024). A pilot study approach to assessing the reliability and validity of relevancy and efficacy survey scale. Janabhawana Res. J. 3, 35–49. doi: 10.3126/jrj.v3i1.68384
Kosiol, T., and Ufer, S. (2024). Teachers’ self-reported and actual content-related TPACK – new results on their relation and gender differences. Comput. Educ. Open 7:100205. doi: 10.1016/j.caeo.2024.100205
Lai, D., Lew, S. L., and Ooi, S. Y. (2022a). “Modified TPACK framework for teachers’ efficiency, students’ performance and students’ engagement” in Proceedings of sixth international congress on information and communication technology. Lecture notes in networks and systems, vol. 235. eds. X. S. Yang, S. Sherratt, N. Dey, and A. Joshi (Singapore: Springer). doi: 10.1007/978-981-16-2377-6_76
Lai, D., Lew, S., and Ooi, S. (2022b). Mobile interactive system in virtual classroom based on TPACK: a study from students’ perspectives. J. Logist. Inform. Serv. Sci. 9. doi: 10.33168/LISS.2022.0312
Lai, D., Lew, S.-L., and Ooi, S. Y. (2024). Collaborative learning management system with analytical insights: a preliminary study. J. Int. Financ. Manag. Account. 5, 136–151. doi: 10.33093/ijomfa.2024.5.1.6
Li, M. (2025). Exploring the digital divide in primary education: a comparative study of urban and rural mathematics teachers’ TPACK and attitudes towards technology integration in post-pandemic China. Educ. Inf. Technol. 30, 1913–1945. doi: 10.1007/s10639-024-12890-x
Lorah, J. (2018). Effect size measures for multilevel models: definition, interpretation, and TIMSS example. Large Scale Assess. Educ. 6:8. doi: 10.1186/s40536-018-0061-2
Mohammad Hisham, A. N., Sailun, A. S., and Mohamed, S. (2021). Student engagementy level in online learning: the new normal. Selangor Hum. Rev. 4, 278–290.
Mokoena, M. M., Simelane-Mnisi, S., and Mji, A. (2022). Challenges and solutions for teachers’ use of interactive whiteboards in high schools. Universal J. Educ. Res. 10, 36–47. doi: 10.13189/ujer.2022.100104
Molero Jurado, M. d. M., Simón Márquez, M. d. M., Martos Martínez, Á., Barragán Martín, A. B., Pérez-Fuentes, M. d. C., and Gázquez Linares, J. J. (2022). Qualitative analysis of use of ICTs and necessary personal competencies (self-efficacy, creativity and emotional intelligence) of future teachers: implications for education. Sustainability 14:12257. doi: 10.3390/su141912257
Naiker, M., Wakeling, L., Cook, S., Peck, B., Johnson, J. B., and Brown, S. (2022). Student engagement amongst regional australian undergraduate students. J. Scholarsh. Teach. Learn. 22. doi: 10.14434/josotl.v22i3.31688
Nasir, M. A. M., Janikowski, T., Guyker, W., and Wang, C. C. (2020). Modifying the student course engagement questionnaire for use with online courses. J. Educ. Online 17.
Noor, U., Younas, M., Saleh Aldayel, H., Menhas, R., and Qingyu, X. (2022). Learning behavior, digital platforms for learning and its impact on university student’s motivations and knowledge development. Front. Psychol. 13:933974. doi: 10.3389/fpsyg.2022.933974
Nur Fitria, T. (2023). Students’ problems in online learning: what happened to the students in English class during pandemic Covid-19? J. English Lang. Learn. 7, 334–345. doi: 10.31949/jell.v7i1.5768
Oraif, I., and Elyas, T. (2021). The impact of COVID-19 on learning: investigating EFL learners’ engagement in online courses in Saudi Arabia. Educ. Sci. 11:99. doi: 10.3390/educsci11030099
Ozili, P. K. (2022). The acceptable R-square in empirical modelling for social science research. Social Research Methodology and Publishing Results. SSRN Electron. J. doi: 10.2139/ssrn.4128165
Pacey, A., and Bray, F. (2021). Technology in World Civilization: a thousand-year history (revised and expanded edition) (revised). Cambridge, MA: MIT Press. doi: 10.7551/mitpress/11467.001.0001
Prakasha, G. S., Kumar, P., and Srilakshmi, R. (2023). Student engagement in online learning during COVID-19. J. E Learn. Knowl. Soc. 19, 1–12. doi: 10.20368/1971-8829/1135500
Qureshi, M. A., Khaskheli, A., Qureshi, J. A., Raza, S. A., and Yousufi, S. Q. (2023). Factors affecting students’ learning performance through collaborative learning and engagement. Interact. Learn. Environ. 31, 2371–2391. doi: 10.1080/10494820.2021.1884886
Rai, S. (2020). Improving method of instruction in classrooms. 2020 9th IEEE Integrated STEM Education Conference, ISEC 2020. doi: 10.1109/ISEC49744.2020.9280661
Shi, Y., Zhang, J., Yang, H., and Yang, H. H. (2023). “Effects of interactive whiteboard-based classroom instruction on students’ cognitive learning outcomes: a meta-analysis” in Personalized learning. United Kingdom: Taylor & Francis Group, 104–121.
Taber, K. S. (2018). The use of Cronbach’s alpha when developing and reporting research instruments in science education. Res. Sci. Educ. 48, 1273–1296. doi: 10.1007/s11165-016-9602-2
Taherdoost, H. (2019). What is the best response scale for survey and questionnaire design; review of different lengths of rating scale/attitude scale/Likert scale. Int. J. Acad. Res. Manag. 8, 1–10. Available at: https://hal.science/hal-02557308v1
Uduak, I., and Kasumu, O. R. (2022). The use of interactive whiteboards for teaching and learning in tertiary institutions. Int. J. Trendy Res. Eng. Technol. 6, 28–33. doi: 10.54473/ijtret.2022.6606
Vukovi’c, M. (2024). CB-SEM vs PLS-SEM comparison in estimating the predictors of investment intention. Croat. Oper. Res. Rev. 15, 131–144. doi: 10.17535/crorr.2024.0011
Wong, Z. Y., and Liem, G. A. D. (2022). Student engagement: current state of the construct, conceptual refinement, and future research directions. Educ. Psychol. Rev. 34, 107–138. doi: 10.1007/s10648-021-09628-3
Younas, M., Noor, U., Zhou, X., Menhas, R., and Qingyu, X. (2022). COVID-19, students satisfaction about e-learning and academic achievement: mediating analysis of online influencing factors. Front. Psychol. 13:948061. doi: 10.3389/fpsyg.2022.948061
Keywords: TPACK, student course engagement, technology integration, mobile interactive system, virtual classroom
Citation: Lai D, Lew SL and Ooi SY (2025) Technological pedagogical and content knowledge with student course engagement framework for virtual classroom in Malaysia higher education. Front. Comput. Sci. 7:1662386. doi: 10.3389/fcomp.2025.1662386
Edited by:
Tze Wei Liew, Multimedia University, MalaysiaReviewed by:
Uzma Noor, Soochow University, ChinaKrida Singgih Kuncoro, Universitas Sarjanawiyata Tamansiswa, Indonesia
Copyright © 2025 Lai, Lew and Ooi. This is an open-access article distributed under the terms of the Creative Commons Attribution License (CC BY). The use, distribution or reproduction in other forums is permitted, provided the original author(s) and the copyright owner(s) are credited and that the original publication in this journal is cited, in accordance with accepted academic practice. No use, distribution or reproduction is permitted which does not comply with these terms.
*Correspondence: Sook Ling Lew, c2xsZXdAbW11LmVkdS5teQ==